Regulation of chromatin microphase separation by binding of protein complexes
- Department of Chemical and Biological Physics, Weizmann Institute of Science, Israel
- Department of Molecular Genetics, Weizmann Institute of Science, Israel
Figures
Figure 1
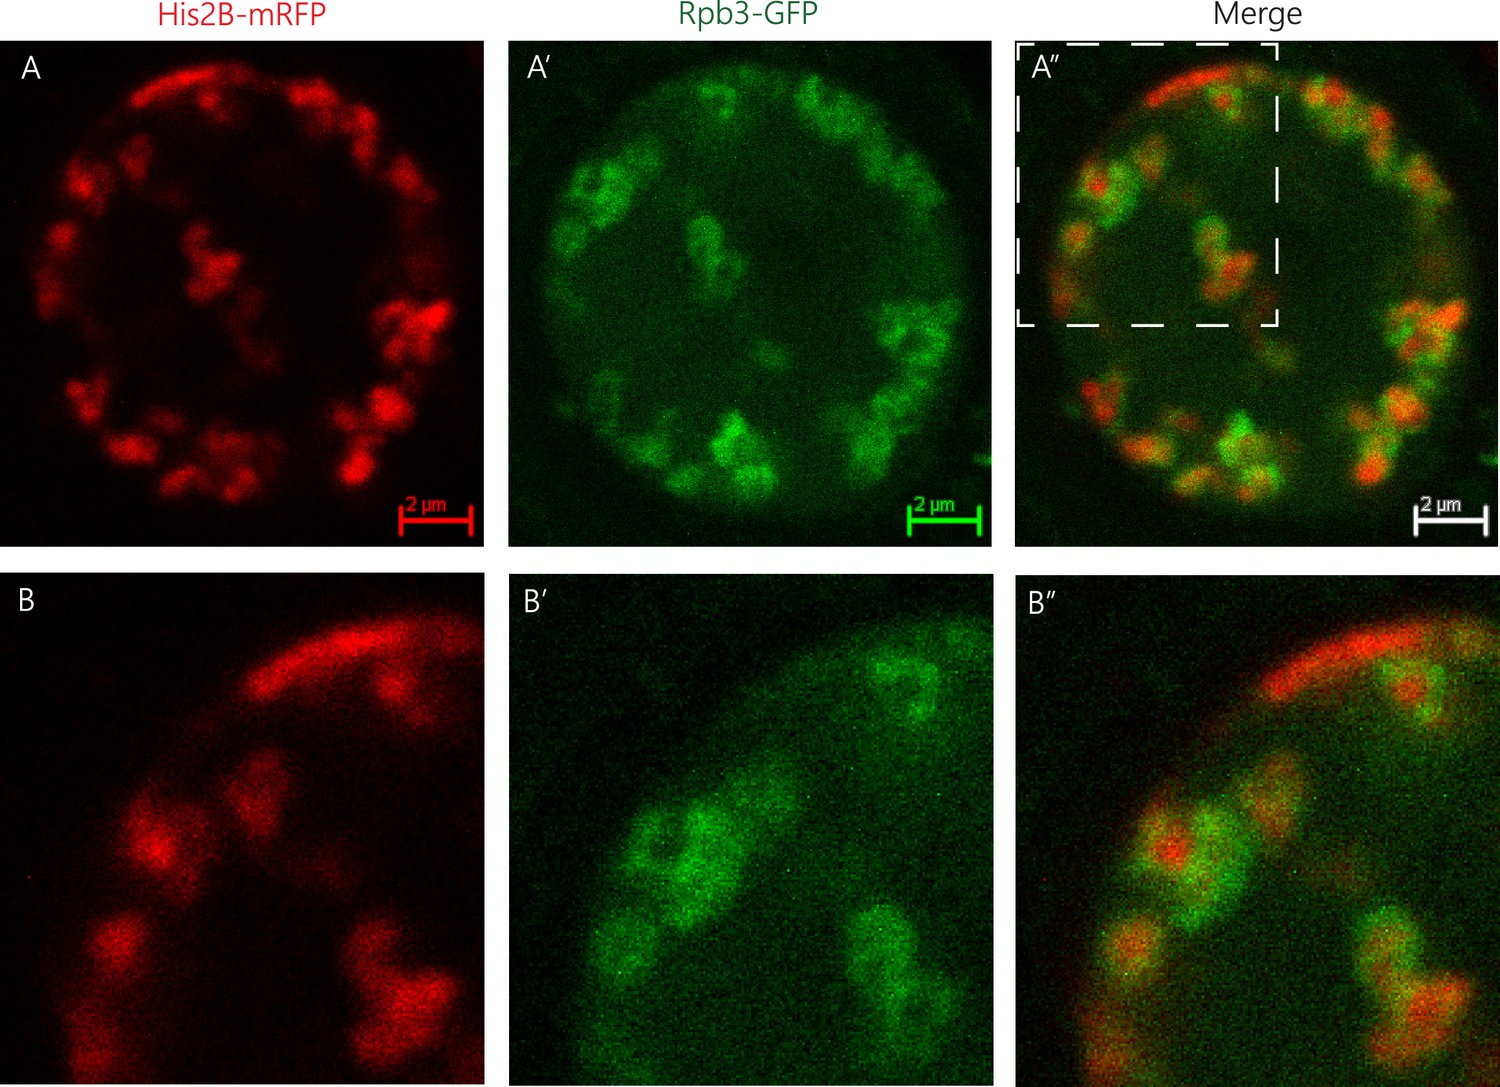
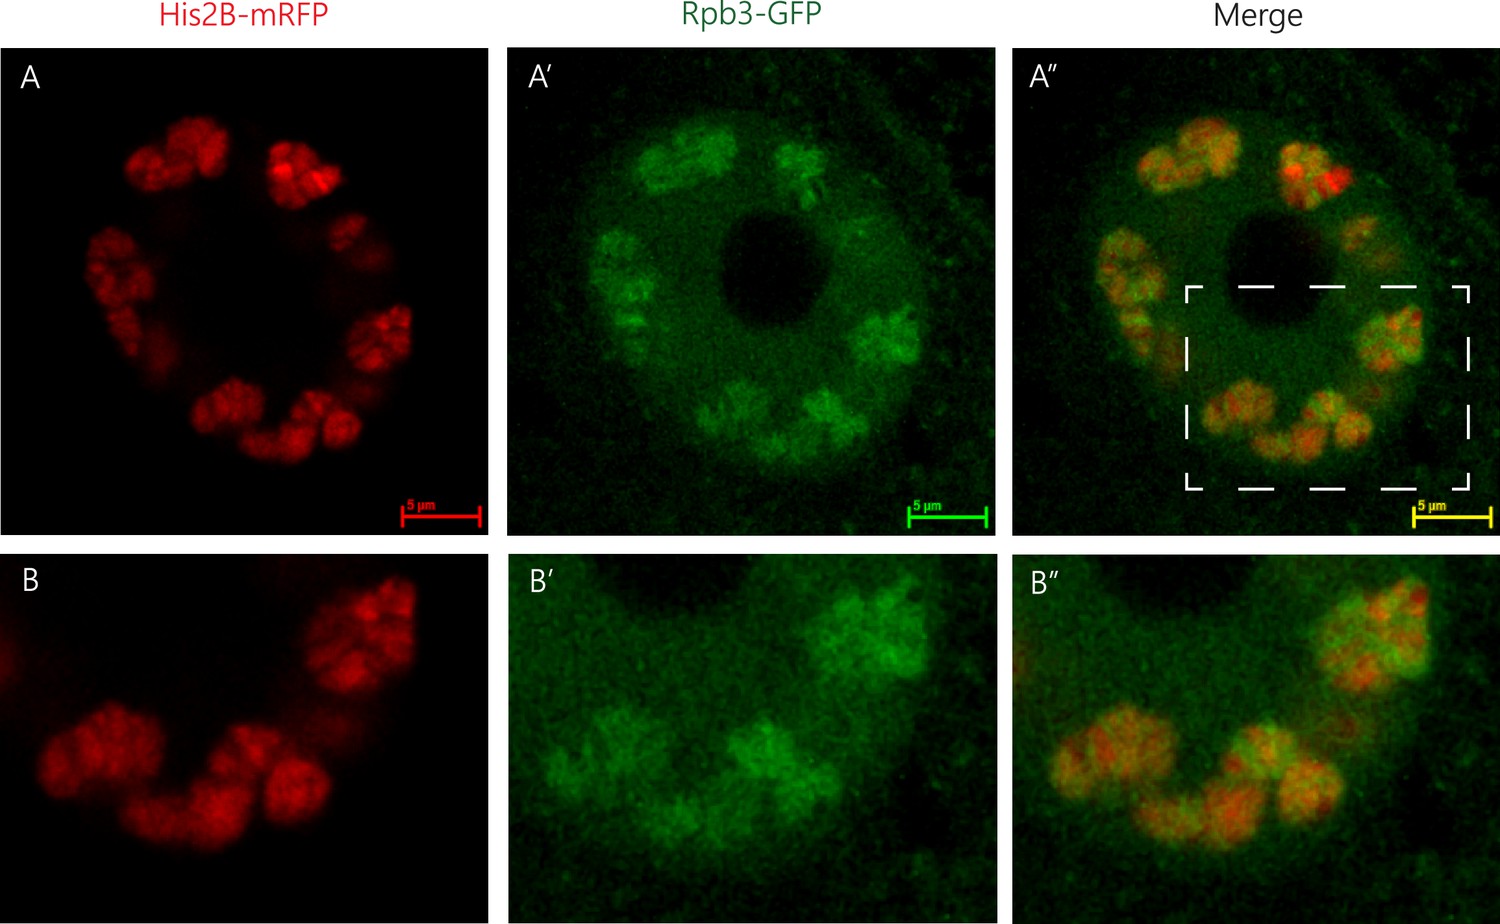
Spatial organization of RNA Pol II and chromatin.
Representative image of a muscle nucleus of live Drosophila third instar larvae labeled with Histone2B-mRFP (A, red, expressed under endogenous promoter) and with Rpb3-GFP (A’, green, expressed in muscles under Mef2-GAL4 driver), and their merged images (A”). B–B” panels are corresponding enlargements of the rectangle area illustrated in A”. Note that the RNA Pol II green signal (Rpb3-GFP), representing transcribed regions, is observed mostly at the circumference of clusters of non-transcribed DNA depicted by the histone2B-associated red signal.
Figure 2
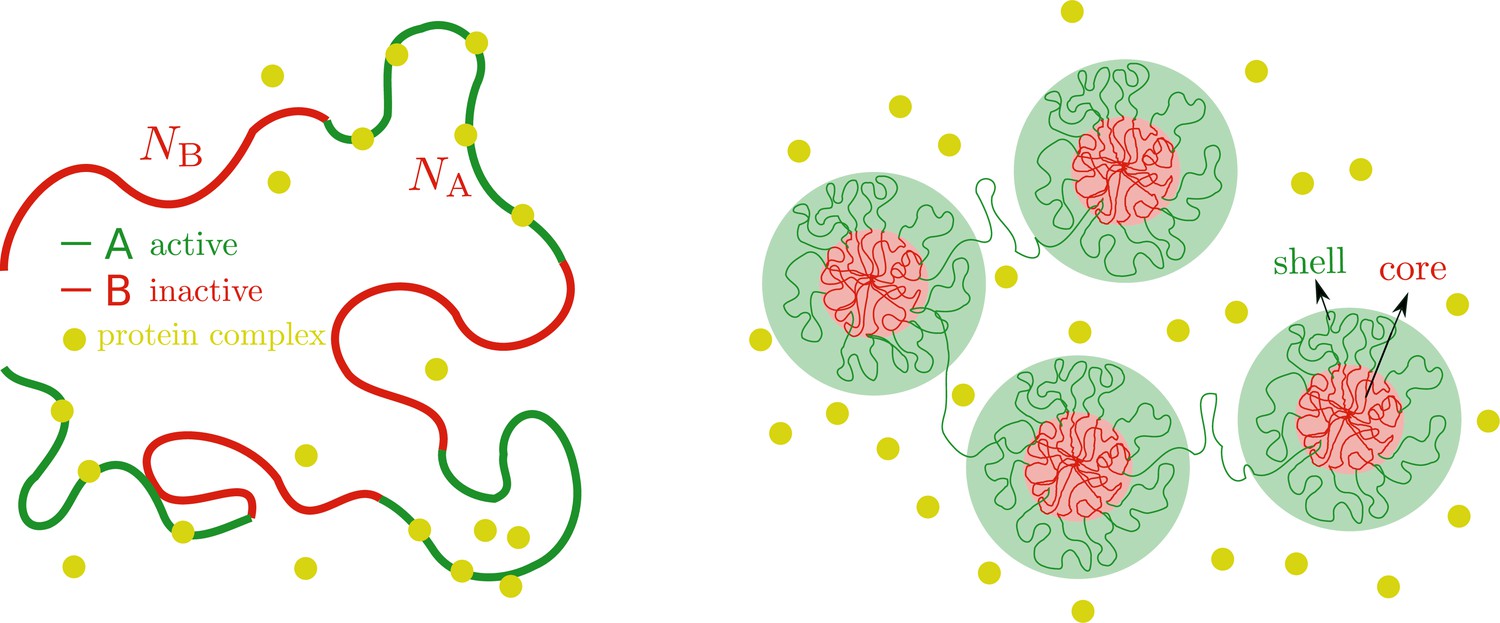
Microphase separation of active and inactive chromatin regions.
Left: Chromatin as a multiblock copolymer with active (green) and inactive blocks (red) comprising and monomers, respectively. Right: Core-shell organization of chromatin. The cores (red area) are composed of condensed, inactive blocks of chromatin and the shells (green area) are composed of active blocks of chromatin that are less condensed that the cores in the absence of chromatin-binding protein complexes that cause them to be even more swollen.
Figure 3

Microphase separation of chromatin in a layer geometry.
The microphase-separated state in the layer geometry is characterized by three regions: The core (red shaded area), which is composed of inactive blocks (red curves) and solvent (not shown), the shell (green shaded area), comprising active blocks (green curves), free and bound protein complexes (yellow circles) and solvent (not shown), and finally the bulk solution (blue shaded area) of protein complexes (yellow circles).
Figure 4
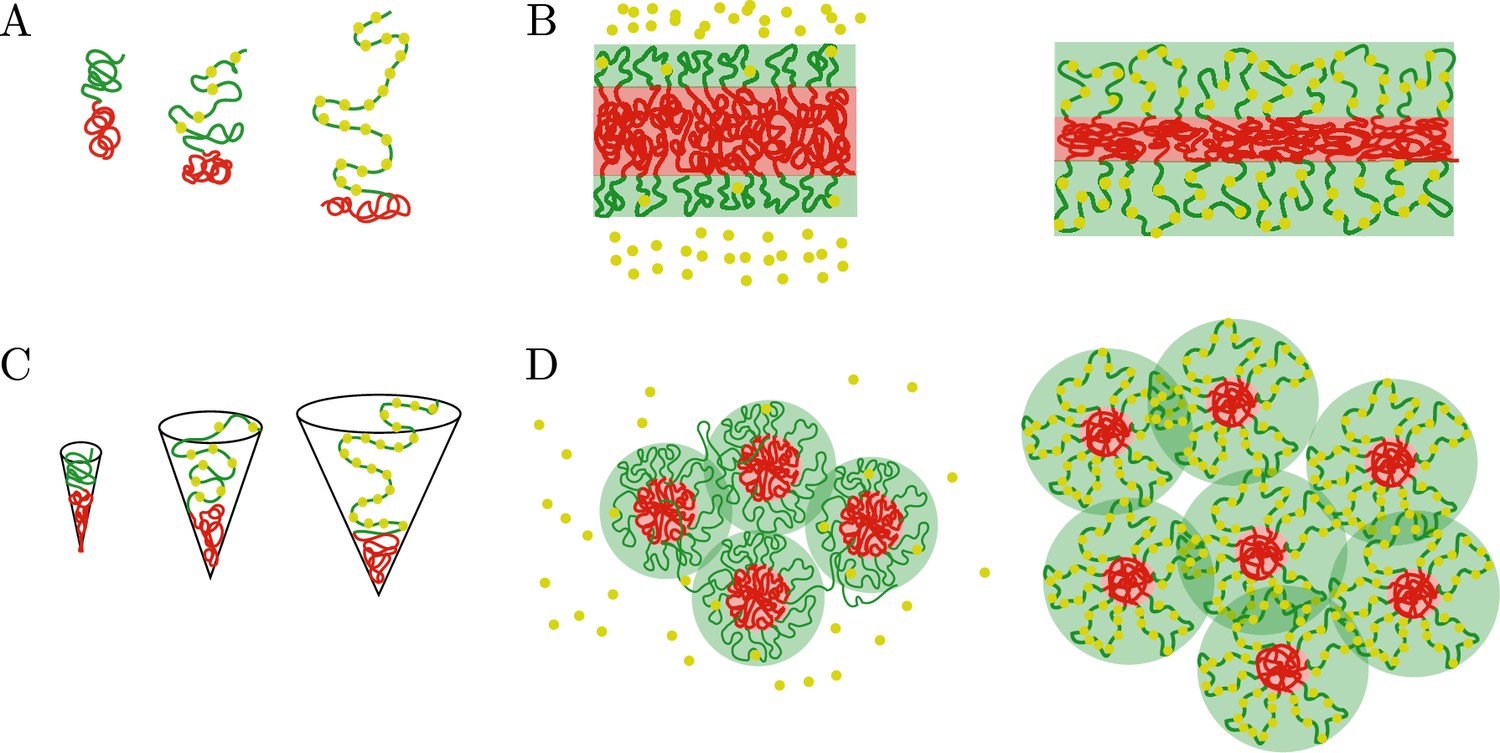
Comparison of the chromatin microphase separation by the binding of protein complexes in layer and spherical geometries.
(A) Single pair of active (green) and inactive blocks (green) in the layer geometry with no (left), few (middle), and many (right) protein complexes bound to a chromatin active block. The swelling of the active block by the binding of protein complexes changes the surface area per block and compresses the inactive blocks. (B) Global changes in the microphase-separated layer geometry. Left: The active shell (green) and inactive core (red) remain unchanged in the absence of bound protein complexes (yellow). Right: Binding of protein complexes leads to swelling of the active shell (green region) and compression of the thickness of the core (red region). (C) Single pair of active (green) and inactive blocks (green) in the spherical geometry with no (left), few (middle), and many (right) protein complexes bound to the active chromatin block. A preferred radius of curvature is set by the binding of protein complexes, such preferred radius of curvature defines the size of the core. (D) Regulation of core number and size by the binding of protein complexes. Left: Weak binding of protein complexes (yellow beads) to active chromatin has little or no effect in the size and number of cores (red area). Right: Strong binding of protein complexes to active chromatin swells the active shells (green area) and increases the number of inactive cores while decreasing their size.
Figure 5
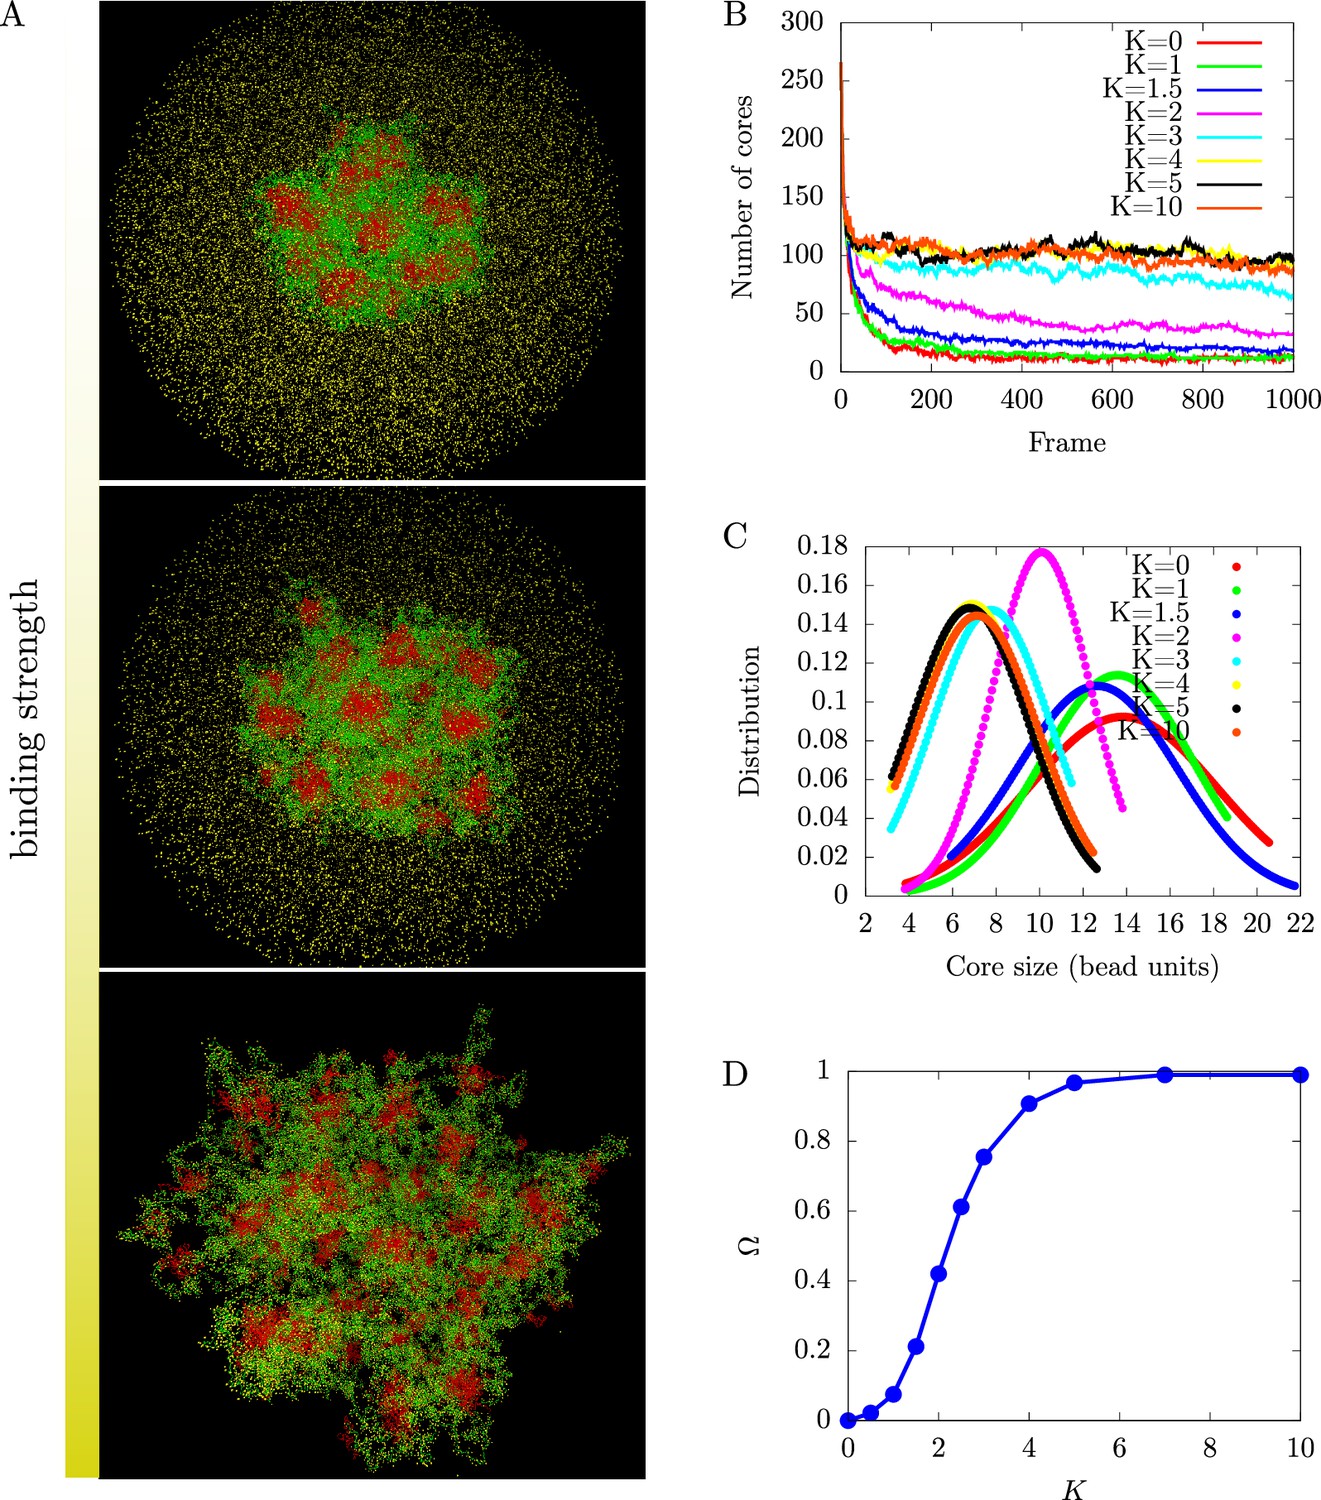
Regulation of chromatin microphase separation by binding of protein complexes.
(A) Simulation snapshots show a core-shell organization of chromatin. The cores (red area) are composed of inactive blocks (red lines) of chromatin, and the shells (green area) are composed of active blocks (green lines) of chromatin. The snapshots from top to bottom correspond to binding of protein complexes (yellow points) to chromatin where deviations of the bond distance from its minimal value are modeled by a harmonic potential with a spring constant (no binding, top), (weak binding, middle), and (strong binding, bottom). (B) Number of cores as a function of the simulation time frame by varying the harmonic potential characterized by of protein complexes. The number of cores increases with increasing bonding strength until it saturates. (C) Core size distributions for different bonding strengths, . (D) Fraction of active monomers bound to a protein complex, , as a function of bonding strengths follows a sigmoidal curve.
Figure 6

Sketch of chromatin microphase separation in confinement.
Left: Weak binding of protein complexes (yellow) to active chromatin (green) results in larger inactive chromatin domains (red) that wet the nuclear envelope (black) as spherical caps. Right: Strong binding of protein complexes to the active chromatin leads to smaller inactive chromatin domains and might also result in changes of their shape going from spherical to cylindrical-like domains. It must be noted that the volume of the inactive domains is conserved in the three-dimensional organization.
Appendix 1—figure 1
Distribution of RNA Pol II in live Drosophila salivary gland epithelium.
The salivary gland in intact live larvae expressing His2B under endogenous promoter (Red), and Rpb3-GFP under Mef2Gal4 driver imaged under the microscope. (A) His2B-RFP representing H2B-associated chromatin, (A’) Rpb3-GFP representing Pol II-associated chromatin, and A” their merged image. (B–B”) are corresponding enlargements of the rectangle in A”.
Tables
Appendix 5—table 1
Characteristics of the flat inactive core and active shell for different regimes effective solvent regime.
The effective second and third virial coefficients are and , respectively. In the table we use the following dimensionless quantities: the extension of the active brush, , the extension of the inactive blocks, , the surface area per block , and the interfacial tension, .
| Poor solvent | Good solvent | Theta solvent |
|---|---|---|
Additional files
Download links
A two-part list of links to download the article, or parts of the article, in various formats.
Downloads (link to download the article as PDF)
Open citations (links to open the citations from this article in various online reference manager services)
Cite this article (links to download the citations from this article in formats compatible with various reference manager tools)
Regulation of chromatin microphase separation by binding of protein complexes
eLife 12:e82983.
https://doi.org/10.7554/eLife.82983


