Polycomb repressive complex 1.1 coordinates homeostatic and emergency myelopoiesis
- Division of Stem Cell and Molecular Medicine, Center for Stem Cell Biology and Regenerative Medicine, The Institute of Medical Science, University of Tokyo, Japan
- Laboratory for Developmental Genetics, RIKEN Center for Integrative Medical Sciences, Japan
- Department of Cellular and Molecular Medicine, Chiba University, Japan
- Department of Stem Cell Biology and Medicine, Kyushu University, Japan
- Division of Clinical Genome Research,Advanced Clinical Research Center, The Institute of Medical Science, University of Tokyo, Japan
- Division of Immunobiology, Research Institute for Biomedical Sciences, Tokyo University of Science, Japan
- Laboratoty of Cellular and Molecular Chemistry, Graduate School of Pharmaceutical Sciences, University of Tokyo, Japan
Figures
Figure 1 with 4 supplements
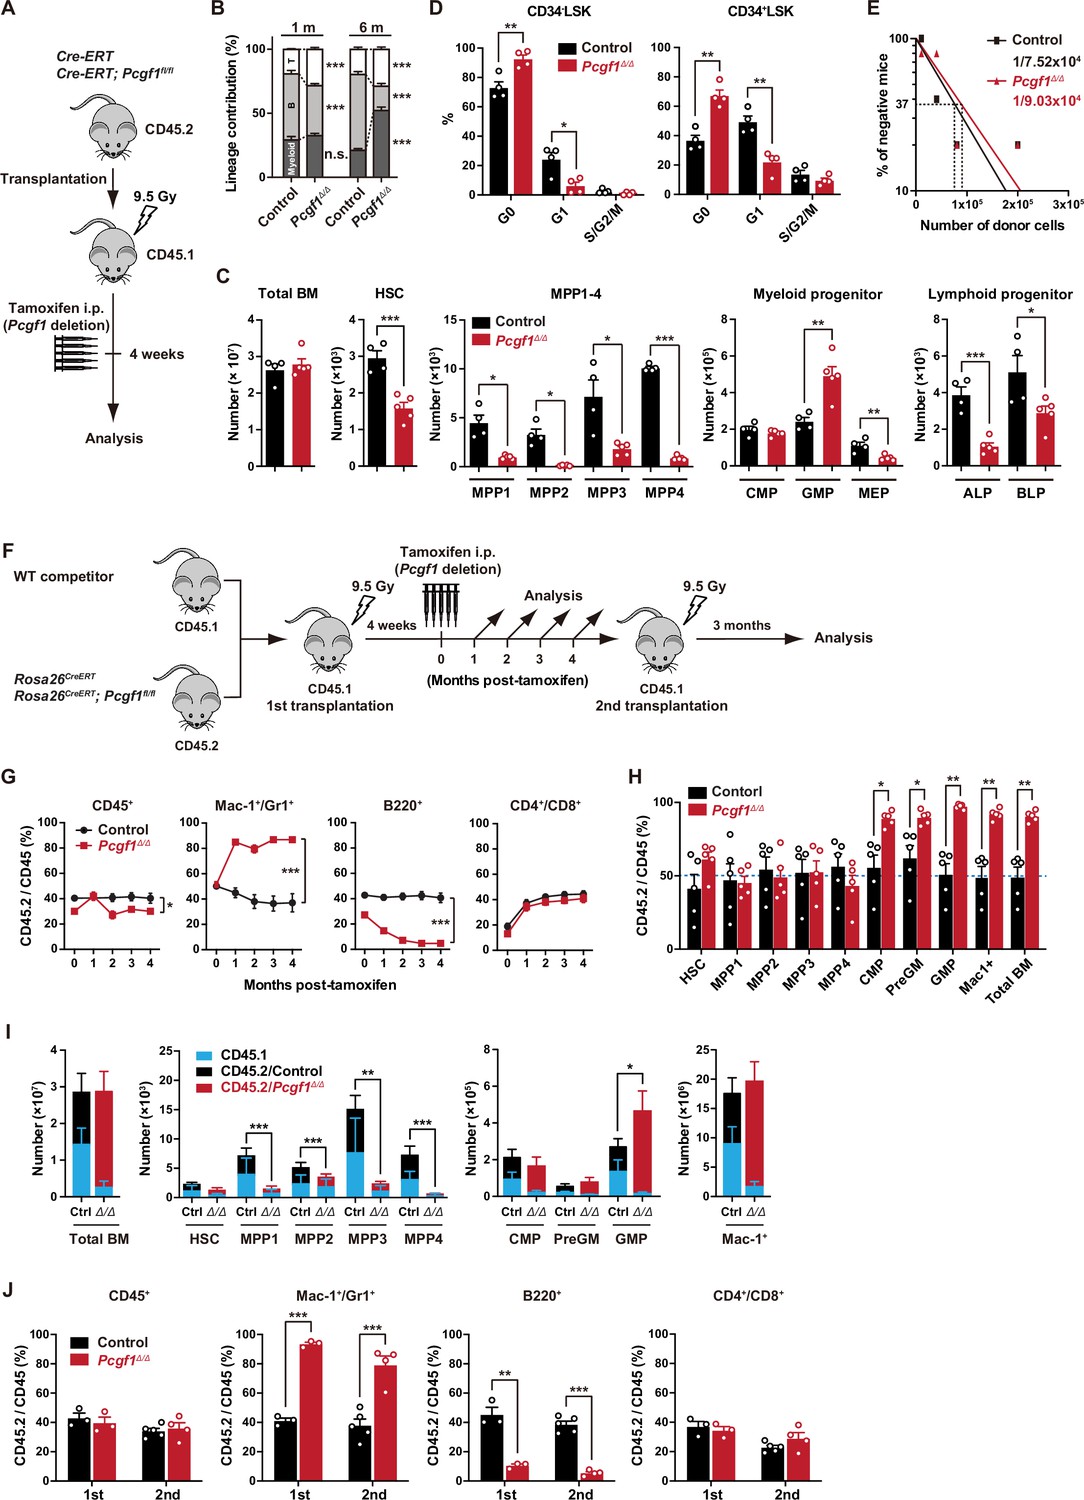
PCGF1 regulates myelopoiesis but not self-renewal of hematopoietic stem and progenitor cells (HSPCs).
(A) Strategy for analyzing Pcgf1Δ/Δ hematopoietic cells. Total bone marrow (BM) cells (5 × 10⁶) from Rosa26CreERT and Rosa26CreERT;Pcgf1fl/fl were transplanted into lethally irradiated CD45.1 recipient mice. Pcgf1 was deleted by intraperitoneal injections of tamoxifen at 4 wk post-transplantation. (B) The proportions of Mac-1+ and/or Gr-1+ myeloid cells, B220+ B cells, and CD4+ or CD8+ T cells among CD45.2+ donor-derived hematopoietic cells in the peripheral blood (PB) from control (n = 9) and Pcgf1Δ/Δ (n = 14) mice. (C) Absolute numbers of total BM cells, hematopoietic stem cells (HSCs), multipotent progenitors (MPPs), myeloid progenitors, and CLPs (ALP and BLP) in a unilateral pair of femur and tibia 4 wk after the tamoxifen injection (n = 4–5). (D) Cell cycle status of CD34–LSK HSCs and CD34+LSK MPPs assessed by Ki67 and 7-AAD staining 4 wk after the tamoxifen injection. (E) In vivo limiting dilution assay. Limiting numbers of BM cells (1 × 10⁴, 4 × 10⁴, 8 × 10⁴, and 2 × 10⁵) isolated from BM of primary recipients (control and Pcgf1Δ/Δ mice after transplantation) were transplanted into sublethally irradiated secondary recipient mice with 2 × 10⁵ of competitor CD45.1 BM cells (n = 5 each). Due to the low contribution of Pcgf1Δ/Δ HSPCs to B cells, mice with chimerism of donor myeloid and T cells more than 1% in the PB at 16 wk after transplantation were considered to be engrafted successfully, and the others were defined as non-engrafted mice. The frequencies of HSPCs that contributed to both myeloid and T cells are indicated. (F) Strategy for analyzing Pcgf1Δ/Δ hematopoietic cells. Total BM cells (2 × 10⁶) from Rosa26CreERT and Rosa26CreERT;Pcgf1fl/fl CD45.2 mice were transplanted into lethally irradiated CD45.1 recipient mice with the same number of competitor CD45.1 BM cells. Pcgf1 was deleted by intraperitoneal injections of tamoxifen at 4 wk post-transplantation. Secondary transplantation was performed using 5 × 10⁶ total BM cells from primary recipients at 4 mo post-intraperitoneal injections of tamoxifen. (G) The chimerism of CD45.2 donor cells in PB CD45+ leukocytes, Mac-1+ and/or Gr1+ myeloid cells, B220+ B cells, and CD4+ or CD8+ T cells in control and Pcgf1Δ/Δ mice (n = 6 each) after the tamoxifen injection. (H) The chimerism of CD45.2 donor-derived cells in BM 4 wk after the tamoxifen injection (n = 5). (I) Absolute numbers of CD45.1 and CD45.2 total BM cells, HSCs, MPPs, myeloid progenitors, and Mac-1+ mature myeloid cells in a unilateral pair of femur and tibia 4 wk after the tamoxifen injection (n = 5). Statistical significance is based on the overall number of cells. (J) The chimerism of CD45.2 donor-derived cells in PB in primary (n = 3 each) and secondary (n = 4–5) transplantation. Data are shown as the mean ± SEM. *p<0.05, **p<0.01, ***p<0.001 by the Student’s t-test. Each symbol is derived from an individual mouse. A representative of more than two independent experiments is shown.
-
Figure 1—source data 1
Raw data for Figure 1.
- https://cdn.elifesciences.org/articles/83004/elife-83004-fig1-data1-v2.zip
Figure 1—figure supplement 1
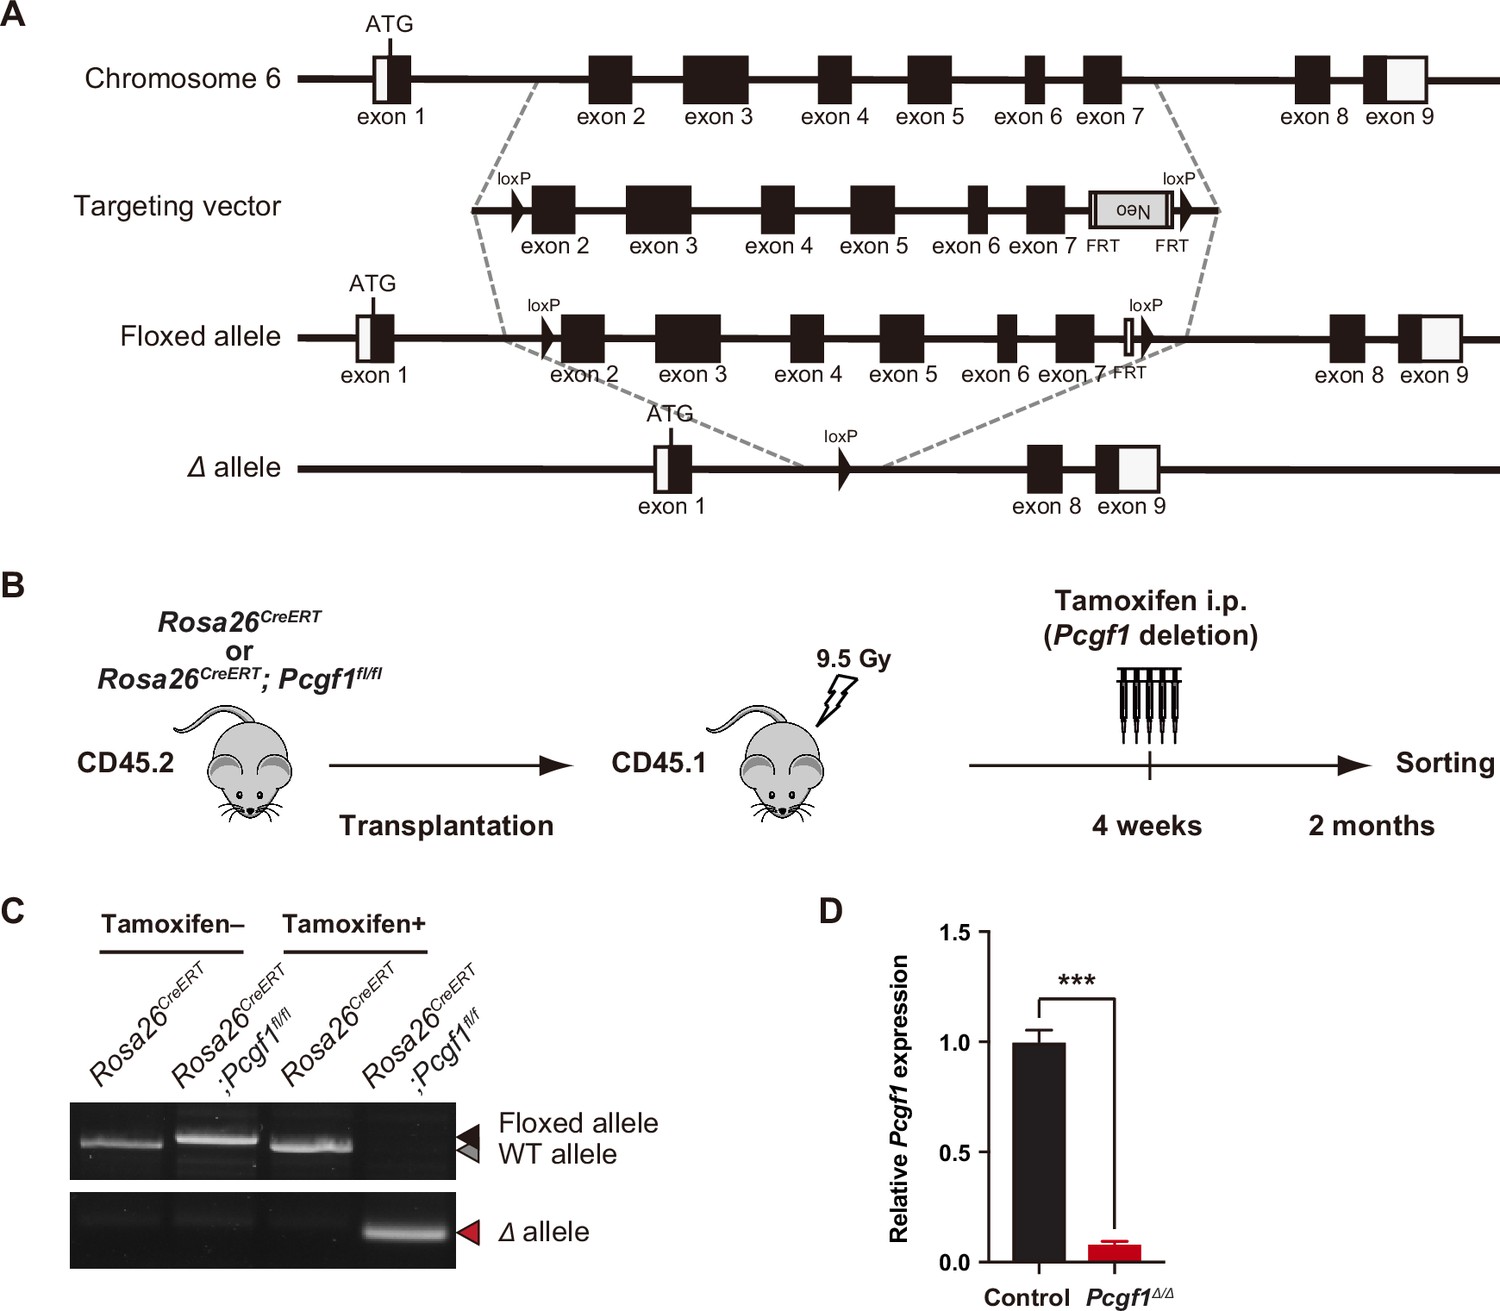
Targeting of the Pcgf1 gene in the mouse hematopoietic system.
(A) Gene targeting strategy for the Pcgf1 gene. (B) Strategy for analyzing hematopoietic cells with conditional knockout alleles for Pcgf1. Total bone marrow (BM) cells from Rosa26CreERT control and Rosa26CreERT;Pcgf1fl/fl CD45.2 mice were transplanted into lethally irradiated CD45.1 recipient mice. After engraftment, Pcgf1 was deleted by intraperitoneal injections of tamoxifen at 4 wk post-transplantation. (C) Efficient deletion of Pcgf1 exons 2–7 detected by genomic PCR in PB CD45.2+ hematopoietic cells from recipient mice repopulated with Rosa26CreERT;Pcgf1fl/fl BM cells 4 wk after the tamoxifen treatment. Floxed, floxed Pcgf1 allele; Δ, floxed Pcgf1 allele after the removal of exons 2–7 by Cre recombinase. (D) Quantitative RT-PCR analysis of Pcgf1 in BM LSK hematopoietic stem and progenitor cell (HSPCs). Hprt1 was used to normalize the amount of input RNA. Data are shown as the mean ± SEM (n = 3). The significance of differences relative to control is shown. ***p<0.001 by the Student’s t-test.
-
Figure 1—figure supplement 1—source data 1
Uncropped gel images of Figure 1—figure supplement 1C.
- https://cdn.elifesciences.org/articles/83004/elife-83004-fig1-figsupp1-data1-v2.zip
-
Figure 1—figure supplement 1—source data 2
Raw data for Figure 1—figure supplement 1.
- https://cdn.elifesciences.org/articles/83004/elife-83004-fig1-figsupp1-data2-v2.zip
Figure 1—figure supplement 2
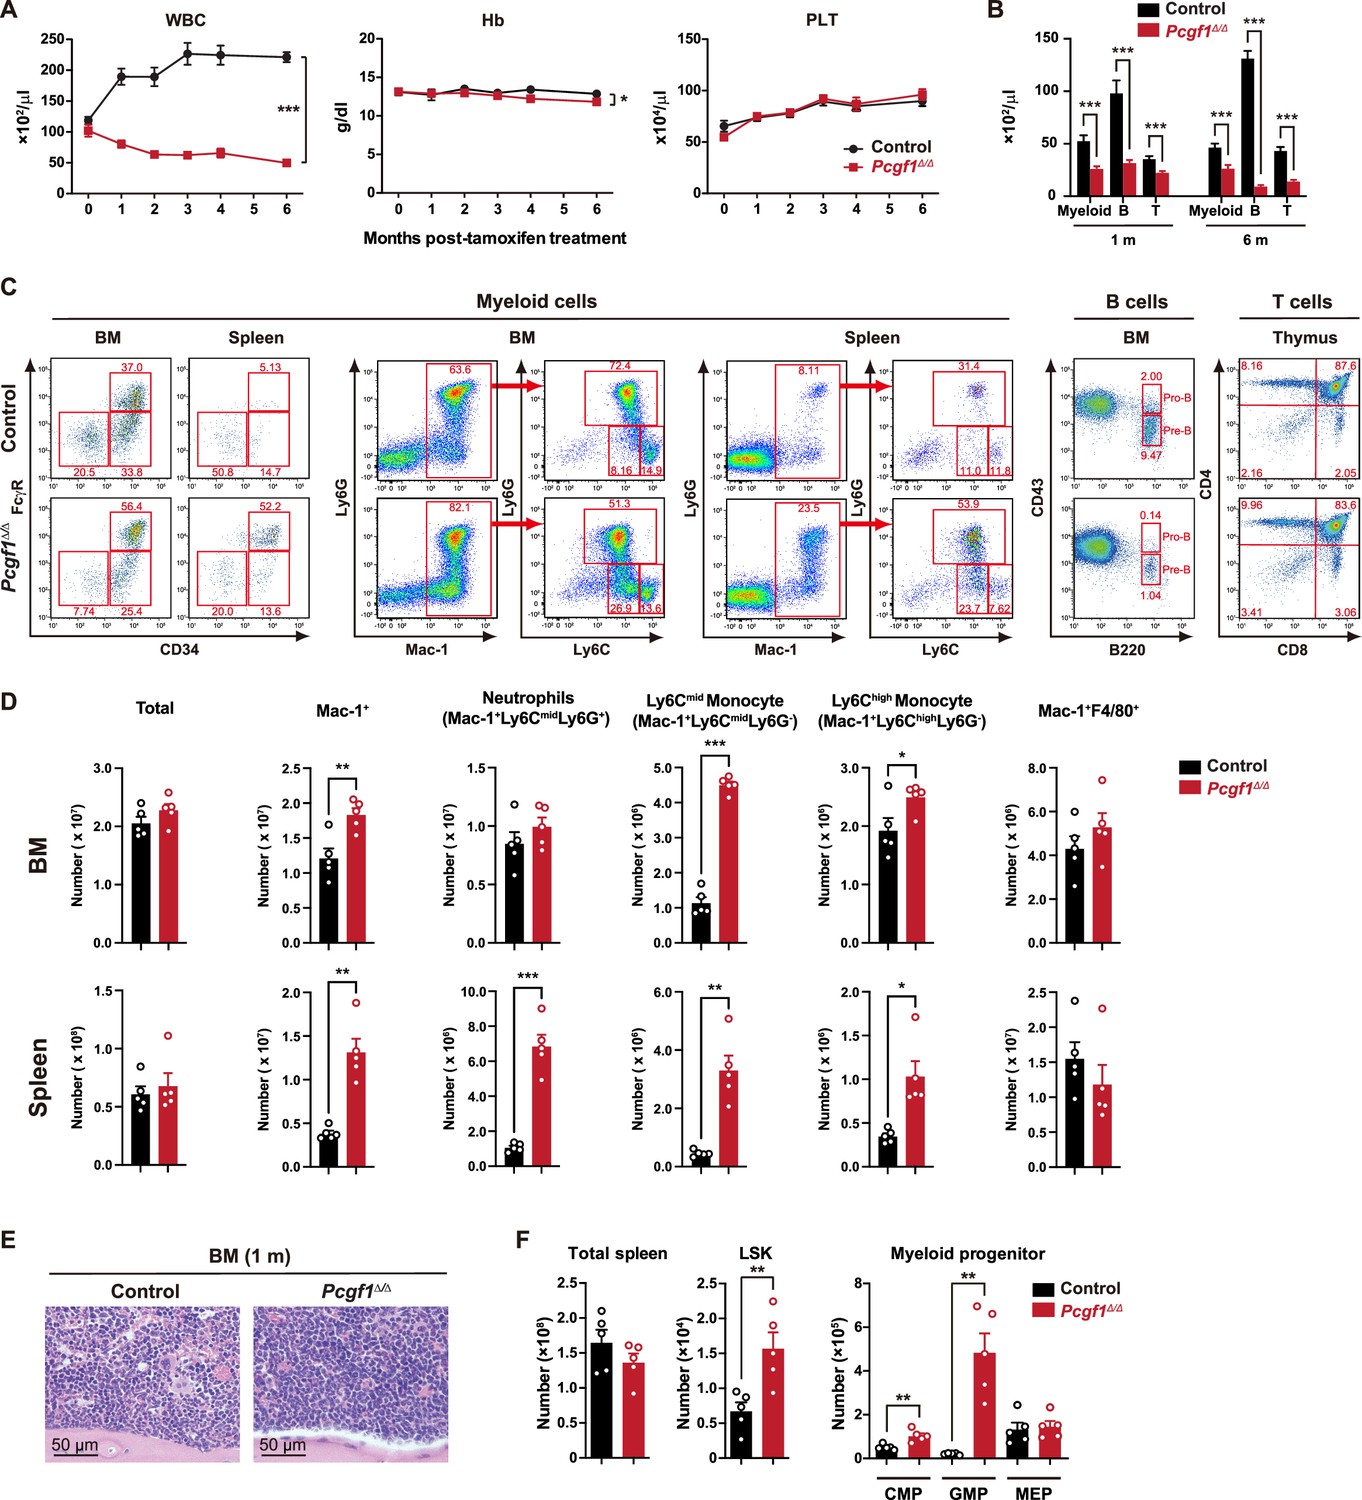
Accumulation of myeloid cells in Pcgf1Δ/Δ mice.
(A) White blood cell (WBC), hemoglobin (Hb), and platelet (PLT) counts in the peripheral blood (PB) from control (n = 9) and Pcgf1Δ/Δ (n = 14) mice. (B) Absolute numbers of Mac-1+ and/or Gr-1+ myeloid cells, B220+ B cells, and CD4+ or CD8+ T cells 1 and 6 mo after the tamoxifen injection. (C) Representative flow cytometric profiles of bone marrow (BM), spleen, and thymus of control and Pcgf1Δ/Δ mice 1 mo after the tamoxifen injection. The percentages of gated populations over parental populations are indicated. (D) Absolute numbers of total cells, Mac1+ myeloid cells, Mac1+Ly6G+ neutrophiles, Mac1+Ly6C+Ly6C– monocytes, and Mac1+F4/80+ macrophages in the BM and spleen (n = 5 each) 1 mo after the tamoxifen injection. (E) Histology of the BM from control and Pcgf1Δ/Δ mice 1 mo after the tamoxifen injection observed by hematoxylin-eosin staining. (F) Absolute numbers of total cells, LSK cells, and myeloid progenitors in the spleen (n = 5 each) 1 mo after the tamoxifen injection. Data are shown as the mean ± SEM. *p<0.05, **p<0.01, ***p<0.001 by the Student’s t-test.
-
Figure 1—figure supplement 2—source data 1
Raw data for Figure 1—figure supplement 2.
- https://cdn.elifesciences.org/articles/83004/elife-83004-fig1-figsupp2-data1-v2.zip
Figure 1—figure supplement 3
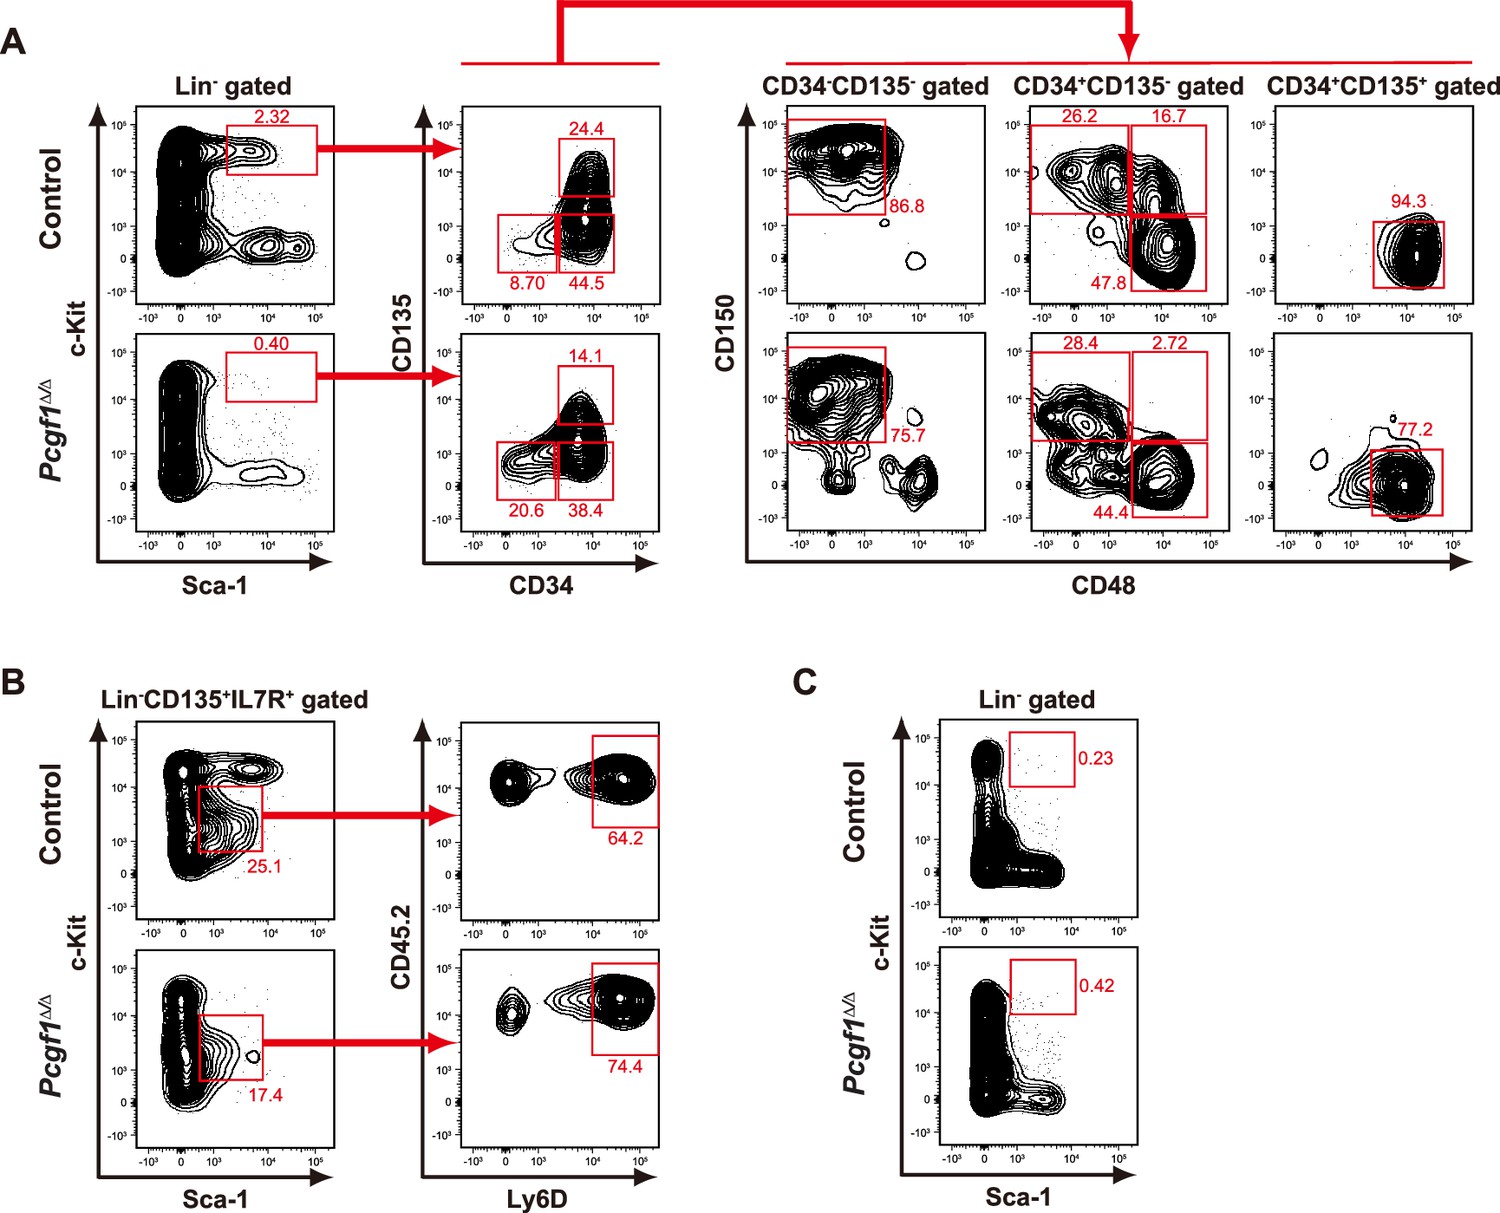
Flow cytometric profiles of Pcgf1Δ/Δ hematopoietic stem and progenitor cells (HSPCs) and lymphoid progenitors.
(A, B) Representative flow cytometric profiles of bone marrow (BM) HSPCs (A) and lymphoid progenitors (B) of control and Pcgf1Δ/Δ mice 1 mo after the tamoxifen injection. (C) Representative flow cytometric profiles of spleen HSPCs of control and Pcgf1Δ/Δ mice 1 mo after the tamoxifen injection. The percentages of gated populations over parental populations are indicated.
Figure 1—figure supplement 4

Growth and differentiation of Pcgf1Δ/Δ hematopoietic stem cells (HSCs) in culture.
(A) Growth of control and Pcgf1Δ/Δ HSCs in culture. Cells were cultured in triplicate under HSC (SCF + TPO) and myeloid (SCF + TPO + IL-3 + GM-CSF) culture conditions (n = 3 each). Data are shown as the mean ± SEM. (B) Limiting dilution assays of B and T cell differentiation. HSCs from control and Pcgf1Δ/Δ mice were cocultured with TSt-4 (B cells) or TSt-4/DLL1 (T cells) stromal cells, and the generation of CD19+ B cells or Thy1.2+ T cells in each well was detected by flow cytometry after 28 d of coculture (n = 8 each). The calculated frequencies are indicated inside of the plots. Data are shown as the mean ± SEM. *p<0.05, **p<0.01, ***p<0.001 by the Student’s t-test.
-
Figure 1—figure supplement 4—source data 1
Raw data for Figure 1—figure supplement 4.
- https://cdn.elifesciences.org/articles/83004/elife-83004-fig1-figsupp4-data1-v2.zip
Figure 2 with 1 supplement
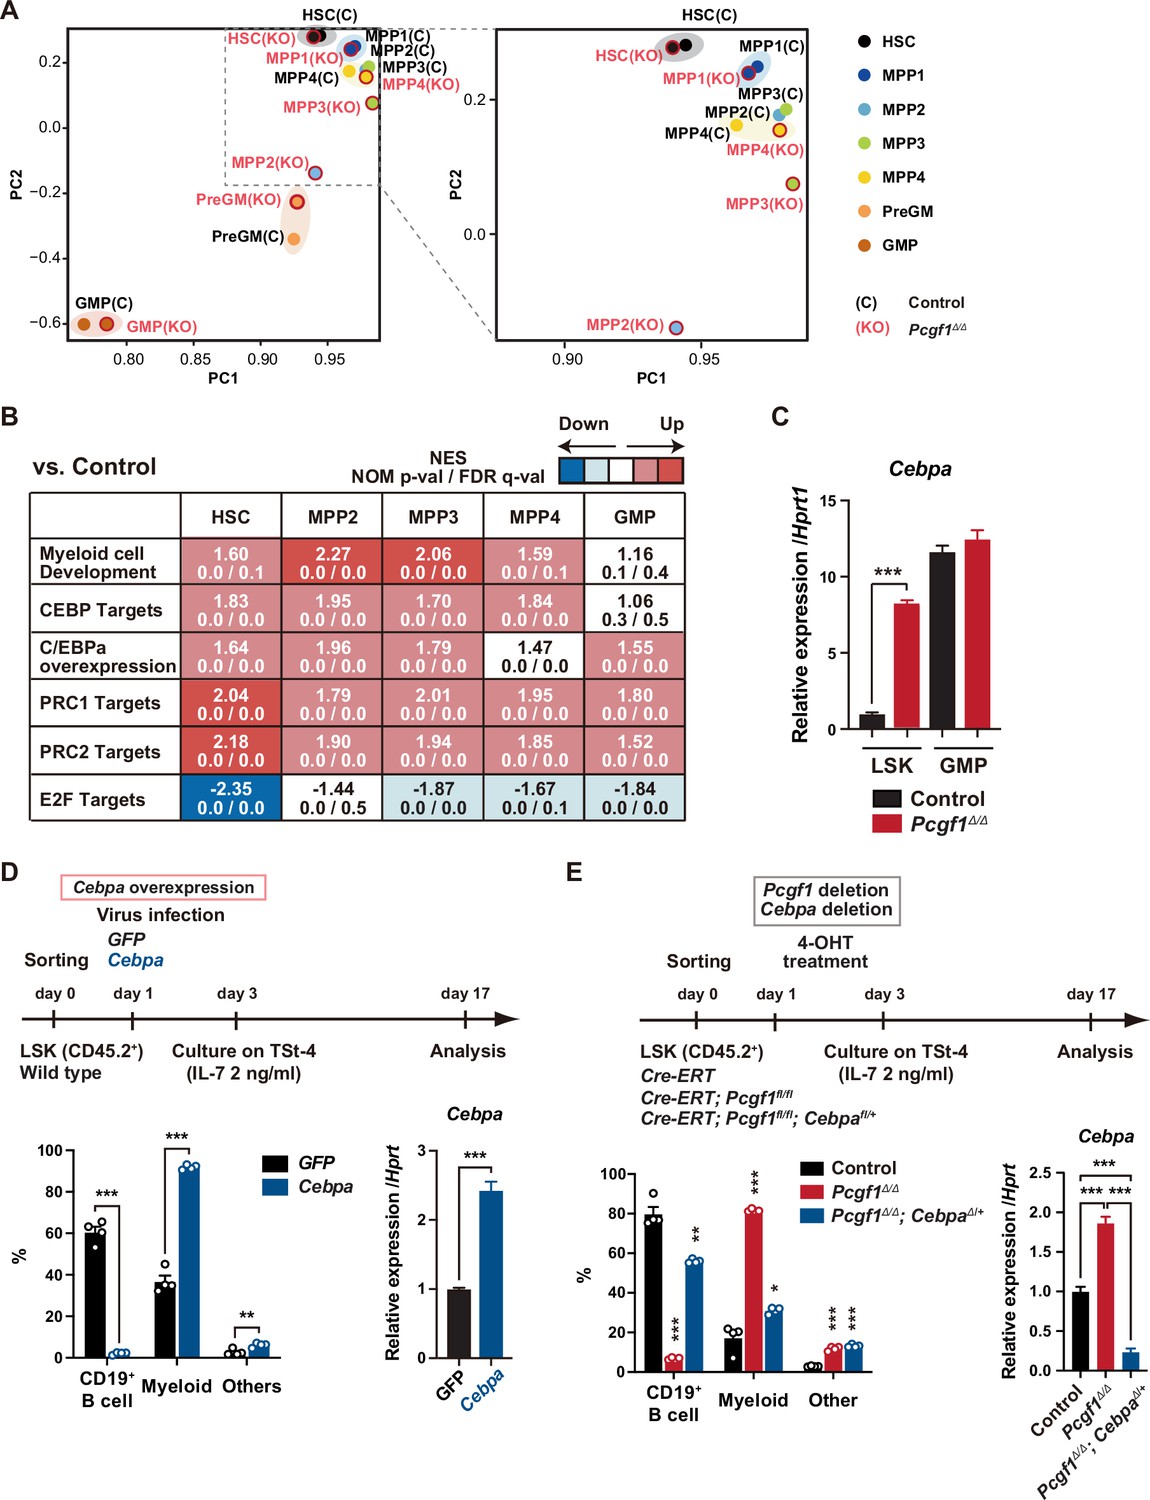
Pcgf1-deficient hematopoietic stem and progenitor cells (HSPCs) undergo myeloid reprogramming.
(A) Principal component analyses (PCA) based on total gene expression obtained by RNA-seq of hematopoietic stem cells (HSCs), multipotent progenitors (MPPs), pre-GM, and granulocyte-macrophage progenitors (GMPs) from control and Pcgf1Δ/Δ mice. Magnified view of the boxed part is depicted on the right. (B) Gene set enrichment analysis (GSEA) using RNA-seq data. Summary of GSEA data of representative gene sets is shown. Normalized enrichment scores (NES), nominal p-values (NOM), and false discovery rates (FDR) are indicated. The gene sets used are indicated in Supplementary file 1. (C) Quantitative RT-PCR analysis of Cebpa in LSK cells and GMPs. Hprt1 was used to normalize the amount of input RNA. Data are shown as the mean ± SEM (n = 3). ***p<0.001 by the Student’s t-test. (D) Effects of Cebpa overexpression on HSPC differentiation in vitro. LSK cells were transduced with either control (GFP) or Cebpa retrovirus, then cultured on TSt-4 stromal cells in the presence of IL-7 (upper). The proportions of myeloid (Mac1+ and /or Gr-1+), B cells (CD19+), and others (Mac1-Gr-1-CD19-) among CD45.2+GFP+ hematopoietic cells on day 17 of culture are indicated (lower left; n = 4 each). RT-qPCR analysis of Cebpa in LSK cells transduced with control or Cebpa retrovirus on day 14 of culture (n = 3). Hprt1 was used to normalize the amount of input RNA (lower right). Each symbol is derived from an individual culture. Data are shown as the mean ± SEM. **p<0.01, ***p<0.001 by the Student’s t-test. (E) Impact of Cebpa haploinsufficiency on myeloid-biased differentiation of Pcgf1Δ/Δ HSPCs. LSK cells from Rosa26CreERT, Rosa26CreERT;Pcgf1fl/fl and Rosa26CreERT;Pcgf1fl/fl;Cebpafl/+ mice were treated with 4-OHT (200 nM) for 2 d in culture to delete Pcgf1 and Cebpa. Cells were further cultured on TSt-4 stromal cells in the presence of IL-7 (upper). The proportions of myeloid (Mac1+ and /or Gr-1+), B cells (CD19+), and others (Mac1-Gr-1-CD19-) among CD45.2+GFP+ hematopoietic cells on day 17 of culture are indicated (lower; n = 4 each;* versus control). Each symbol is derived from an individual culture (lower left). RT-qPCR data of Cebpa in LSK cells on day 14 of culture (n = 3). Hprt1 was used to normalize the amount of input RNA (lower right). Data are shown as the mean ± SEM. *p<0.05, **p<0.01, ***p<0.001 by the Student’s t-test (lower left) or the one-way ANOVA (lower right).
-
Figure 2—source data 1
Raw data for Figure 2.
- https://cdn.elifesciences.org/articles/83004/elife-83004-fig2-data1-v2.zip
Figure 2—figure supplement 1
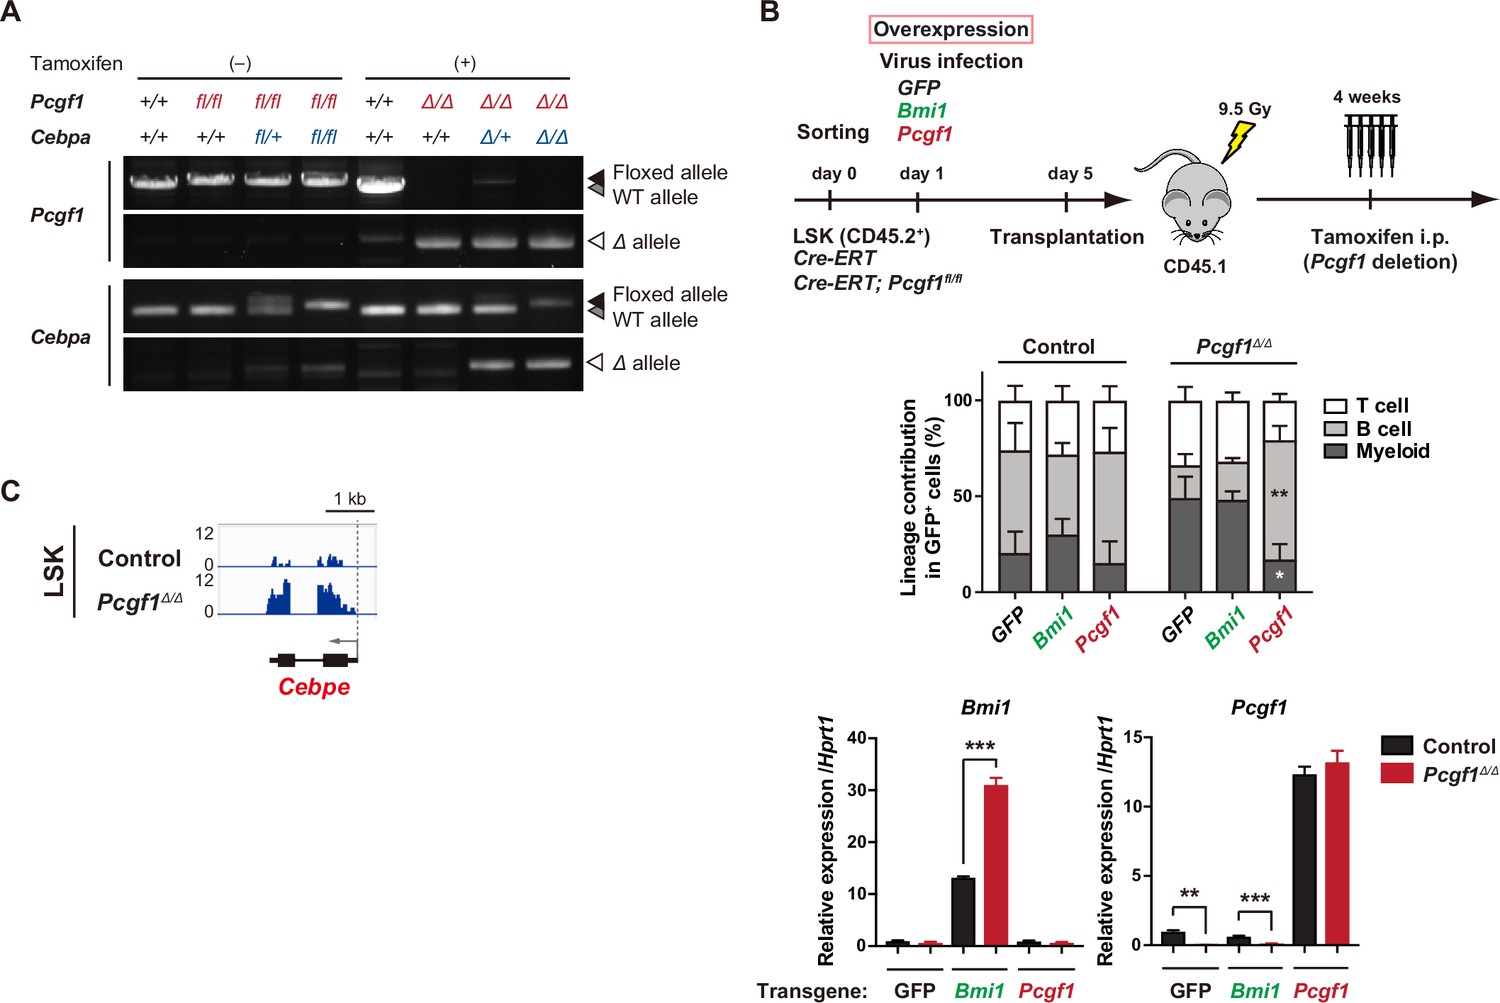
Derepressed Cebpa accounts for the myeloid-biased differentiation of Pcgf1Δ/Δ hematopoietic stem and progenitor cells (HSPCs).
(A) Deletion efficiency of Pcgf1 and Cebpa in TSt-4 stromal co-culture in Figure 2E was assessed by genomic PCR in D45.2+ hematopoietic cells treated and non-treated with 4-OHT. Floxed, floxed allele; Δ, floxed allele after the removal of targeted exons by Cre recombinase (lower). (B) Rescue experiments of the myeloid-biased repopulation of Pcgf1Δ/Δ HSPCs. LSK cells from Rosa26CreERT (control) and Rosa26CreERT;Pcgf1fl/fl mice were transduced with control (GFP), Pcgf1, or Bmi1 retrovirus, then transplanted into lethally irradiated CD45.1 recipient mice. Pcgf1 was deleted by intraperitoneal injection of tamoxifen at 4 wk post-transplantation (upper). The proportions of myeloid (Mac-1+ and/or Gr-1+), B cells (B220+), and T cells (CD4+ or CD8+) among CD45.2+GFP+ control (n = 4–5) and Pcgf1Δ/Δ (n = 5) donor-derived hematopoietic cells in peripheral blood (PB) at 3 mo after transplantation are indicated (* versus GFP control) (middle). RT-qPCR analysis of Bmi1 and Pcgf1 in GFP+ LSK cells purified from bone marrow (BM) of recipient mice receiving control or Pcgf1Δ/Δ LSK cells transduced with control, Bmi1 or Pcgf1 retrovirus (n = 3). Hprt1 was used to normalize the amount of input RNA (lower; n=3). Data are shown as the mean ± SEM. *p<0.05; **p<0.01; ***p<0.001 by the Student’s t-test. (C) Snapshots of RNA-seq signals at the Cebpe gene loci.
-
Figure 2—figure supplement 1—source data 1
Uncropped gel images of Figure 2—figure supplement 1A.
- https://cdn.elifesciences.org/articles/83004/elife-83004-fig2-figsupp1-data1-v2.zip
-
Figure 2—figure supplement 1—source data 2
Raw data for Figure 2—figure supplement 1.
- https://cdn.elifesciences.org/articles/83004/elife-83004-fig2-figsupp1-data2-v2.zip
Figure 3
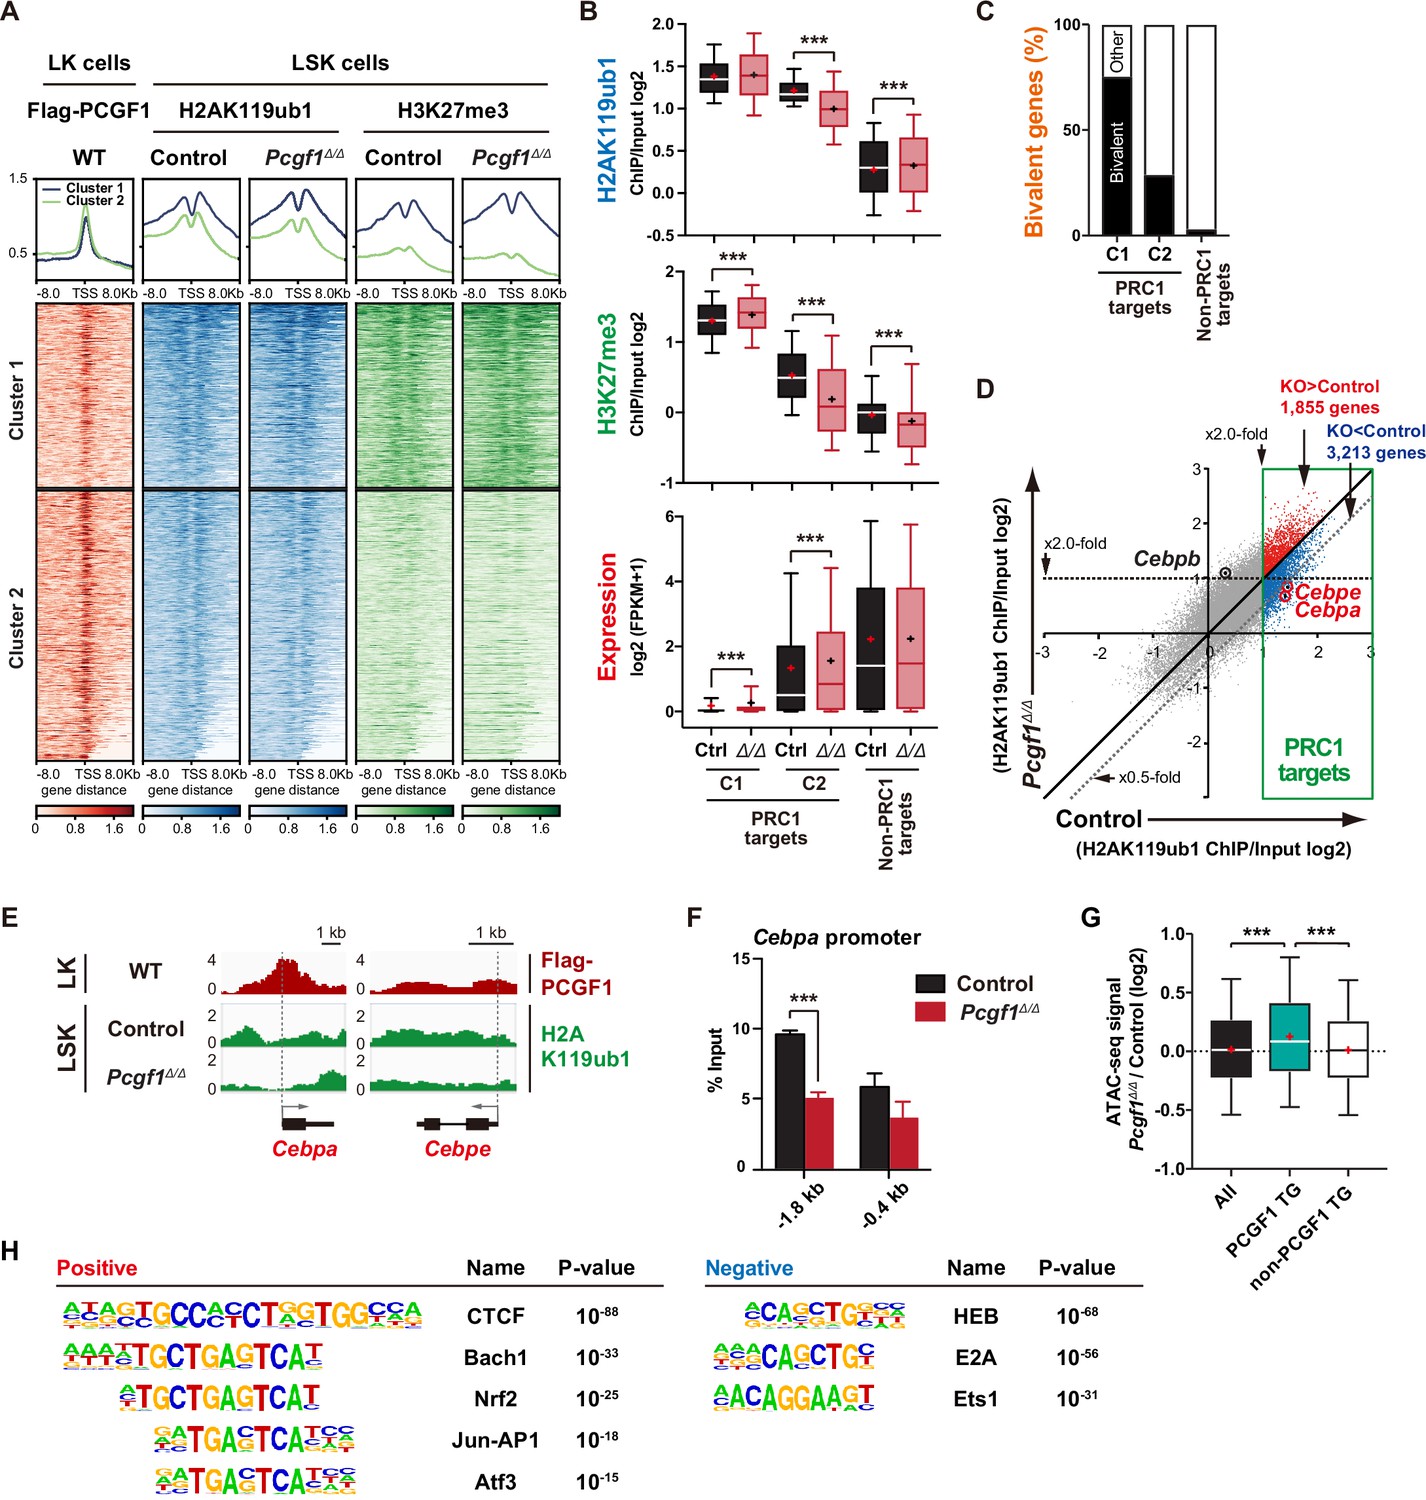
PCGF1 regulates local H2AK119ub1 levels in hematopoietic stem and progenitor cells (HSPCs).
(A) K-means clustering of 3×FLAG-PCGF1, H2AK119ub1, and H3K27me3 ChIP peaks around transcription start site (TSS) (±8.0 kb) of PRC1 target genes. The average levels of chromatin immunoprecipitation (ChIP) peaks in each cluster are plotted in upper columns. (B) Box-and-whisker plots showing H2AK119ub1, H3K27me3, and transcription levels of genes in PRC1 targets (clusters 1 and 2) and non-PRC1 targets in control and Pcgf1Δ/Δ LSK cells. Boxes represent 25–75 percentile ranges. The whiskers represent 10–90 percentile ranges. Horizontal bars represent medians. Mean values are indicated by ‘+’. **p<0.01; ***p<0.001 by the Student’s t-test. (C) Proportion of bivalent genes in PRC1 targets (clusters 1 and 2) and non-PRC1 targets in LSK cells. Bivalent genes were defined using our previous ChIP-seq data of wild-type LSK cells (Aoyama et al., 2018). (D) Scatter plots showing the correlation of the fold enrichment values against the input signals (ChIP/Input) (TSS ± 2 kb) of H2AK119ub1 between control and Pcgf1Δ/Δ LSK cells. PRC1 targets are indicated in a green box. (E) Snapshots of Flag-PCGF1 and H2AK119ub1 ChIP signals at the Cebpa and Cebpe gene loci. (F) ChIP qPCR assays for H2AK119ub1 at the Cebpa promoter in control and Pcgf1Δ/Δ LSK cells. The relative amounts of immunoprecipitated DNA are depicted as a percentage of input DNA. Data are shown as the mean ± SEM (n = 3). ***p<0.001 by the Student’s t-test. (G) Box-and-whisker plots showing ATAC signal levels at proximal promoters (TSS ± 2 kb) in Pcgf1Δ/Δ CD135-LSK cells relative to those in control cells. The data of all ATAC peaks (n = 18,417), PCGF1 target genes (TG) (n = 670), and non-PCGF1 TG (n = 17,747) are shown. Boxes represent 25–75 percentile ranges. The whiskers represent 10–90 percentile ranges. Horizontal bars represent medians. Mean values are indicated by red crosses. ***p<0.001 by the one-way ANOVA. (H) Top DNA motifs identified in ATAC peaks at proximal promoters (TSS ± 2 kb) positively or negatively enriched in Pcgf1Δ/Δ CD135-LSK cells compared to corresponding controls.
-
Figure 3—source data 1
Raw data for Figure 3.
- https://cdn.elifesciences.org/articles/83004/elife-83004-fig3-data1-v2.zip
Figure 4 with 1 supplement
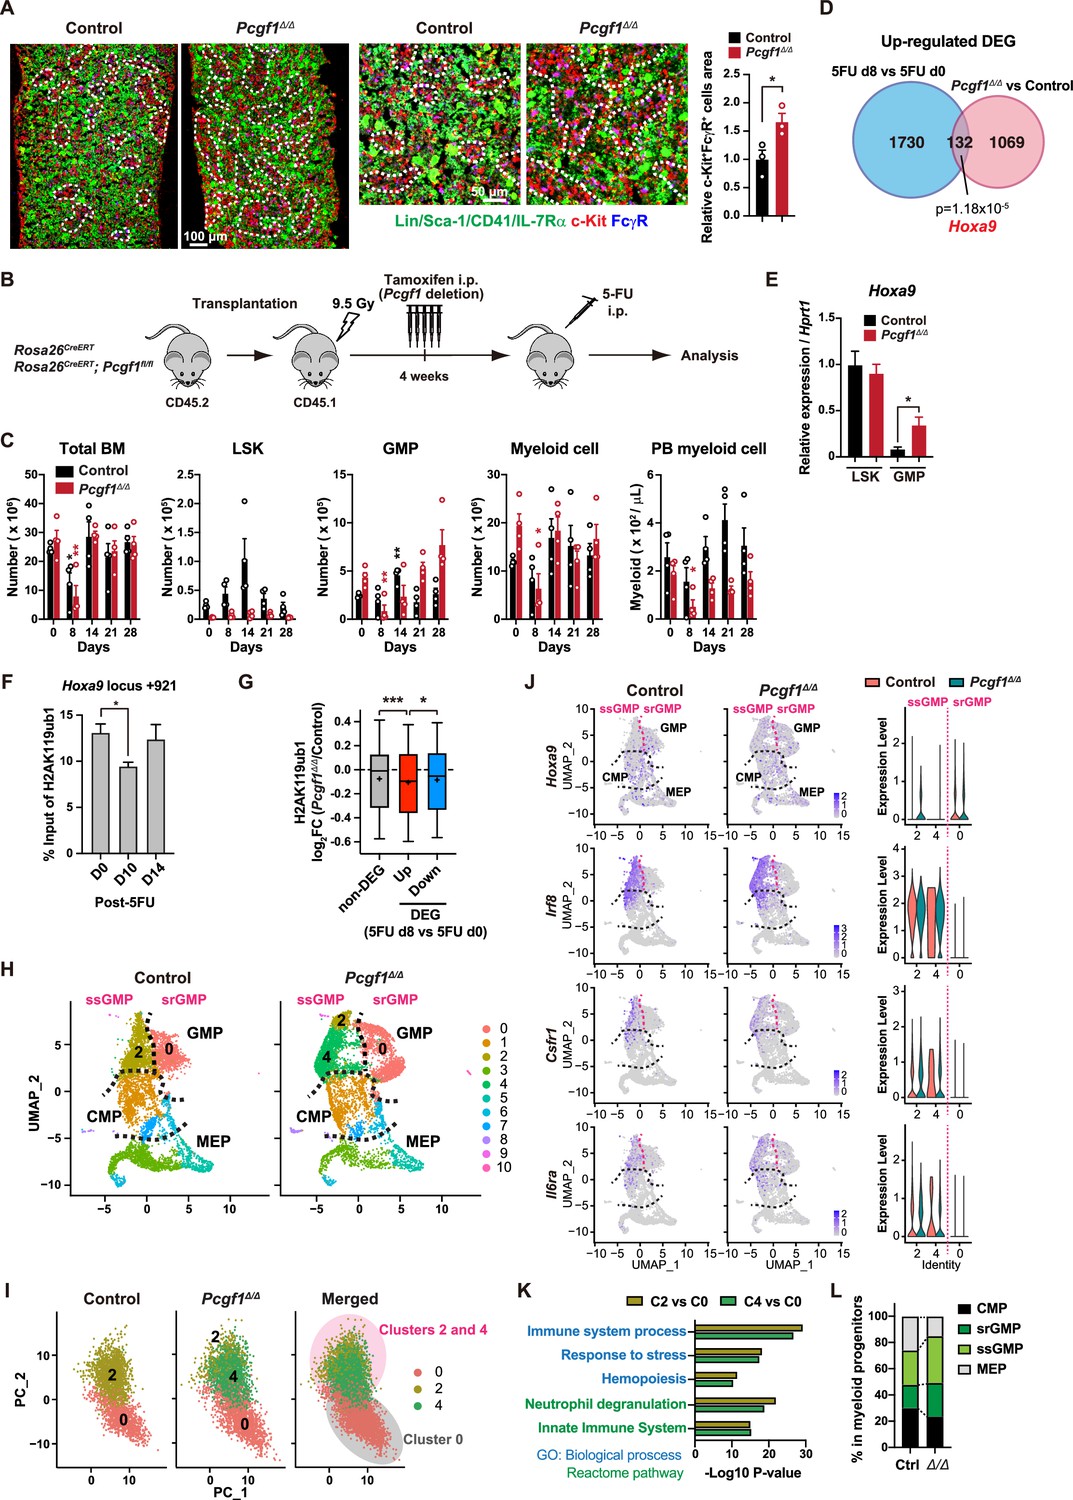
PCGF1 negatively regulates granulocyte-macrophage progenitor (GMP) self-renewal.
(A) Immunofluorescence staining of bone marrow (BM) sections from control and Pcgf1Δ/Δ mice. Magnified images are depicted in the middle panels. Dotted lines denote clusters of GMP (Lin–Sca-1–CD41–IL-7Rα–c-Kit+FcγR+) (c-Kit, red; FcγR, blue; merged, purple). The right panel shows c-Kit+FcγR+ purple cell area in BM sections relative to that in control. Data are shown as the mean ± SEM (n = 3). (B) Strategy to analyze emergency myelopoiesis induced by one shot of 5-FU (150 mg/kg). (C) Absolute numbers of total BM cells, LSK cells, GMPs, and Mac-1+ myeloid cells in a unilateral pair of femur and tibia and Mac-1+ myeloid cells in peripheral blood (PB) at the indicated time points post-5-FU injection. Data are shown as the mean ± SEM (n = 4;* versus day 0 for each genotype). Circles represent the data from individual mice. (D) A Venn diagram showing the overlap between upregulated differentially expressed genes (DEGs) in 5-FU treated GMPs on day 8 and upregulated DEGs in Pcgf1Δ/Δ GMPs. (E) Quantitative RT-PCR analysis of Hoxa9 in LSK cells and GMPs. Hprt1 was used to normalize the amount of input RNA. Data are shown as the mean ± SEM (n = 3). (F) Chromatin immunoprecipitation (ChIP) qPCR assays for H2AK119ub1 at the Hoxa9 locus in GMPs from WT mice on days 0, 10, and 14 post-5-FU treatment. The relative amounts of immunoprecipitated DNA are depicted as a percentage of input DNA. Data are shown as the mean ± SEM (n = 3). (G) Fold changes in H2AK119ub1 levels in Pcgf1Δ/Δ GMPs relative to control GMPs at the promoters of non-DEGs and DEGs up- and downregulated in day 8 GMPs compared to day 0 GMPs post-5-FU treatment. (H) UMAP plots illustrating the identification of cell clusters based on single-cell transcriptomic profiling of control and Pcgf1Δ/Δ myeloid progenitors (Lin–Sca-1–c-Kit+). (I) Principal component analysis (PCA) plots of control and Pcgf1Δ/Δ GMPs individually and in combination. (J) UMAP and violin plots showing expression of Hoxa9, Irf8, Csf1r, and Il-6ra in control and Pcgf1Δ/Δ myeloid progenitors. (K) Gene Ontology and pathway enrichment analyses using DEGs in the indicated clusters. (L) Proportion of common myeloid progenitors (CMPs), megakaryocyte-erythroid progenitors (MEPs), steady-state GMPs (ssGMPs), and self-renewing GMPs (srGMPs) in control and Pcgf1Δ/Δ myeloid progenitors. *p<0.05; **p<0.01; ***p<0.001 by the Student’s t-test.
-
Figure 4—source data 1
Raw data for Figure 4.
- https://cdn.elifesciences.org/articles/83004/elife-83004-fig4-data1-v2.zip
Figure 4—figure supplement 1
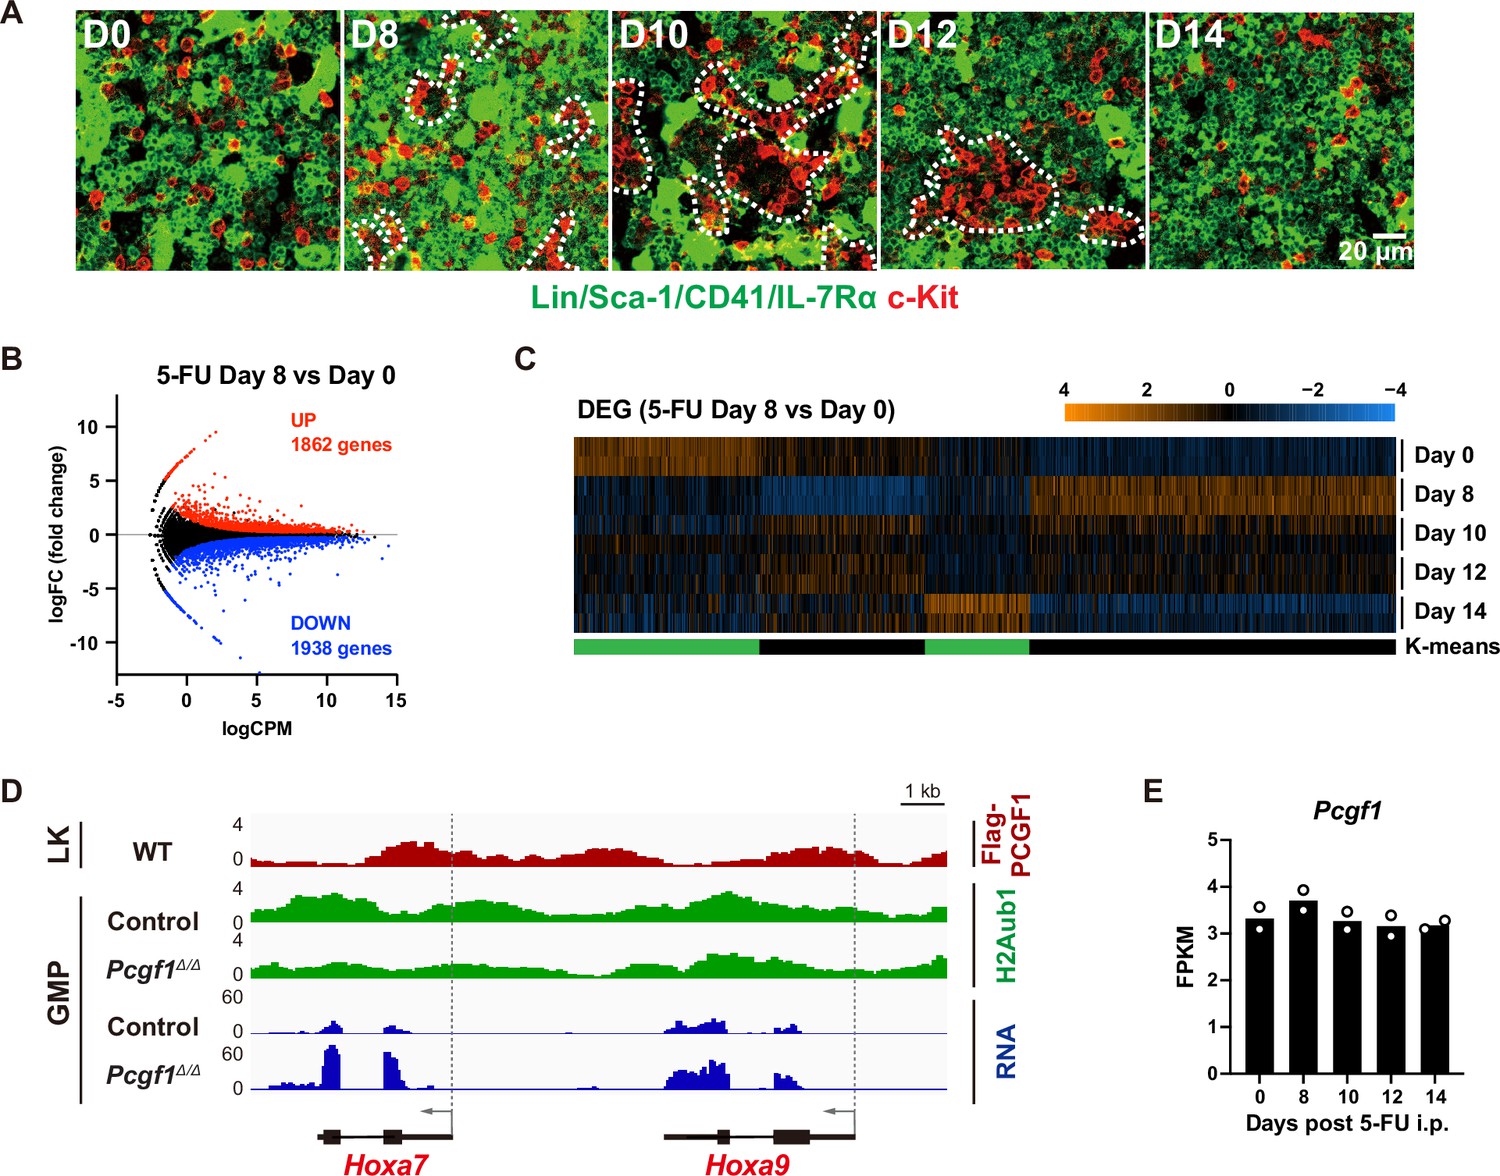
Granulocyte-macrophage progenitor (GMP) expansion during regeneration.
(A) Representative immunofluorescence staining of bone marrow (BM) sections from 5-FU-treated wild-type mice. Dotted lines denote clusters of GMPs (Lin–Sca-1–CD41–IL-7Rα–c-Kit+) (red). (B) MA plot showing the relationship between average expression (count per million in Log: logCPM) and fold change (logFC) in GMPs from 5-FU-treated WT mice on days 0 and 8. The red and blue dots represent upregulated (1862 genes) and downregulated (1938 genes) differentially expressed genes (DEGs) (5-FU day 8 vs. day 0). (C) K-means clustering of DEGs defined in (B). Heatmap shows the z-scores of expression values. (D) Snapshots of RNA-Seq and Flag-PCGF1 and H2AK119ub chromatin immunoprecipitation (ChIP) signals at the Hoxa7 and Hoxa9 gene loci. (E) Pcgf1 expression in GMPs during regeneration in 5-FU-treated WT mice. FPKM values of RNA-seq data (n = 2) are indicated.
-
Figure 4—figure supplement 1—source data 1
Raw data for Figure 4—figure supplement 1.
- https://cdn.elifesciences.org/articles/83004/elife-83004-fig4-figsupp1-data1-v2.zip
Figure 5 with 1 supplement
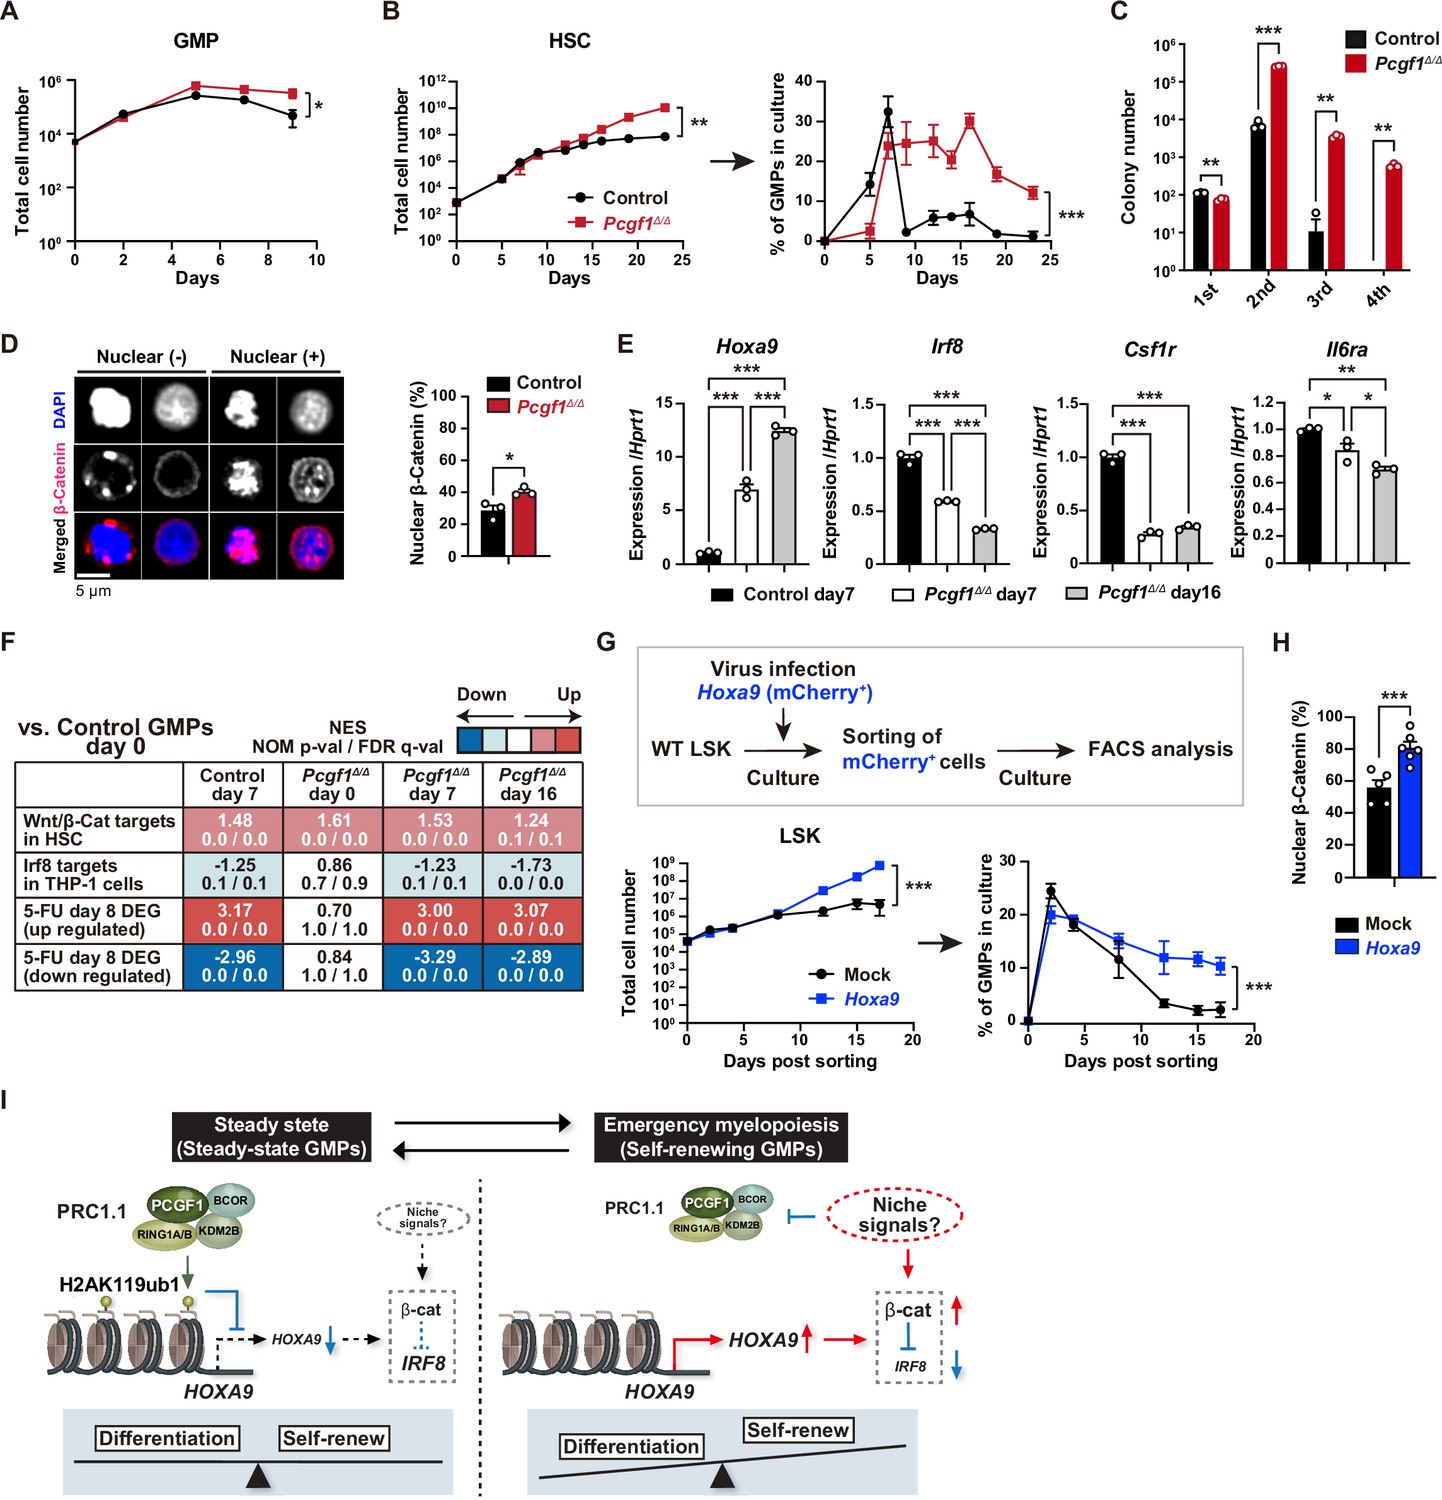
PCGF1 restricts self-renewal of granulocyte-macrophage progenitors (GMPs) by attenuating Hoxa9 expression.
(A) Growth of control and Pcgf1Δ/Δ GMPs in culture. Cells were cultured in triplicate under myeloid culture condition-2 (25 ng/mL SCF, TPO, Flt3L, and IL-11 and 10 ng/mL IL-3 and GM-CSF). Data are shown as the mean ± SD (n = 3). (B) Growth of control and Pcgf1Δ/Δ hematopoietic stem cells (HSCs) under myeloid culture condition-2 (25 ng/mL SCF, TPO, Flt3L, and IL-11 and 10 ng/mL IL-3 and GM-CSF). Cells were cultured in triplicate. The proportion of GMPs in culture is depicted on the right panel. Data are shown as the mean ± SD (n = 3). (C) Replating assay data. 700 LSK cells were plated in a methylcellulose medium containing 20 ng/mL of SCF, TPO, IL-3, and GM-CSF. After 10 d of culture, colonies were counted and pooled, and 1 × 10⁴ cells were then replated in the same medium every 7 d. Data are shown as the mean ± SEM (n = 3). (D) Proportion of immunophenotypic GMPs with nuclear β-catenin in control and Pcgf1Δ/Δ immunophenotypic GMPs in HSC culture on day 16 in (B). Representative immunofluorescent signals of β-catenin in control immunophenotypic GMPs are shown on the right panel. Data are shown as the mean ± SEM (n = 3). (E) Quantitative RT-PCR analysis of Hoxa9, Irf8, Csf1r, and Il-6ra in sorted control and Pcgf1Δ/Δ immunophenotypic GMPs in HSC culture in (B) at the indicated time points. Hprt1 was used to normalize the amount of input RNA. Data are shown as the mean ± SEM (n = 3). (F) Gene set enrichment analysis (GSEA) using RNA-seq data. The gene sets used are indicated in Supplementary file 1. (G) Growth of mock control and Hoxa9-expressing LSK cells. LSK cells transduced with a Hoxa9 retrovirus harboring mCherry marker gene were cultured in triplicate under myeloid culture condition-2 (25 ng/mL SCF, TPO, Flt3L, and IL-11 and 10 ng/mL IL-3 and GM-CSF). The proportion of GMPs in culture is depicted on the right panel. Data are shown as the mean ± SD (n = 4). (H) Proportion of GMPs with nuclear β-catenin in mock control and Hoxa9-expressing GMPs in LSK culture on day 12 in (G). Data are shown as the mean ± SEM (n = 5–6). (I) Model of the molecular network controlling GMP self-renewal and differentiation. *p<0.05; **p<0.01; ***p<0.001 by the Student’s t-test (A–D, H, and G) or the one-way ANOVA (E). Each symbol is derived from an individual culture.
-
Figure 5—source data 1
Raw data for Figure 5.
- https://cdn.elifesciences.org/articles/83004/elife-83004-fig5-data1-v2.zip
Figure 5—figure supplement 1
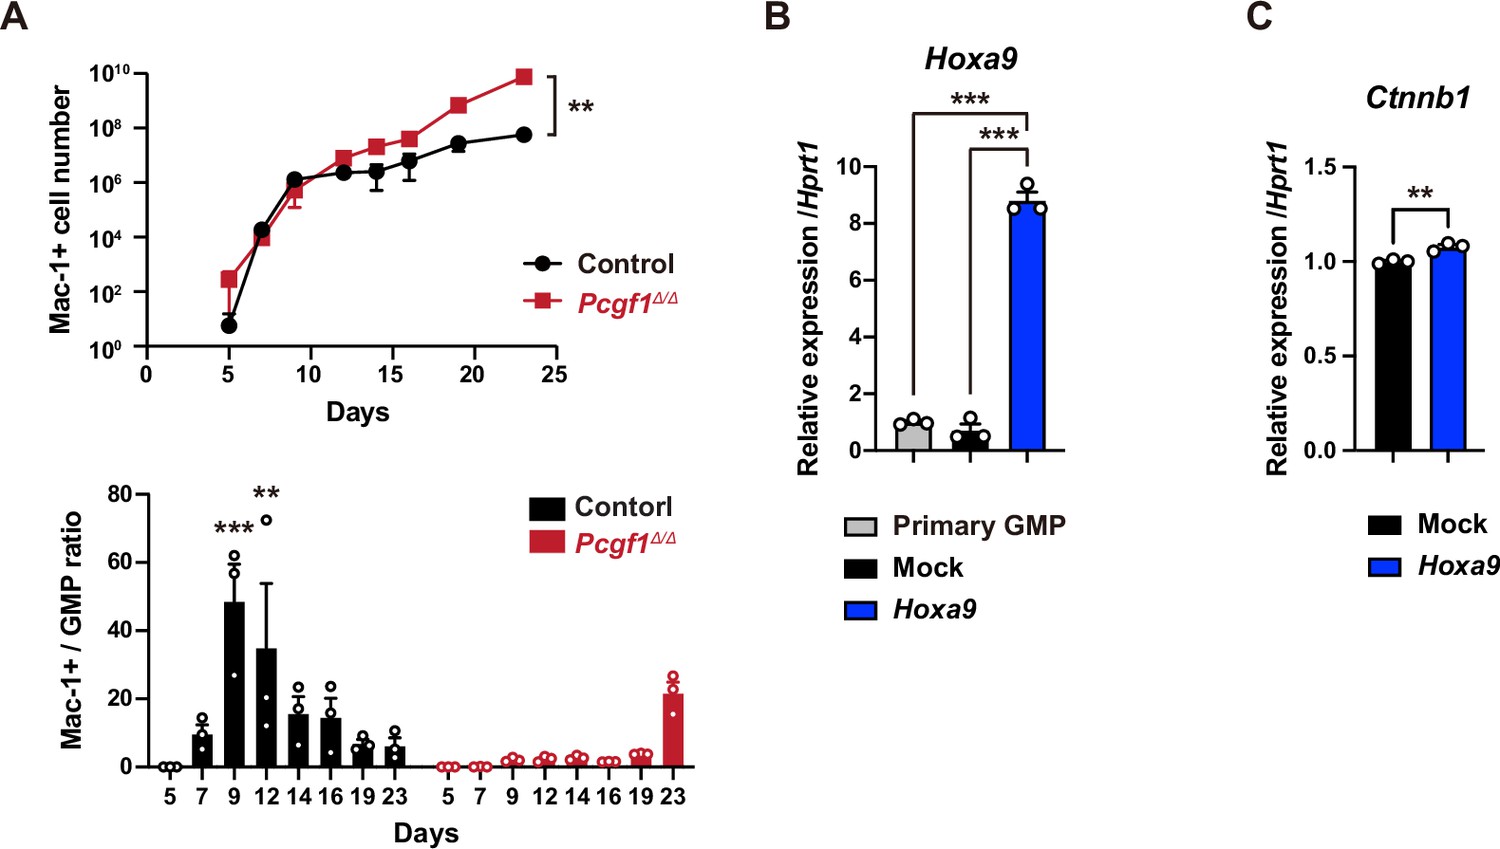
Granulocyte-macrophage progenitor (GMP) expansion in the absence of PCGF1.
(A) Cell number of Mac1+ differentiated myeloid cells in control and Pcgf1Δ/Δ hematopoietic stem cell (HSC) cultures in Figure 5B (upper). The ratio of the number of Mac1+ differentiated myeloid cells and GMPs. The significance relative to day 5 is shown (lower). Data are shown as the mean ± SEM (n = 3). **p<0.01; ***p<0.001 by the Student’s t-test (upper) or the one-way ANOVA (lower). (B) RT-qPCR analysis of Hoxa9 in primary and mCherry-positive GMPs purified from Mock and Hoxa9 cultures at day 2 in Figure 5G. Data are shown as the mean ± SEM (n = 3). Hprt1 was used to normalize the amount of input RNA. ***p<0.001 by the one-way ANOVA. (C) RT-qPCR analysis of Ctnnb1 in mCherry-positive GMPs purified from Mock and Hoxa9 cultures at day 12 in Figure 5G. Data are shown as the mean ± SEM (n = 3). **p<0.01 by the Student’s t-test.
-
Figure 5—figure supplement 1—source data 1
Raw data for Figure 5—figure supplement 1.
- https://cdn.elifesciences.org/articles/83004/elife-83004-fig5-figsupp1-data1-v2.zip
Figure 6
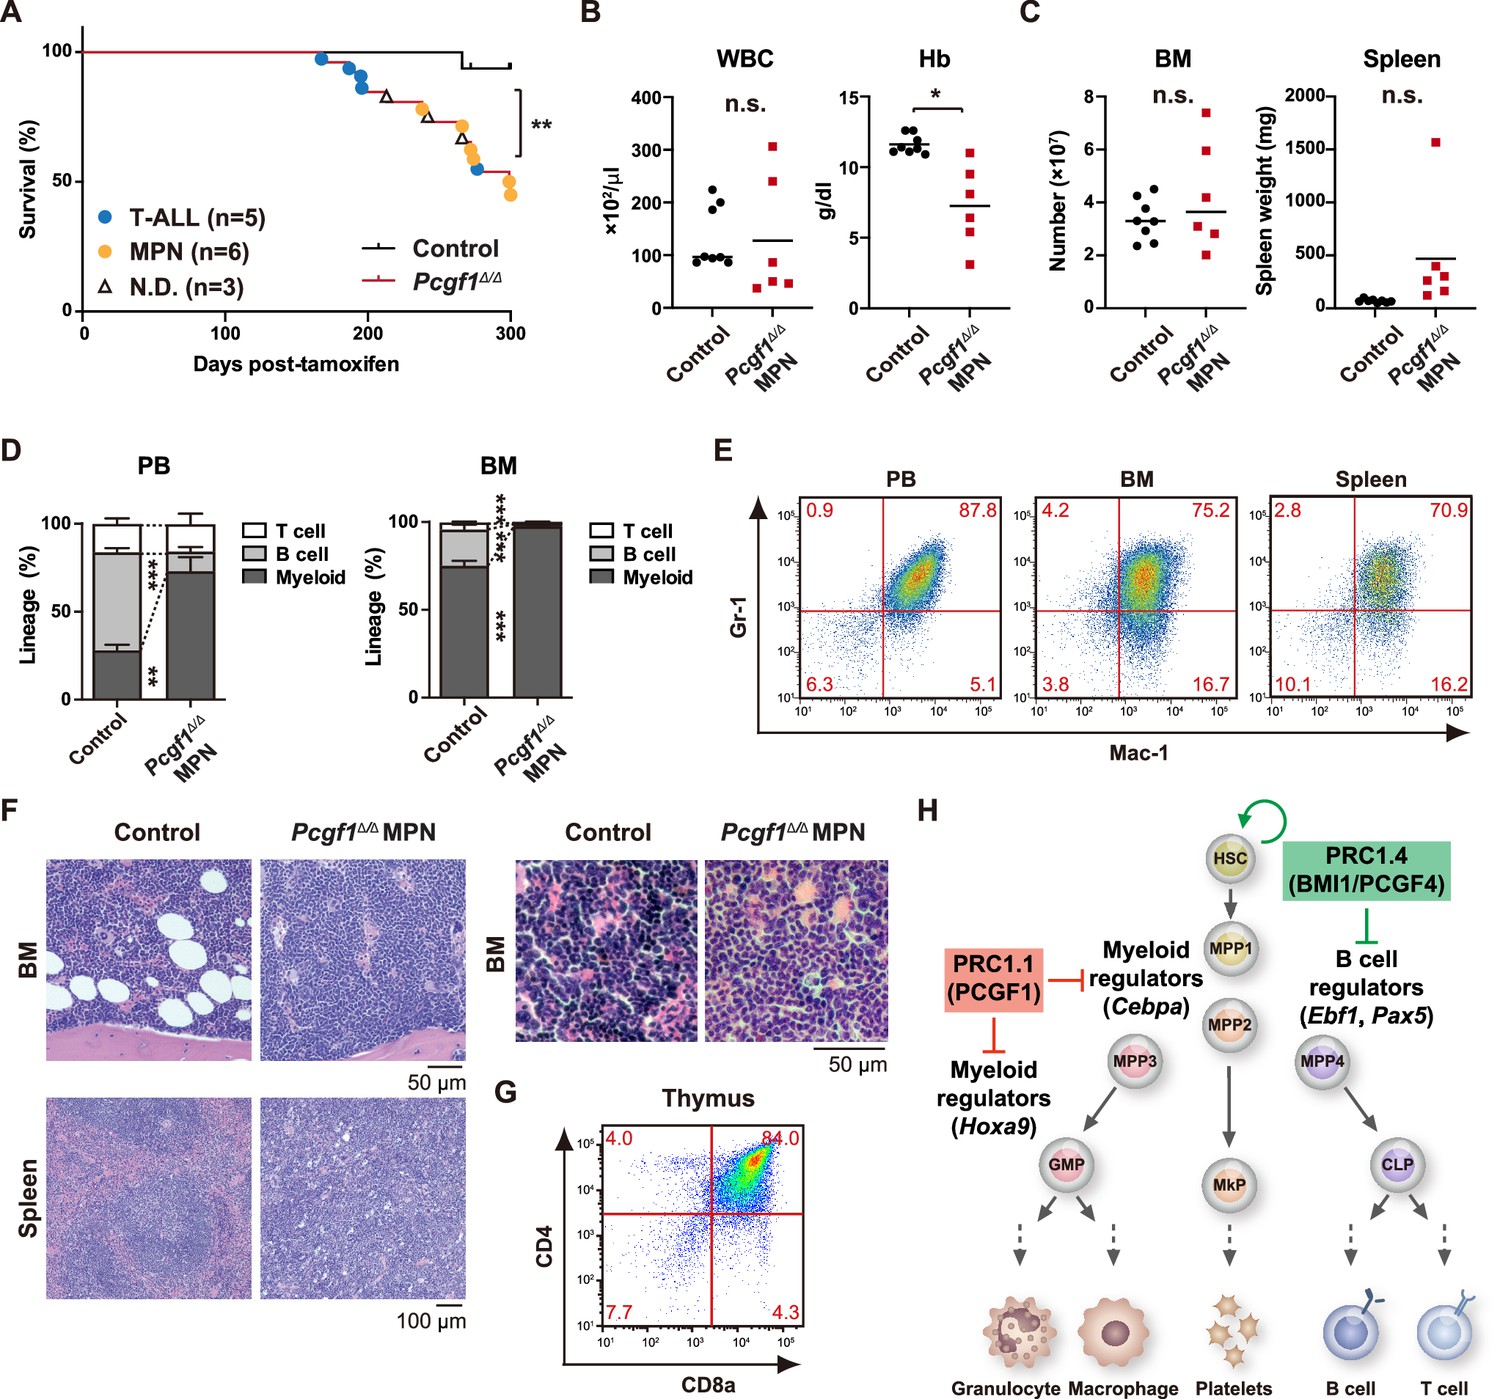
Development of lethal myeloproliferative neoplasm in Pcgf1Δ/Δ mice.
(A) Kaplan–Meier survival curves of control (n = 7) and Pcgf1Δ/Δ (n = 25) mice after the tamoxifen injection. (B) White blood cell (WBC) and hemoglobin (Hb) in peripheral blood (PB) from control (n = 8) and moribund Pcgf1Δ/Δ myeloproliferative neoplasms (MPN) mice (n = 6). Bars indicate median values. (C) Absolute numbers of total bone marrow (BM) cells and spleen weight in control (n = 8) and moribund Pcgf1Δ/Δ MPN mice (n = 6). (D) The proportions of Mac-1+ and/or Gr-1+ myeloid cells, B220+ B cells, and CD4+ or CD8+ T cells in PB and BM in control (n = 8) and moribund Pcgf1Δ/Δ MPN mice (n = 6). Data are shown as the mean ± SEM. (E) Representative flow cytometric profiles of PB, BM, and spleen of control and moribund Pcgf1Δ/Δ MPN mice. The percentages of gated populations over CD45.2+ live cells are indicated. (F) Representative histology of BM and spleen from control and moribund Pcgf1Δ/Δ MPN mice observed by hematoxylin-eosin staining (left). The high-power field images of BM from control and moribund Pcgf1Δ/Δ MPN mice observed by hematoxylin-eosin staining (right). (G) Representative flow cytometric profiles of thymus from control mice and moribund Pcgf1Δ/Δ T-ALL mice. (H) Model for the stage-specific roles of non-canonical PRC1 in hematopoietic differentiation. *p<0.05; **p<0.01; ***p<0.001 by the Student’s t-test. Each symbol is derived from an individual mouse.
-
Figure 6—source data 1
Raw data for Figure 6.
- https://cdn.elifesciences.org/articles/83004/elife-83004-fig6-data1-v2.zip
Tables
Appendix 1—key resources table
| Reagent type (species) or resource | Designation | Source or reference | Identifiers | Additional information |
|---|---|---|---|---|
| Strain, strain background (Mus musculus) | Wild-type mice: C57BL/6 (CD45.2) | Japan SLC | C57BL6JJmsSlc | |
| Strain, strain background (M. musculus) | Wild-type mice: C57BL/6 (CD45.1) | Sankyo-Lab Service | ||
| Strain, strain background (M. musculus) | Rosa26::Cre-ERT2: C57BL/6-Gt(ROSA)26Sortm9(Cre/ESR1)Arte | TaconicArtemis GmbH | Model 10471 | |
| Strain, strain background (M. musculus) | Pcgf1fl | This paper | Koseki H Lab | |
| Strain, strain background (M. musculus) | Cebpafl: B6.129S6(CBA)-Cebpatm1Dgt/J | The Jackson Laboratory | JAX: 006447 | Daniel G. Tenen Lab |
| Cell line (Homo sapiens) | 293gpg | Ory et al., 1996. | ||
| Cell line (M. musculus) | TSt-4 | Masuda et al., 2005. | ||
| Cell line (M. musculus) | TSt-4/DLL1 | Masuda et al., 2005. | ||
| Antibody | Biotin anti-mouse Ly-6G/Ly-6C (Gr-1) (RB6-8C5) (rat monoclonal) | Tonbo Biosciences | Cat# 30-5931; RRID:AB_2621652 | FACS (3.5 × 10⁻³ μL/1 × 106 cell) |
| Antibody | Biotin anti-human/mouse CD11b (M1/70) (rat monoclonal) | Tonbo Biosciences | Cat# 30-0112; RRID:AB_2621639 | FACS (1.8 × 10⁻² μL/1 × 106 cell) |
| Antibody | Biotin anti-mouse TER-119 (TER-119) (rat monoclonal) | Tonbo Biosciences | Cat# 30-5921; RRID:AB_2621651 | FACS (3.5 × 10⁻³ μL/1 × 106 cell) |
| Antibody | Biotin anti-human/mouse CD45R (B220) (RA3-6B2) (rat monoclonal) | Tonbo Biosciences | Cat# 30-0452; RRID:AB_2621644 | FACS (1.8 × 10⁻² μL/1 × 106 cell) |
| Antibody | Biotin anti-mouse CD127 (IL-7Rα) antibody (rat monoclonal) | BioLegend | Cat# 121104; RRID:AB_312989 | FACS (1.8 × 10⁻² μL/1 × 106 cell) |
| Antibody | Biotin anti-mouse CD4 antibody (rat monoclonal) | BioLegend | Cat# 100404; RRID:AB_493502 | FACS (9 × 10⁻³ μL/1 × 106 cell) |
| Antibody | Biotin anti-mouse CD8a (53–6.7) (rat monoclonal) | Tonbo Biosciences | Cat# 30-0081; RRID:AB_2621638 | FACS (9 × 10⁻³ μL/1 × 106 cell) |
| Antibody | Biotin anti-mouse Ly-6A/E (Sca-1) antibody (rat monoclonal) | BioLegend | Cat# 108104; RRID:AB_3133418 | FACS (2.5 × 10⁻² μL/1 × 106 cell) |
| Antibody | CD41a monoclonal antibody (eBioMWReg30 (MWReg30)), Biotin (rat monoclonal) | eBioscience | Cat# 13-0411-85; RRID:AB_76348 | FACS (0.1 μL/1 × 106 cell) |
| Antibody | PerCP/Cyanine5.5 Streptavidin | BioLegend | Cat# 405214; RRID:AB_2716577 | FACS (5 × 10⁻² μL/1 × 106 cell) |
| Antibody | APC anti-human/mouse CD45R (B220) (RA3-6B2) (rat monoclonal) | Tonbo Biosciences | Cat# 20-0452; RRID:AB_2621574 | FACS (2.5 × 10⁻² μL/1 × 106 cell) |
| Antibody | APC anti-mouse CD117 (c-Kit) antibody (rat monoclonal) | BioLegend | Cat# 105812; RRID:AB_313221 | FACS (2.5 × 10⁻² μL/1 × 106 cell) |
| Antibody | APC anti-human/mouse CD11b (M1/70) (rat monoclonal) | Tonbo Biosciences | Cat# 20-0112; RRID:AB_2621556 | FACS (5 × 10⁻³ μL/1 × 106 cell) |
| Antibody | APC anti-mouse CD4 antibody (rat monoclonal) | BioLegend | Cat# 100412; RRID:AB_312697 | FACS (0.1 μL/1 × 106 cell) |
| Antibody | APC/Cyanine7 anti-mouse CD4 antibody (rat monoclonal) | BioLegend | Cat# 100526; RRID:AB_312727 | FACS (5 × 10⁻² μL/1 × 106 cell) |
| Antibody | APC/Cyanine7 anti-mouse CD8a antibody (rat monoclonal) | BioLegend | Cat# 100714; RRID:AB_312753 | FACS (5 × 10⁻² μL/1 × 106 cell) |
| Antibody | APC/Cyanine7 anti-mouse CD48 antibody (Armenian hamster monoclonal) | BioLegend | Cat# 103431; RRID:AB_2621462 | FACS (2.5 × 10⁻² μL/1 × 106 cell) |
| Antibody | APC/Cyanine7 anti-mouse CD45.2 antibody (mouse monoclonal) | BioLegend | Cat# 109824; RRID:AB_830789 | FACS (4 × 10⁻² μL/1 × 106 cell) |
| Antibody | APC/Cyanine7 Streptavidin | BioLegend | Cat# 405208 | FACS (5 × 10⁻² μL/1 × 106 cell) |
| Antibody | PE anti-mouse Ly-6A/E (Sca-1) antibody (rat monoclonal) | BioLegend | Cat# 108108; RRID:AB_313345 | FACS (2.5 × 10⁻² μL/1 × 106 cell) |
| Antibody | PE anti-mouse/human CD11b antibody (rat monoclonal) | BioLegend | Cat# 101208; RRID:AB_312791 | FACS (5 × 10⁻³ μL/1 × 106 cell) |
| Antibody | PE anti-mouse CD150 (SLAM) antibody (rat monoclonal) | BioLegend | Cat# 115904; RRID:AB_313683 | FACS (0.1 μL/1 × 106 cell) |
| Antibody | PE anti-mouse CD16/32 antibody (rat monoclonal) | BioLegend | Cat# 101308; RRID:AB_312807 | FACS (2.5 × 10⁻² μL/1 × 106 cell) |
| Antibody | PE anti-mouse CD127 (IL-7Rα) antibody (rat monoclonal) | BioLegend | Cat# 135010; RRID:AB_1937251 | FACS (0.1 μL/1 × 106 cell) |
| Antibody | PE anti-mouse Ly-6G/Ly-6C (Gr-1) antibody (rat monoclonal) | BioLegend | Cat# 108408; RRID:AB_313373 | FACS (2.5 × 10⁻³ μL/1 × 106 cell) |
| Antibody | PE anti-mouse CD8a antibody (rat monoclonal) | BioLegend | Cat# 100708; RRID:AB_312747 | FACS (0.2 μL/1 × 106 cell) |
| Antibody | PE anti-mouse CD43 antibody (rat monoclonal) | BioLegend | Cat# 143206; RRID:AB_11124719 | FACS (2.5 × 10⁻² μL/1 × 106 cell) |
| Antibody | PE anti-mouse F4/80 antibody (rat monoclonal) | BioLegend | Cat# 123110; RRID:AB_8934865 | FACS (0.1 μL/1 × 106 cell) |
| Antibody | PE/Cyanine7 anti-mouse Ly-6A/E (Sca-1) antibody (rat monoclonal) | BioLegend | Cat# 108114; RRID:AB_493596 | FACS (2.5 × 10⁻² μL/1 × 106 cell) |
| Antibody | PE/Cyanine7 anti-mouse CD45.1 antibody (mouse monoclonal) | BioLegend | Cat# 110730; RRID:AB_1134168 | FACS (4 × 10⁻² μL/1 × 106 cell) |
| Antibody | CD34 monoclonal antibody (RAM34), FITC (rat monoclonal) | eBioscience | Cat# 11-0341-85; RRID:AB_1465022 | FACS (0.25 μL/1 × 106 cell) |
| Antibody | FITC anti-mouse Ly-6D antibody (rat monoclonal) | BioLegend | Cat# 138606; RRID:AB_11203888 | FACS (2.5 × 10⁻² μL/1 × 106 cell) |
| Antibody | FITC anti-mouse IgM antibody (rat monoclonal) | BioLegend | Cat# 406506; RRID:AB_315056 | FACS (5 × 10⁻² μL/1 × 106 cell) |
| Antibody | FITC anti-mouse Ly6C antibody (rat monoclonal) | BioLegend | Cat# 128005; RRID:AB_1186134 | FACS (0.1 μL/1 × 106 cell) |
| Antibody | Ki-67 monoclonal antibody (SolA15), FITC (rat monoclonal) | eBioscience | Cat# 11-5698-82; RRID:AB_11151330 | FACS (0.25 μL/1 × 106 cell) |
| Antibody | Alexa Fluor 488 anti-mouse CD105 antibody (rat monoclonal) | BioLegend | Cat# 120406; RRID:AB_961053 | FACS (0.25 μL/1 × 106 cell) |
| Antibody | violetFluor 450 anti-mouse CD45.2 (104) (mouse monoclonal) | Tonbo Biosciences | Cat# 75-0454; RRID:AB_2621950 | FACS (4 × 10⁻² μL/1 × 106 cell) |
| Antibody | Brilliant Violet 421 anti-mouse CD135 antibody (rat monoclonal) | BioLegend | Cat# 135314; RRID:AB_2562339 | FACS (0.25 μL/1 × 106 cell) |
| Antibody | Brilliant Violet 421 anti-mouse CD150 (SLAM) antibody (rat monoclonal) | BioLegend | Cat# 115925; RRID:AB_10896787 | FACS (0.1 μL/1 × 106 cell) |
| Antibody | Brilliant Violet 421 anti-mouse Ly6G antibody (rat monoclonal) | BioLegend | Cat# 127627; RRID:AB_10897944 | FACS (0.1 μL/1 × 106 cell) |
| Antibody | Brilliant Violet 510 anti-mouse CD16/32 antibody (rat monoclonal) | BioLegend | Cat# 101333; RRID:AB_2563692 | FACS (2.5 × 10⁻² μL/1 × 106 cell) |
| Antibody | CD34 monoclonal antibody (RAM34), eFluor 450 (rat monoclonal) | eBioscience | Cat# 48-0341-82; RRID:AB_2043837 | FACS (0.25 μL/1 × 106 cell) |
| Antibody | Brilliant Violet 605 Streptavidin | BioLegend | Cat# 405229 | FACS (5 × 10⁻² μL/1 × 106 cell) |
| Antibody | V500 mouse anti-mouse CD45.2 (mouse monoclonal) | BD Biosciences | Cat# 562129; RRID:AB_10897142 | FACS (4 × 10⁻² μL/1 × 106 cell) |
| Antibody | BV510 Mouse Anti-Mouse CD45.1 (mouse monoclonal) | BD Biosciences | Cat# 565278; RRID:AB_2739150 | FACS (4 × 10⁻² μL/1 × 106 cell) |
| Antibody | Ubiquityl-Histone H2A (Lys119) (D27C4) XP rabbit mAb (rabbit monoclonal) | Cell Signaling Technology | Cat# 8240S; RRID:AB_10891618 | ChIP (2 μg) |
| Antibody | Anti-trimethyl-Histone H3 (Lys27) antibody (rabbit polyclonal) | Millipore | Cat# 07-449; RRID:AB_310624 | ChIP (2 μg) |
| Antibody | Monoclonal anti-FLAG M2, antibody produced in mouse (mouse monoclonal) | Sigma | Cat# F1084 | ChIP (2 μg) |
| Antibody | β-Catenin (6B3) rabbit mAb (rabbit monoclonal) | Cell Signaling Technology | Cat# 9582S; RRID:AB_823447 | IF (1:100) |
| Antibody | Human/mouse CD117/c-kit antibody (goat polyclonal) | R&D Systems | Cat# AF1356; RRID:AB_354750 | IF (1:100) |
| Antibody | CD41a monoclonal antibody (eBioMWReg30 (MWReg30)), Biotin (rat monoclonal) | eBioscience | Cat# 13-0411-85; RRID:AB_763489 | IF (1:200) |
| Antibody | Alexa Fluor 647 anti-mouse CD16/32 antibody (rat monoclonal) | BioLegend | Cat# 101314; RRID:AB_2278396 | IF (1:50) |
| Antibody | Biotin anti-mouse Ly-6A/E (Sca-1) antibody (rat monoclonal) | BioLegend | Cat# 108104; RRID:AB_313341 | IF (1:100) |
| Antibody | Streptavidin, Alexa Fluor 488 conjugate | Invitrogen | Cat# S11223 | IF (1:200) |
| Antibody | Donkey anti-rabbit IgG (H+L), highly cross-adsorbed antibody, CF488A conjugated (donkey polyclonal) | Biotium | Cat# 20015; RRID:AB_10559669 | IF (1:400) |
| Antibody | Donkey anti-goat IgG (H+L) cross-adsorbed secondary antibody, Alexa Fluor 555 (donkey polyclonal) | Invitrogen | Cat# A-21432; RRID:AB_2535853 | IF (1:400) |
| Antibody | Donkey anti-goat IgG (H+L) cross-adsorbed secondary antibody, Alexa Fluor 568 (donkey polyclonal) | Invitrogen | Cat# A-11057; RRID:AB_2534104 | IF (1:400) |
| Sequence-based reagent | Primer pairs for genotyping | This study | Supplementary file 5 | |
| Sequence-based reagent | Primer pairs for qPCR | Universal ProbeLibrary Assay Design Center (Roche) | Supplementary file 5 | |
| Sequence-based reagent | Primer pairs for ChIP-qPCR | This study | Supplementary file 5 | |
| Peptide, recombinant protein | Micrococcal Nuclease | New England BioLabs | M0247S | |
| Peptide, recombinant protein | RNase A | Sigma-Aldrich | R6513 | |
| Peptide, recombinant protein | Proteinase K | Roche | 3115852001 | |
| Peptide, recombinant protein | Recombinant mouse IL-7 (carrier-free) | BioLegend | 577802 | |
| Peptide, recombinant protein | Recombinant mouse SCF (carrier-free) | BioLegend | 579706 | |
| Peptide, recombinant protein | Recombinant human TPO (carrier-free) | BioLegend | 763706 | |
| Peptide, recombinant protein | Recombinant mouse IL-3 (carrier-free) | BioLegend | 575506 | |
| Peptide, recombinant protein | Recombinant murine GM-CSF | PeproTech | 315-03 | |
| Peptide, recombinant protein | Recombinant human Flt3-ligand | PeproTech | 300-19 | |
| Peptide, recombinant protein | Recombinant murine IL-11 | PeproTech | 220-11 | |
| Commercial assay or kit | RNeasy Micro Plus Kit | QIAGEN | 74034 | |
| Commercial assay or kit | TRI Reagent LS | MOR | TS120 | |
| Commercial assay or kit | SuperScript IV First-Strand Synthesis System | Invitrogen | 18091050 | |
| Commercial assay or kit | ReverTra Ace a- | TOYOBO | FSQ-301 | |
| Commercial assay or kit | FastStart Universal Probe Master | Roche | 4914058001 | |
| Commercial assay or kit | Methocult M3234 | STEMCELL Technologies | 03234 | |
| Commercial assay or kit | BD Phosflow Lyse/Fix Buffer | BD Biosciences | 558049 | |
| Commercial assay or kit | BD Phosflow Perm Buffer II | BD Biosciences | 558052 | |
| Commercial assay or kit | TB Green Premix Ex Taq II | Takara Bio | RR820S | |
| Commercial assay or kit | cOmplete, Mini, Protease Inhibitor Cocktail | Roche | 11836170001 | |
| Commercial assay or kit | Dynabeads M-280 sheep anti-rabbit IgG | Invitrogen | 11203D | |
| Commercial assay or kit | Dynabeads M-280 sheep anti-mouse IgG | Invitrogen | 11202D | |
| Commercial assay or kit | MinElute PCR Purification Kit | QIAGEN | 28006 | |
| Commercial assay or kit | SMART-Seq v4 Ultra Low Input RNA Kit | Clontech | 634890 | |
| Commercial assay or kit | NEBNext Ultra DNA Library Prep Kit | New England BioLabs | E7370 | |
| Commercial assay or kit | ThruPLEX DNA-seq Kit | Clontech | R400428 | |
| Commercial assay or kit | Tagment DNA buffer | Illumina | 15027866 | |
| Commercial assay or kit | Tagment DNA enzyme | Illumina | 15027865 | |
| Commercial assay or kit | SYBER Green I Nucleic Acid gel Stain | Takara Bio | 5761A | |
| Commercial assay or kit | NEBNext High Fidelity 2x PCR Master mix | New England BioLabs | M0541S | |
| Commercial assay or kit | Chromium Next GEM Single Cell 3ʹ Reagent Kits v3.1 | 10X Genomics | 1000269 | |
| Commercial assay or kit | O.T.C Compound | Sakura | D3571 | |
| Commercial assay or kit | ProLong Glass Antifade Mountant | Thermo Scientific | P36982 | |
| Commercial assay or kit | Avidin/Biotin Blocking Kit | VECTOR | SP-2001 | |
| Chemical compound, drug | Tamoxifen | Sigma-Aldrich | T5648 | |
| Chemical compound, drug | 4-Hydroxytamoxifen | Sigma-Aldrich | H7904 | |
| Chemical compound, drug | Corn oil | Sigma-Aldrich | C8267 | |
| Chemical compound, drug | Propidium iodide | Sigma-Aldrich | P4170 | |
| Chemical compound, drug | 7-AAD | Sigma-Aldrich | A9400 | 1 μg/mL |
| Chemical compound, drug | 2-Mercaptoethanol (2-ME) | Sigma-Aldrich | M3148 | |
| Chemical compound, drug | Formaldehyde solution (FA) | Sigma-Aldrich | F8775 | |
| Chemical compound, drug | IGEPAL CA-630 | Sigma-Aldrich | I8896 | |
| Chemical compound, drug | Sodium pyrubate | Thermo Scientific | 11360070 | |
| Chemical compound, drug | DAPI | Invitrogen | D3571 | 1 μg/mL |
| Chemical compound, drug | Pierce 16% formaldehyde (w/v), methanol-free | Thermo Scientific | 28906 | 8% |
| Chemical compound, drug | 5-fluorouracil (5-FU) | Kyowa KIRIN | 5-FU 250 mg | 3.75 mg per 25 g body weight mouse |
| Software, algorithm | Prism 9 | GraphPad | https://www.graphpad.com/ | |
| software, algorithm | L-Calc | STEMCELL Technologies | https://www.stemcell.com/l-calc-software.html | |
| Software, algorithm | Gene set enrichment analysis | Broad Institute | http://software.broadinstitute.org/gsea/index.jsp | |
| Software, algorithm | g:Profiler | Raudvere et al., 2019. | https://biit.cs.ut.ee/gprofiler/ | |
| Software, algorithm | Integrate Genomics Viewer v2.4.4 | Broad Institute | https://software.broadinstitute.org/software/igv/ | |
| Software, algorithm | Fiji | Schindelin et al., 2012. | https://fiji.sc | |
| Software, algorithm | ImageJ | National Institutes of Health | https://imagej.nih.gov/ij/index.html | |
| Other | Normal donkey serum | Jackson ImmunoResearch | 017-000-121 | Blocking reagent for immunostaining |
| Other | S-Clone SF-O3 | EIDIA Co., Ltd | 1303 | Medium for cell cluture |
| Other | 10% bovine serum albumin in Iscove’s MDM | STEMCELL Technologies | 09300 | Supplement for cell cluture |
Additional files
-
MDAR checklist
- https://cdn.elifesciences.org/articles/83004/elife-83004-mdarchecklist1-v2.pdf
-
Supplementary file 1
List of gene sets for GSEA.
- https://cdn.elifesciences.org/articles/83004/elife-83004-supp1-v2.xlsx
-
Supplementary file 2
List of target genes of PRC1, PRC2, and PCGF1 and bivalent genes in LSK cells.
- https://cdn.elifesciences.org/articles/83004/elife-83004-supp2-v2.xlsx
-
Supplementary file 3
DNA motifs identified in ATAC peaks at proximal promoters enriched in Pcgf1Δ/Δ CD135- LSK cells (Top 12 motifs).
- https://cdn.elifesciences.org/articles/83004/elife-83004-supp3-v2.xlsx
-
Supplementary file 4
List of differentially expressed genes (DEGs) in GMPs and those overlapped between "5-FU day 8 vs day 0 GMPs" and "Control vs Pcgf1Δ/Δ GMPs.
- https://cdn.elifesciences.org/articles/83004/elife-83004-supp4-v2.xlsx
-
Supplementary file 5
List of oligonucleptide and TaqMan gene expression assay materials.
- https://cdn.elifesciences.org/articles/83004/elife-83004-supp5-v2.xlsx
Download links
A two-part list of links to download the article, or parts of the article, in various formats.
Downloads (link to download the article as PDF)
Open citations (links to open the citations from this article in various online reference manager services)
Cite this article (links to download the citations from this article in formats compatible with various reference manager tools)
Polycomb repressive complex 1.1 coordinates homeostatic and emergency myelopoiesis
eLife 12:e83004.
https://doi.org/10.7554/eLife.83004


