Protein composition of axonal dopamine release sites in the striatum
- Department of Neurobiology, Harvard Medical School, United States
Figures
Figure 1 with 2 supplements
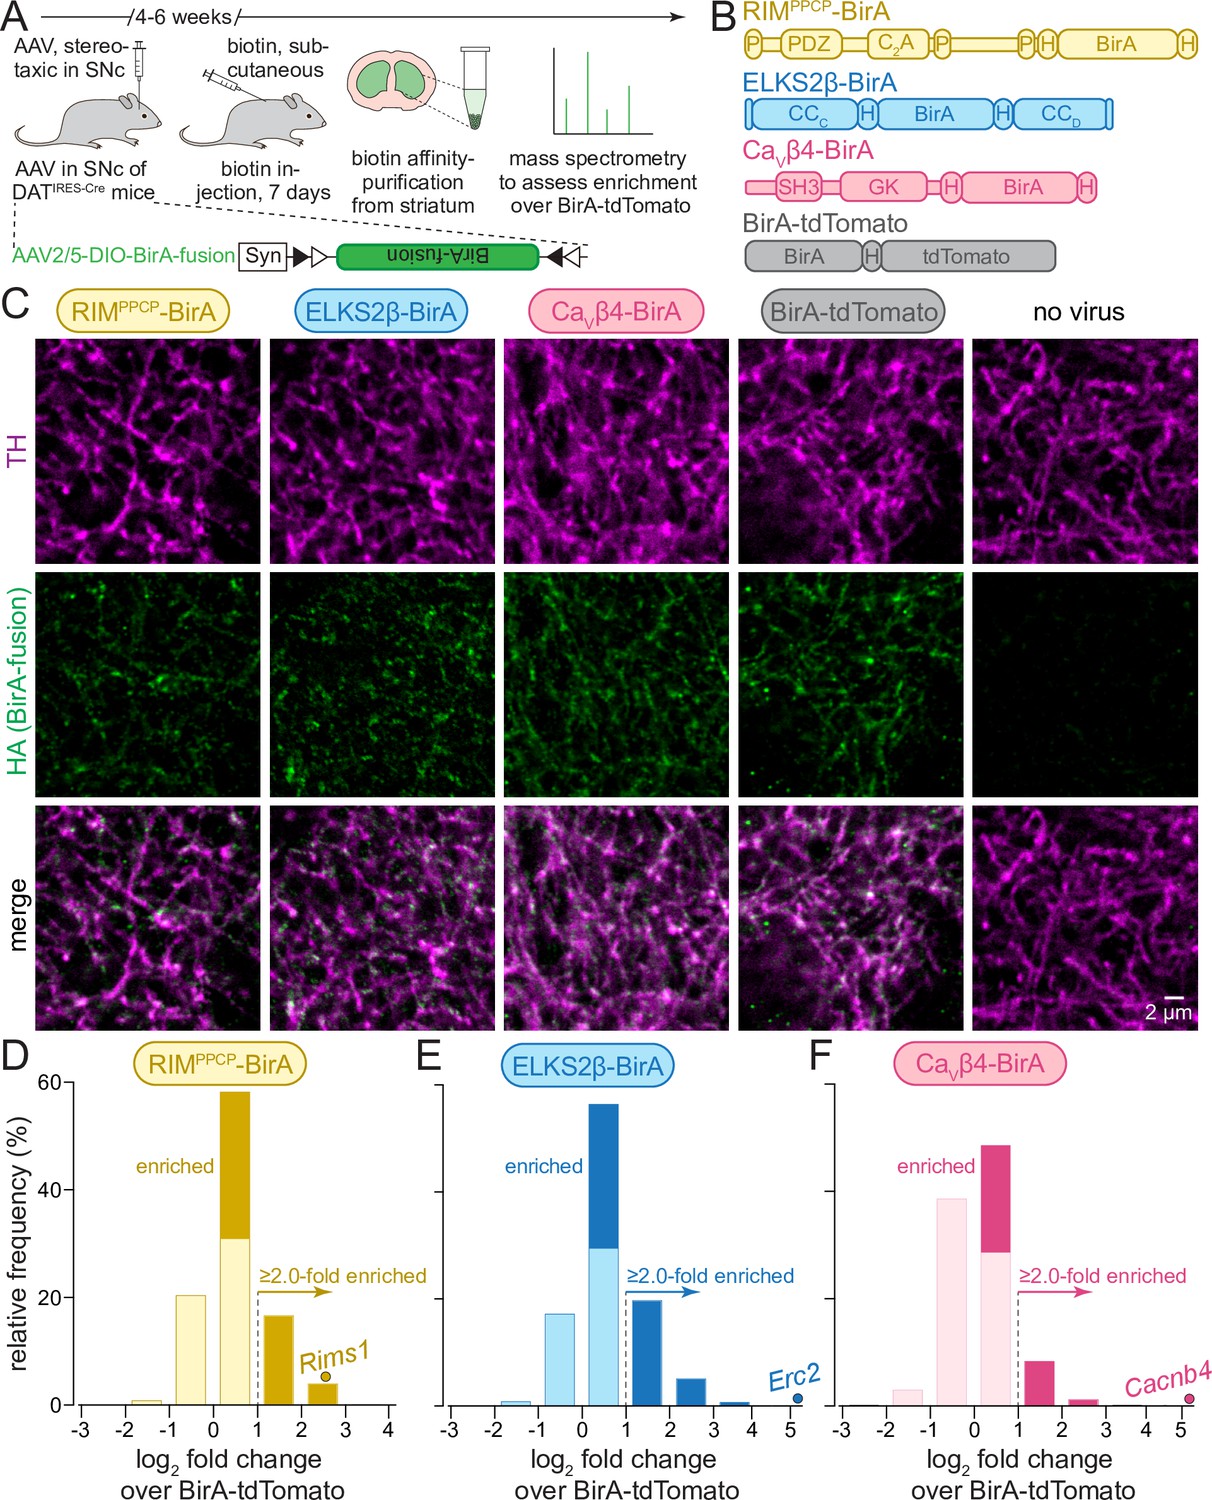
In vivo biotin identification (iBioID) for release site proteins in dopamine axons of the mouse striatum.
(A) Schematic of the experiment with AAVs for Cre-dependent BirA fusion protein expression (AAV2/5-DIO-BirA-fusion), followed by in vivo biotinylation, affinity purification, and analyses by mass spectrometry. (B) Overview of BirA fusion proteins expressed Cre-dependently with AAVs in midbrain dopamine neurons of DATIRES-Cre mice, P: proline-rich motif, H: hemagglutinin (HA) tag. Each mouse expressed one of the three BirA baits (RIMPPCP-BirA, ELKS2β-BirA, and CaVβ4-BirA) or BirA-tdTomato (to generate a proteome for normalization). (C) Sample confocal images of striatal slices of DATIRES-Cre mice expressing the BirA fusion proteins shown in (B), slices were stained with anti-TH antibodies and anti-HA antibodies to label dopamine axons and BirA fusion proteins, respectively. Images are from an experiment in which all constructs were imaged in the same session and with the same settings, and adjusted identically for display, except for ELKS2β-BirA. Images for ELKS2β-BirA were acquired in a separate experiment and with its own control; these images were adjusted for brightness and contrast slightly differently to match overall appearance, and adjustments were identical to those made to its own control acquired at the same time and shown in Figure 1—figure supplement 1. A sample image area is shown from 3 to 5 overview images per mouse and condition, each experiment was repeated in ≥3 mice. (D–F) Protein enrichment in BirA bait conditions over BirA-tdTomato. Log2 fold change values are plotted as frequency histograms. Values at or below 0 represent proteins that are equal to or lower than in the BirA-tdTomato condition (light colors), values >0 represent proteins that are higher than in the BirA-tdTomato condition (saturated colors), and values ≥1 represent hits with ≥2.0-fold enrichment; (D) 1306 total proteins identified, 659 proteins with log2 fold change >0, and 269 proteins with log2 fold change ≥1 (hits); (E) 1496/805/382; (F) 1168/354/114. The gene encoding the protein that was used as a bait is shown as a dot and labeled individually in each panel; (D) 4 independent repeats (12 striata each); (E) 4 (12/12/12/10); (F) 4 (12/12/12/10). For sample images of the negative control for ELKS2β-BirA, see Figure 1—figure supplement 1; for pilot iBioID experiments and assessment of self-biotinylation, see Figure 1—figure supplement 2; for a table of all proteins identified, see Source data 1A; for cDNA sequences used to generate the fusion proteins, see Source data 1B.
Figure 1—figure supplement 1

Sample images for ELKS2β-BirA expression.
Sample confocal images of a striatal section after viral expression of EKLS2β-BirA (images identical to the ones shown in Figure 1C) or without viral expression of a BirA fusion protein; images were acquired at the same time and adjusted identically for contrast and brightness. The experiment was performed as described in Figure 1.
Figure 1—figure supplement 2
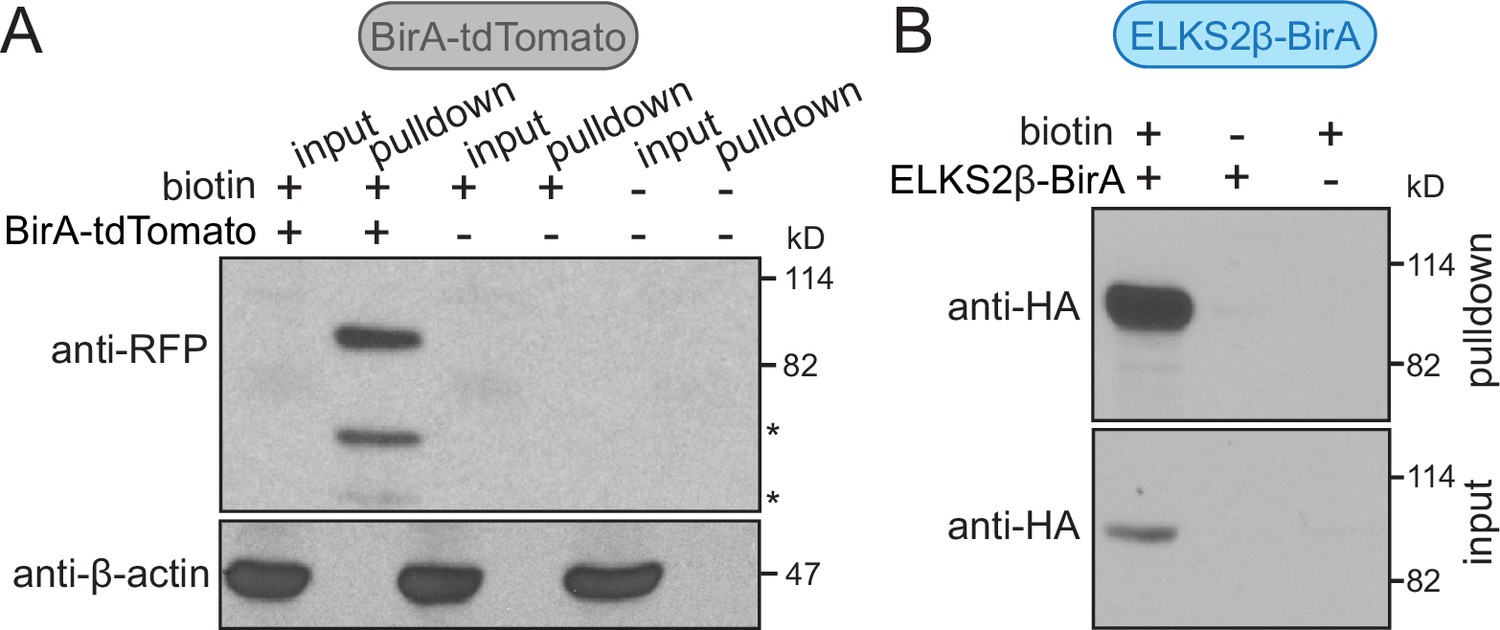
BirA fusion proteins are self-biotinylated and purified with iBioID.
(A) Western blots of striatal lysates (input) and the pellet of the affinity-purified fractions (pulldown) are shown. The striata were harvested from mice that were injected with AAVs expressing BirA-tdTomato in dopamine neurons, or from uninjected control mice, with or without subcutaneous injection of biotin. For a timeline of the experiment, see Figure 1A. BirA-tdTomato was detected with anti-red fluorescent protein (RFP) antibodies. The RFP bands, reflecting self-biotinylated BirA-tdTomato, were only detected in mice subcutaneously injected with biotin, but not when biotin was not supplied or when BirA-tdTomato was not expressed. β-Actin was present in the brain input, but was depleted during affinity purification. BirA-tdTomato expression is too low to be detected in the input given that dopamine axons account at most for a few % of the striatal volume. The full-length BirA-tdTomato protein has a molecular weight of 91 kD. Because the smaller molecular weight bands detected with the anti-RFP antibodies (marked with *) are only present when BirA-tdTomato is enriched, they are likely degradation products. Western blots are from a single qualitative pilot experiment, 2 striata per condition. (B) Same as (A), but in mice expressing ELKS2β-BirA. ELKS2β-BirA is detected with anti-HA antibodies; Western blots from a single qualitative pilot experiment, 4 striata per condition. These experiments reveal that BirA fusion proteins are self-biotinylated in vivo after biotin injections and are purified with iBioID. The purification is specific enough to reduce contamination by strongly expressed proteins present in all cells, for example, β-actin. For unedited scans of Western blots, see Figure 1—figure supplement 2—source data 1 and 2.
-
Figure 1—figure supplement 2—source data 1
Western blots for Figure 1 – figure supplement 2A.
(A) Original scan (5 min) of anti-RFP Western blots shown in Figure 1—figure supplement 2A. (B) Grayscale scans (left) and brightness and contrast-adjusted scans (right) of Western blots shown in Figure 1—figure supplement 2A. Stars denote bands that are likely degradation products of the BirA-tdTomato fusion protein. Arrows denote bands that are likely cross-reactive; they are present independent of BirA-tdTomato expression and are strong in intensity because a long exposure is shown and a large amount of input was loaded. (C) Original scan (3 s) of anti-β-actin Western blots shown in Figure 1—figure supplement 2A. (D) Grayscale scans (left) and brightness and contrast-adjusted scans (right) of Western blots shown in Figure 1—figure supplement 2A. Arrowheads denote bands that likely represent synapsin isoforms.
- https://cdn.elifesciences.org/articles/83018/elife-83018-fig1-figsupp2-data1-v2.zip
-
Figure 1—figure supplement 2—source data 2
Western blots for Figure 1 – figure supplement 2B.
(A) Original scan (5 min) of anti-HA Western blots shown in Figure 1—figure supplement 2B. (B) Grayscale scans (left) and brightness and contrast-adjusted scans (right) of Western blots shown in Figure 1—figure supplement 2B.
- https://cdn.elifesciences.org/articles/83018/elife-83018-fig1-figsupp2-data2-v2.zip
Figure 2 with 4 supplements
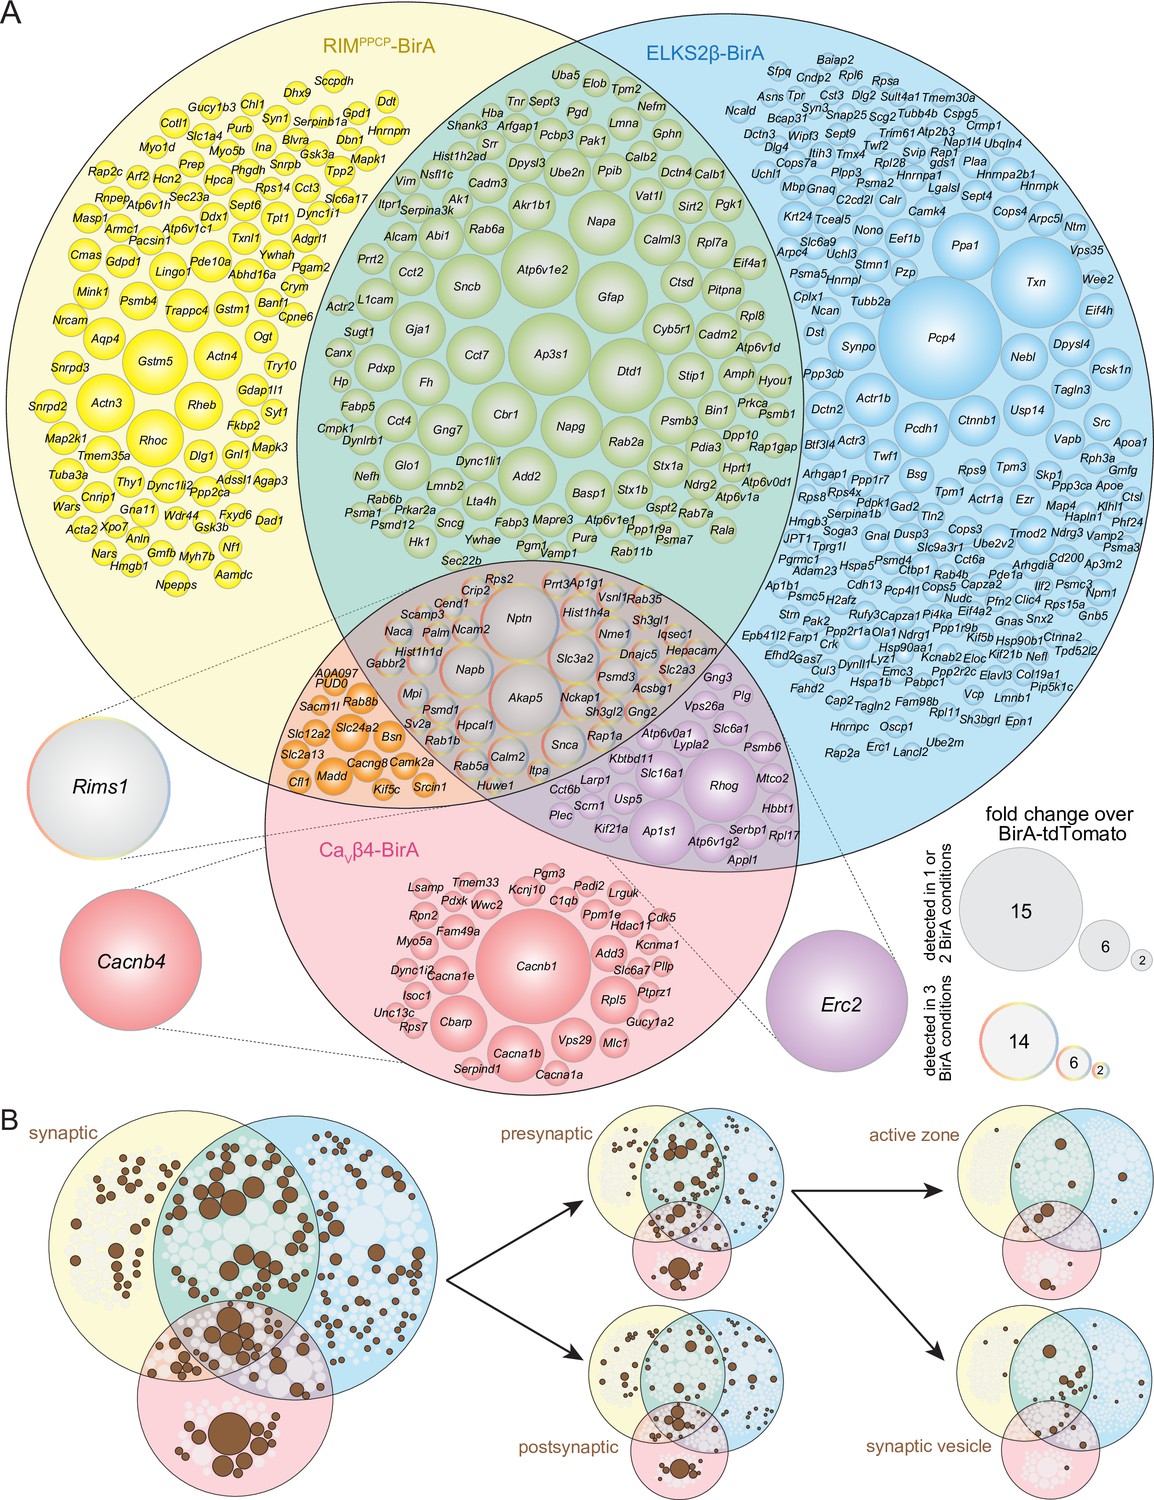
Protein composition of release sites in dopamine axons.
(A) Venn diagram listing genes that encode protein hits enriched at least 2.0-fold over BirA-tdTomato with RIMPPCP-BirA, ELKS2β-BirA, or CaVβ4-BirA iBioID baits. Bait-encoding genes are shown outside the Venn diagram in the color of the corresponding part of the diagram. Enrichment is shown as the average of 4 independent repeats run in 2 mass spectrometry sessions (repeats 1 and 2 in the first session, repeats 3 and 4 in the second) and was calculated as described in the 'Materials and methods.' Circle size reflects average enrichment across repeats (key on the bottom right). For proteins enriched in multiple bait conditions, circle size corresponds to the bait condition with the largest enrichment. (B) Hits from (A) that have cellular compartment annotations in the SynGO database (Koopmans et al., 2019) are colored in brown and are classified into increasingly specific SynGO subcategories, subcategorizations are not mutually exclusive; proteins used as baits are not included. For a list of hits, see Source data 1C; for Venn diagrams constructed with 1.5- and 2.5-fold enrichment thresholds, see Figure 2—figure supplements 1 and 2; for a comparison of SynGO cellular compartment annotations across thresholds, see Figure 2—figure supplement 3; and for assessment of Neuroplastin (Nptn) localization in striatal synaptosomes, see Figure 2—figure supplement 4.
Figure 2—figure supplement 1
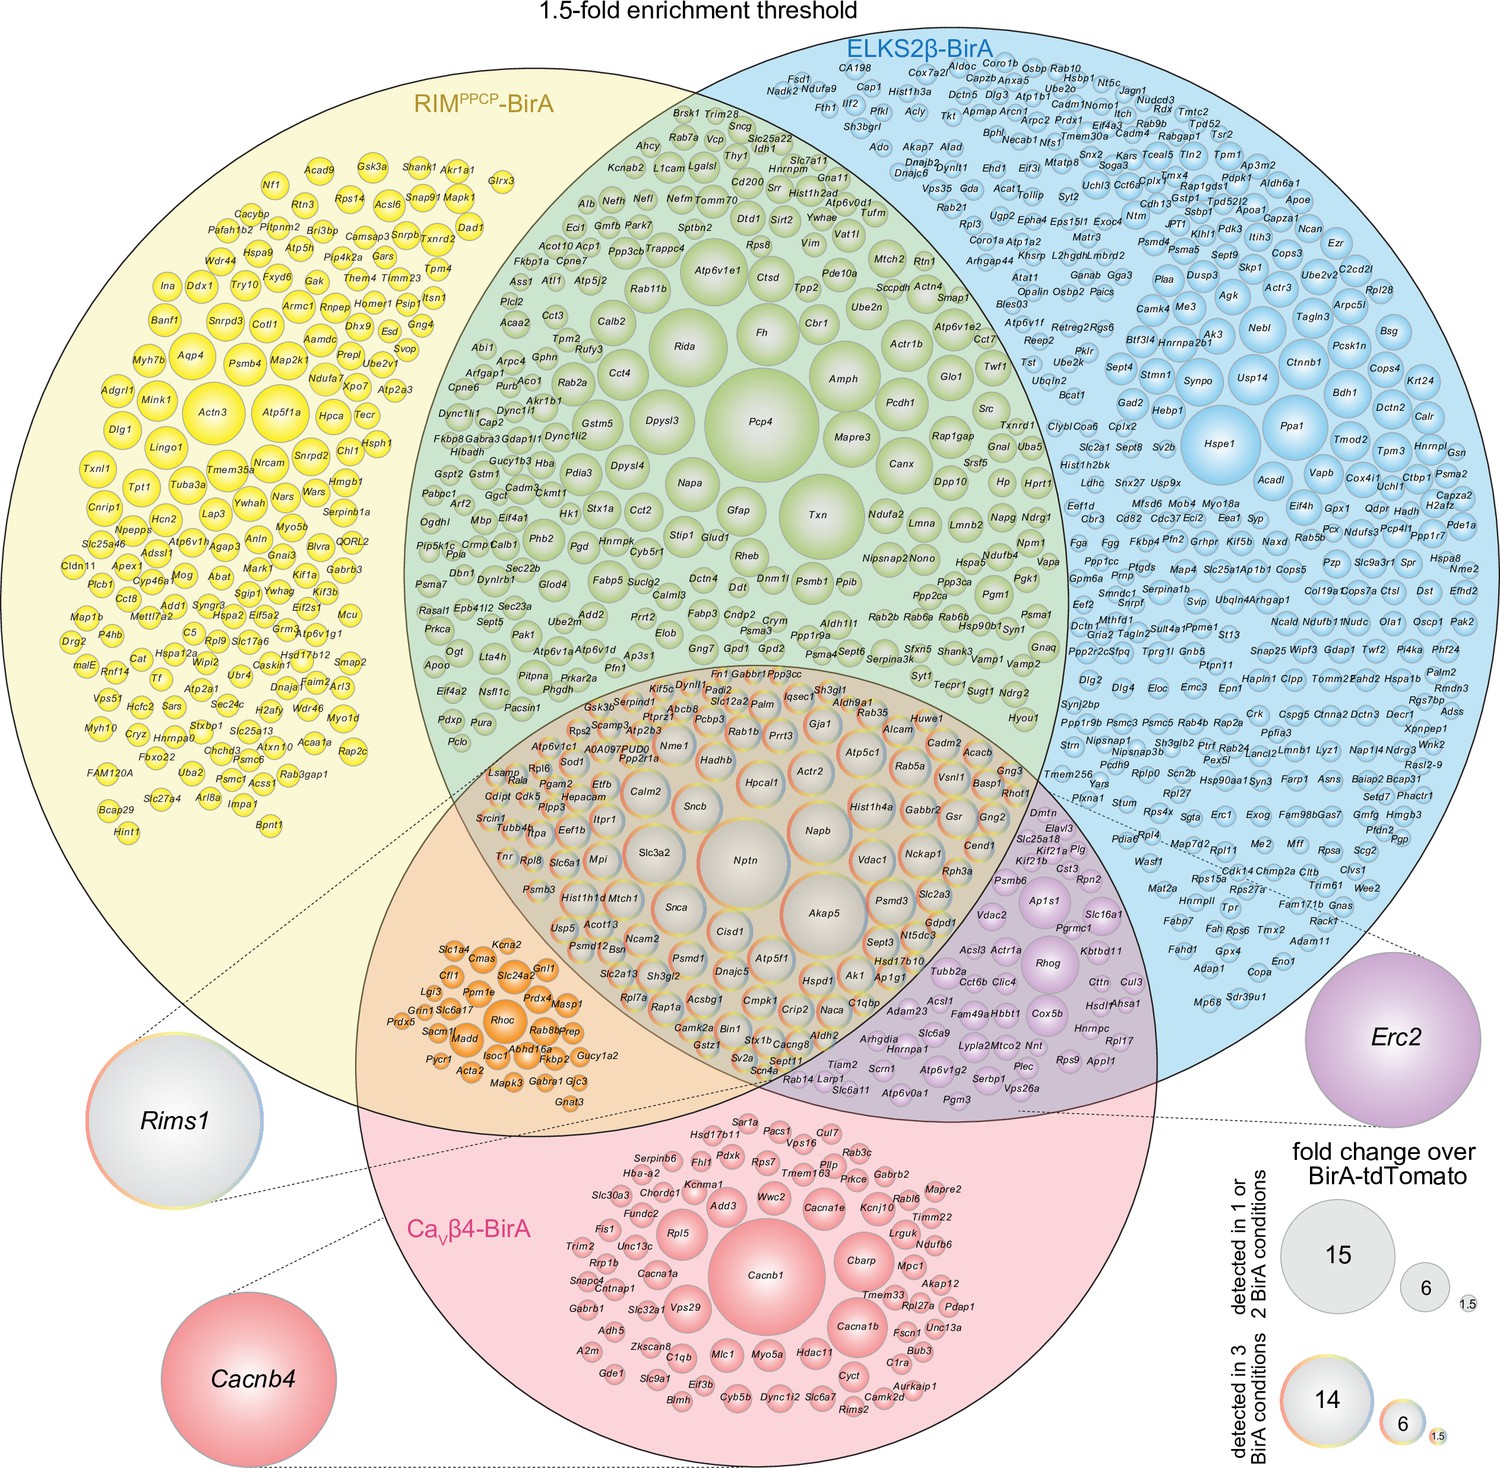
Venn diagram of the dopamine release site proteome with a 1.5-fold enrichment threshold.
Venn diagram listing genes that encode protein hits enriched ≥1.5-fold over BirA-tdTomato (instead of 2.0-fold shown in Figure 2) with RIMPPCP-BirA, ELKS2β-BirA, or CaVβ4-BirA iBioID baits. Bait-encoding genes are shown outside the Venn diagram in the color of the corresponding part of the diagram. Enrichment is shown as the average of 4 independent repeats run in 2 mass spectrometry sessions. Circle size reflects average enrichment across repeats (key on the bottom right). For proteins enriched in multiple bait conditions, circle size corresponds to the bait condition with the largest enrichment. For a list of ≥1.5-fold enriched hits, see Source data 1D.
Figure 2—figure supplement 2
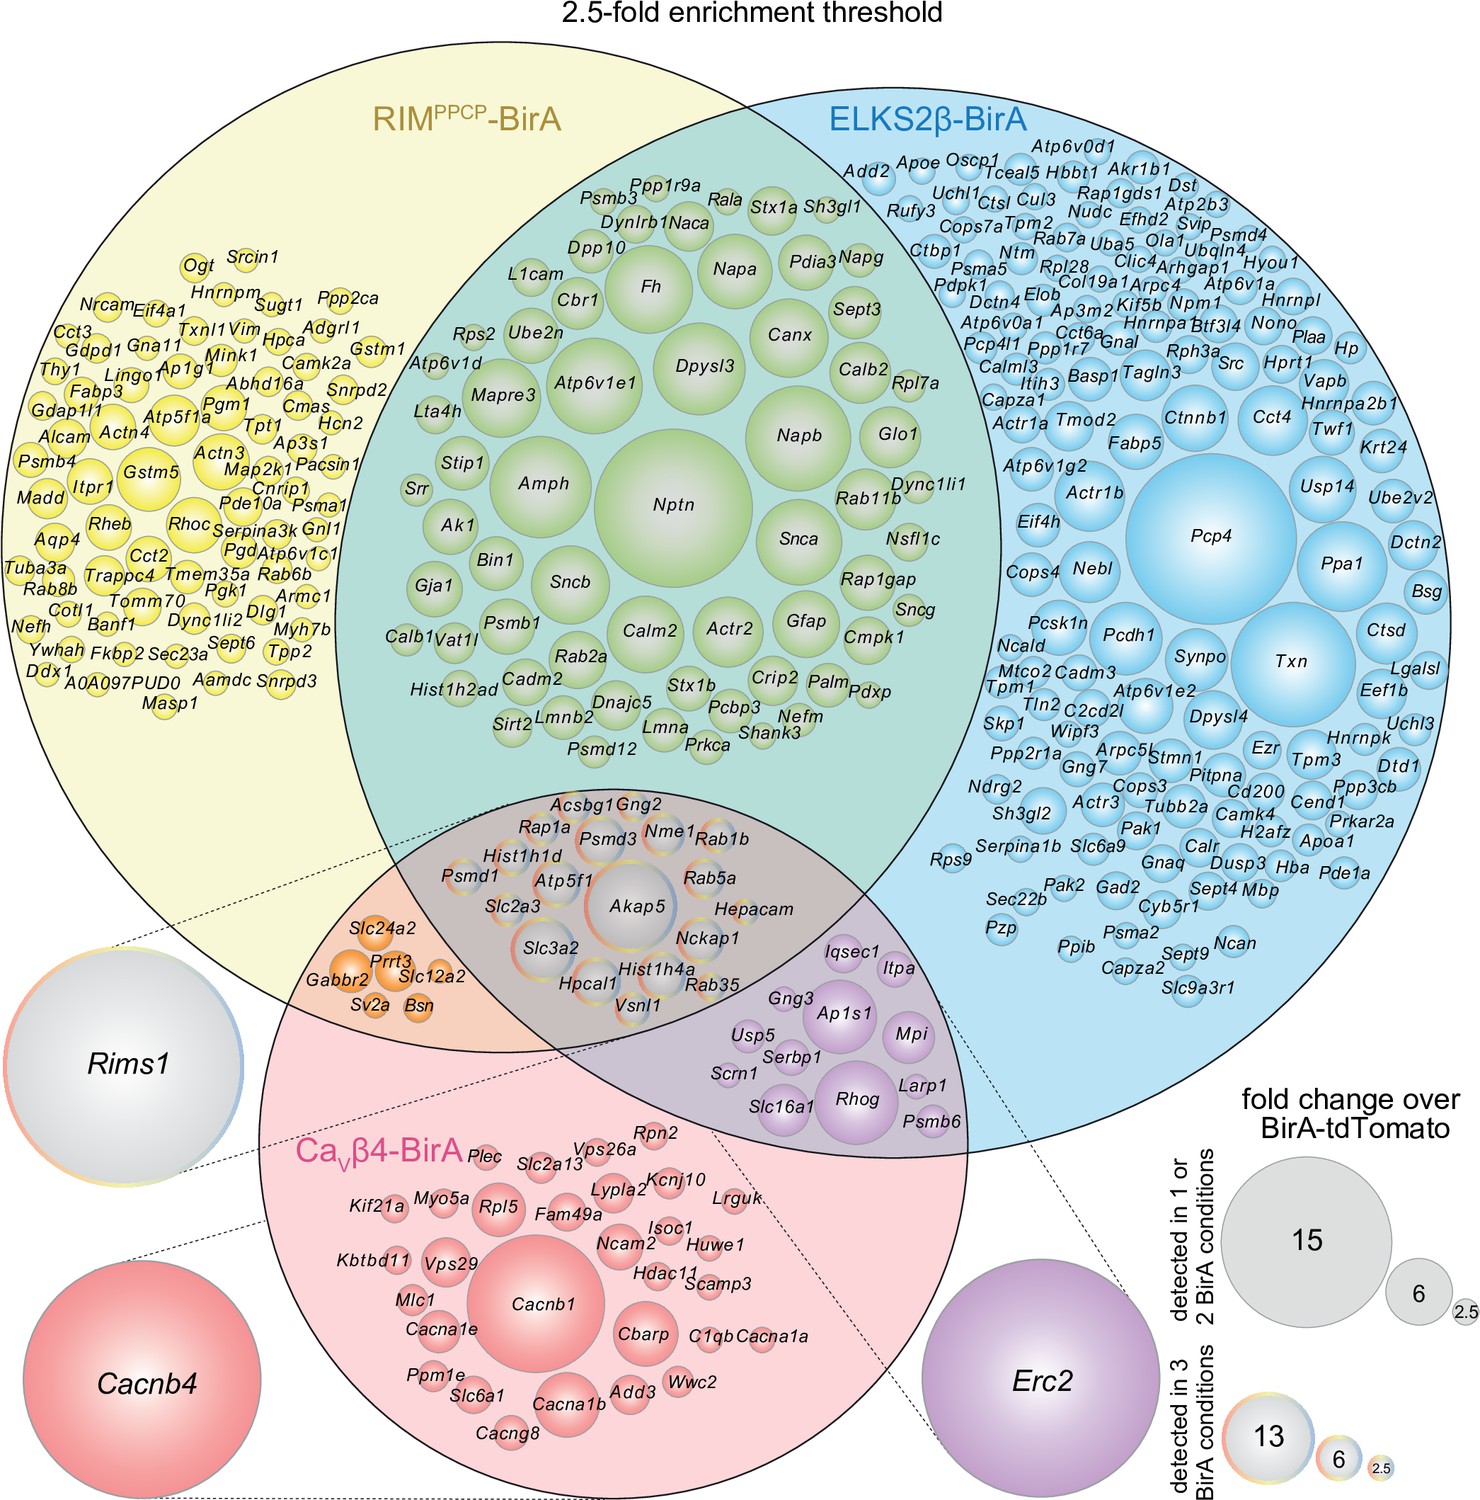
Venn diagram of the dopamine release site proteome with a 2.5-fold enrichment threshold.
Venn diagram listing genes that encode protein hits enriched ≥2.5-fold over BirA-tdTomato (instead of ≥2.0-fold shown in Figure 2) with RIMPPCP-BirA, ELKS2β-BirA, or CaVβ4-BirA iBioID baits. Bait-encoding genes are shown outside the Venn diagram in the color of the corresponding part of the diagram. Enrichment is shown as the average of 4 independent repeats run in 2 mass spectrometry sessions. Circle size reflects average enrichment across repeats (key on the bottom right). For proteins enriched in multiple bait conditions, circle size corresponds to the bait condition with the largest enrichment. For a list of ≥2.5-fold enriched hits, see Source data 1E.
Figure 2—figure supplement 3
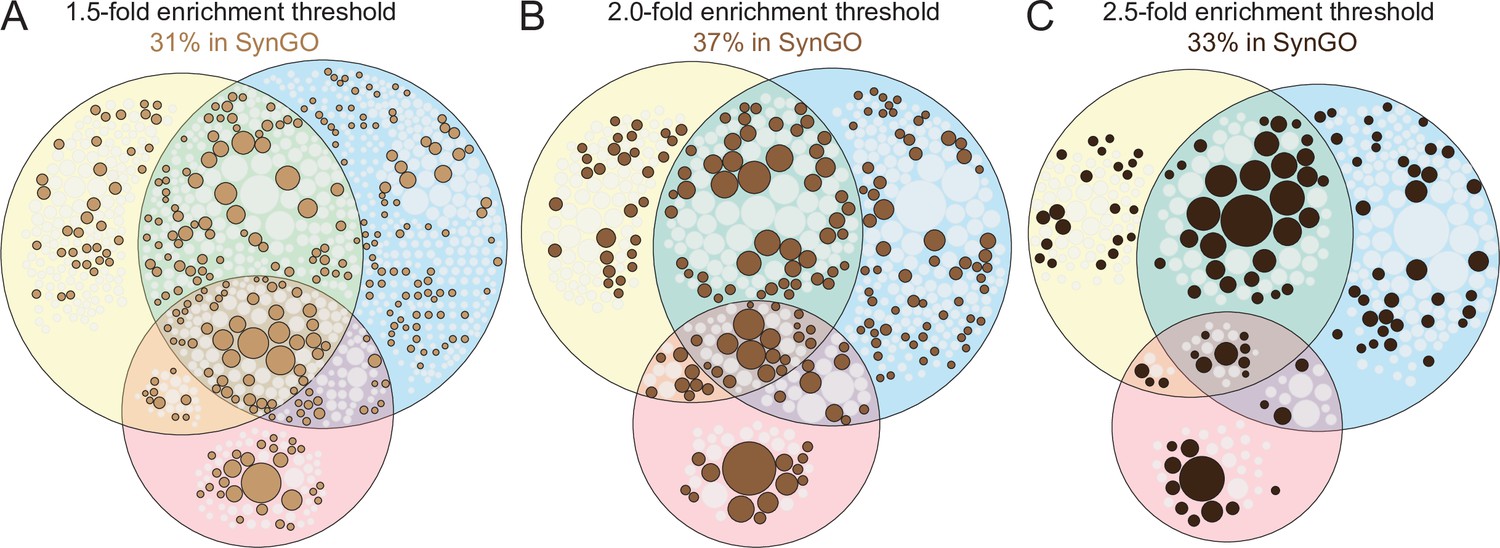
Assessment of release site hits listed in SynGO across enrichment thresholds.
(A–C) Venn diagrams showing hits (without gene names) that are ≥1.5-fold (A), ≥2.0-fold (B, Venn diagram identical to the “synaptic” diagram shown in Figure 2B), or ≥2.5-fold (C) enriched. Proteins that have a cellular compartment annotation in SynGO (Koopmans et al., 2019) are colored in brown, and the diagrams are scaled to have an overall similar size for illustrative purposes; increasing or decreasing the threshold from ≥2.0 did not increase the % hits associated with SynGO.
Figure 2—figure supplement 4

Neuroplastin antibody labeling is enhanced in Bassoon-containing dopaminergic synaptosomes.
(A) Representative confocal images of striatal synaptosomes stained with anti-Bassoon antibodies to mark release sites, anti-tyrosine hydroxylase (TH) antibodies to label dopamine synaptosomes, and anti-Neuroplastin antibodies. Only a fraction of TH-positive particles contains the release site marker Bassoon (filled arrowhead), while many do not (outlined arrowhead) (Liu et al., 2018). (B, C) Quantification of Neuroplastin antibody labeling intensity in TH-positive (TH+) synaptosomes in the experiment shown in (A). Staining intensity within Bassoon-positive (Bassoon+) and Bassoon-negative (Bassoon-) synaptosomes was quantified (B), and an intensity histogram was constructed (C); Bassoon+ TH+ , 1316 synaptosomes/30 images/3 mice; Bassoon- TH+, 5434/30/3. Data are shown as mean ± SEM. ***p<0.001 as assessed by an unpaired t-test (B) or a Kolmogorov–Smirnov test (C).
Figure 3 with 2 supplements

Enrichment of release site proteins after conditional ablation of RIM or of Synaptotagmin-1 from dopamine neurons.
(A) Strategy for ablation of RIM1 and RIM2 (RIM cKODA) or Synaptotagmin-1 (Syt-1 cKODA) from dopamine neurons using conditional mouse genetics (Banerjee et al., 2020; Liu et al., 2018). (B) The average number of peptides per protein in bins of five detected with BirA-tdTomato. The control is from data in Figures 1 and 2 and is the average peptide count of 4 repeats, the proteomes from RIM cKODA and Syt-1 cKODA are an average peptide count of 2 repeats each. The x-axis is cut at a peptide count of 50 covering >99% of the detected proteins. Average number of detected proteins: control, 1195; RIM cKODA, 1155; Syt-1 cKODA, 1011. (C–E) Protein enrichment in BirA bait conditions over BirA-tdTomato in RIM cKODA mice. Log2 fold change values are plotted as frequency histograms. Values at or below 0 represent proteins that are equal to or lower than in the BirA-tdTomato condition (light colors), values >0 represent proteins that are higher than in the BirA-tdTomato condition (saturated colors), and values ≥1 represent hits with ≥2.0-fold enrichment; (C) 1089 total proteins identified, 334 proteins with log2 fold change >0, and 149 proteins with log2 fold change ≥1 (hits); (D) 1003/123/62; (E) 1008/130/65. The gene encoding the protein that was used as a bait is shown as a dot and labeled individually in each panel: (C) 2 independent repeats (10/12 striata); (D) 2 (12/10); (E) 2 (10/12). (F–H) Same as (C–E), but for Syt-1 cKODA mice; (F) 1017 total proteins identified, 424 proteins with log2 fold change >0, and 199 proteins with log2 fold change ≥1 (hits); (G) 1103/619/327; (H) 1016/544/246, (F) 2 independent repeats (10/12 striata); (G) 2 (12/12); (H) 2 (12/12). Two-way ANOVA was used in (B) (genotype: p>0.6, peptide count: p<0.001). For a table of all peptides identified in RIM cKODA, see Source data 1F; for a table of all peptides identified in Syt-1 cKODA, see Source data 1G; and for Venn diagrams of release site protein enrichment, see Figure 3—figure supplement 1 for RIM cKODA and Figure 3—figure supplement 2 for Syt-1 cKODA.
Figure 3—figure supplement 1
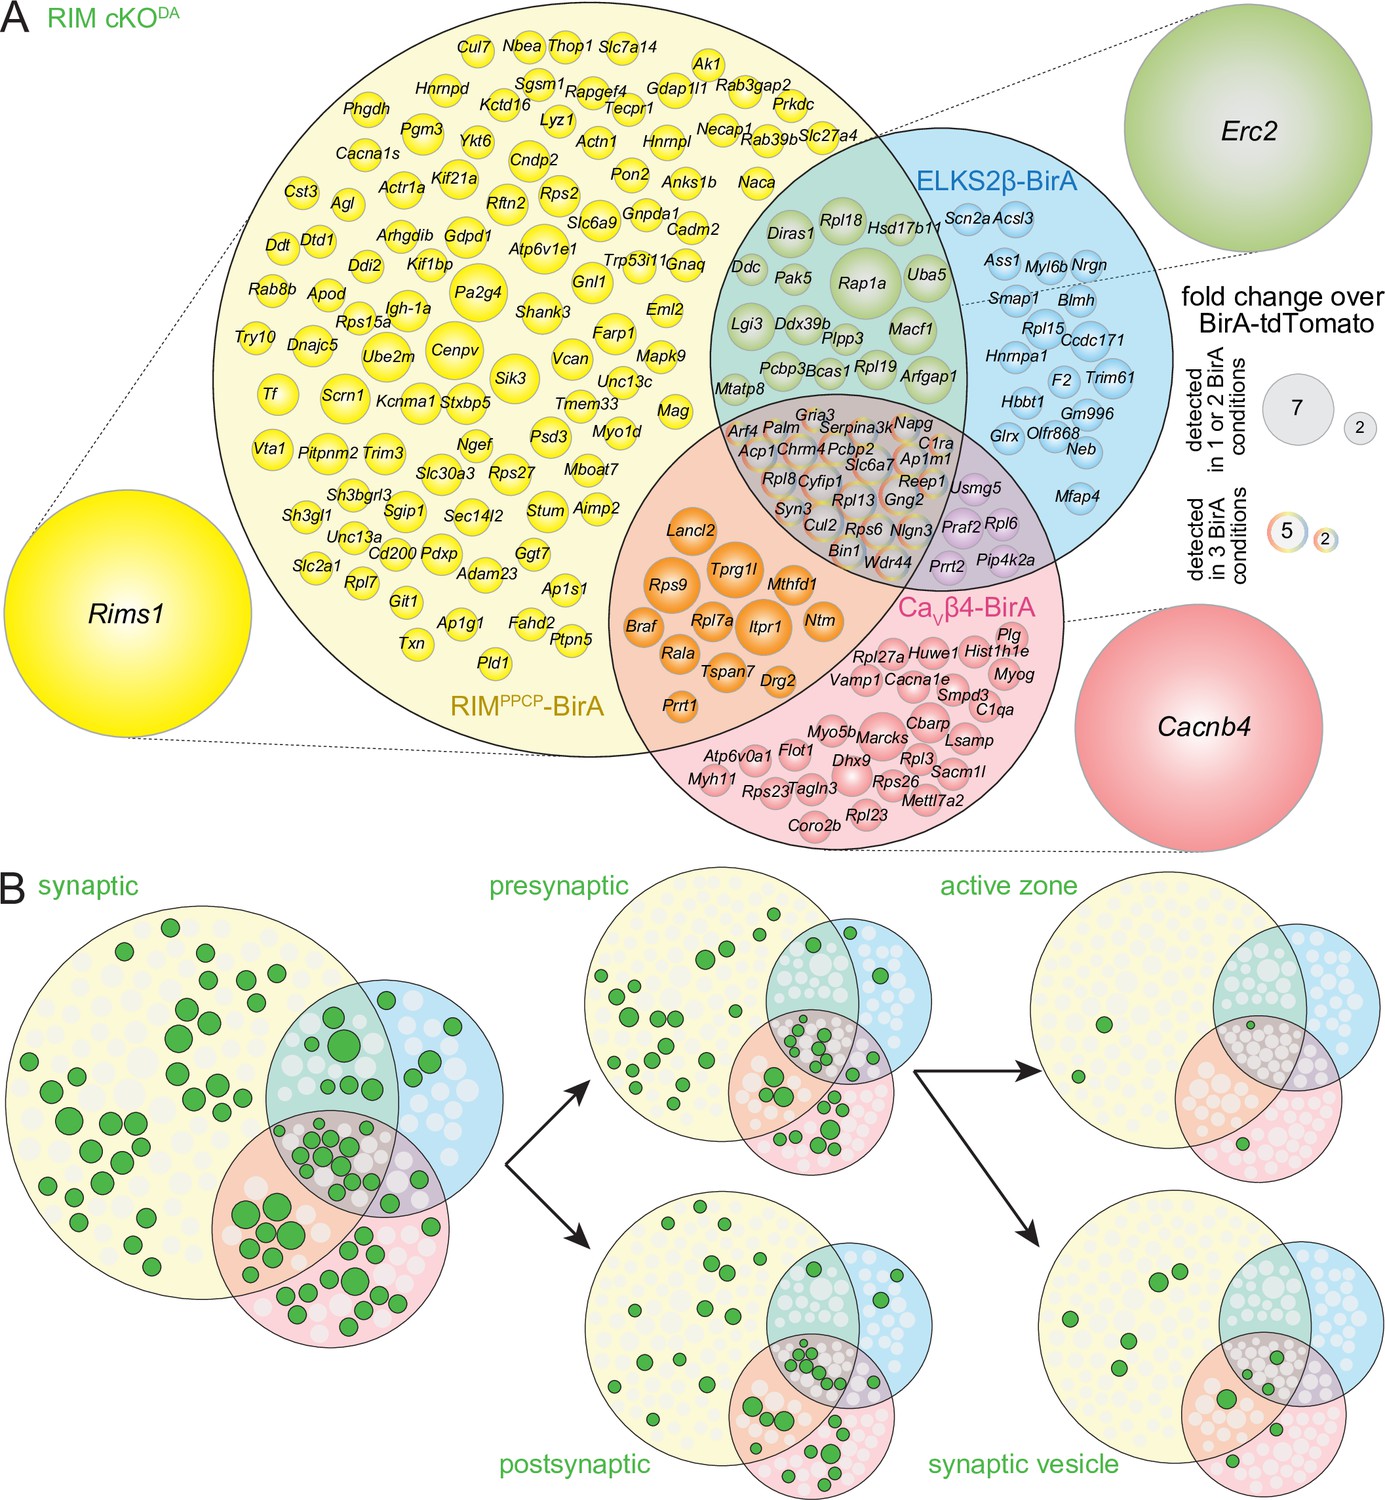
Venn diagrams for the RIM cKODA dataset.
(A) Venn diagram listing genes that encode protein hits enriched ≥2.0-fold over BirA-tdTomato with RIMPPCP-BirA, ELKS2β-BirA, or CaVβ4-BirAiBioID baits in RIM cKODA mice. Bait-encoding genes are shown outside the Venn diagram in the color of the corresponding part of the diagram. Enrichment is shown as the average of 2 independent repeats run in a single mass spectrometry session. Circle size reflects average enrichment across repeats (key on the right). For proteins enriched in multiple bait conditions, circle size corresponds to the bait condition with the largest enrichment. RIM1 peptides were detected in the RIMPPCP-BirA condition, likely reflecting self-biotinylation of the bait. RIM1 peptides were nearly completely absent in all other conditions. (B) Hits from (A) that have cellular compartment annotations in the SynGO database (Koopmans et al., 2019) are colored in green and are classified into increasingly specific SynGO subcategories, subcategorizations are not mutually exclusive; proteins used as baits are not shown. Synaptic proteins decrease from 191 (Figure 2B) to 76 hits, presynaptic proteins from 99 (Figure 2B) to 43, postsynaptic proteins from 87 (Figure 2B) to 37, synaptic vesicle proteins from 30 (Figure 2B) to 11, and active zone proteins from 14 (Figure 2B) to 4; bait proteins are not counted. For a list of hits, see Source data 1H.
Figure 3—figure supplement 2

Venn diagrams for the Syt-1 cKODA dataset.
(A) Venn diagram listing genes that encode protein hits enriched ≥2.0-fold over BirA-tdTomato with RIMPPCP-BirA, ELKS2β-BirA, or CaVβ4-BirAiBioID baits in Syt-1 cKODA mice. Bait-encoding genes are shown outside the Venn diagram in the color of the corresponding part of the diagram. Enrichment is shown as the average of 2 independent repeats run in a single mass spectrometry session. Circle size reflects average enrichment across repeats (key on the right). For proteins enriched in multiple bait conditions, circle size corresponds to the bait condition with the largest enrichment. Syt-1 was not enriched in any condition, but was detected including with the BirA-tdTomato bait despite its conditional knockout in dopamine neurons (Source data 1G). This could be due to unspecific purification or to cross-membrane or non-bait-mediated biotinylation of Syt-1. Alternatively, a nonfunctional fragment of Syt-1 could be present after Syt-1 cKODA, but to our knowledge, there is no experimental evidence for such a fragment. Regardless, conditional Syt-1 knockout using this allele disrupts synchronous neurotransmitter release across tested preparations, including that of dopamine, establishing that it is a functional null allele (Banerjee et al., 2020; Bouhours et al., 2017; Delignat-Lavaud et al., 2021; Kochubey et al., 2016; Lebowitz et al., 2022; Zhou et al., 2017; Zhou et al., 2015). The presence of Syt-1 peptides across conditions illustrates the essential nature of a proteome for normalization (produced here with BirA-tdTomato). (B) Hits from (A) that have cellular compartment annotations in the SynGO database (Koopmans et al., 2019) are colored in maroon and are classified into increasingly specific SynGO subcategories, subcategorizations are not mutually exclusive; proteins used as baits are not shown. 160 synaptic proteins, 76 presynaptic proteins, 80 postsynaptic proteins, 18 synaptic vesicle proteins, and 10 active zone proteins were detected; bait proteins are not counted. For a list of hits, see Source data 1I.
Figure 4 with 1 supplement
RIM cKODA disrupts the protein composition of release sites in dopamine axons.
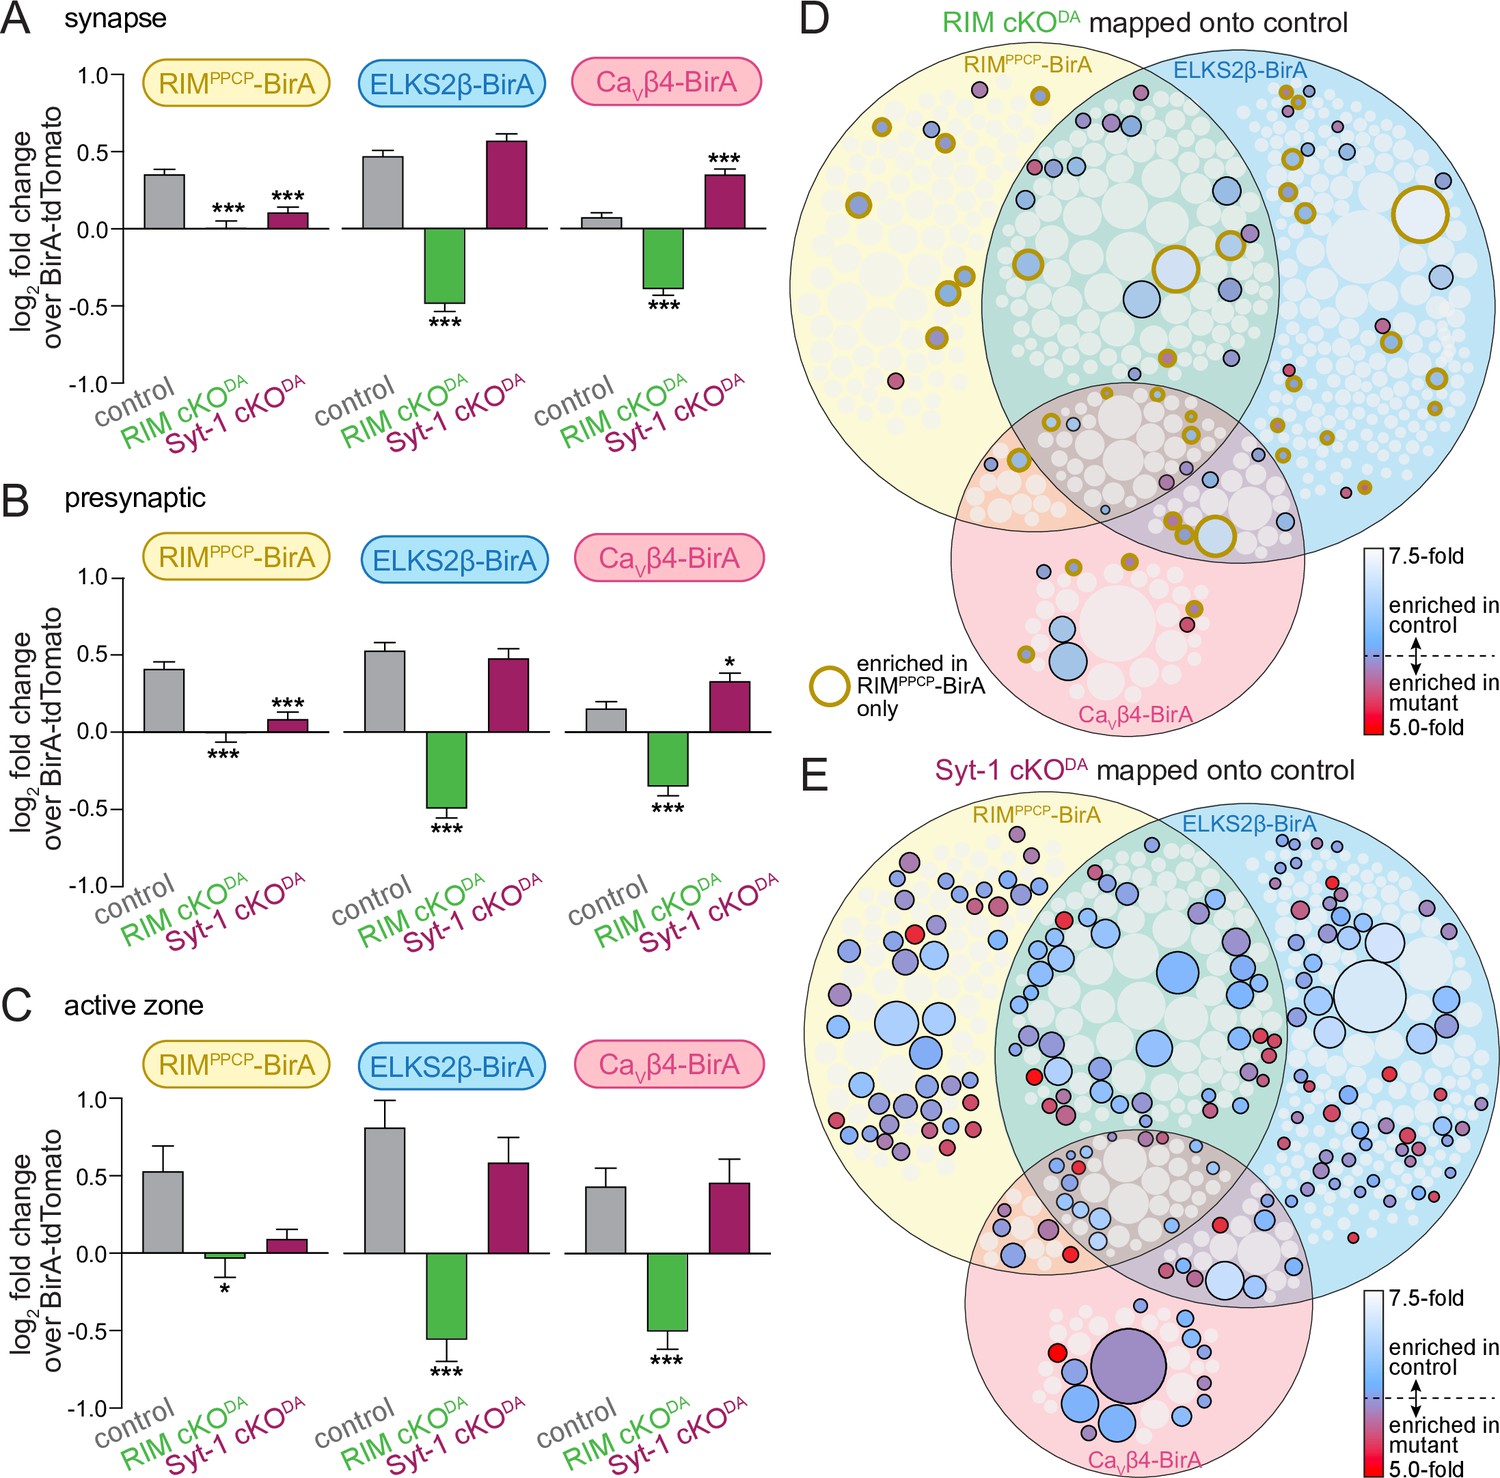
(A) The average log2 fold change of identified proteins over the same proteins in the BirA-tdTomato conditions, all proteins with a synaptic localization annotation in SynGO for each bait and genotype are included. Positive values represent release site enrichment and negative values represent depletion relative to axonal protein content assessed with BirA-tdTomato. Total number of proteins detected with a SynGO annotation: control, 540; RIM cKODA, 412; Syt-1 cKODA, 438. (B) Same as (A), but for proteins with a presynaptic SynGO annotation. Total number of proteins: control, 257; RIM cKODA, 208; Syt-1 cKODA, 213. (C) Same as (A), but for proteins with an active zone SynGO annotation. Total number of proteins: control, 42; RIM cKODA, 37; Syt-1 cKODA, 36. (D) Proteins enriched in the RIM cKODA dataset mapped onto the control Venn diagram shown in Figure 2A. Proteins present in the control proteome but not in the RIM cKODA dataset are shown in light gray. Enriched proteins are colored based on relative enrichment (key on the right). Proteins in the RIM cKODA dataset that are only enriched with RIMPPCP-BirA are outlined in dark yellow independent of which bait enriched them in the control dataset. (E) Same as (D), but for the Syt-1 cKODA dataset and without outlining a specific condition. Data in (A–C) are shown as mean ± SEM, and significance is presented as *p<0.05, **p<0.01, and ***p<0.001. Two-way ANOVA was used in (A–C) (A: genotype ***, bait ***, interaction ***; B: genotype ***, bait **, interaction ***; C: genotype ***, bait *, interaction not significant), and Bonferroni post-hoc tests (p-values indicated in figure) were used to compare each genotype to control for each BirA bait. For analyses as in (A–C) but for proteins with a synaptic vesicle or postsynaptic SynGO annotation, see Figure 4—figure supplement 1.
Figure 4—figure supplement 1

Analyses of enrichment of synaptic vesicle and postsynaptic proteins across genotypes.
(A) The average log2 fold change of identified proteins over the same proteins in the BirA-tdTomato conditions, all proteins with a synaptic vesicle localization annotation in SynGO for each bait and genotype are included. Positive values represent enrichment and negative values represent depletion relative to axonal protein content assessed with BirA-tdTomato. Total number of proteins detected with a SynGO annotation: control, 77; RIM cKODA, 64; Syt-1 cKODA, 67. (B) Same as (A), but for proteins with a postsynaptic SynGO annotation. Total number of proteins detected with a SynGO annotation: control, 260; RIM cKODA, 190; Syt-1 cKODA, 202. The observation that postsynaptic proteins decrease in RIM cKODA mice supports specificity of their enrichment and argues against their presence simply due to nonspecific purification. Data are shown as mean ± SEM, and significance is presented as *p<0.05, **p<0.01, and ***p<0.001. Two-way ANOVA was used in (A) and (B) (A: genotype ***, bait **, interaction ***; B: genotype ***, bait **, interaction ***), and Bonferroni post-hoc tests (p-values indicated in figure) were used to compare each genotype to control for each BirA bait.
Figure 5
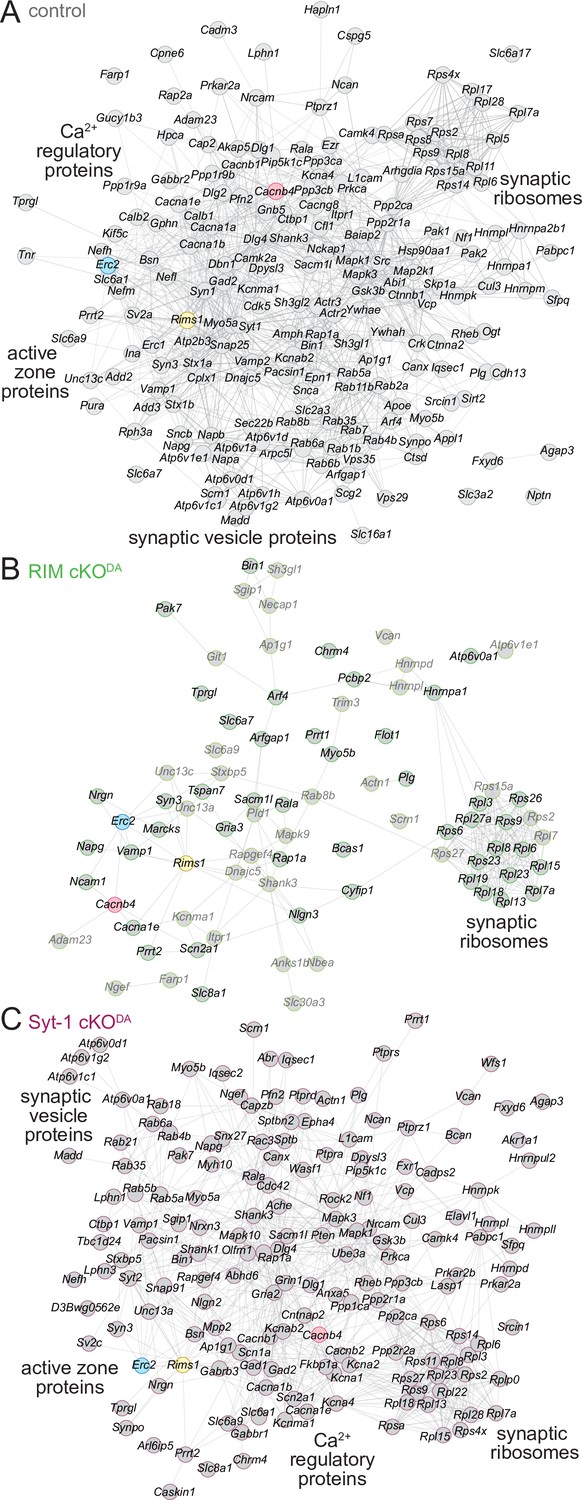
STRING diagrams illustrate functional categories of release site proteins and their disruption in RIM cKODA mice.
(A) STRING diagram of the enriched proteins that have a synaptic SynGO annotation in the control dataset. Physical or functional interactions determined by either empirical data or predictive modeling are illustrated as lines between proteins (Snel et al., 2000; Szklarczyk et al., 2019). The BirA bait proteins are color-coded. Functional categories identified by STRING analyses are labeled close to the corresponding clusters. (B) Same as (A), but for the RIM cKODA dataset. The proteins that are enriched only in the RIMPPCP-BirA bait are shown in lighter gray. (C) Same as (A), but for the Syt-1 cKODA dataset. Number of proteins: (A) 194; (B) 79; (C) 163.
Figure 6
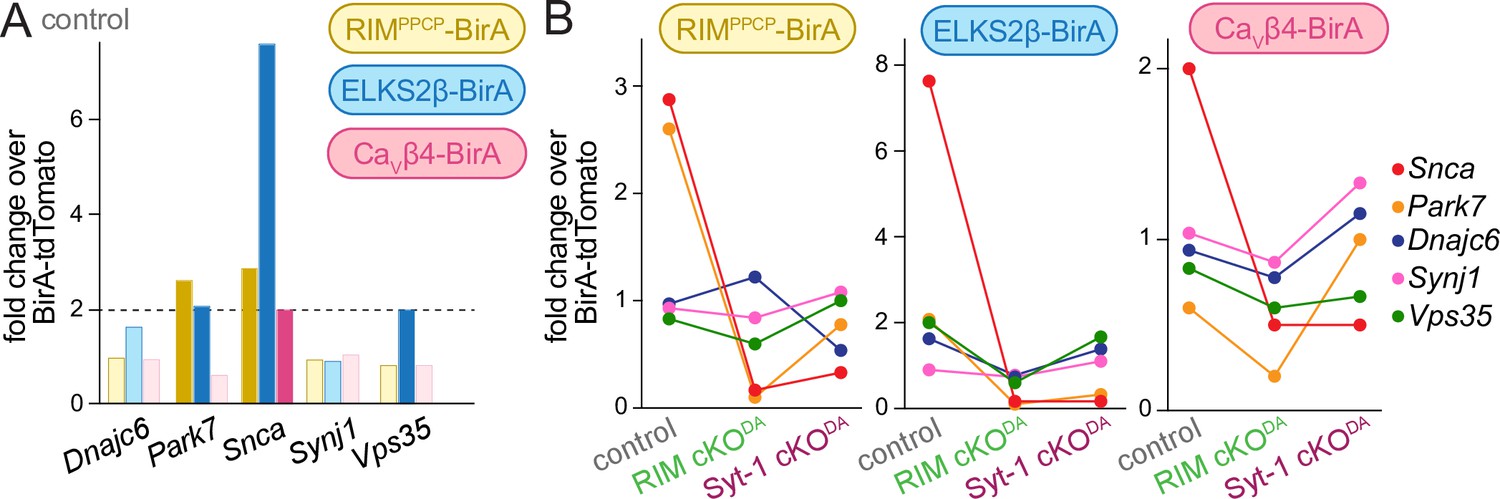
Genes associated with Parkinson’s disease in the dopamine release site proteomes.
(A) Enrichment of proteins associated with monogenic forms of Parkinson’s disease (Blauwendraat et al., 2020; Day and Mullin, 2021; Marras et al., 2016) in the control dataset. Hits above the 2.0-fold enrichment threshold are shown in saturated colors, and those below the threshold in light colors; control, 4 independent repeats per bait condition. (B) Enrichment of the five proteins shown for each bait and in control, RIM cKODA and Syt-1 cKODA; control, 4 independent repeats (as described in Figure 1), RIM cKODA, 2 (as described in Figure 3); Syt-1 cKODA, 2 (as described in Figure 3).
Tables
Key resources table
| Reagent type (species) or resource | Designation | Source or reference | Identifiers | Additional information |
|---|---|---|---|---|
| Genetic reagent (Mus musculus) | B6.SJL-Slc6a3tm1.1(Cre)Bkmm/J (DATIRES-Cre) | Bäckman et al., 2006 | RRID:IMSR_JAX:006660 | |
| Genetic reagent (M. musculus) | Rims1tm3Sud/J (RIM1αβfl/fl) | Kaeser et al., 2008 | RRID:IMSR_JAX:015832 | |
| Genetic reagent (M. musculus) | Rims2tm1.1Sud/J (RIM2αβγfl/fl) | Kaeser et al., 2011 | RRID:IMSR_JAX:015833 | |
| Genetic reagent (M. musculus) | C57BL/6Ntac-Syt1tm1a(EUCOMM)Wtsi/WtsiCnrm (Syt-1fl/fl) | Zhou et al., 2015 | RRID:IMSR_EM:06829 | The identifier refers to the line before flp recombination |
| Cell line (Homo sapiens) | HEK293T cells | ATCC | Cat#: CRL-3216; RRID:CVCL_0063 | |
| Recombinant DNA reagent | pAAV2/5-syn-DIO-RIM-PRM-PDZ-PxxP-C2A-BirA | This study | LK18005; lab plasmid code (LPC) p864 | This reagent was used to generate AAV viruses and can be obtained from the corresponding author |
| Recombinant DNA reagent | pAAV2/5-syn-DIO- ELKS2β-BirA | This study | LK17008; LPC p857 | This reagent was used to generate AAV viruses and can be obtained from the corresponding author |
| Recombinant DNA reagent | AAV2/5-syn-DIO-CaVβ4-BirA | This study | LK19004; LPC p868 | This reagent was used to generate AAV viruses and can be obtained from the corresponding author |
| Recombinant DNA reagent | AAV2/5-syn-DIO-BirA-tdTomato | This study | LK17011; LPC p860 | This reagent was used to generate AAV viruses and can be obtained from the corresponding author |
| Antibody | Anti-HA (rabbit polyclonal) | Cell Signaling Technology | CAT# 5017; RRID:AB_10693385, lab antibody code (LAC) A40 | Immunofluorescence (IF) (1:500) |
| Antibody | Anti-HA (mouse monoclonal) | BioLegend | CAT# 901501; RRID:AB_2565006, LAC A12 | IF (1:500) Western blot (WB) 1:500 |
| Antibody | Anti-tyrosine hydroxylase (guinea pig polyclonal) | SySy | CAT# 213 104; RRID:AB_2619897, LAC A111 | IF (1:1000) |
| Antibody | Anti-Bassoon (mouse monoclonal) | Millipore | CAT# ADI-VAM-PS003-F; RRID:AB_11181058, LAC A85 | IF (1:500) |
| Antibody | Anti-Neuroplastin (goat polyclonal) | R&D Systems | CAT# AF5360; RRID:AB_2155920, LAC A253 | IF (1:500) |
| Antibody | Anti-red fluorescent protein (rabbit polyclonal) | Rockland | CAT#600-401-379; RRID:AB_2209751, LAC A81 | WB (1:1000) |
| Antibody | Anti-β-actin (mouse monoclonal) | Sigma-Aldrich | CAT# A1978; RRID:AB_476692, LAC A127 | WB (1:10,000) |
| Antibody | Anti-pyruvate carboxylase (rabbit polyclonal) | Novus | CAT# NBP1-49536G; RRID:AB_11016707, LAC A252 | This antibody was used for depletion as described in the 'Materials and methods' |
| Software, algorithm | Prism9 | GraphPad | RRID:SCR002798; https://www.graphpad.com/scientific-software/prism | |
| Software, algorithm | Cytoscape v 3.8.2 | Cytoscape | RRID:SCR003032; http://cytoscape.org/ | |
| Software, algorithm | SEQUEST PRO | Thermo Fisher | https://scicrunch.org/resolver/SCR_014594 | |
| Software, algorithm | MATLAB code for object analysis | Liu, 2021 | https://github.com/kaeserlab/3DSIM_Analysis_CL |
Additional files
-
MDAR checklist
- https://cdn.elifesciences.org/articles/83018/elife-83018-mdarchecklist1-v2.pdf
-
Source data 1
Source data for Figures 1—3 and figure supplements.
(A) Table of proteins detected in mass spectrometry in control mice. An alphabetical list of genes encoding the proteins identified by mass spectrometry and associated peptide counts in the control datasets is provided.
(B) DNA sequences. Sequences of the inserts of newly generated plasmids used for producing AAVs are provided. Only the inserts in the multiple cloning site 3′ of the human synapsin promotor of a standard AAV vector are included.
(C) Table of proteins for the Venn diagram in Figure 2. Genes encoding the bait proteins are shown in the first three rows. The table contains an alphabetical list ordered by enrichment group (enriched in all bait conditions, enriched in two bait conditions, enriched in one bait condition). To be included in the Venn diagram, enriched is defined as an average ≥2.0-fold number of peptides for a specific protein over the peptide count for the same protein in the BirA-tdTomato condition, calculated across biological repeats and mass spectrometry experiments as described in detail in the 'Materials and methods'.
(D) Table of proteins for the Venn diagram in Figure 2—figure supplement 1. Genes encoding the bait proteins are shown in the first three rows. The table contains an alphabetical list ordered by enrichment group (enriched in all bait conditions, enriched in two bait conditions, enriched in one bait condition). To be included in the Venn diagram, enriched is defined as an average ≥1.5-fold number of peptides for a specific protein over the peptide count for the same protein in the BirA-tdTomato condition.
(E) Table of proteins for the Venn diagram in Figure 2—figure supplement 2. Genes encoding the bait proteins are shown in the first three rows. The table contains an alphabetical list ordered by enrichment group (enriched in all bait conditions, enriched in two bait conditions, enriched in one bait condition). To be included in the Venn diagram, enriched is defined as an average ≥2.5-fold number of peptides for a specific protein over the peptide count for the same protein in the BirA-tdTomato condition.
(F) Table of proteins detected in mass spectrometry in RIM cKODA mice. An alphabetical list of genes encoding the proteins identified by mass spectrometry and associated peptide counts in the RIM cKODA datasets is provided.
(G) Table of proteins detected in mass spectrometry in Syt-1 cKODA mice. An alphabetical list of genes encoding the proteins identified by mass spectrometry and associated peptide counts in the Syt-1 cKODA datasets is provided.
(H) Table of proteins in RIM cKODA mice for the Venn diagram in Figure 3—figure supplement 1. Genes encoding the bait proteins are shown in the first three rows. The table contains an alphabetical list ordered by enrichment group (enriched in all bait conditions, enriched in two bait conditions, enriched in one bait condition). To be included in the Venn diagram, enriched is defined as an average ≥2.0-fold number of peptides for a specific protein over the peptide count for the same protein in the BirA-tdTomato condition.
(I) Table of proteins in Syt-1 cKODA mice for the Venn diagram in Figure 3—figure supplement 2. Genes encoding the bait proteins are shown in the first three rows. The table contains an alphabetical list ordered by enrichment group (enriched in all bait conditions, enriched in two bait conditions, enriched in one bait condition). To be included in the Venn diagram, enriched is defined as an average ≥2.0-fold number of peptides for a specific protein over the peptide count for the same protein in the BirA-tdTomato condition.
- https://cdn.elifesciences.org/articles/83018/elife-83018-data1-v2.xlsx
Download links
A two-part list of links to download the article, or parts of the article, in various formats.
Downloads (link to download the article as PDF)
Open citations (links to open the citations from this article in various online reference manager services)
Cite this article (links to download the citations from this article in formats compatible with various reference manager tools)
Protein composition of axonal dopamine release sites in the striatum
eLife 11:e83018.
https://doi.org/10.7554/eLife.83018


