A novel gene REPTOR2 activates the autophagic degradation of wing disc in pea aphid
- State Key Laboratory of Integrated Management of Pest Insects and Rodents, Institute of Zoology, Chinese Academy of Sciences, China
- CAS Center for Excellence in Biotic Interactions, University of Chinese Academy of Science, China
- School of Life Science, Hebei University, China
- Institute of Plant Protection, Shandong Academy of Agriculture Sciences, China
- Department of Entomology, Texas A&M University, United States
Figures
Figure 1 with 1 supplement

Wing dimorphism in pea aphids is transgenerational with high sensitivity to maternal density and duration, and first instar nymphs at 30-hr postbirth is a critical stage for developmental plasticity of the wing disc.
(A) Two female adults in a petri dish can efficiently induce a high proportion of winged offspring. (B) Percentage of winged offspring produced by the two-adult contacting treatment for different durations. Circles in the diagrams above the figure panels represent petri dishes. (C) Daily percentage of winged offspring for the two-adult contacting treatment for 4-hr. (D) Developmental morphology of aphid wings from the first instar nymphal to adult stages in winged and wingless aphids. White arrows: locations of the wing bud or wing in the winged morph. (E) Histological comparisons of wing disc in the first instar nymphs at 24-, 30-, and 36-hr postbirth, and wing discs existed in both winged- and wingless-destined aphids. White arrows indicate the wing disc. L, left wing disc; R, right wing disc. (F) The relative area of the wing disc measured by ImageJ. WD, winged-destined; WLD, wingless-destined. Boxes show the interquartile range, and the line is the median value of each group (n>16). Tukey’s multiple range tests at p<0.05 were used to compare means, and different lowercase letters indicate significant differences. Independent sample t test was used to compare means of the relative area of the wing disc, andsignificant difference at p<0.001 is indicated by asterisks (***).
-
Figure 1—source data 1
Related to Figure 1A.
- https://cdn.elifesciences.org/articles/83023/elife-83023-fig1-data1-v1.xlsx
-
Figure 1—source data 2
Related to Figure 1B.
- https://cdn.elifesciences.org/articles/83023/elife-83023-fig1-data2-v1.xlsx
-
Figure 1—source data 3
Related to Figure 1C.
- https://cdn.elifesciences.org/articles/83023/elife-83023-fig1-data3-v1.xlsx
-
Figure 1—source data 4
Related to Figure 1F.
- https://cdn.elifesciences.org/articles/83023/elife-83023-fig1-data4-v1.xlsx
Figure 1—figure supplement 1
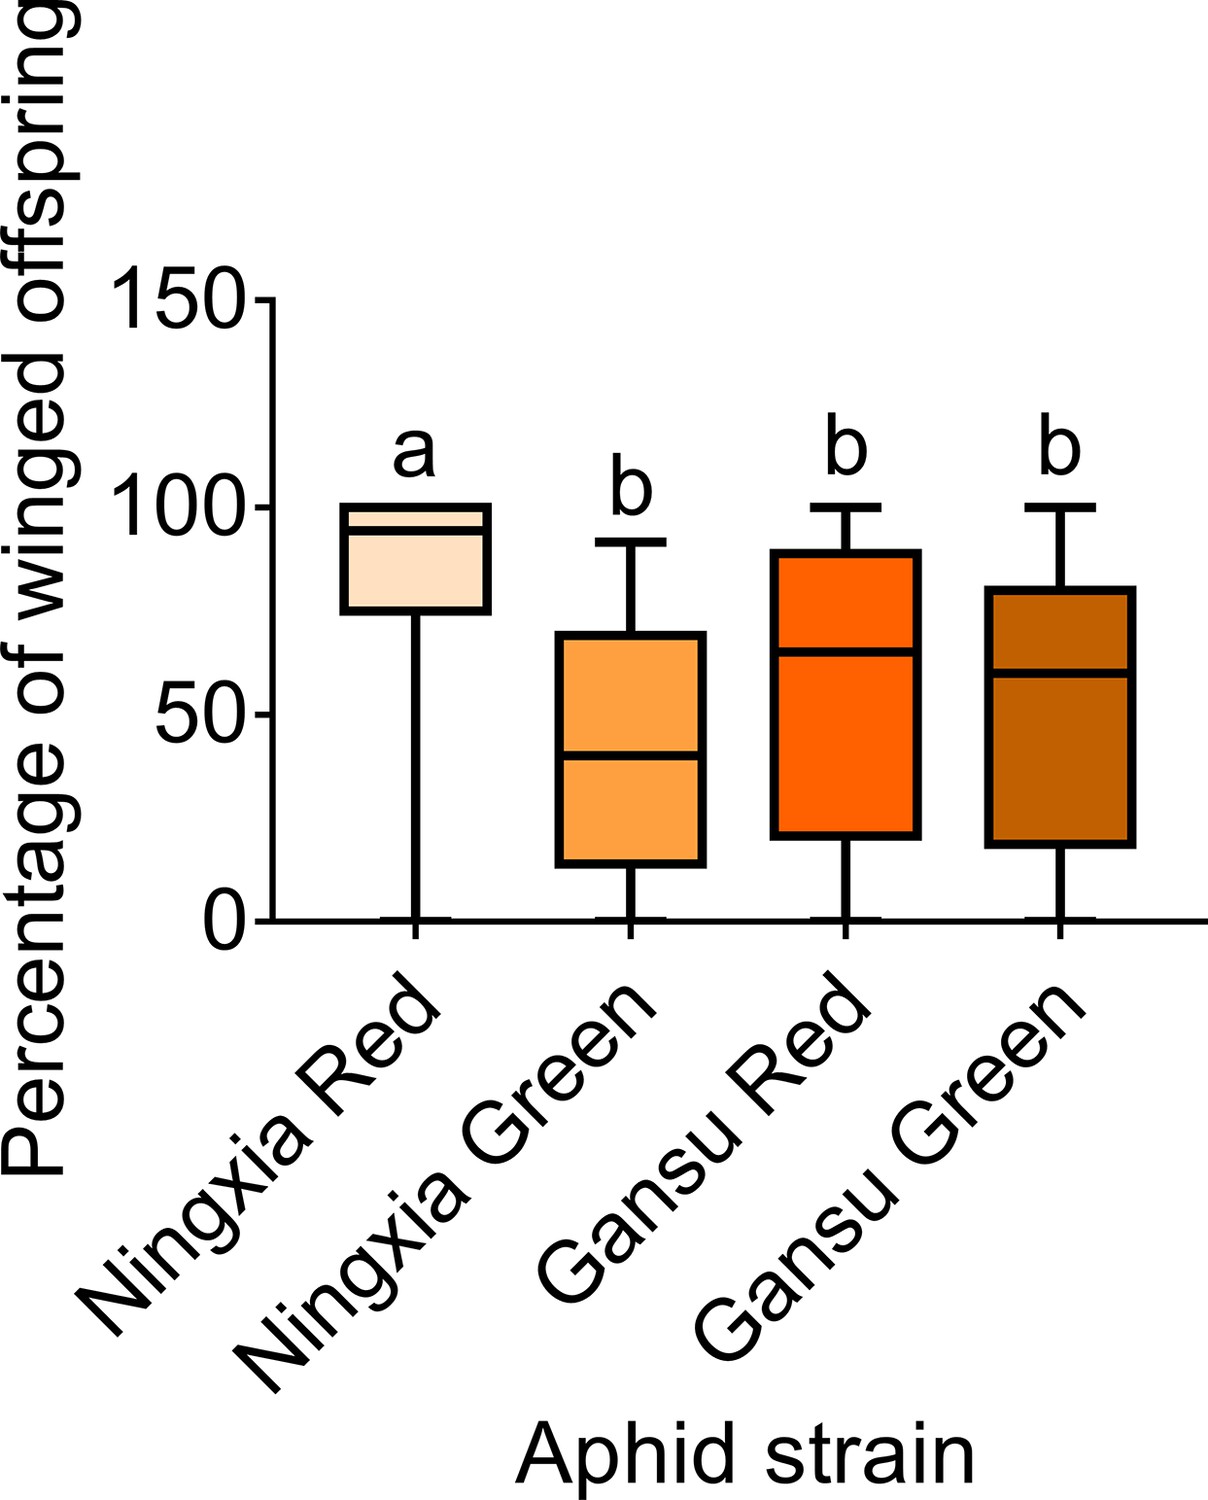
The percentage of winged offspring produced by two-adult contacting treatment for 4-hr of different pea aphid strains.
Boxes show the interquartile range, and the line is the median value of each group (n=40). Tukey’s multiple range tests at p<0.05 were used to compare means, and different lowercase letters indicate significant differences.
-
Figure 1—figure supplement 1—source data 1
Related to Figure 1—figure supplement 1.
- https://cdn.elifesciences.org/articles/83023/elife-83023-fig1-figsupp1-data1-v1.xlsx
Figure 2 with 1 supplement
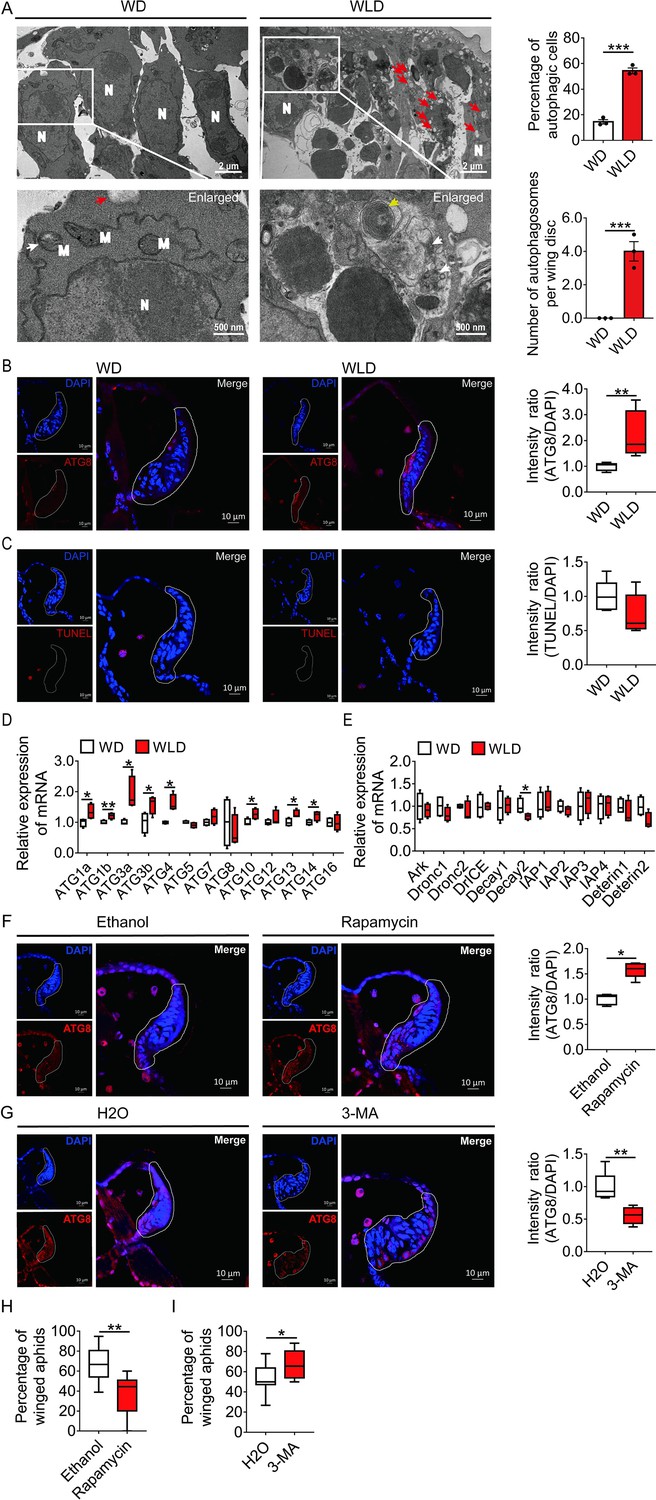
Autophagy, and not apoptosis, is responsible for degeneration of the wing disc in wingless-destined aphids.
(A) TEM images of wing discs of winged- and wingless-destined aphids at 30-hr postbirth. N, nucleus; M, mitochondrion. Yellow and white arrows indicate autophagosomes containing membranous whorls and remnants of cellular organelles, respectively. Red arrows indicate the vacuoles (n=3). Values in bar plots are means (± SEM). (B) Autophagy in the wing disc was indicated by the hallmark ATG8 (red) in immunofluorescence. The nuclei (blue) were stained by DAPI (n=7). (C) Apoptosis was determined by TUNEL assays (red) (n=5). (D) Autophagy-related genes (ATG1a, ATG1b, ATG3a, ATG3b, ATG4, ATG5, ATG7, ATG8, ATG10, ATG12, ATG13, ATG14, and ATG16) were determined by qPCR (n=4). (E) Pro-apoptotic genes (Ark, Dronc1, Dronc2, DrICE, Deterin1, and Deterin2), anti-apoptotic genes (IAP1, IAP2, IAP3, IAP4, Decay1, and Decay2) were determined by qPCR (n=4). (F) The effect of autophagy agonist rapamycin, and (G) autophagy inhibitor 3-MA on autophagy in the wing disc. Autophagy was noted by ATG8 (red) in immunofluorescence, and nuclei were stained by DAPI (blue). All relative intensity was quantified by ImageJ (n>5). (H) The effect of autophagy agonist rapamycin, and (I) autophagy inhibitor 3-MA on the proportion of winged aphids. Ethanol and H2O were used as control, respectively (n>9). Wing disc shown in confocal was highlighted by white circle. WD, winged-destined; WLD, wingless-destined. Boxes show the interquartile range, and the line is the median value of each group. Independent sample t test was used to compare means, and significant differences between treatments are indicated by asterisks, *p<0.05, **p<0.01, ***p<0.001. qPCR, quantitative polymerase chain reaction; TEM, transmission electron microscopy.
-
Figure 2—source data 1
Related to Figure 2A.
- https://cdn.elifesciences.org/articles/83023/elife-83023-fig2-data1-v1.xlsx
-
Figure 2—source data 2
Related to Figure 2B.
- https://cdn.elifesciences.org/articles/83023/elife-83023-fig2-data2-v1.xlsx
-
Figure 2—source data 3
Related to Figure 2C.
- https://cdn.elifesciences.org/articles/83023/elife-83023-fig2-data3-v1.xlsx
-
Figure 2—source data 4
Related to Figure 2D.
- https://cdn.elifesciences.org/articles/83023/elife-83023-fig2-data4-v1.xlsx
-
Figure 2—source data 5
Related to Figure 2E.
- https://cdn.elifesciences.org/articles/83023/elife-83023-fig2-data5-v1.xlsx
-
Figure 2—source data 6
Related to Figure 2F.
- https://cdn.elifesciences.org/articles/83023/elife-83023-fig2-data6-v1.xlsx
-
Figure 2—source data 7
Related to Figure 2G.
- https://cdn.elifesciences.org/articles/83023/elife-83023-fig2-data7-v1.xlsx
-
Figure 2—source data 8
Related to Figure 2H.
- https://cdn.elifesciences.org/articles/83023/elife-83023-fig2-data8-v1.xlsx
-
Figure 2—source data 9
Related to Figure 2I.
- https://cdn.elifesciences.org/articles/83023/elife-83023-fig2-data9-v1.xlsx
Figure 2—figure supplement 1
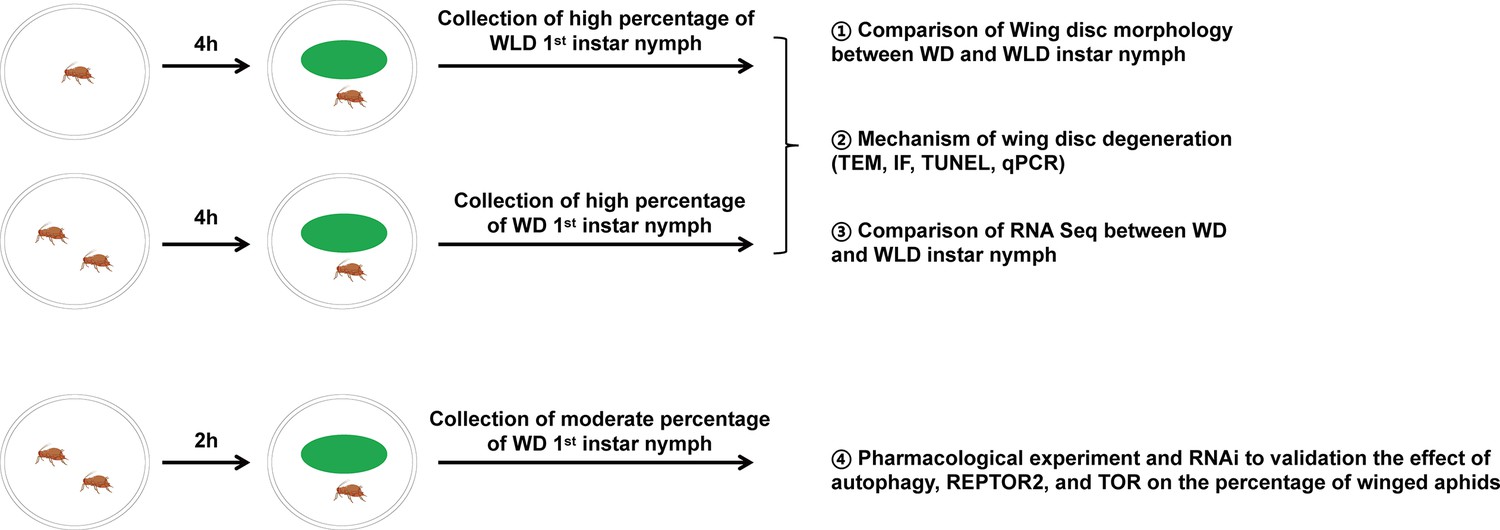
Experimental design.
A flow diagram of the sampling procedure for maternal treatment and offspring collection. Female adults of pea aphids were subjected to single adult or two adult individual treatement in the petri dish for 4 hr. Since the solitary mother produced high proportion of wingless offspring (nearly 100%), the collected newborn nymphs during the first 2 days named wingless-destined aphids. Likewise, the two-adult individuals contacting for 4 hr resulted in high proportion of winged offspring (>90%), so newborn nymphs at first 2 days named winged-destined aphids. Alternatively, two adult individuals contacting for 2 hr could cause a moderate proportion of winged offspring (~50%). WD, winged-destined; WLD, wingless-destined.
Figure 3 with 1 supplement
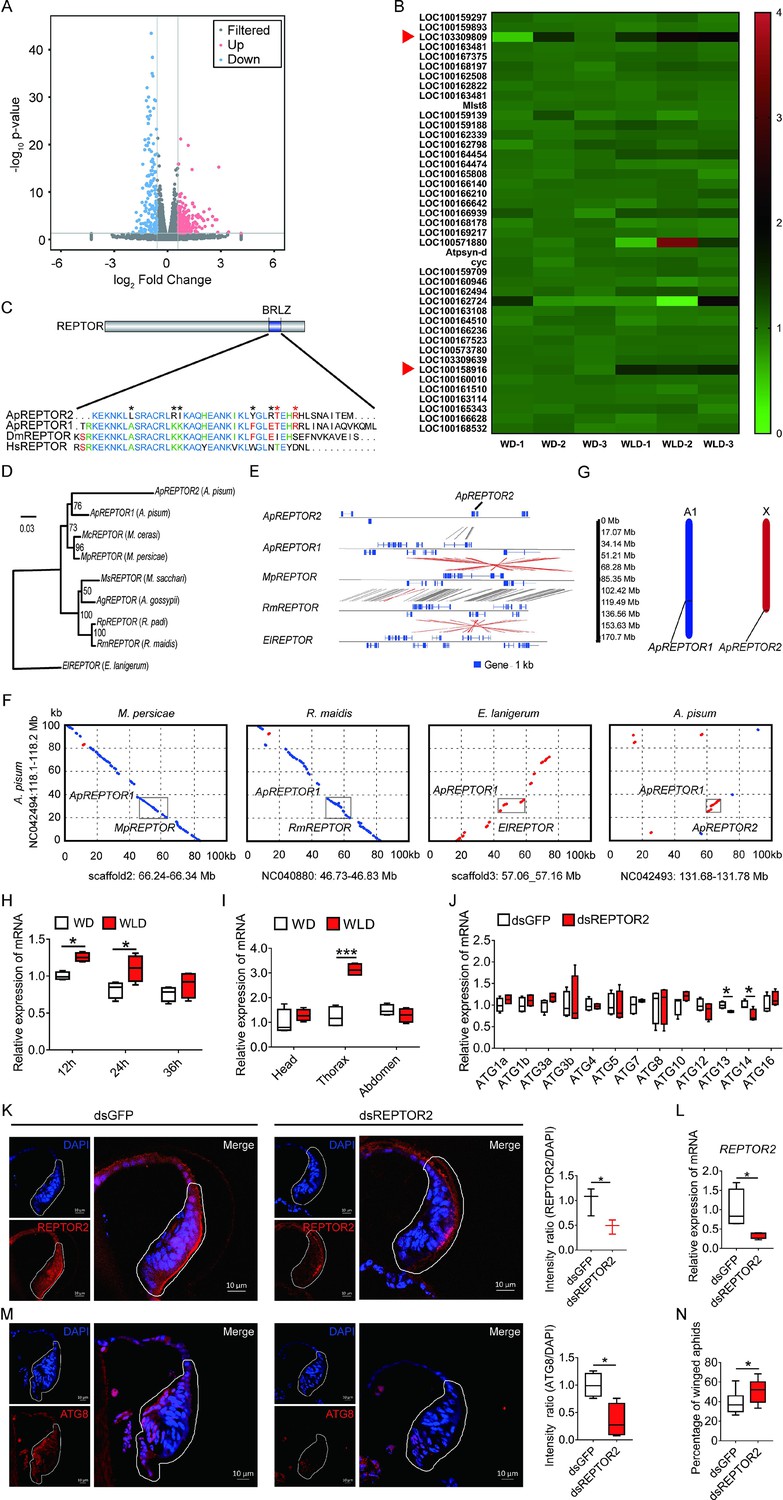
Pea aphid-specific REPTOR2 is highly expressed in wingless-destined morph that activates autophagy in the wing disc.
(A) The volcano plot of log-transformed FPKM showing the number of differentially expressed genes (DEGs) in wingless- versus winged-destined aphids at 24-h postbirth. Three biological replications were conducted in the RNA-seq analysis. (B) Transcript mapping to TOR signaling pathway of pea aphids and DEGs in two wing morphs. Red arrows indicated two DEGs, REPTOR2 (LOC103309809) and sodium-coupled neutral amino acid transporter 9 (LOC100158916), in wingless- versus winged-destined aphids. (C) Homology analysis of pea aphid REPTOR2. The amino acid sequence of conserved basic region leucine zippers (BRLZ) domain of pea aphid REPTOR2 was aligned with pea aphid REPTOR1 (ApREPTOR1), human REPTOR (HsREPTOR) and Drosophila REPTOR (DmREPTOR). Red and black asterisks indicated pea aphid-specific variation and ApREPTOR2-specific variation in amino acid, respectively. (D) An unrooted phylogenetic tree was constructed by the IQ-TREE method with coding sequence alignments for aphid REPTOR. The sequences of REPTOR identified from eight aphid species as well as the candidate pea aphid REPTOR2 were compared. (E) Sequence comparisons of the LOC103309809 (ApREPTOR2) locus and its homologous regions in aphids. Homologous sequences were linked by gray dashes corresponding to the positive strand and by red dashes corresponding to the negative strand. (F) Gray boxes highlight the similarity of aphid REPTOR across 100 kb covering the REPTOR loci. (G) Chromosomal distribution of two REPTOR genes in pea aphids. (H) Relative expression levels of REPTOR2 in first instar nymph at 12-, 24-, and 36-h postbirth in winged- and wingless-destined aphids (n=4). (I) Expression levels of REPTOR2 in head, thorax and abdomen of winged- and wingless-destined aphids at 24-h postbirth (n=4). (J) Effects of dsREPTOR2 on the expression of genes related to autophagy in whole body of the first instar nymphs (n=4). (K) Knockdown of REPTOR2 reduced its expression in wing disc at 24-h postbirth. Fluorescence in situ hybridization (FISH) was used to detect the REPTOR2 expression level in aphid wing discs. REPTOR2 was hybridized with 5-CY3 in red, and nuclei were stained with DAPI in blue (n=3). (L) dsREPTOR2 feeding decreased the gene expression of REPTOR2, as determined by qPCR (n=4). (M) Knockdown of REPTOR2 resulted in the decline of autophagy in the wing disc at 30-h postbirth. Autophagy was noted by ATG8 (red) in immunofluorescence, and nuclei were stained by DAPI (blue) (n=4). (N) dsREPTOR2 treatment increased the proportion of winged aphids (n=10). Wing discs shown in confocal were highlighted by white circles. WD, winged-destined; WLD, wingless-destined. Boxes show the interquartile range, and the line is the median value of each group. Independent sample t test was used to compare mean, and significant differences between treatments are indicated by asterisks: *p<0.05, **p<0.01, ***p<0.001.
-
Figure 3—source data 1
Related to Figure 3A.
- https://cdn.elifesciences.org/articles/83023/elife-83023-fig3-data1-v1.xlsx
-
Figure 3—source data 2
Related to Figure 3B.
- https://cdn.elifesciences.org/articles/83023/elife-83023-fig3-data2-v1.xlsx
-
Figure 3—source data 3
Related to Figure 3H.
- https://cdn.elifesciences.org/articles/83023/elife-83023-fig3-data3-v1.xlsx
-
Figure 3—source data 4
Related to Figure 2I.
- https://cdn.elifesciences.org/articles/83023/elife-83023-fig3-data4-v1.xlsx
-
Figure 3—source data 5
Related to Figure 3J.
- https://cdn.elifesciences.org/articles/83023/elife-83023-fig3-data5-v1.xlsx
-
Figure 3—source data 6
Related to Figure 3K.
- https://cdn.elifesciences.org/articles/83023/elife-83023-fig3-data6-v1.xlsx
-
Figure 3—source data 7
Related to Figure 2L.
- https://cdn.elifesciences.org/articles/83023/elife-83023-fig3-data7-v1.xlsx
-
Figure 3—source data 8
Related to Figure 3M.
- https://cdn.elifesciences.org/articles/83023/elife-83023-fig3-data8-v1.xlsx
-
Figure 3—source data 9
Related to Figure 2N.
- https://cdn.elifesciences.org/articles/83023/elife-83023-fig3-data9-v1.xlsx
Figure 3—figure supplement 1
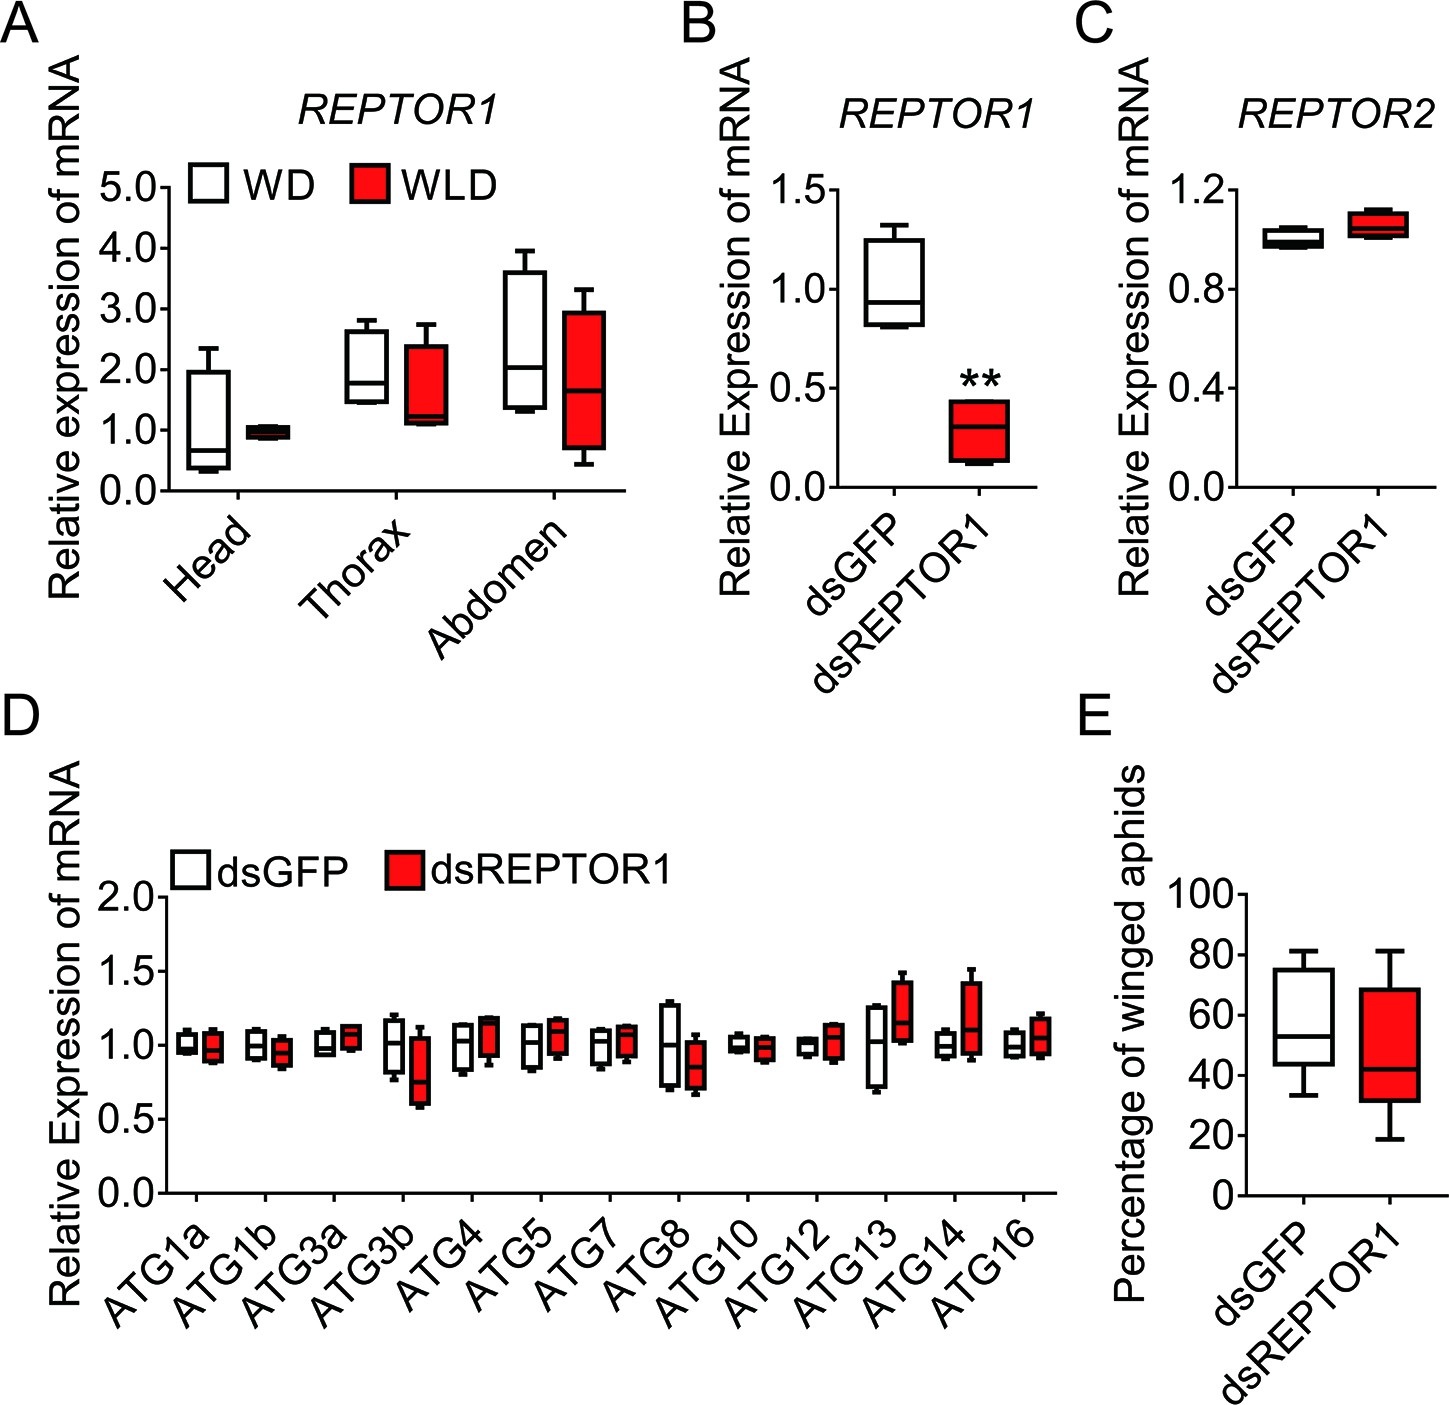
REPTOR1 was not involved in activation of autophagic degradation in the wing disc of the winged-destined morph.
(A) Expression levels of REPTOR1 in head, thorax, and abdomen of winged- and wingless-destined aphids at 24-h postbirth (n=4). (B–D) Knockdown of REPTOR1 decreased the gene expression of REPTOR1, but did not affect the gene expression of REPTOR2 and ATGs in whole body of the first instar nymphs, as determined by qPCR (n=4). (E) dsREPTOR1 did not affect the proportion of winged aphids (n=11). Boxes show the interquartile range, and the line is the median value of each group. Independent sample t test was used to compare means. Significant differences between treatments are represented by asterisks: **p<0.01.
-
Figure 3—figure supplement 1—source data 1
Related to Figure 3—figure supplement 1A.
- https://cdn.elifesciences.org/articles/83023/elife-83023-fig3-figsupp1-data1-v1.xlsx
-
Figure 3—figure supplement 1—source data 2
Related to Figure 3—figure supplement 1B.
- https://cdn.elifesciences.org/articles/83023/elife-83023-fig3-figsupp1-data2-v1.xlsx
-
Figure 3—figure supplement 1—source data 3
Related to Figure 3—figure supplement 1C.
- https://cdn.elifesciences.org/articles/83023/elife-83023-fig3-figsupp1-data3-v1.xlsx
-
Figure 3—figure supplement 1—source data 4
Related to Figure 3—figure supplement 1D.
- https://cdn.elifesciences.org/articles/83023/elife-83023-fig3-figsupp1-data4-v1.xlsx
-
Figure 3—figure supplement 1—source data 5
Related to Figure 3—figure supplement 1E.
- https://cdn.elifesciences.org/articles/83023/elife-83023-fig3-figsupp1-data5-v1.xlsx
Figure 4
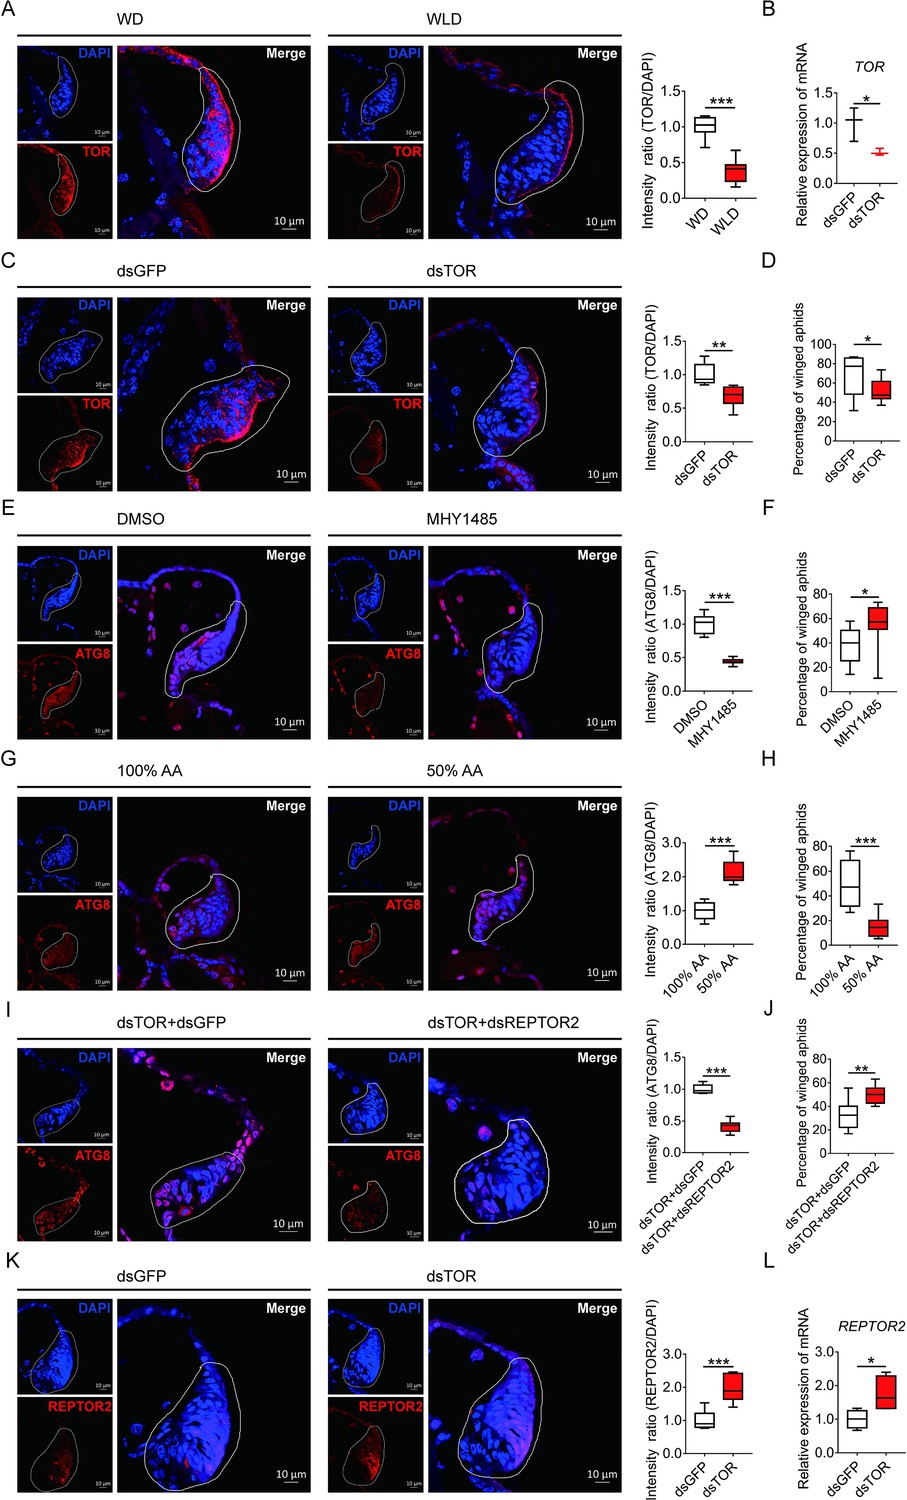
TOR negatively regulated autophagy in the wing disc and positively affected the proportion of winged aphids.
(A) TOR expression in the wing disc of first instar nymph of winged- and wingless-destined aphids at 24-h postbirth, as determined by mRNA-FISH. TOR was hybridized with 5-CY3 in red, and nuclei were stained with DAPI in blue (n=9). (B) Newborn nymphs fed with dsRNA reduced TOR expression in whole body 24-h postbirth, as determined by qPCR (n=3). (C) Knockdown of TOR reduced its expression in the wing disc 24-h postbirth, shown in mRNA-FISH (n>7), and (D) increased the proportion of winged aphids (n=10). (E) Application of TOR agonist MHY1485 attenuated autophagy in the wing disc 30-h postbirth (n=9). (F) Activation of TOR increased the proportion of winged aphids (n>8). (G) Amino acids supplied at 50% of the standard diet (50% AA) activated autophagy in the wing disc 30-h postbirth (n=8). (H) 50% AA reduced the proportion of winged aphids (n=8). Autophagy in the wing disc was indicated by the hallmark protein ATG8 (red) in immunofluorescence. The nuclei (blue) were stained by DAPI. (I) Knockdown of both TOR and REPTOR2 attenuated autophagy in the wing disc 30-h postbirth, relative to the control, dsTOR+dsGFP (n=7), and (J) increased the proportion of winged aphids (n=8). (K) Knockdown of TOR increased REPTOR2 expression in the wing disc 24-h postbirth, shown in mRNA-FISH (n=7). REPTOR2 was hybridized with 5-CY3 in red, and nuclei were stained with DAPI in blue. (L) Newborn nymphs fed with dsTOR-RNA increased REPTOR2 expression in whole body 24-h post-birth, as determined by qPCR (n=4). WD, winged-destined; WLD, wingless-destined. Relative intensity was quantified by ImageJ. Wing discs shown in confocal was highlighted by white circles. Boxes show the interquartile range, and the line is the median value of each group. Independent sample t test was used to compare mean, and significant differences between treatments are indicated by asterisks: *p<0.05, **p<0.01, ***p<0.001.
-
Figure 4—source data 1
Related to Figure 4A.
- https://cdn.elifesciences.org/articles/83023/elife-83023-fig4-data1-v1.xlsx
-
Figure 4—source data 2
Related to Figure 4B.
- https://cdn.elifesciences.org/articles/83023/elife-83023-fig4-data2-v1.xlsx
-
Figure 4—source data 3
Related to Figure 4C.
- https://cdn.elifesciences.org/articles/83023/elife-83023-fig4-data3-v1.xlsx
-
Figure 4—source data 4
Related to Figure 4D.
- https://cdn.elifesciences.org/articles/83023/elife-83023-fig4-data4-v1.xlsx
-
Figure 4—source data 5
Related to Figure 4E.
- https://cdn.elifesciences.org/articles/83023/elife-83023-fig4-data5-v1.xlsx
-
Figure 4—source data 6
Related to Figure 4F.
- https://cdn.elifesciences.org/articles/83023/elife-83023-fig4-data6-v1.xlsx
-
Figure 4—source data 7
Related to Figure 4G.
- https://cdn.elifesciences.org/articles/83023/elife-83023-fig4-data7-v1.xlsx
-
Figure 4—source data 8
Related to Figure 4H.
- https://cdn.elifesciences.org/articles/83023/elife-83023-fig4-data8-v1.xlsx
-
Figure 4—source data 9
Related to Figure 4I.
- https://cdn.elifesciences.org/articles/83023/elife-83023-fig4-data9-v1.xlsx
-
Figure 4—source data 10
Related to Figure 4J.
- https://cdn.elifesciences.org/articles/83023/elife-83023-fig4-data10-v1.xlsx
-
Figure 4—source data 11
Related to Figure 4K.
- https://cdn.elifesciences.org/articles/83023/elife-83023-fig4-data11-v1.xlsx
-
Figure 4—source data 12
Related to Figure 4L.
- https://cdn.elifesciences.org/articles/83023/elife-83023-fig4-data12-v1.xlsx
Figure 5
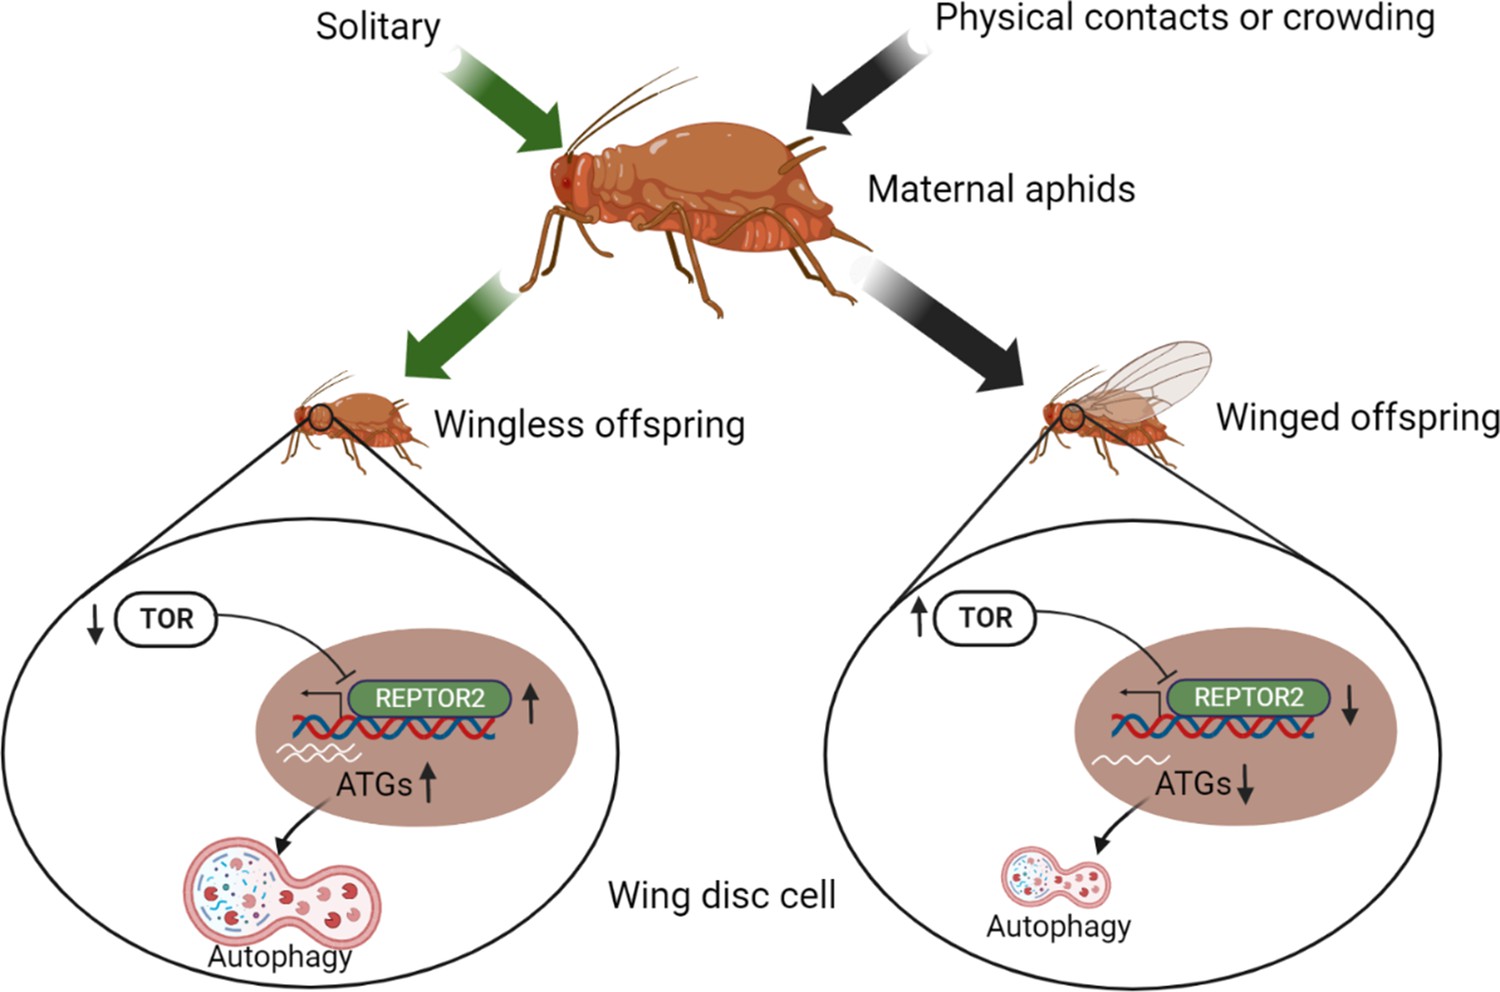
Illustration of the TOR signaling pathway-controlled wing disc degeneration of the first instar pea aphid nymphs.
All treatments, indicated along the top, were applied to wingless maternal aphids. Arrows correspond to the treatments, coded by different colors. ATG, autophagy related gene; REPTOR2, repress by TOR 2; TOR, target of rapamycin. This graph was created with BioRender.com.
Additional files
-
Supplementary file 1
Primers used for the study.
- https://cdn.elifesciences.org/articles/83023/elife-83023-supp1-v1.docx
-
MDAR checklist
- https://cdn.elifesciences.org/articles/83023/elife-83023-mdarchecklist1-v1.docx
Download links
A two-part list of links to download the article, or parts of the article, in various formats.
Downloads (link to download the article as PDF)
Open citations (links to open the citations from this article in various online reference manager services)
Cite this article (links to download the citations from this article in formats compatible with various reference manager tools)
A novel gene REPTOR2 activates the autophagic degradation of wing disc in pea aphid
eLife 12:e83023.
https://doi.org/10.7554/eLife.83023


