Human Dectin-1 is O-glycosylated and serves as a ligand for C-type lectin receptor CLEC-2
- Department of Molecular Immunology, Research Institute for Microbial Diseases, Osaka University, Japan
- Laboratory of Molecular Immunology, Immunology Frontier Research Center (IFReC), Osaka University, Japan
- Graduate School of Integrated Sciences for Life, Hiroshima University, Japan
- Cellular and Molecular Biotechnology Research Institute, National Institute of Advanced Industrial Science and Technology (AIST), Japan
- Laboratory of Immune Regulation School of Life Sciences, Tokyo University of Pharmacy and Life Sciences, Japan
- The Glycoscience Group, National University of Ireland, Galway, Ireland
- Medical Research Council Centre for Medical Mycology, University of Exeter, United Kingdom
- Center for Infectious Disease Education and Research (CiDER), Osaka University, Japan
- Division of Molecular Design, Research Center for Systems Immunology, Medical Institute of Bioregulation, Kyushu University, Japan
Figures
Figure 1 with 1 supplement
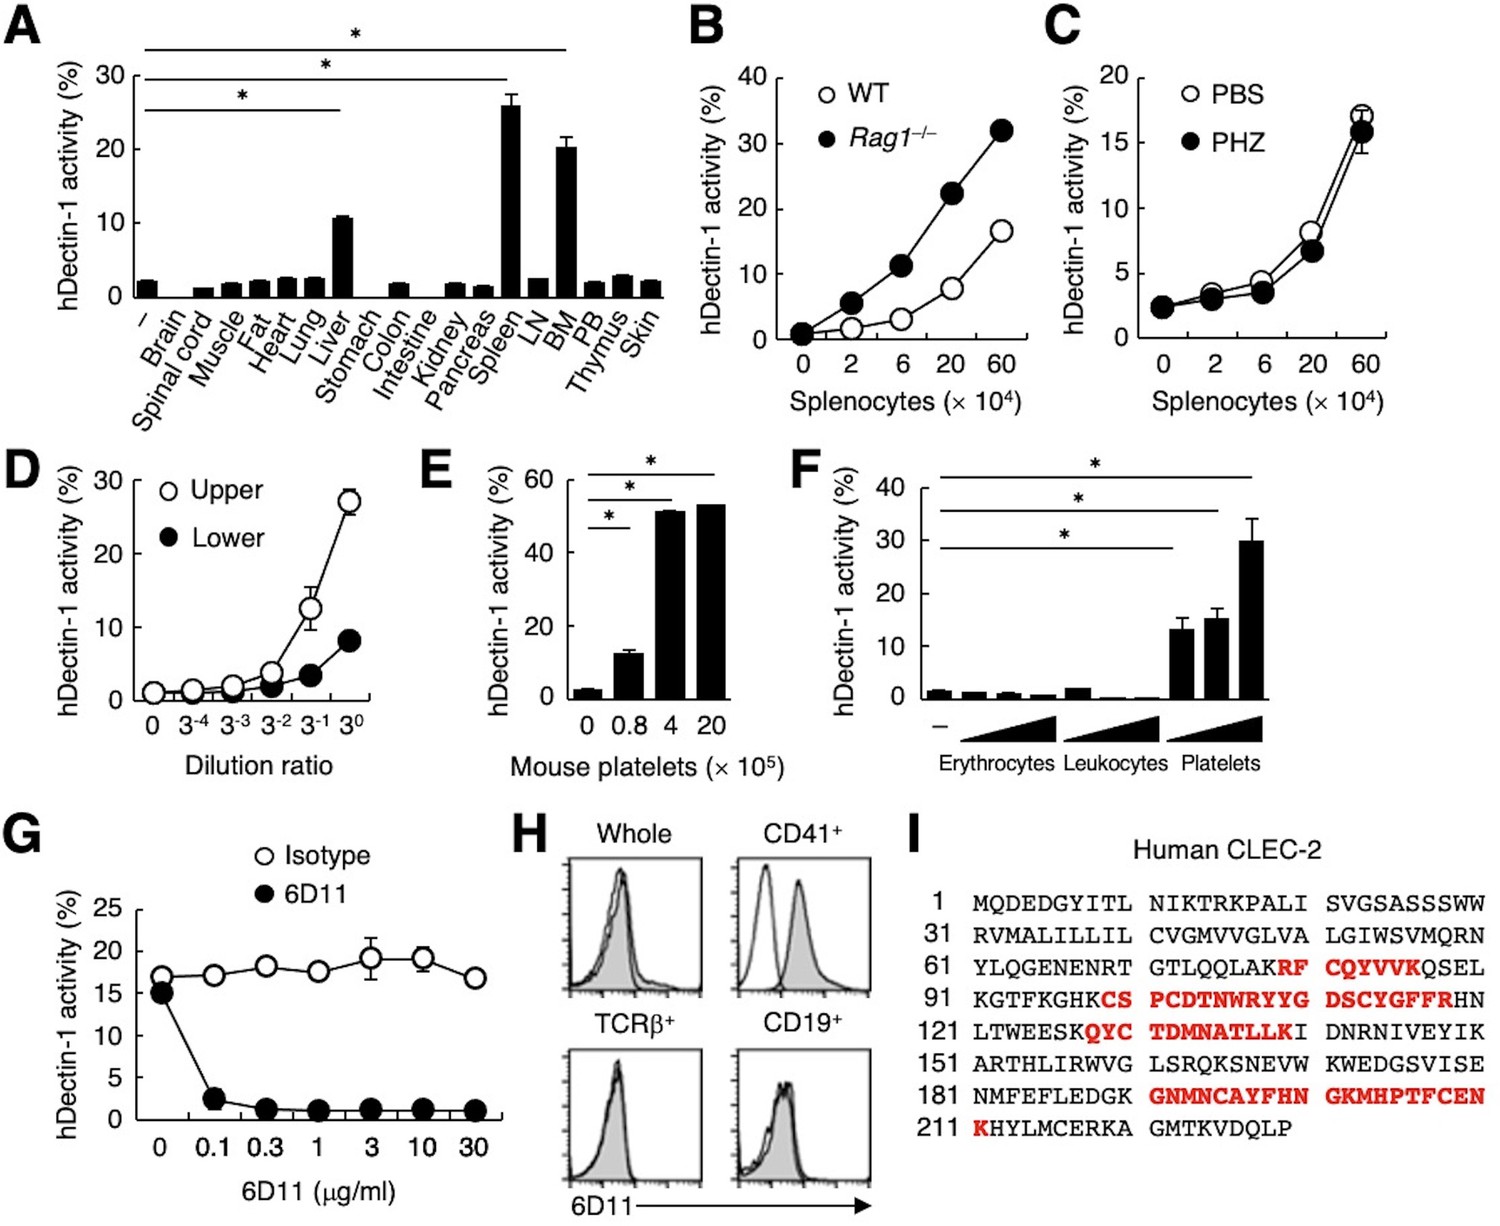
CLEC-2 expressed on platelets interacts with hDectin-1.
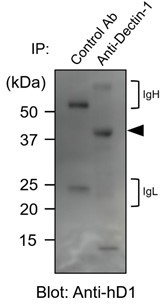
(A) NFAT-GFP reporter cells expressing hDectin-1 were incubated with tissue homogenates derived from murine organs. LN: lymph node; BM: bone marrow; PB: peripheral blood; ‘−’: cells without stimulants. (B) NFAT-GFP reporter cells expressing hDectin-1 were incubated with the indicated number of splenocytes from wild-type (WT, open circles) or Rag1-deficient mice (Rag1−/−, filled circles). (C) NFAT-GFP reporter cells expressing hDectin-1 were stimulated with the indicated number of splenocytes from mice treated with phosphate-buffered saline (PBS, open circles) or phenylhydrazine (PHZ, filled circles). (D) NFAT-GFP reporter cells expressing hDectin-1 were stimulated with the indicated dilution of upper (open circles) or lower (filled circles) fractions after separation by centrifugation of peripheral blood cells treated with Ammonium-Chloride-Potassium lysing buffer. (E) NFAT-GFP reporter cells expressing hDectin-1 were incubated with the indicated number of murine platelets. (F) NFAT-GFP reporter cells expressing hDectin-1 were stimulated with erythrocytes, leukocytes, or platelets (3, 10, and 30×105 cells/well) isolated from human peripheral blood cells. ‘−’: cells without stimulants. (G) NFAT-GFP reporter cells expressing hDectin-1 were incubated with human platelets in the absence or presence of the indicated concentration of an isotype control antibody (open circles) or 6D11 (filled circles). (H) 6D11-reactive cells were analyzed by flow cytometry in CD41+ platelets, TCR β+ T cells, and CD19+ B cells from peripheral blood cells using isotype control (rat IgG1 κ open histograms) or 6D11 (gray histograms). (I) Peptides in 6D11-immunoprecipitates detected by MALDI-TOF MS are highlighted in red within the entire amino acid sequence of hCLEC-2. The details of the detected peptides are shown in Figure 1—figure supplement 1C. Data in graphs are presented as mean ± SD. These results are representative of at least two independent experiments. An unpaired two-tailed Student t-test was used for all statistical analyses. *p<0.05.
Figure 1—figure supplement 1
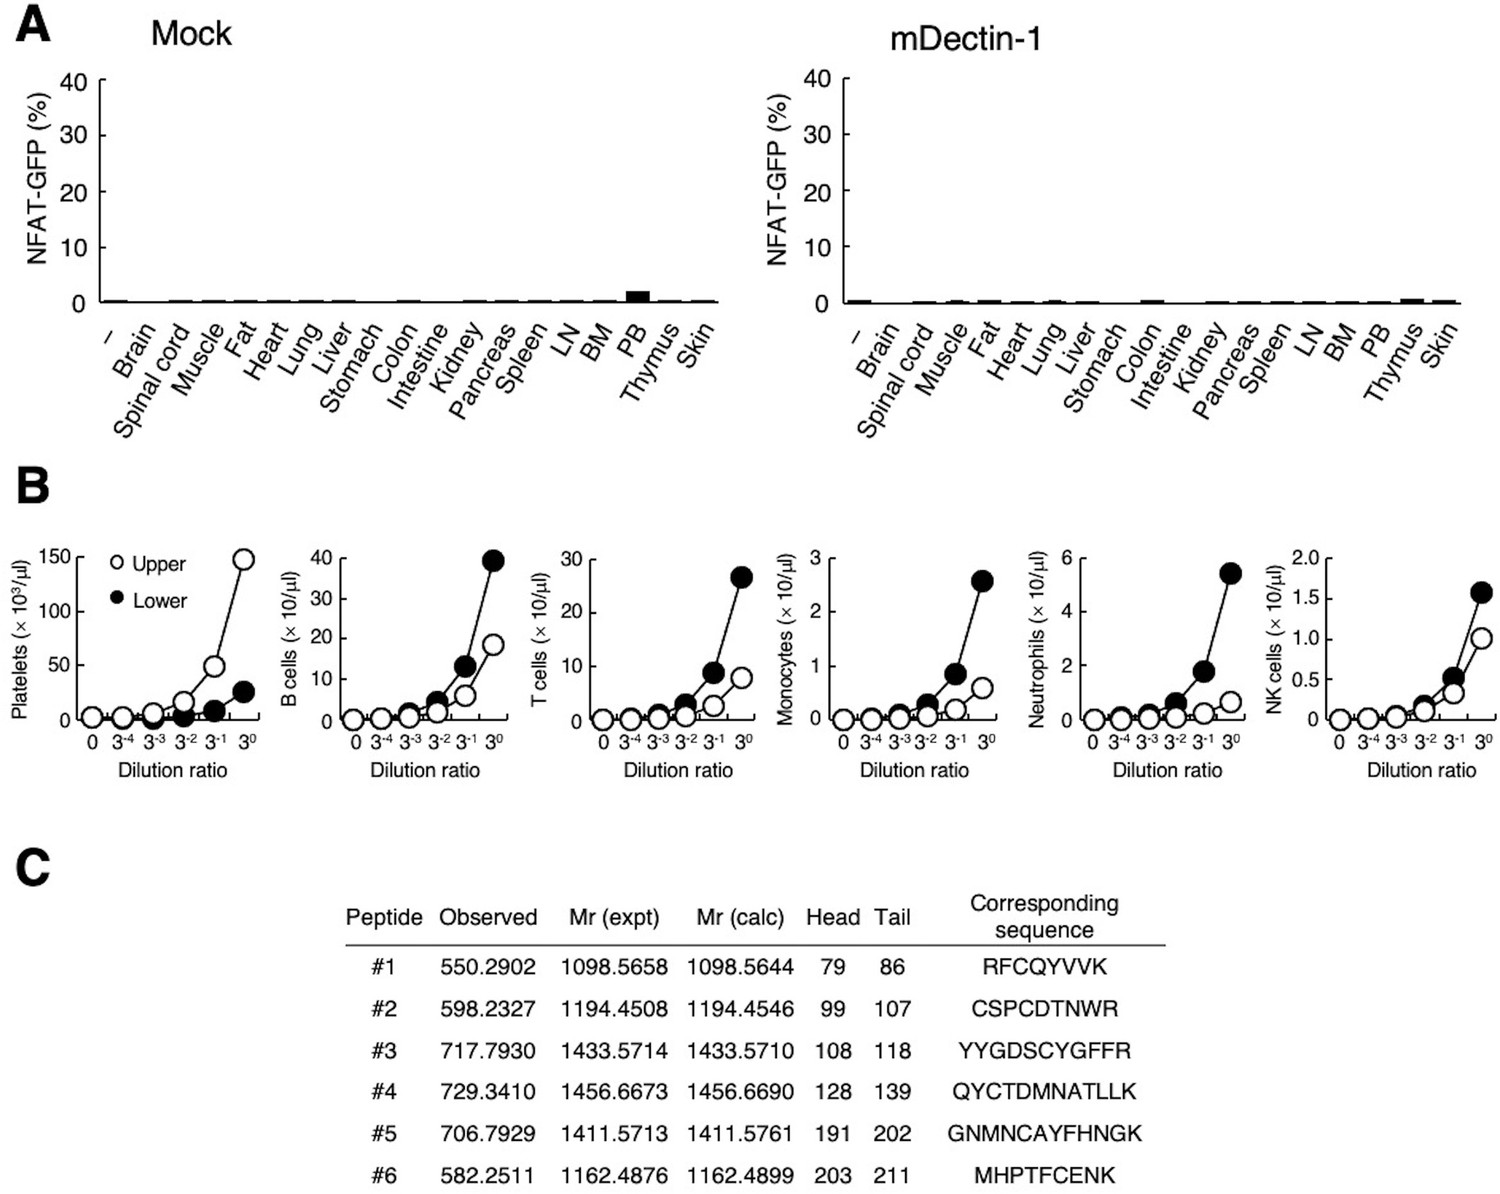
Interaction of human Dectin-1 with CLEC-2 on platelets.
(A) NFAT-GFP reporter cells expressing mouse Dectin-1 (mDectin-1, right panel) or mock transfected cells (left panel) were stimulated with various tissue homogenates derived from murine organs. ‘–’: cells without stimulants. (B) Number of platelets, B cells, T cells, monocytes, neutrophils, and NK cells at the indicated dilution ratio in two separated fractions (upper fraction; open circles, lower fraction; filled circles) obtained using centrifuged murine peripheral blood cells after treatment with ACK lysing buffer. (C) CLEC-2 peptides detected in 6D11-immunoprecipitates. Six independent peptides (#1–6) were detected by MALDI-TOF MS. Data are presented as mean ± SD (A, B). These results are representative of at least two independent experiments.
-
Figure 1—figure supplement 1—source data 1
Table for Figure 1—figure supplement 1C.
- https://cdn.elifesciences.org/articles/83037/elife-83037-fig1-figsupp1-data1-v2.zip
Figure 2 with 1 supplement
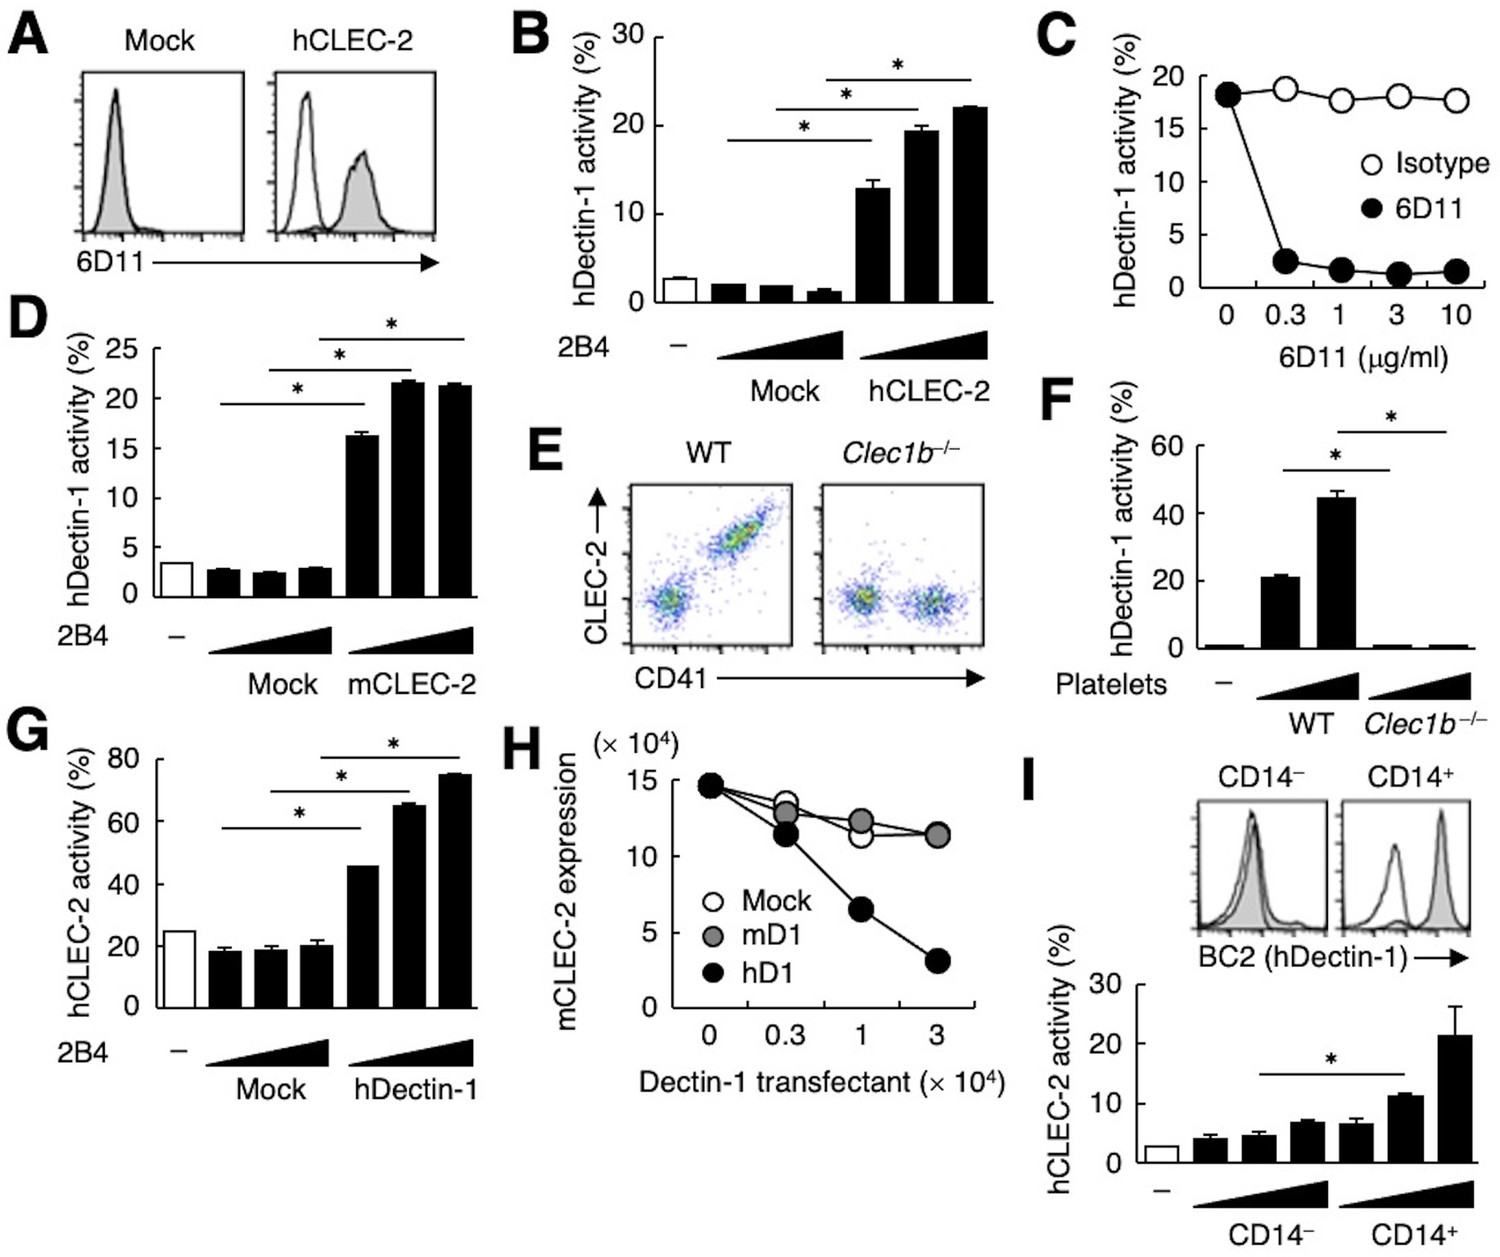
hDectin-1, but not mDectin-1, interacts with CLEC-2.
(A) 2B4 cells expressing hCLEC-2/CD3ζ or mock transfected cells were incubated with isotype control (rat IgG1 κ open histograms) or 6D11 (gray histograms). (B) NFAT-GFP reporter cells expressing hDectin-1 were incubated with control cells (mock transfectants) or 2B4 cells expressing hCLEC-2/CD3ζ (0.3, 1, and 3×10⁴ cells/well). ‘−’: cells without stimulants. (C) NFAT-GFP reporter cells expressing hDectin-1 were incubated with 2B4 cells expressing hCLEC-2/CD3ζ in the absence or presence of the indicated concentrations of isotype control (rat IgG1 κ open circles) or 6D11 (filled circles). (D) NFAT-GFP reporter cells expressing hDectin-1 were incubated with mock transfectants or 2B4 cells expressing mouse CLEC-2/CD3ζ (0.3, 1, and 3×10⁴ cells/well). ‘−’: cells without stimulants. (E) Surface expression levels of CLEC-2 on platelets isolated from wild-type or Clec1b−/− mice were analyzed using flow cytometry. (F) NFAT-GFP reporter cells expressing hDectin-1 were incubated with platelets isolated from wild-type or Clec1b−/− mice (5 and 15×105 cells/well). ‘−’: cells without stimulants. (G) NFAT-GFP reporter cells expressing hCLEC-2 were incubated with mock transfectants or 2B4 cells expressing hDectin-1 (0.3, 1, and 3×10⁴ cells/well). ‘−’: cells without stimulants. (H) Mouse platelets were incubated with the indicated number of 2B4 cells expressing mDectin-1 (mD1), or hDectin-1 (hD1) or mock transfectants. Surface expression levels of mCLEC-2 on platelets were subsequently analyzed using flow cytometry. Mean fluorescence intensity of anti-mCLEC-2 is indicated on the Y-axis as mCLEC-2 expression. Data are representative of two independent experiments. (I) CD14– or CD14+ cells isolated from human peripheral blood cells were analyzed by flow cytometry using an isotype control (mouse IgG1 κ open histograms) or an anti-hDectin-1 antibody BC2 (gray histograms) (upper panel). NFAT-GFP reporter cells expressing hCLEC-2/CD3ζ were incubated with CD14– or CD14+ cells (1, 3, and 10×104 cells/well) (lower panel). ‘−’: cells without stimulants. Data are presented as mean ± SD. These results are representative of at least two independent experiments. An unpaired two-tailed Student t-test was used for all statistical analyses. *p<0.05.
Figure 2—figure supplement 1
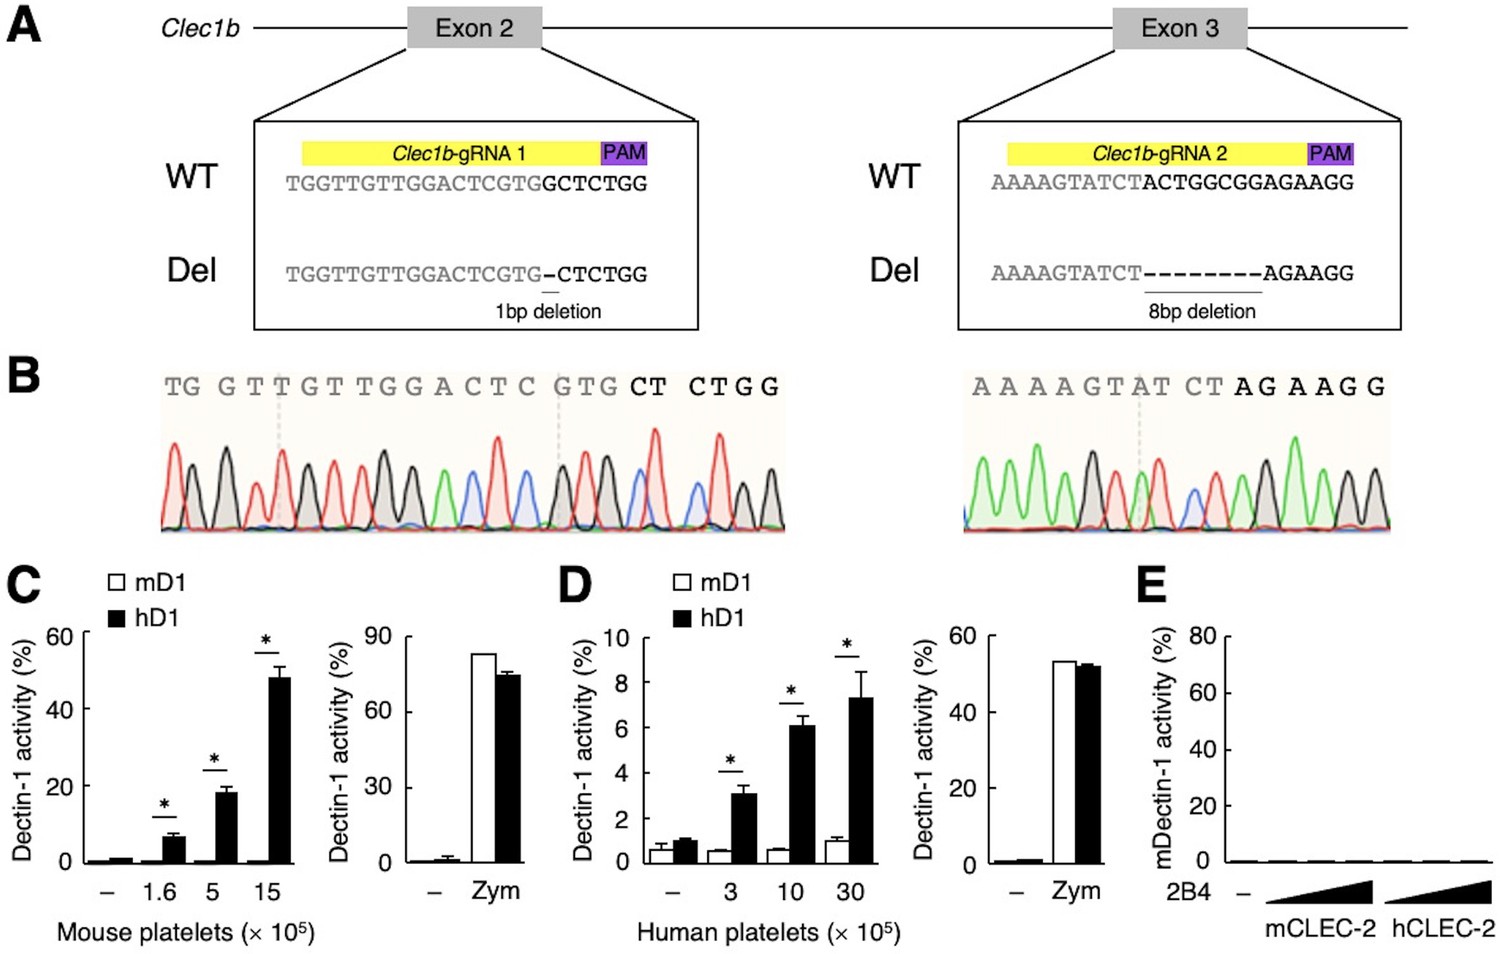
Mouse and human CLEC-2 interact with hDectin-1.
(A) Allelic sequences of mice mutated in the Clec1b locus obtained using the CRISPR-Cas9 system. Two gRNAs, indicated in yellow, were designed to target the allele on exon 2 or 3. PAM sites are indicated in purple. Genomic sequences of the two deletion mutant alleles generated using CRISPR-Cas9 system are shown below (Del). (B) Genomic sequences around the target sequences of gRNAs of the two deletion mutant alleles. Sanger sequencing chromatograms of genomic DNA from the two mutant alleles are shown. (C) NFAT-GFP reporter cells expressing mouse Dectin-1 (mD1) or human Dectin-1 (hD1) were incubated with the indicated number of mouse platelets (left panel). These reporter cells were also incubated with zymosan (right panel). ‘–’: cells without stimulants. (D) NFAT-GFP reporter cells expressing mouse or human Dectin-1 (mD1 and hD1, respectively) were incubated with the indicated number of human platelets (left panel). These reporter cells were also incubated with zymosan (right panel). ‘–’: cells without stimulants. (E) NFAT-GFP reporter cells expressing mDectin-1 were incubated with 2B4 cells expressing mCLEC-2/CD3ζ (mCLEC-2) or hCLEC-2/CD3ζ (hCLEC-2) (0.3, 1, and 3×10⁴ cells/well). ‘–’: cells without stimulants. Data are presented as mean ± SD. These results are representative of at least two independent experiments. An unpaired two-tailed Student t-test was used for all statistical analyses. *p<0.05.
Figure 3 with 1 supplement
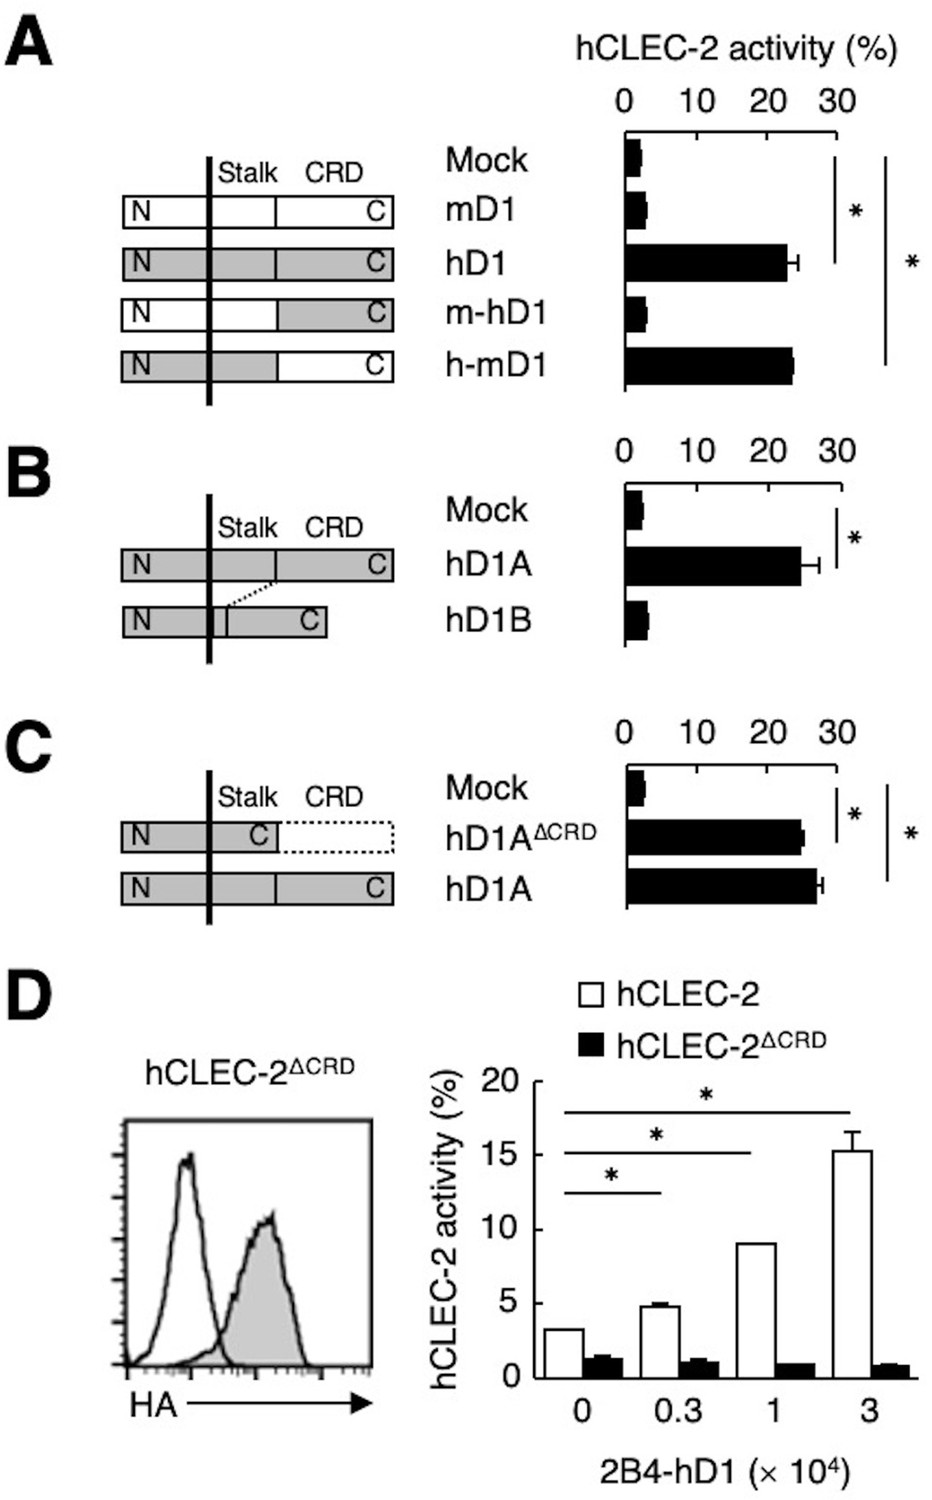
The stalk region of hDectin-1 interacts with the CRD of hCLEC-2.
(A) Schematic representations of mDectin-1 (mD1), hDectin-1 (hD1), a mutant harboring mDectin-1 non-CRD and hDectin-1 CRD (m-hD1), and a mutant harboring hDectin-1 non-CRD and mDectin-1 CRD (h-mD1) are shown in the left panel. NFAT-GFP reporter cells expressing hCLEC-2/CD3ζ were incubated with NFAT-GFP reporter cells expressing mD1, hD1, m-hD1, h-mD1, or mock transfectants (right panel). Receptor activities of these Dectin-1 constructs are shown in Figure 3—figure supplement 1A. (B) Schematic representations of hDectin-1 isoforms A (hD1A) and B (hD1B) are shown in the left panel. NFAT-GFP reporter cells expressing hCLEC-2/CD3ζ were incubated with NFAT-GFP reporter cells expressing hD1A, hD1B, or mock transfectants (right panel). Receptor activities of hD1A and hD1B are shown in Figure 3—figure supplement 1B. (C) Schematic representations of a hDectin-1A mutant lacking the CRD (hD1AΔCRD) and full-length (hD1A) are shown in the left panel. NFAT-GFP reporter cells expressing hCLEC-2/CD3ζ were incubated with NFAT-GFP reporter cells expressing hD1AΔCRD, hD1A, or mock transfectants (right panel). Receptor activities of hD1A and hD1AΔCRD are shown in Figure 3—figure supplement 1C. (D) Expression levels of an HA-tagged hCLEC-2/CD3ζ mutant lacking the CRD (hCLEC-2ΔCRD) in NFAT-GFP cells was assessed by flow cytometry using an anti-HA tag antibody (gray histograms) (left panel). Open histogram represents unstained controls. NFAT-GFP reporter cells expressing hCLEC-2/CD3ζ or hCLEC-2ΔCRD were incubated with 2B4 cells expressing hDectin-1 (2B4-hD1) (right panel). Data are presented as mean ± SD. These results are representative of three independent experiments. An unpaired two-tailed Student t-test was used for all statistical analyses. *p<0.05.
Figure 3—figure supplement 1
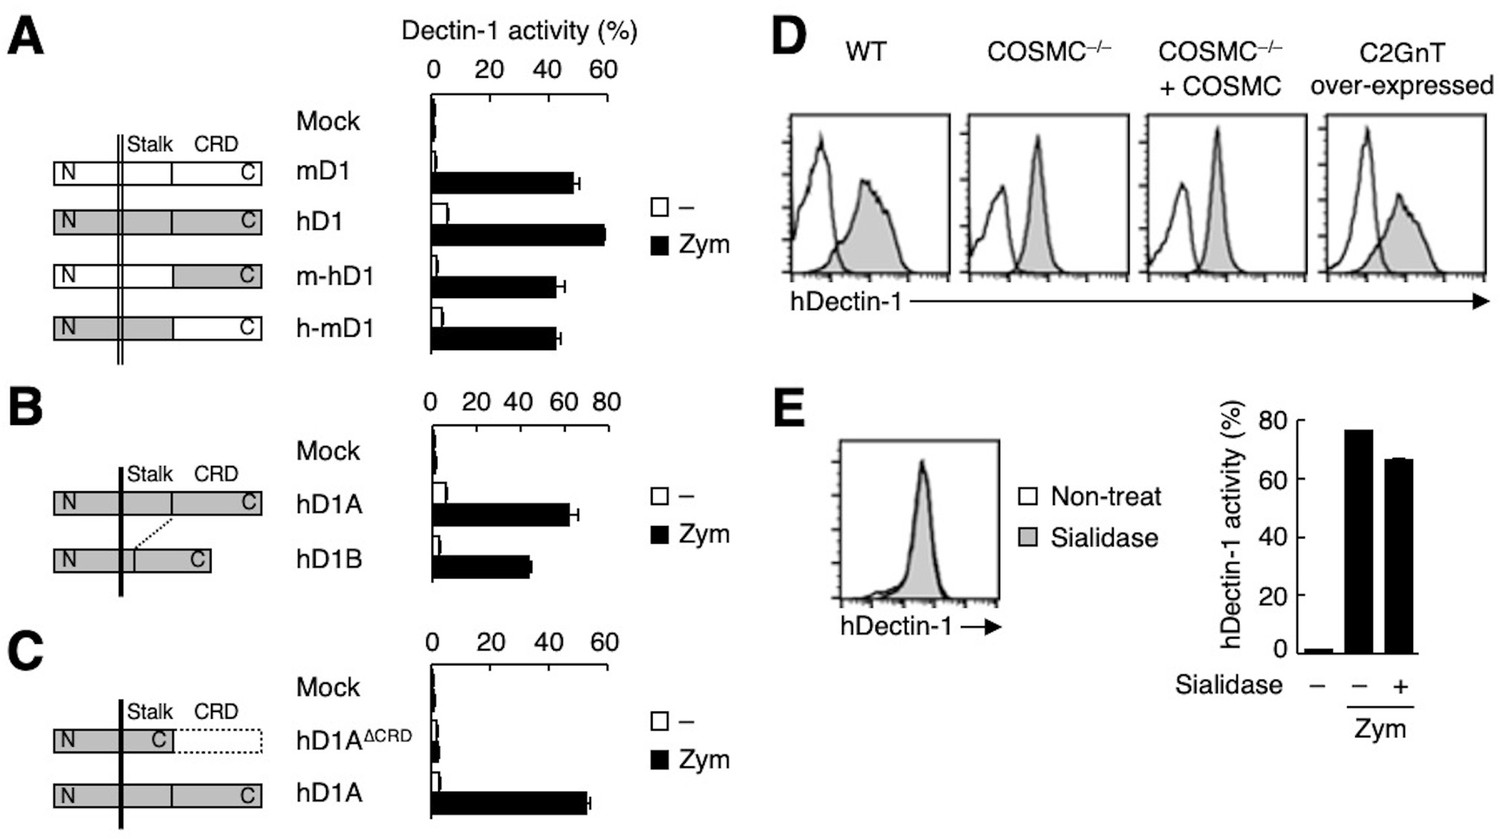
Glycosylation of the stalk region of hDectin-1 mediates recognition by CLEC-2.
(A) Schematic representations of mouse Dectin-1 (mD1), human Dectin-1 (hD1), and two chimeric mutants (m-hD1, and h-mD1) are shown in the left panel. NFAT-GFP reporter cells expressing these constructs were incubated with zymosan (right panel). ‘–’: cells without stimulants. (B) Schematic representations of hD1A and hD1B are shown in the left panel. NFAT-GFP reporter cells expressing hD1 were incubated with zymosan (right panel). ‘–’: cells without stimulants. (C) Schematic representations of hD1AΔCRD and hD1A are shown in the left panel. NFAT-GFP reporter cells expressing these constructs were incubated with zymosan (right panel). ‘–’: cells without stimulants. (D) The surface expression levels of hDectin-1 in wild-type (WT), COSMC KO (COSMC−/−), recaptured COSMC (COSMC−/− + COSMC), and C2GnT overexpressed cells were evaluated using anti-hDectin-1 antibody (gray histograms). Open histograms represent unstained controls. (E) The surface expression levels of hDectin-1 in non-treated (open histogram) and sialidase-treated cells (gray histogram) were evaluated using an anti-hDectin-1 antibody (left panel). Non-treated or sialidase-treated NFAT-GFP reporter cells expressing hDectin-1 were incubated with zymosan (right panel). ‘–’: cells without indicated stimulants. Data are presented as mean ± SD (A, B, C, and E). These results are representative of three independent experiments.
Figure 4
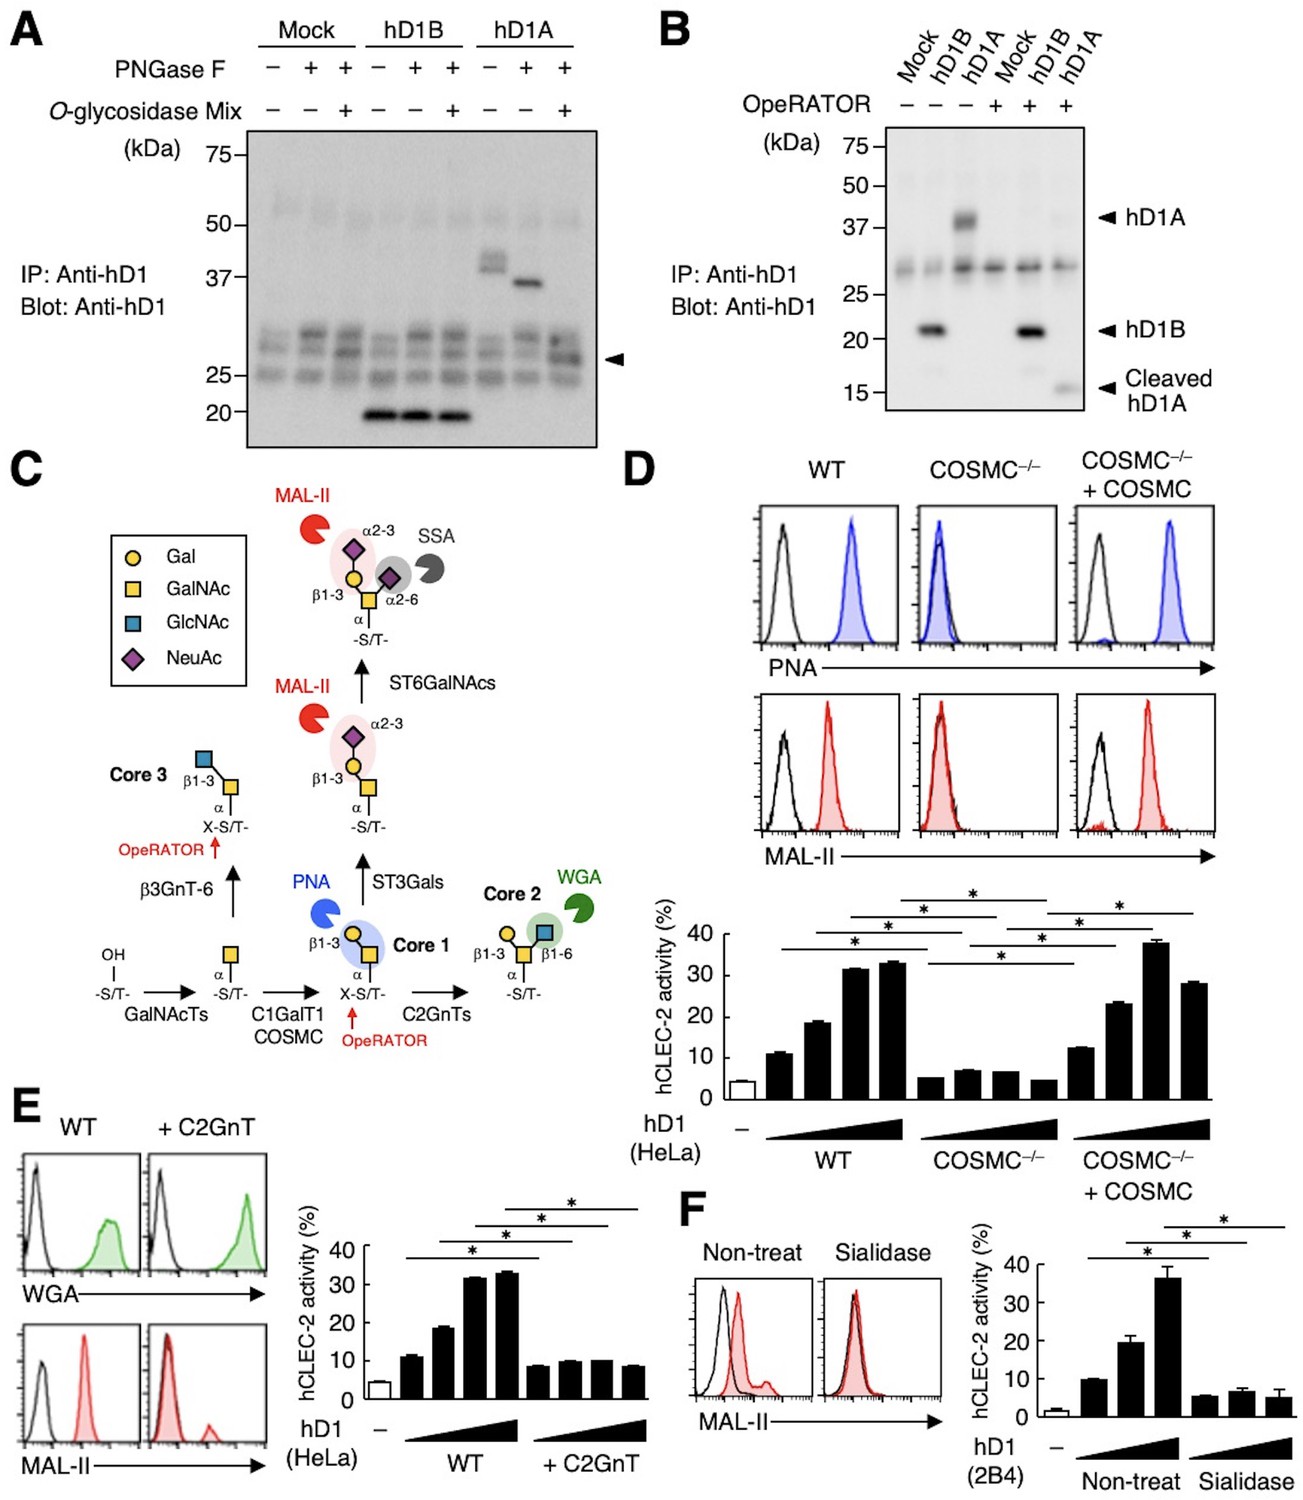
The sialylated core 1 O-glycan of hDectin-1 is required for its interaction with CLEC-2.
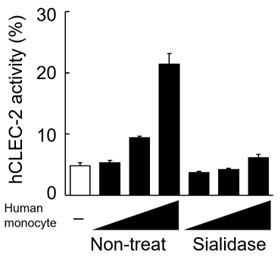
(A) Mock transfectants, and hDectin-1B (hD1B) and hDectin-1A (hD1A) were immunoprecipitated with anti-hDectin-1 antibody and treated with PNGase F alone or PNGase F with O-glycosidase mix which contains O-glycosidase, Neuraminidase and N-acetylhexosaminidase. The calculated molecular mass of the core hDectin-1A polypeptide (27 kDa) is indicated with an arrowhead. ‘−’: cells without indicated glycosidases. The raw images of Western blot were shown in Figure 4—source data 1. (B) Mock transfectants and hDectin-1B (hD1B) and hDectin-1A (hD1A) transfectants were immunoprecipitated with anti-hDectin-1 antibody and treated with the glycosylation-specific protease OpeRATOR. Intact and cleaved hDectin-1 were detected using an anti-hDectin-1 polyclonal antibody (arrowheads). ‘−’: cells without OpeRATOR. The raw images of Western blot were shown in Figure 4—source data 2. (C) Schematic drawing of the O-glycosylation pathway modified according to Varki, 2017. Monosaccharides are depicted according to the Symbol Nomenclature for Graphical Representation of Glycans (Varki et al., 2015). The responsible glycosyltransferases in each pathway are labeled adjacent to arrows. The abbreviations of these enzymes are as following; GalNAcT: N-acetylgalactosaminyltransferase, C1GalT1: core 1 β1–3 galactosyltransferase 1, COSMC: C1GalT1-specific chaperone, C2GnT: core 2 β1–6 N-acetylglucosaminyltransferase, β3GnT6: β1–3 N-acetylglucosaminyltransferase 6, ST3Gal: N-acetyllactosaminide α2–3 sialyltransferase, ST6GalNAc: N-acetylgalactosamine α2–6 sialyltransferase. The ligand specificities of the MAL-II, PNA, WGA, and SSA lectins are also highlighted in red, blue, green, and gray, respectively. The cleavage sites of OpeRATOR in core 1 and 3 glycans are indicated by red arrows. (D) Surface expression levels of core 1 and NeuAcα2–3 Gal disaccharide units on wild-type (WT), COSMC knockout (COSMC−/−), and recaptured COSMC (COSMC−/−+COSMC) were detected using PNA (blue histograms) or MAL-II lectins (red histograms) (upper panels). NFAT-GFP reporter cells expressing hCLEC-2/CD3ζ were incubated with wild-type, COSMC knockout, and recaptured COSMC HeLa cells (0.1, 0.3, 1, and 3×10⁴ cells/well) (lower panel). ‘−’: cells without stimulants. Surface expression levels of hDectin-1 in wild-type or mutated cells are shown in Figure 3—figure supplement 1D. (E) The surface expression levels of GlcNAc and NeuAcα2–3 Gal on wild-type and C2GnT-overexpressing HeLa cells were detected using WGA (green histograms) and MAL-II lectin (red histograms) (left panels). NFAT-GFP reporter cells expressing hCLEC-2/CD3ζ were incubated with wild-type (WT) and C2GnT-overexpressing (+C2GnT) hDectin-1 (hD1) transfectant HeLa cells (0.1, 0.3, 1, and 3×10⁴ cells/well) (right panel). ‘−’: cells without stimulants. Surface expression levels of hDectin-1 in wild-type and C2GnT-overexpressing cells are shown in Figure 3—figure supplement 1D. (F) The surface expression levels of NeuAcα2–3 Gal on untreated and sialidase-treated 2B4 cells expressing hDectin-1 were detected using MAL-II lectins (red histograms) (left panels). NFAT-GFP reporter cells expressing hCLEC-2/CD3ζ were incubated with untreated and sialidase-treated 2B4 cells expressing hDectin-1 (hD1) (0.3, 1, and 3×10⁴ cells/well) (right panel). ‘−’: cells without stimulants. Surface expression levels and receptor activities of hDectin-1 in non-treated and sialidase-treated cells are shown in Figure 3—figure supplement 1E. Data are presented as mean ± SD. These results are representative of at least three independent experiments. An unpaired two-tailed Student t-test was used for all statistical analyses. *p<0.05.
-
Figure 4—source data 1
Unedited and labeled Western blot in Figure 4A.
- https://cdn.elifesciences.org/articles/83037/elife-83037-fig4-data1-v2.zip
-
Figure 4—source data 2
Unedited and labeled Western blot in Figure 4B.
- https://cdn.elifesciences.org/articles/83037/elife-83037-fig4-data2-v2.zip
Figure 5 with 2 supplements
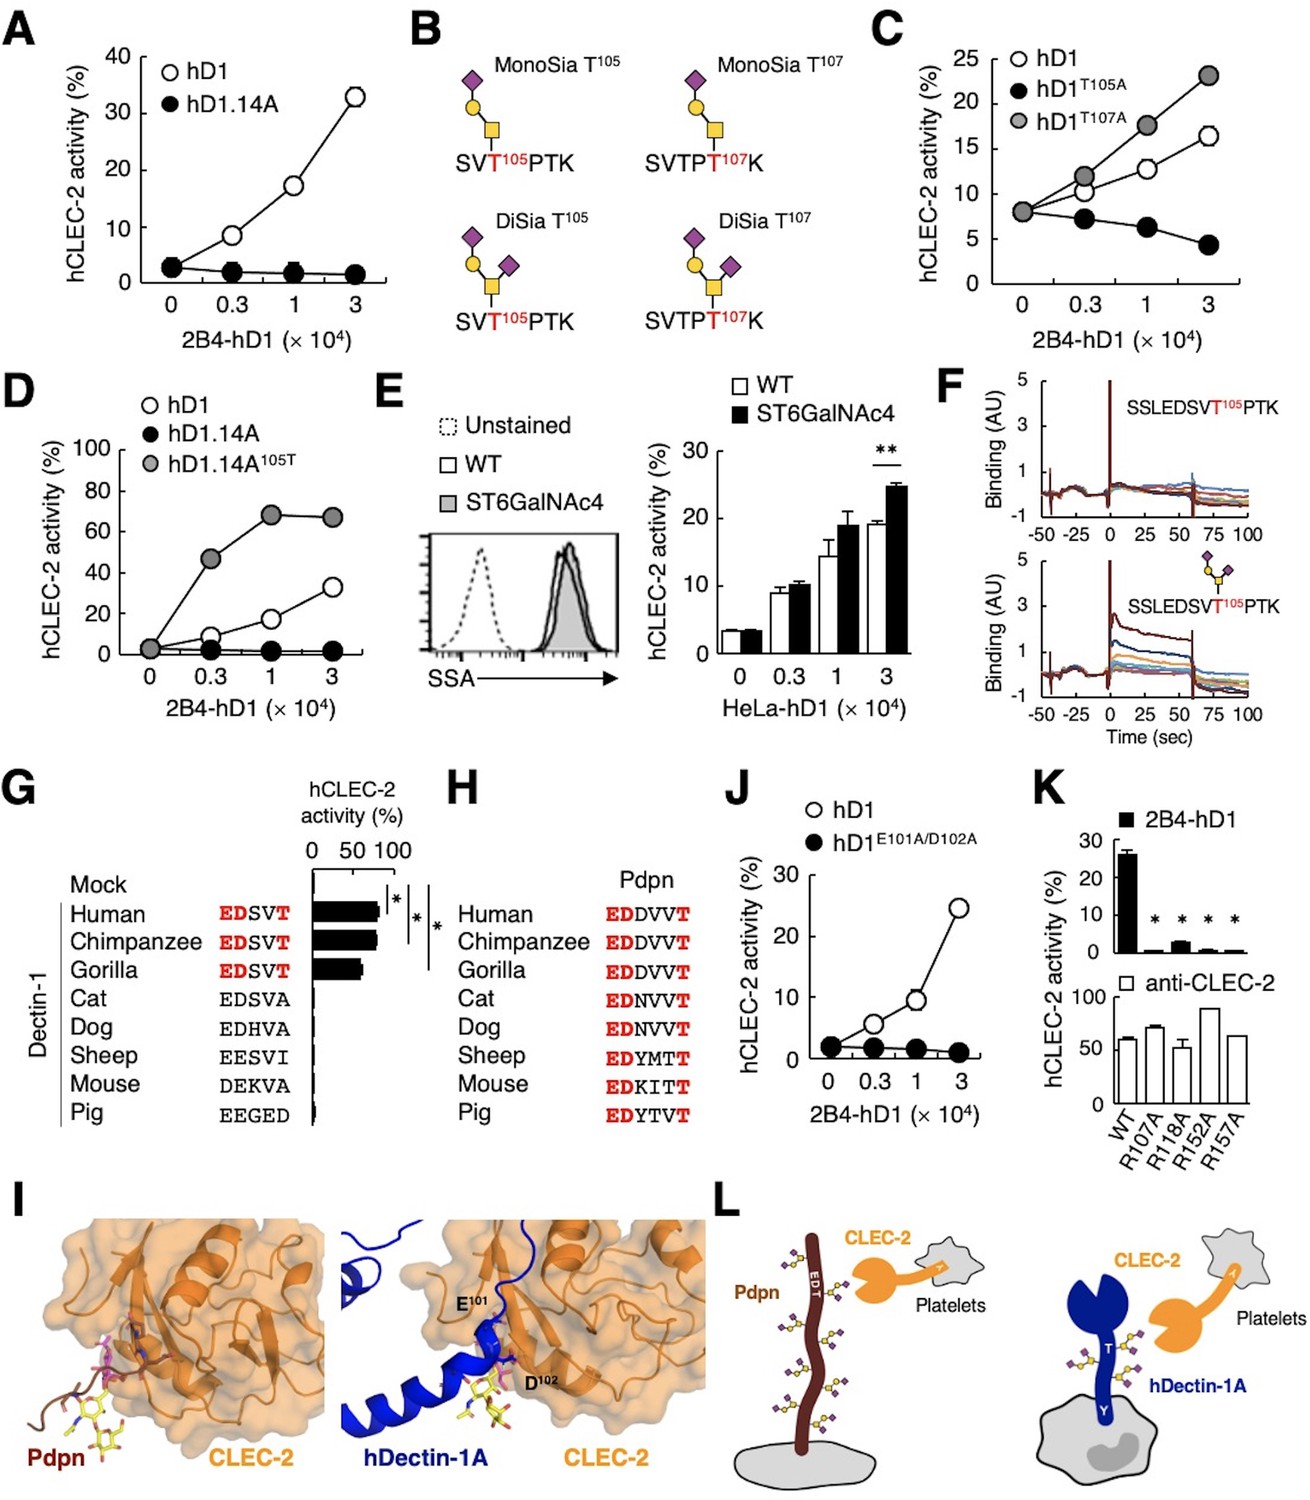
The sialylated O-glycan at T105 and adjacent amino acids are required for hDectin-1 binding of CLEC-2.
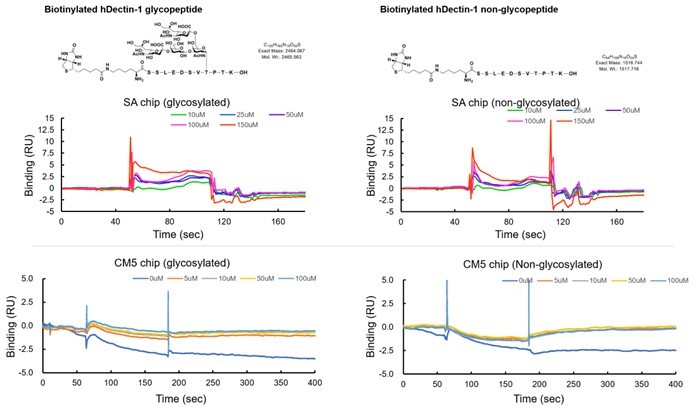
(A) Interaction of CLEC-2 with wild-type or an O-glycan-less mutant of hDectin-1 (hD1.14A). NFAT-GFP reporter cells expressing hCLEC-2/CD3ζ were incubated with the indicated number of 2B4 cells expressing wild-type hDectin-1 (hD1, open circles) and hD1.14A (filled circles). Details of the mutated constructs are summarized in Figure 5—figure supplement 1A. (B) O-glycan structures attached at T105 or T107 as detected by LC-ESI MS analysis. A monosialylated (MonoSia) or disialylated (DiSia) glycan was potentially attached at T105 or T107. Details of the mass spectrometric analysis are shown in Figure 5—figure supplement 2. (C) Effect of alanine mutations in T105 or T107. NFAT-GFP reporter cells expressing hCLEC-2/CD3ζ were incubated with the indicated number of 2B4 cells expressing wild-type (open circles), T105A (hD1T105A, black circles), and T107A mutants of hDectin-1 (hD1T107A, gray circles). Details of the mutated constructs are summarized in Figure 5—figure supplement 1A. (D) Effect of reconstitution of T105 within the hD1.14A-expressing mutant on hDectin-1−CLEC-2 interactions. NFAT-GFP reporter cells expressing hCLEC-2/CD3ζ were incubated with the indicated cell number of 2B4 cells expressing wild-type (open circles), hD1.14A (black circles), or hD1.14A mutant reconstituted with T105 (hD1.14A105T) (gray circles). Details of the mutated constructs are summarized in Figure 5—figure supplement 1A. (E) Effect on the hDectin-1−CLEC-2 interaction of overexpression of ST6GalNAc4 using HeLa cells expressing hDectin-1. The surface expression levels of α2–6-linked sialic acid on wild-type (open histograms) and ST6GalNAc4-overexpressing HeLa cells (gray histograms) were detected using SSA lectin (left panel). Dotted line represents unstained control. NFAT-GFP reporter cells expressing hCLEC-2/CD3ζ were incubated with the indicated number of wild-type and ST6GalNAc4-overexpressing HeLa cells (right panel). (F) Surface plasmon resonance assay of recombinant CLEC-2 CRD and non-glycosylated (upper panel) or fully glycosylated (lower panel) hDectin-1 peptides. (G) Multiple amino acid sequence alignment of Dectin-1 derived from various mammalian species (left panel). The critical amino acid residues for CLEC-2 interaction are highlighted in red. NFAT-GFP reporter cells expressing hCLEC-2/CD3ζ were incubated with NFAT-GFP reporter cells expressing Dectin-1 derived from various species, or mock transfectants (right panel). (H) Multiple amino acid sequence alignment of Pdpn derived from various mammalian species. The critical amino acid residues for CLEC-2 interaction are highlighted in red. (I) Structural comparison between crystal structure of the CLEC-2 CRD−Pdpn complex (PDB code: 3WSR) (left panel) and docking model of the CLEC-2 CRD−hDectin-1 complex (right panel). These two figures are depicted from the same angle of view. (J) Effect of the E101A/D102A hDectin-1 mutant (hD1E101A/D102A) on the interaction with hCLEC-2. NFAT-GFP reporter cells expressing hCLEC-2/CD3ζ were incubated with the indicated number of 2B4 cells expressing hD1 (open circles) or hD1E101A/D102A (filled circles). Details of the mutated constructs are summarized in Figure 5—figure supplement 1A. (K) Effect of hCLEC-2 mutants on interactions with hDectin-1 or an anti-CLEC-2 antibody. Four Arg residues (R107, R118, R152, and R157) of hCLEC-2, which are required for the interaction with Pdpn, were replaced with Ala residues. NFAT-GFP reporter cells expressing wild-type or mutated hCLEC-2/CD3ζ were co-cultured with 2B4 cells expressing hDectin-1 (hD1, upper panel) or stimulated with plate-coated anti-hCLEC-2 antibody (lower panel). Data are presented as mean ± SD. *p<0.05, versus WT. (L) Schematic drawings of the CLEC-2−Pdpn interaction and the CLEC-2−hDectin-1 interaction. These results are representative of at least two independent experiments. An unpaired two-tailed Student t-test was used for all statistical analyses. **p<0.01, *p<0.05.
Figure 5—figure supplement 1
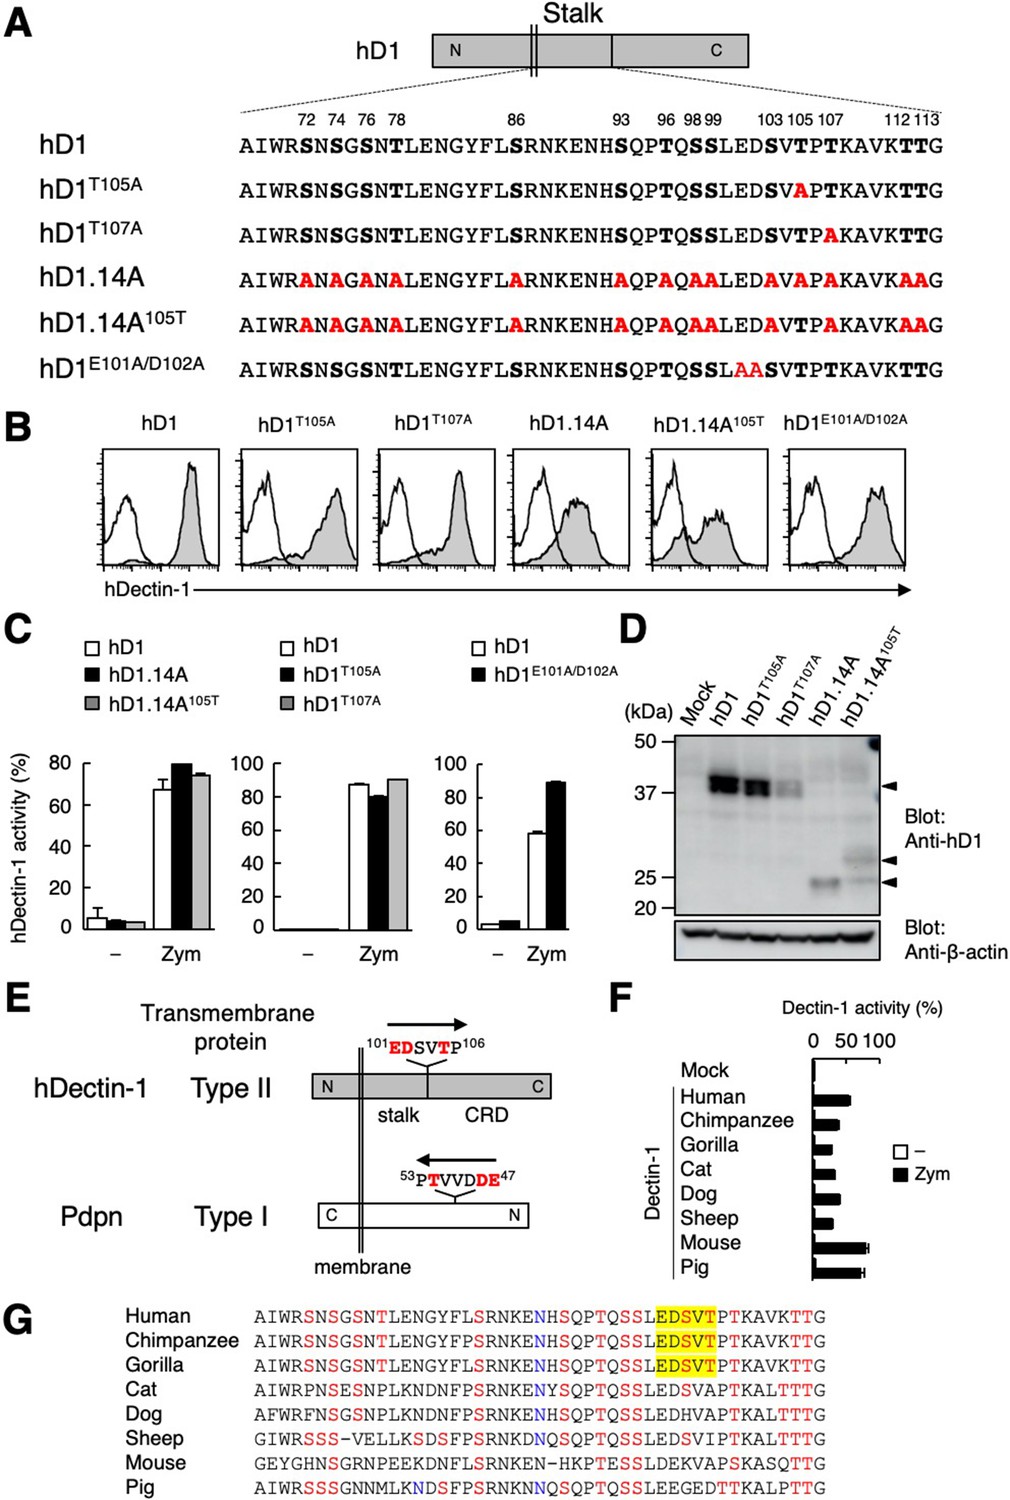
Glycosylation motif in hDectin-1 required for CLEC-2 binding.
(A) Amino acid sequences of the stalk region in wild-type (hD1) and mutated hDectin-1. 14 Ser and Thr residues which are potential O-glycosylation sites in the stalk region are shown in bold letters. The positions of mutated alanine are highlighted in red. (B) The surface expression levels of hDectin-1 in 2B4 cells expressing wild-type, hD1T105A, hD1T107A, hD1.14A, hD1.14A105T, or hD1E101A/D102A were assessed using an anti-hDectin-1 antibody (gray histograms). Open histograms represent isotype controls isotype control (mouse IgG2a κ). (C) NFAT-GFP reporter cells expressing hD1, hD1T105A, hD1T107A, hD1.14A, hD1.14A105T, or hD1E101A/D102A were stimulated with zymosan. ‘–’: cells without stimulants. (D) Expression of hD1, hD1T105A, hD1T107A, hD1.14A, and hD1.14A105T was detected by Western blot using an anti-hDectin-1 polyclonal antibody (upper panel). Arrowheads indicate corresponding bands of WT or mutant hDectin-1. Expression of β-actin was shown as a loading control (lower panel). SDS-PAGE was performed using 10% acrylamide gels under reducing conditions. The raw image of Western blot was shown in Figure 5—figure supplement 1—source data 1. (E) Schematic representations of topological difference between hDectin-1 and Pdpn. Arrows show the direction of translation. The amino acid residues critical for CLEC-2 interaction are highlighted in red. (F) NFAT-GFP reporter cells expressing Dectin-1 derived from the indicated species or mock transfectants were stimulated with 80 μg/ml zymosan. ‘–’: cells without stimulants. (G) Primates utilize the mucin-like domain as CLEC-2 binding motif. Multiple amino acid sequence alignment of Dectin-1 stalk region among species. Potential O-glycosylation and N-glycosylation sites are colored in red and blue, respectively. CLEC-2 binding motifs are highlighted in yellow. Data are presented as mean ± SD (C, F). These results are representative of at least two independent experiments.
-
Figure 5—figure supplement 1—source data 1
Unedited and labeled Western blot in Figure 5—figure supplement 1D.
- https://cdn.elifesciences.org/articles/83037/elife-83037-fig5-figsupp1-data1-v2.zip
Figure 5—figure supplement 2
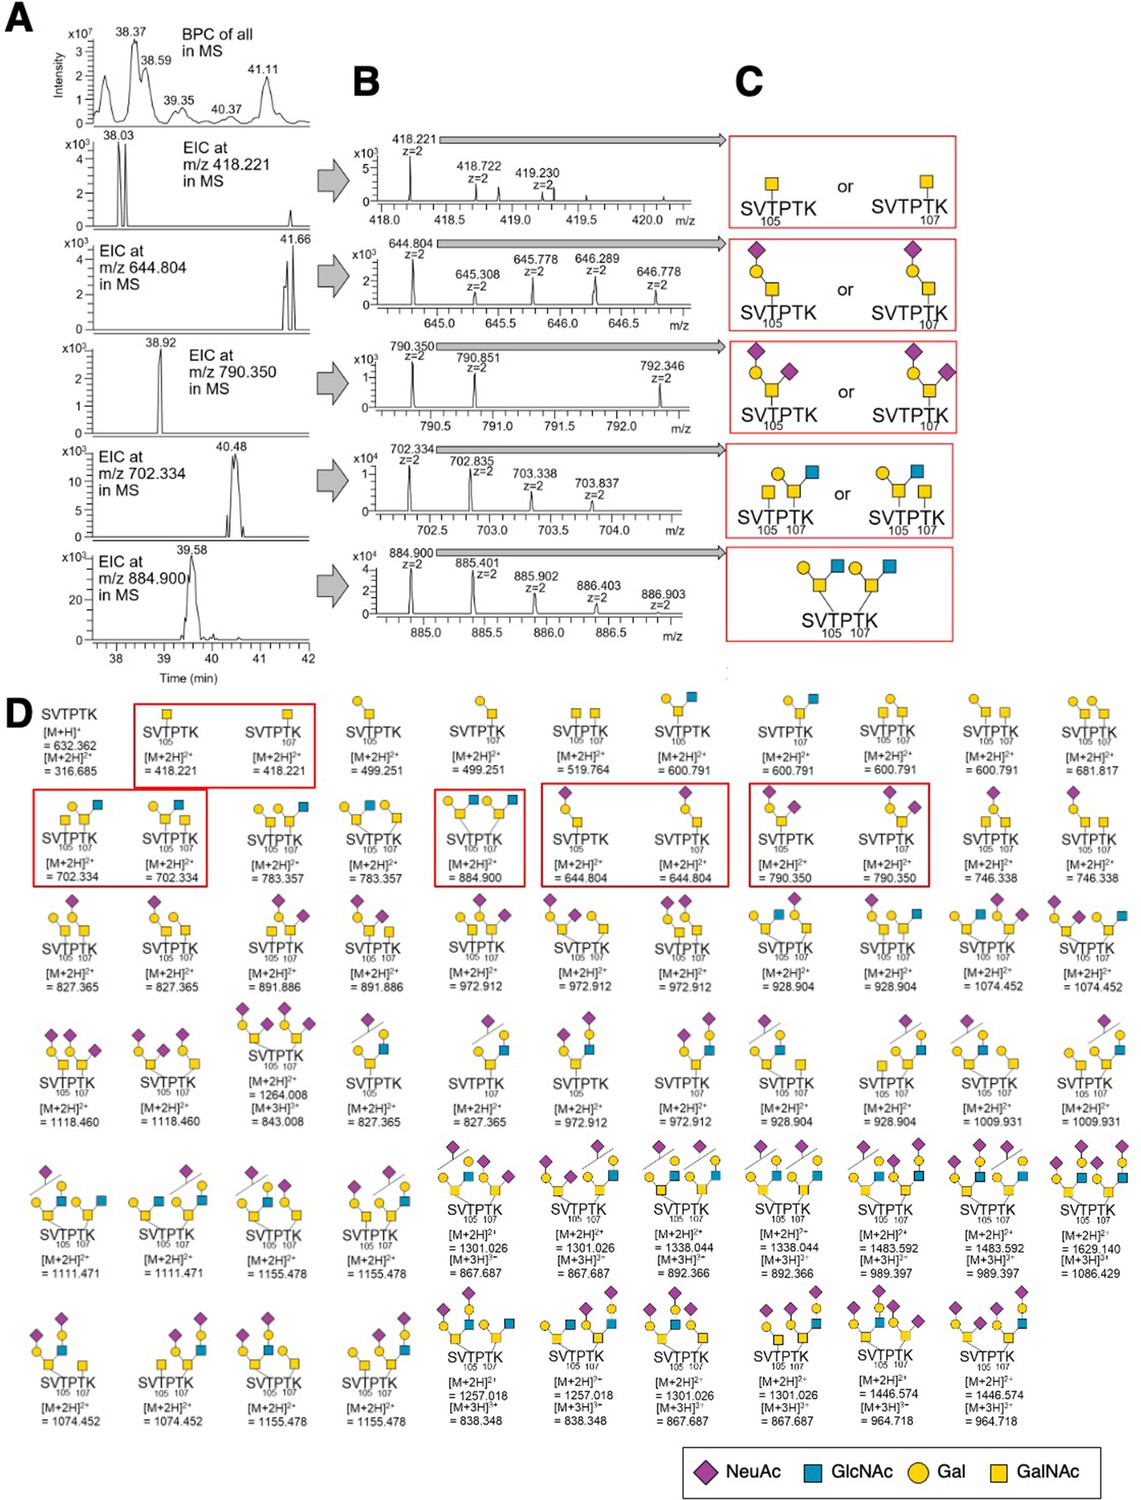
O-Glycan-structural analysis of hDectin-1 using LC-ESI MS.
(A) The top panel shows the base peak chromatogram (BPC, from 37.5 to 42.0 min) for the MS analysis of the gel band proteins digested with trypsin and Glu-C. Panels 2-6 show the extracted ion chromatograms (EICs) of glycopeptides containing T105-O-glycan and T107-O-glycan (S103−K108) observed in MS analysis. (B) MS spectra at each time of each peak detected in each EIC in panel A. (C) The deduced O-glycan structures at T105 and T107 on hDectin-1 peptide S103−K108. (D) These glycopeptides (S103−K108) were searched using EIC. Only glycopeptides boxed in red were detected. The results of analysis of the glycopeptides boxed in red are shown in A, B, and C. We also detected various types of O-glycans including N-glycolyl neuraminic acid (Neu5Gc), which is a kind of sialic acid synthesized by mouse but not human cells. These glycans were omitted from this figure for clarity.
Figure 6 with 1 supplement

hDectin-1 does not induce platelet aggregation but rescues embryonic lethality in Pdpn-null mice.
(A) The surface expression levels of hDectin-1 (black histograms) and human Pdpn (hPdpn, gray histograms) in 2B4 transfectant cells were evaluated with anti-hDectin-1 and anti-hPdpn antibodies, respectively (left panels). Open histograms represent unstained controls. NFAT-GFP reporter cells expressing hCLEC-2/CD3ζ were stimulated with the indicated cell number of 2B4 cells expressing hDectin-1 (black circles) or hPdpn (gray circles) (right panel). Data are presented as mean ± SD. (B) Platelet aggregation triggered by hDectin-1 or hPdpn. Human platelets were washed and stimulated with 1×10⁵ 2B4 cells expressing hDectin-1 (black line) or hPdpn (gray line). (C) Surface expression levels of hDectin-1 (hD1) on splenocytes isolated from wild-type (WT) and hD1 Tg mice were analyzed using an isotype control (mouse IgG1 κ, open histograms) or an anti-hDectin-1 antibody BC2 (gray histograms). (D) Immunoprecipitated splenocytes from WT and hD1 Tg mice were treated with OpeRATOR. Intact and cleaved hD1A was detected using an anti-hDectin-1 monoclonal antibody (arrowheads). ‘−’: cells without OpeRATOR. These results are representative of three independent experiments. The raw image of western blot was shown in Figure 6—source data 1. (E) The whole images of E17.5 WT, Pdpn–/–, and hDectin-1 Tg×Pdpn–/– embryos. (F, G) Whole-mount triple fluorescence confocal microscopy of embryonic back skin from E17.5 WT, Pdpn–/–, and hDectin-1 Tg×Pdpn–/– embryos using antibodies against LYVE-1 (green), Ter-119 (blue), and PECAM-1 (red). N (F, G): WT=4, Pdpn–/–=2, hDectin-1 Tg×Pdpn–/–=4. Representative low and high magnification images are shown in (F) and (G), respectively. Area enclosed with white dotted-lines in the Ter-119 panels in (G) indicates the region of lymphatic vessels. Scale bars, 200 μm in (F) and 50 μm in (G).
-
Figure 6—source data 1
Unedited and labeled Western blot in Figure 6B.
- https://cdn.elifesciences.org/articles/83037/elife-83037-fig6-data1-v2.zip
Figure 6—figure supplement 1
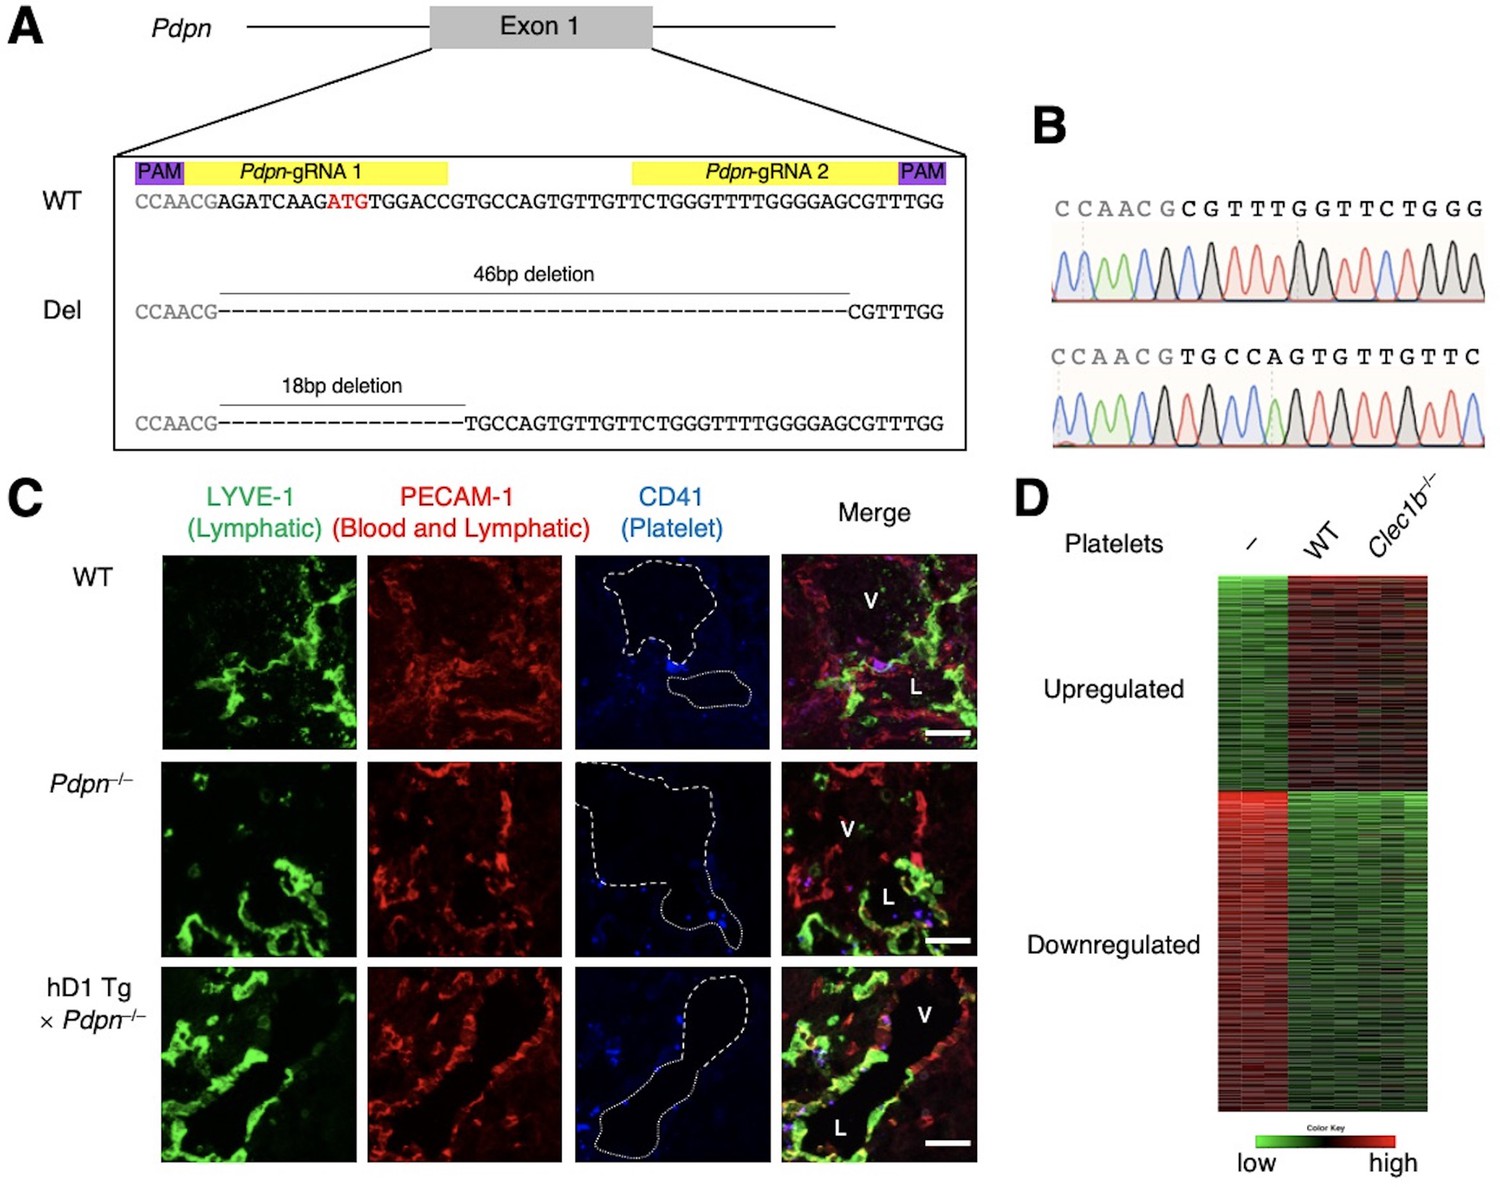
Role of hDectin-1−CLEC-2 interaction in immune homeostasis.
(A) Allelic sequences of mice mutated in the Pdpn locus obtained using the CRISPR-Cas9 system. Two gRNAs, indicated in yellow, were designed to target the wild-type allele and create mutations disrupting the start codon in exon 1, indicated in red. PAM sites are indicated in purple. Genomic sequences of two mutant alleles generated using the CRISPR-Cas9 system are shown in the lower panel. Two Pdpn-deficient founders (lines 1 and 2) were maintained and used for this study. (B) Genomic sequences of two mutant alleles around the target sequences of the gRNAs. Sanger sequencing chromatograms of genomic DNA from two alleles are shown. (C) Triple fluorescence confocal microscopy of the cardinal vein junction and lymphatic sacs using antibodies against LYVE-1 (green), PECAM-1 (red), and CD41 (blue) to analyze E13.5 WT (upper panels), Pdpn–/– (middle panels), and hDectin-1 Tg×Pdpn–/– embryos (lower panels). N: WT=4, Pdpn–/–=3, hDectin-1 Tg×Pdpn–/–=3. Representative high magnification photomicrographs are shown. Area enclosed with white dotted and dashed lines indicates the regions of lymphatic sacs (labeled as L in rightmost panel) and cardinal veins (labeled as V in rightmost panel), respectively. Scale bars, 50 μm. (D) CLEC-2 on platelets does not induce CLR-mediated signaling through hDectin-1 in human monocytes. Heat map showing the gene expressions in human monocytes co-cultured with or without platelets isolated from wild-type or Clec1b−/− mice after 8 hr (n=3 per group). Significantly up- (colored in red) and downregulated genes (colored in green) in monocytes stimulated with murine platelets were selected.
Author response image 1
Author response image 2
Author response image 3
Tables
Table 1
Analysis of offspring derived from the intercross of human Dectin-1 Tg × Pdpn+/– or Pdpn+/−.
Human Dectin-1 Tg × Pdpn+/–, or Pdpn+/– mice were intercrossed. The number of offspring with the Pdpn+/+, Pdpn+/– or Pdpn–/– genotype with the indicated background genotype are shown. Numbers in parentheses indicate the expected number of pups. The significance of differences compared with Pdpn–/– on a wild-type background was evaluated using the chi-square test. *, 0.01<p < 0.05. Statistical analysis was performed using JMP 14 software (Statistical Analysis System, Cary, NC).
| Genotype | Pdpn | ||
|---|---|---|---|
| +/+ | +/– | –/– | |
| Wild-type | 36 (24) | 60 (48) | 0 (24) |
| hDectin-1 Tg | 26 (20) | 44 (40) | 10 (20)∗ |
Additional files
-
Supplementary file 1
List of primers and gRNAs used in this study.
- https://cdn.elifesciences.org/articles/83037/elife-83037-supp1-v2.docx
-
Supplementary file 2
List of antibodies used in this study.
- https://cdn.elifesciences.org/articles/83037/elife-83037-supp2-v2.docx
-
MDAR checklist
- https://cdn.elifesciences.org/articles/83037/elife-83037-mdarchecklist1-v2.pdf
Download links
A two-part list of links to download the article, or parts of the article, in various formats.
Downloads (link to download the article as PDF)
Open citations (links to open the citations from this article in various online reference manager services)
Cite this article (links to download the citations from this article in formats compatible with various reference manager tools)
Human Dectin-1 is O-glycosylated and serves as a ligand for C-type lectin receptor CLEC-2
eLife 11:e83037.
https://doi.org/10.7554/eLife.83037


