Architecture of the chikungunya virus replication organelle
- Department of Medical Biochemistry and Biophysics, Umeå University, Sweden
- Molecular Infection Medicine Sweden, Umeå University, Sweden
- Wallenberg Centre for Molecular Medicine, Umeå University, Sweden
- Umeå Centre for Microbial Research (UCMR), Sweden
- Max Planck Institute for the Physics of Complex Systems, Germany
- Department of Mathematics, Mechanics Division, University of Oslo, Norway
Figures
Figure 1 with 4 supplements
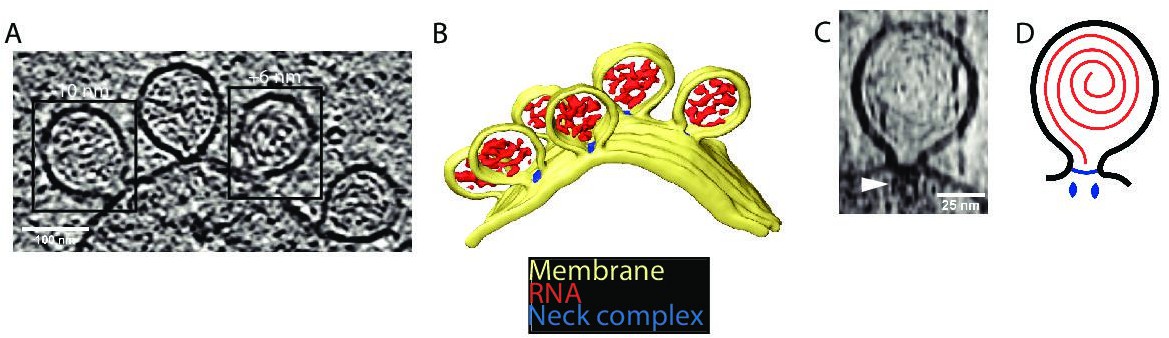
Cryo-electron tomography visualizes chikungunya virus (CHIKV) spherules at the plasma membrane.
(A) Computational slice through a cryo-electron tomogram of a CHIKV viral replicon particle (VRP)-transduced baby hamster kidney (BHK) cell. The two framed insets are offset in the tomogram volume by 7 nm. Scale bar, 100 nm. (B) 3D segmentation of the tomogram shown in (A). Yellow: plasma membrane, red: viral RNA, and blue: protein complex sitting at the spherule necks. (C) Subtomogram containing one spherule. The arrow indicates the densities present at the membrane neck. Scale bar, 25 nm. (D) Schematic of an initial model of the organization of a spherule. Black: plasma membrane, red: viral RNA, and blue: protein complex sitting at the spherule necks.
Figure 1—figure supplement 1
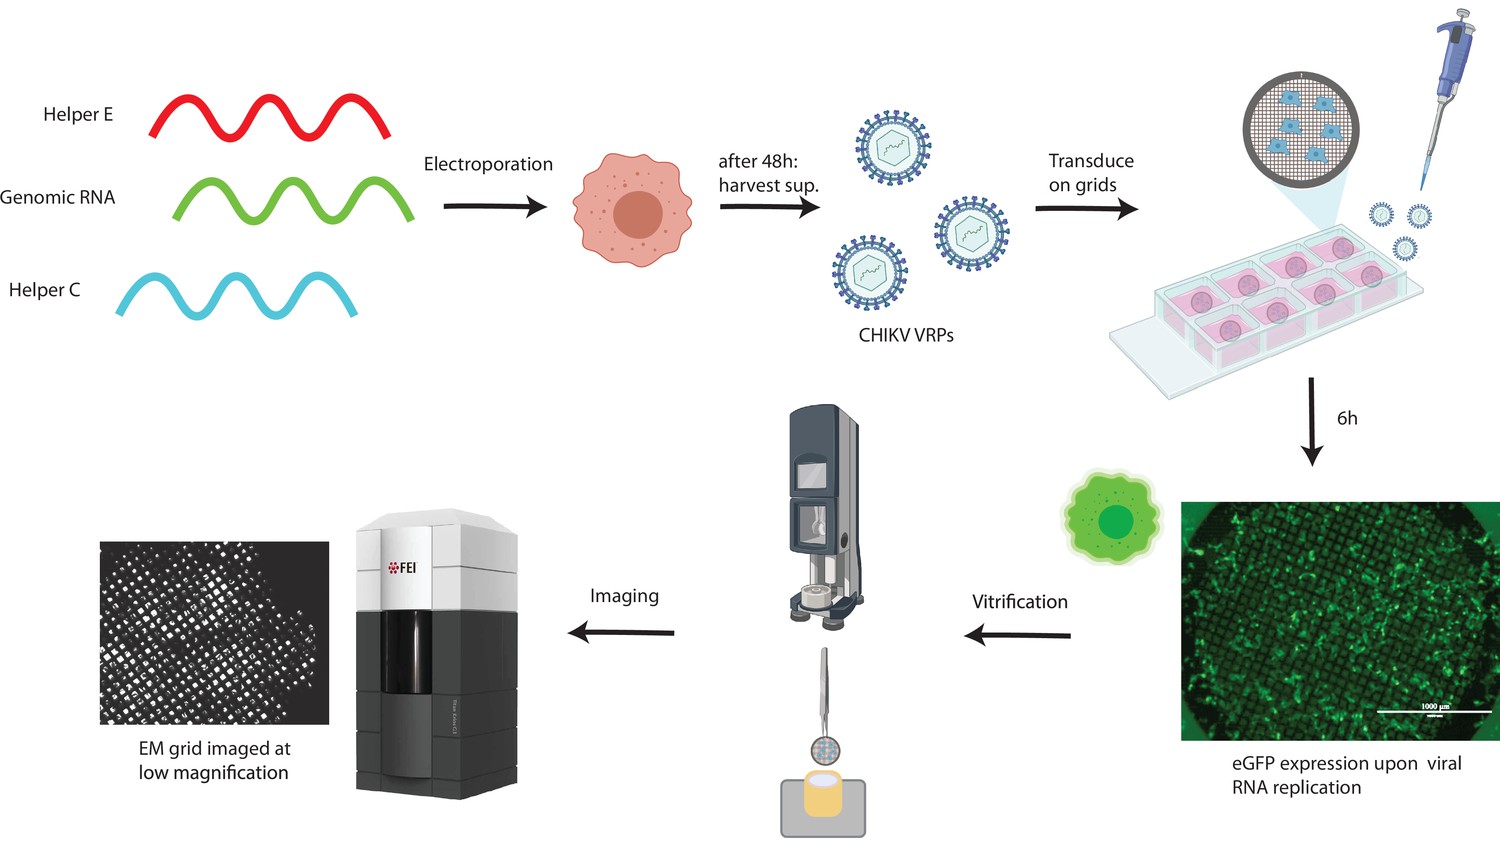
Workflow for cryo-electron tomography of chikungunya virus (CHIKV) viral replicon particle (VRP)-transduced cells.
Production of CHIKV VRPs using three different RNAs (Gläsker et al., 2013). Green: genomic, carries the sequence of the non-structural proteins, and an eGFP sequence under regulation of the sub-genomic (SG) promoter. Red: ‘helper E,’ carries the sequence of E1,E2,E3,6K/TF under regulation of the SG promoter. Blue: ‘helper C,’ carries the sequence of the capsid protein under regulation of the SG promoter. See the Materials and methods section for the detailed procedure. Cells electroporated with these three RNAs produce VRPs that contain the only RNA having a packaging signal, i.e., the ‘genomic RNA’ which is devoid of structural genes. Baby hamster kidney (BHK) cells seeded on EM grids are transduced with CHIKV VRPs, 6 hr after transduction >~90% of cells on grids display green fluorescence (scale bar, 1 mm). After vitrification by plunge-freezing into liquid ethane-propane, cells are imaged at the Titan Krios cryo-transmission electron mictoscope.
Figure 1—video 1
Cryo-electron tomogram of a cluster of chikungunya virus (CHIKV) spherules at the plasma membrane.
The video displays consecutive xy slices through the cryo-electron tomogram also shown in Figure 1.
Figure 1—video 2
Uncropped cryo-electron tomogram of a cluster of chikungunya virus (CHIKV) spherules at the plasma membrane.
The video displays consecutive xy slices through the uncropped cryo-electron tomogram also partially shown in Figure 1 and Figure 1—video 1. The uncropped tomogram allows an overview of how the spherule cluster relates to the cell periphery. Some intracellular features are seen such as a bundle of microtubules on the right and putative cytoplasmic ribosomes in the lower part.
Figure 1—video 3
Tracing of dsRNA filaments in spherules.
The video displays consecutive xy slices through part of the cryo-electron tomogram shown in Figure 1 and Figure 1—videos 1; 2. Overlayed on the tomogram slices is the outcome of the filament tracing for one spherule, with filaments represented in red.
Figure 2 with 1 supplement
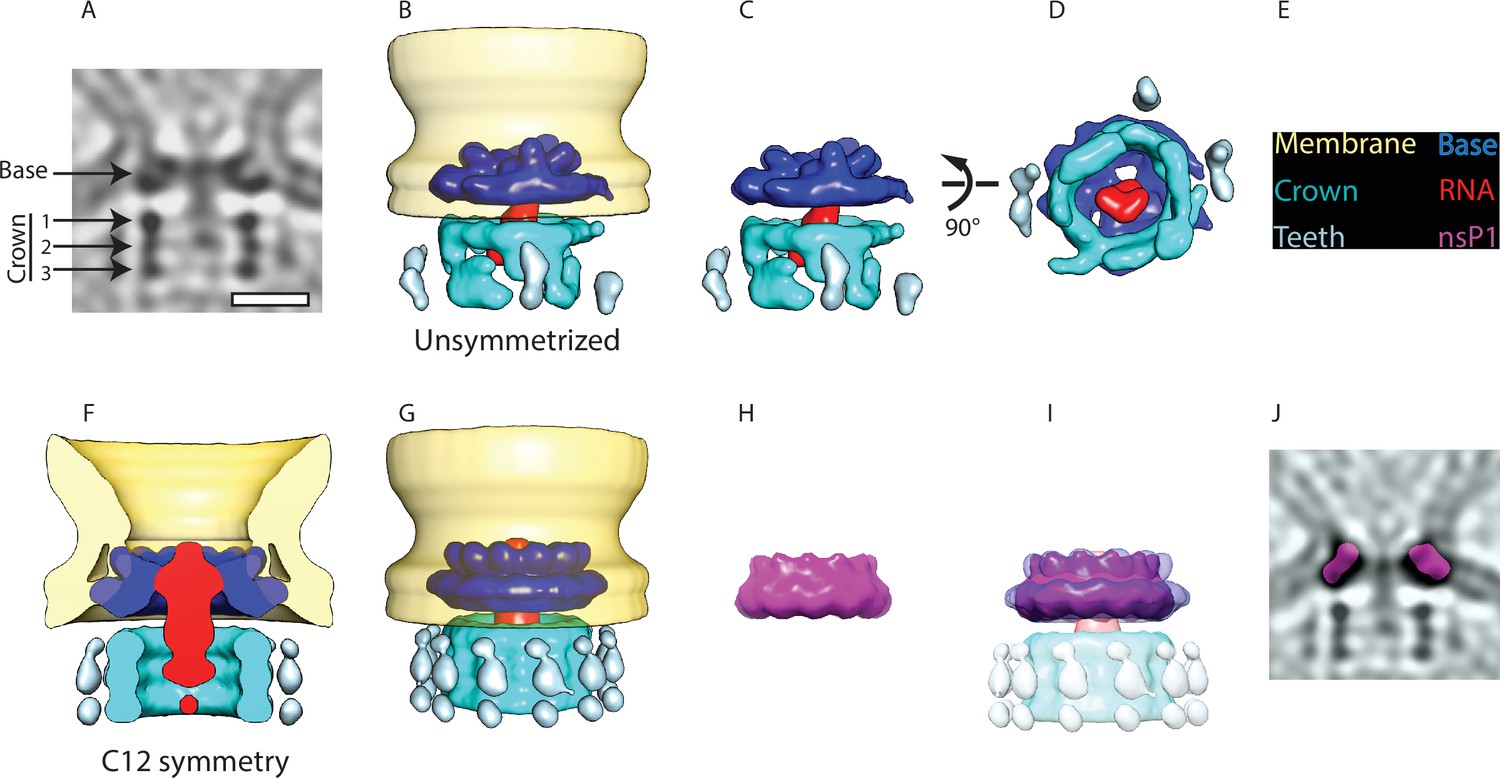
Subtomogram averaging reveals the multipartite nature of the neck complex.
(A) Central slice through the unsymmetrized subtomogram average of the neck complex, low-pass filtered to its Gold-standard resolution 34 Å. Arrows indicate densities that are referred to as the ‘base’ and the ‘crown.’ The crown is located on the cytoplasmic side and is composed of three rings. Density is black. Scale bar, 100 Å. (B) 3D segmentation of the unsymmetrized subtomogram average shown in (A). The spherule membrane (yellow) is radially symmetrized for clarity. Dark blue: base, red: putative RNA, cyan: crown, and light blue: teeth. (C and D) Two views of the neck complex related by the indicated rotation. (E) Color key for all panels. (F) Cross-section through the subtomogram average of the neck complex with C12 symmetry imposed, low-pass filtered to its Gold-standard resolution 28 Å. (G) Surface view corresponding to (F). (H) The structure of the isolated nsP1 (from Jones et al., 2021) low-pass filtered to the resolution of our average. (I) Superimposition of nsP1 onto the base of the protein neck complex. (J) Slice through the unsymmetrized subtomogram average, as in (A), with a slice of the fitted nsP1 superimposed on the base of the complex.
Figure 2—figure supplement 1
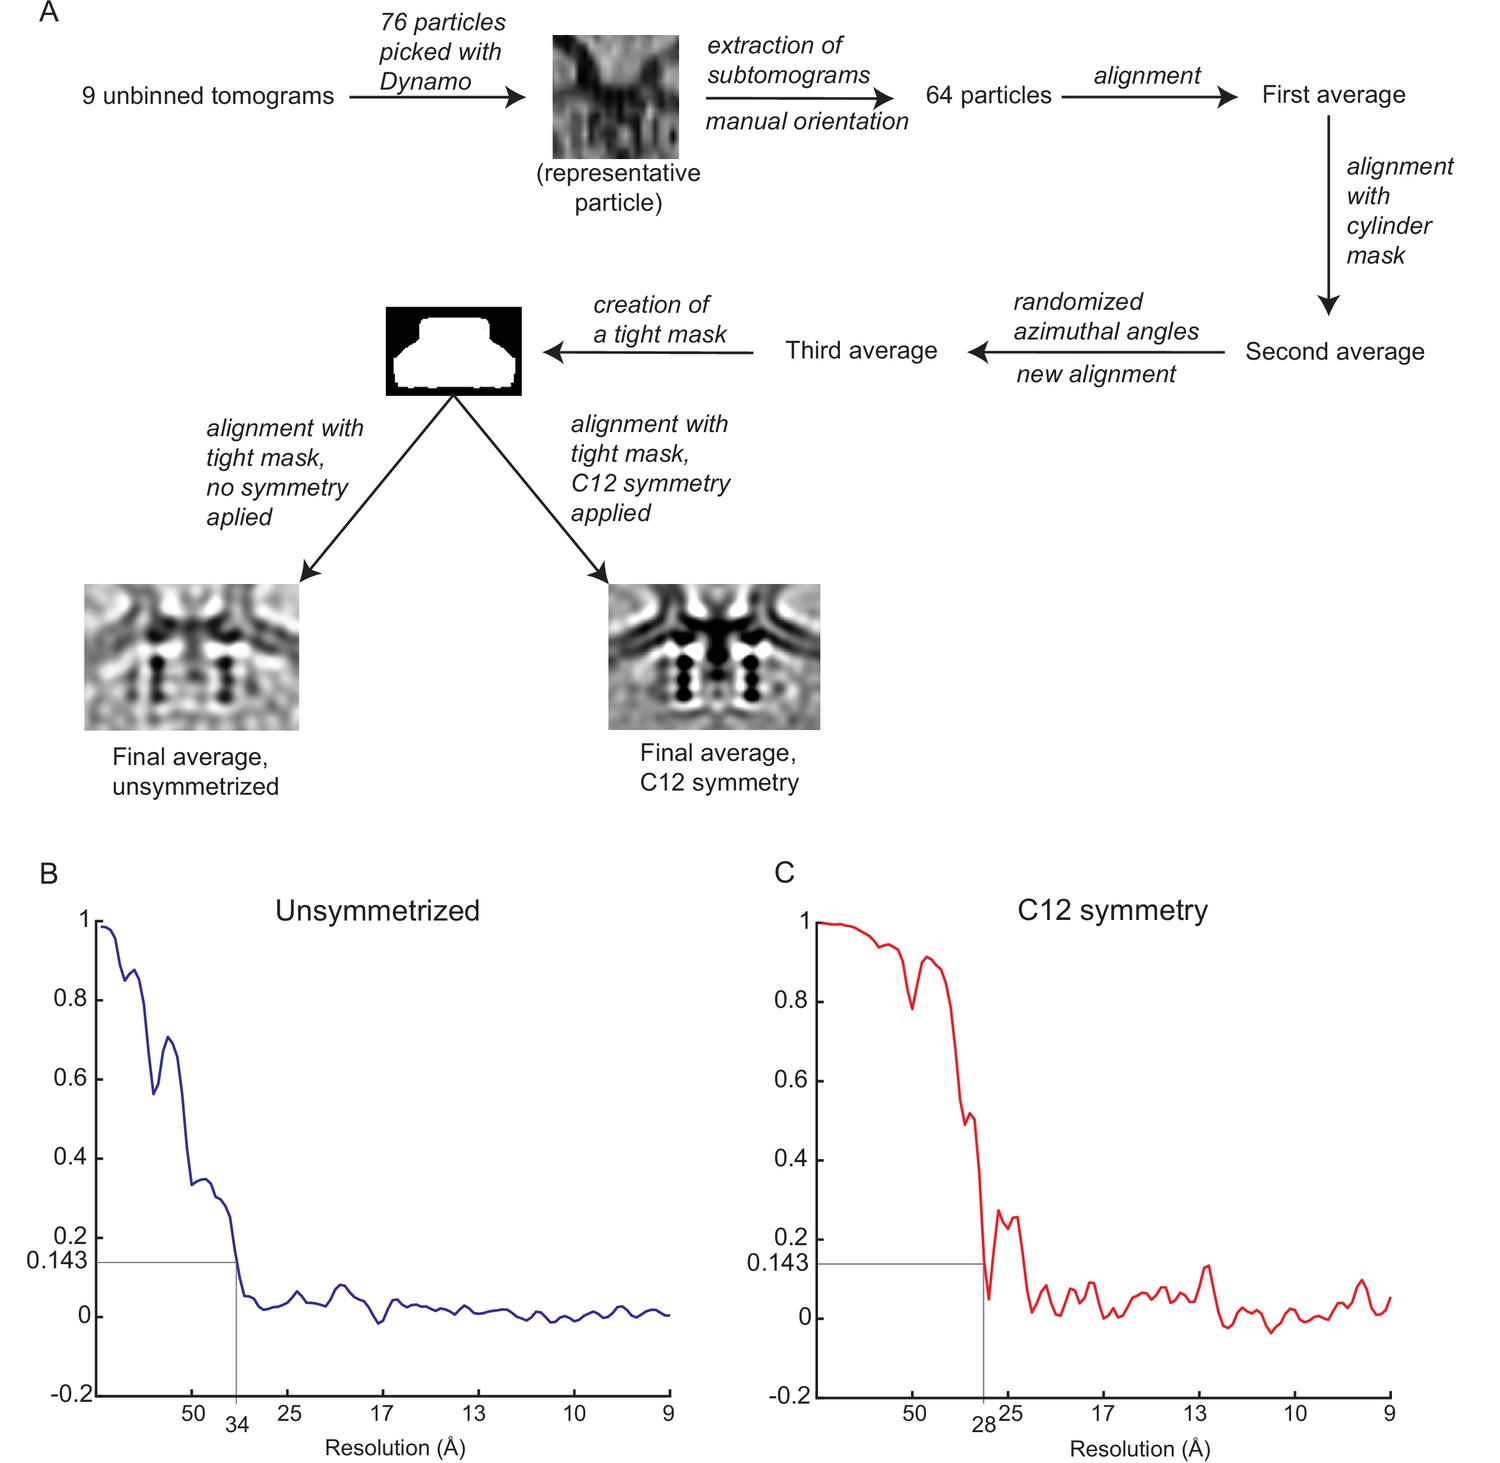
Subtomogram averaging of the neck complex.
(A) Schematic of the subtomogram averaging process. (B) Gold-standard Fourier shell correlation of the unsymmetrized neck complex. (C) Gold-standard Fourier shell correlation of the symmetrized neck complex.
Figure 3 with 2 supplements
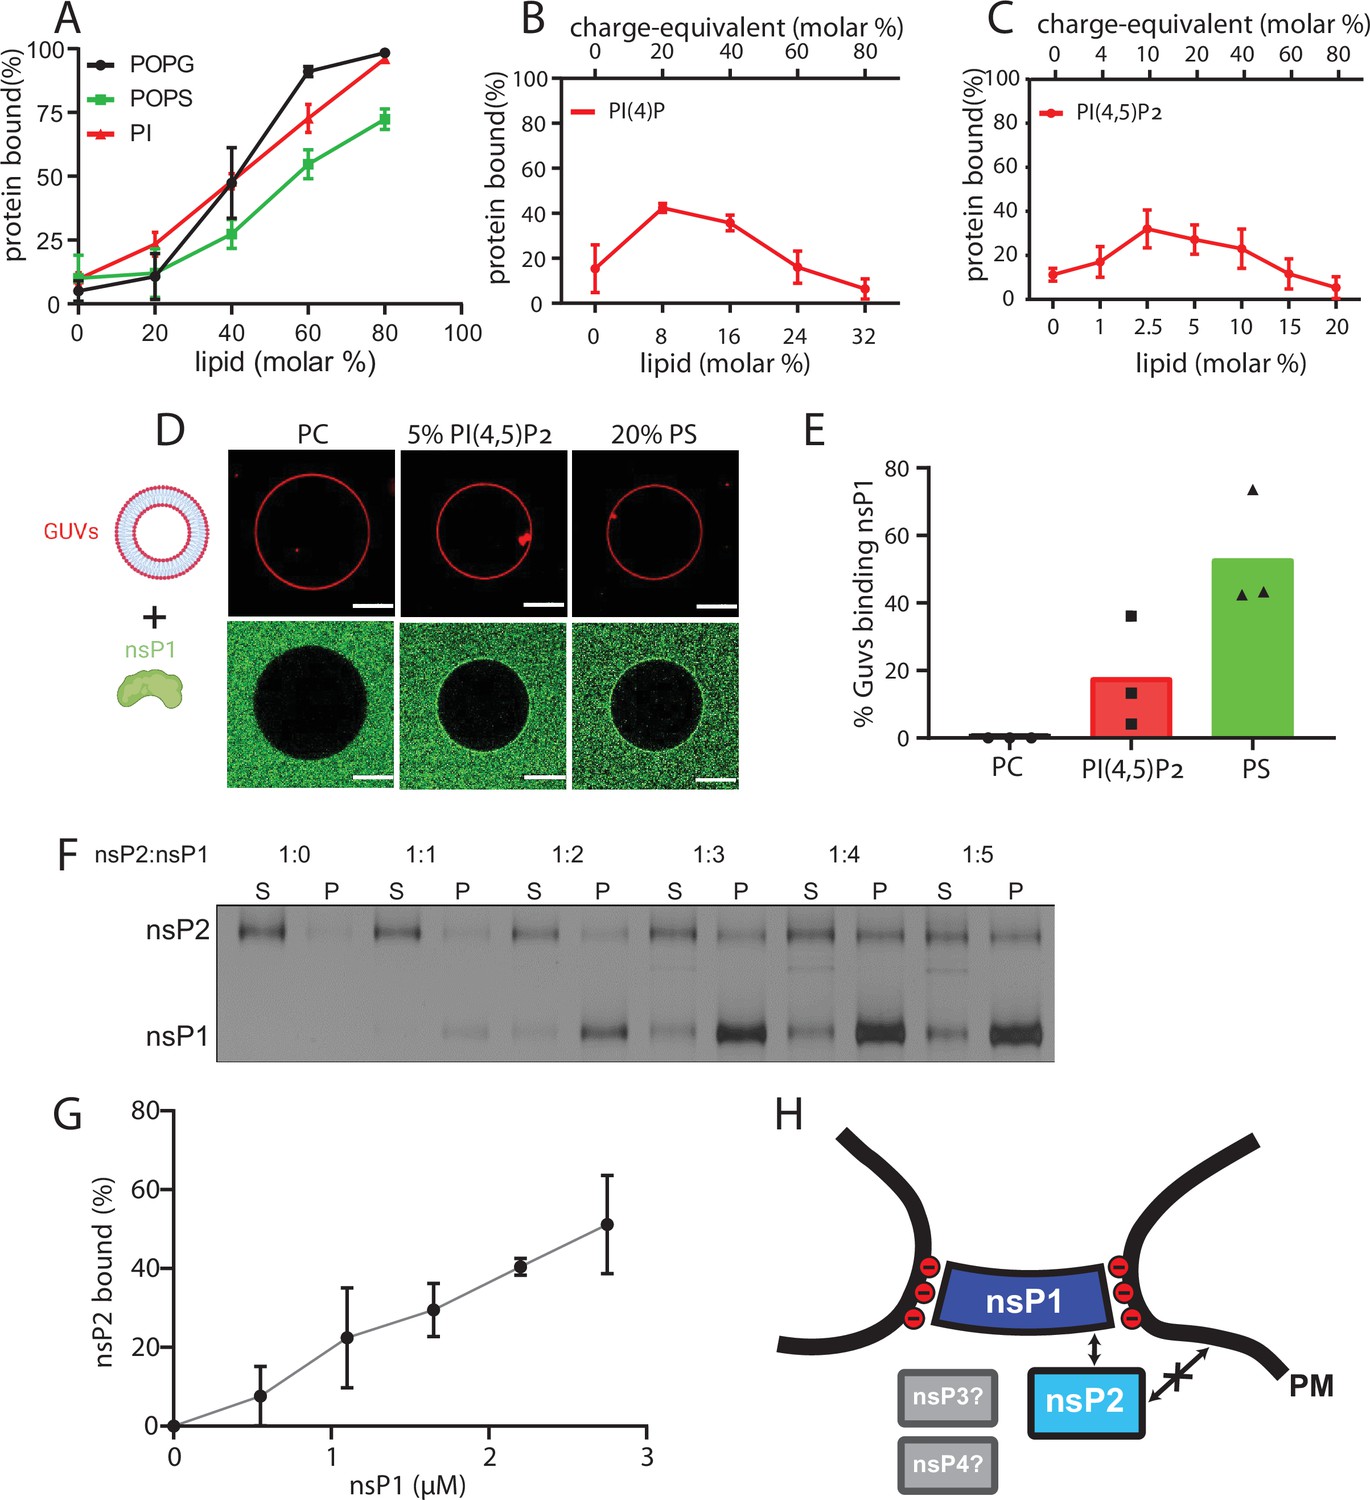
NsP1 binds to membranes containing monovalent anionic lipids and recruits nsP2 in a concentration-dependent manner.
(A–C) Copelletation of nsP1 with multilamellar vesicles (MLVs) with varying percentages of the anionic phospholipids 1-palmitoyl-2-oleoyl-sn-glycero-3-phospho-l-serine (POPS), 1-palmitoyl-2-oleoyl-sn-glycero-3-phospho-(1′-rac-glycerol) (POPG), phosphatidylinositol (PI) (A), PI(4)P (B), and PI(4,5)P2 (C) in a background of 1-palmitoyl-2-oleoyl-sn-glycero-3-phosphocholine (POPC) and 20% cholesterol. Representative example gels shown in Figure 3—figure supplement 2. The percentage of protein associated with membranes was quantitated from gels and plotted. Each plot represents the mean ± SD of three independent replicates. (D) Confocal imaging of nsP1- ATTO488 (green) binding to giant unilamellar vesicles (GUVs) (red) with POPC, or POPC including 5 mol% PI(4,5)P2, or 20% POPS. Scale bar, 20 µm. (E) Quantification of nsP1-bound GUVs from three experiment series. Data represent the percentage of nsP1-binding GUVs calculated from total number of GUVs observed for each experiment series plotted against the respective GUVs types. (F) Co-pelletation assay of nsP2 and nsP1 with POPS-containing MLVs. NsP2 and MLV concentrations were kept constant, while the nsP1 concentration was varied. Analysis of supernatant (S) and pellet (P) fractions by SDS-PAGE. (G) Quantification of pelleted nsP2 with nsP1. The experiment shown in (F) was repeated two times. The pellet intensity at each nsP1 concentration was normalized to the total nsP2 intensity and plotted (mean ± SD) against the nsP1 concentration. (H) Schematic of the findings from A to G, in the context of the neck complex. The non-structural proteins nsP3 and nsP4 were not included in these experiments but are displayed for completion as possible components of the neck complex.
-
Figure 3—source data 1
Contains the uncropped version of the gel image shown in Figure 3F.
- https://cdn.elifesciences.org/articles/83042/elife-83042-fig3-data1-v2.zip
Figure 3—figure supplement 1
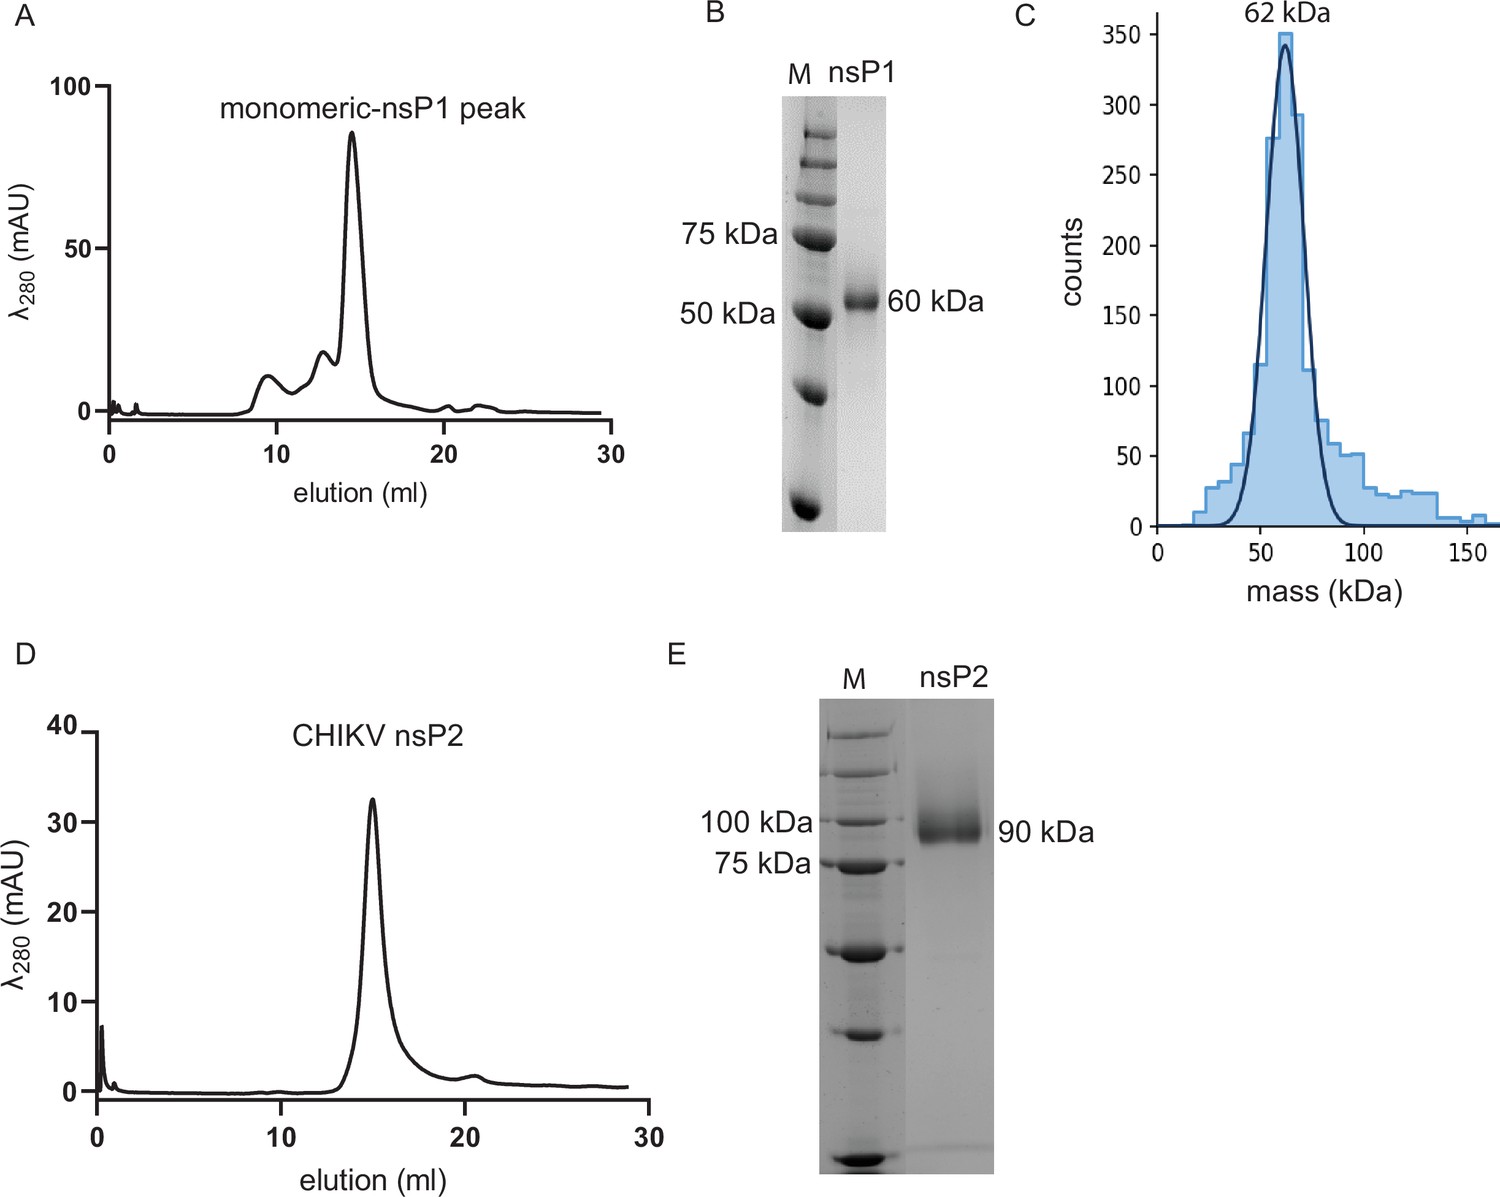
The purified chikungunya virus (CHIKV) nsPs are homogeneous and monomeric.
(A) Size-exclusion chromatography (SEC) purification profile of CHIKV nsP1. The elution fraction at 14 ml represents the homogeneous and monodisperse fraction of CHIKV nsP1, which was confirmed by Coomassie-stained 10% SDS-PAGE (B) and mass photometry (C). Mass photometry shows that the protein has a molecular mass of 62 kDa, which is within the error range (±5%) from the expected mass of CHIKV nsP1 (60 kDa). (D) SEC purification profile of CHIKV nsP2. The narrow elution peak represents the homogeneous and monodisperse fraction of CHIKV nsP2, which was confirmed by Coomassie-stained 10% SDS-PAGE (E).
-
Figure 3—figure supplement 1—source data 1
Contains the uncropped version of the gel images shown in Figure 3—figure supplement 1.
- https://cdn.elifesciences.org/articles/83042/elife-83042-fig3-figsupp1-data1-v2.zip
Figure 3—figure supplement 2
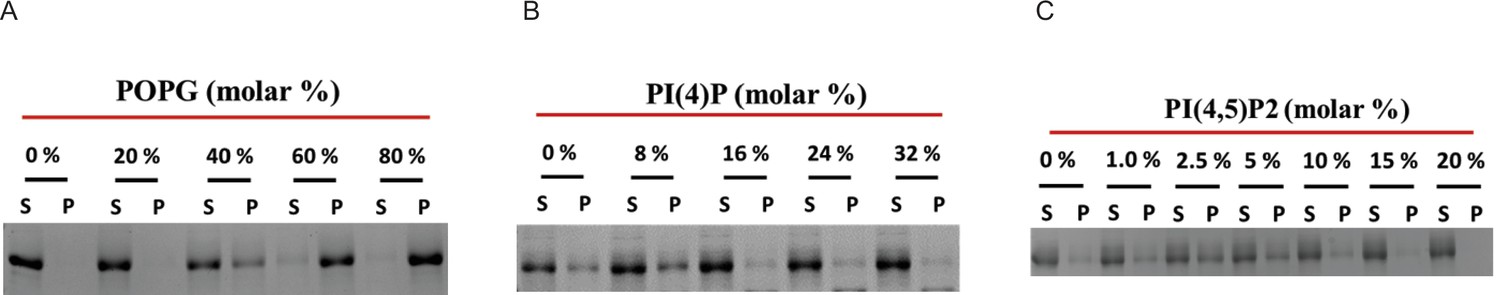
Representative gels related to Figure 3.
(A–C). Copelletation of nsP1 with multilamellar vesicles with varying percentages of the anionic phospholipids 1-palmitoyl-2-oleoyl-sn-glycero-3-phospho-(1′-rac-glycerol) (POPG) (A), PI(4)P (B), and PI(4,5)P2 (C) in a background of 1-palmitoyl-2-oleoyl-sn-glycero-3-phosphocholine (POPC) and 20% cholesterol. The supernatant and pellet were run on 10% SDS-PAGE. After destaining the Coomassie stained gel, image was acquired with a Chemidoc Imaging System (Bio-Rad), and the relative intensity of bands were quantified using ImageLab software (Bio-Rad) and plotted as shown in Figure 3A-C.
-
Figure 3—figure supplement 2—source data 1
Contains the uncropped version of the gel images shown in Figure 3—figure supplement 2.
- https://cdn.elifesciences.org/articles/83042/elife-83042-fig3-figsupp2-data1-v2.zip
Figure 4 with 3 supplements

A single copy of the genomic RNA determines the shape of the spherule membrane.
(A) Segmentation of the dsRNA traced within a spherule. Yellow: membrane, red: RNA, and blue: neck complex base. (B) The RNA length L increases with spherule volume V. A common fit of both datasets with Equation 2 gives and , while was determined experimentally. The inset shows the spherical cap model schematically. (C) Estimation of the dsRNA length (in base pairs) and the average copy number per spherule. One point represents a single spherule, and the datasets represents tomograms acquired on different cells. (D) The top row shows five shapes that minimize the energy (Equation 1) for a given spherule volume. Below, the predicted shapes are compared to different sizes of nascent and full-size spherules observed in cryo-electron tomograms of Semliki forest virus (SFV) viral replicon particle (VRP)-transduced cells. Scale bar, 50 nm. (E) Pressure-volume relation for a unitless membrane tension of a = 10–2. The corresponding membrane shapes are shown in subfigure D. (F) Energy (Equation 1) as a function of the spherule volume for = 10–2, κ=10 kBT and . (G) The energy change per change in volume is shown, which leads to a maximal energy to be supplied per base pair of 0.2 kcal/mol, where we assumed the volume of a single base pair to be not larger than .
Figure 4—figure supplement 1
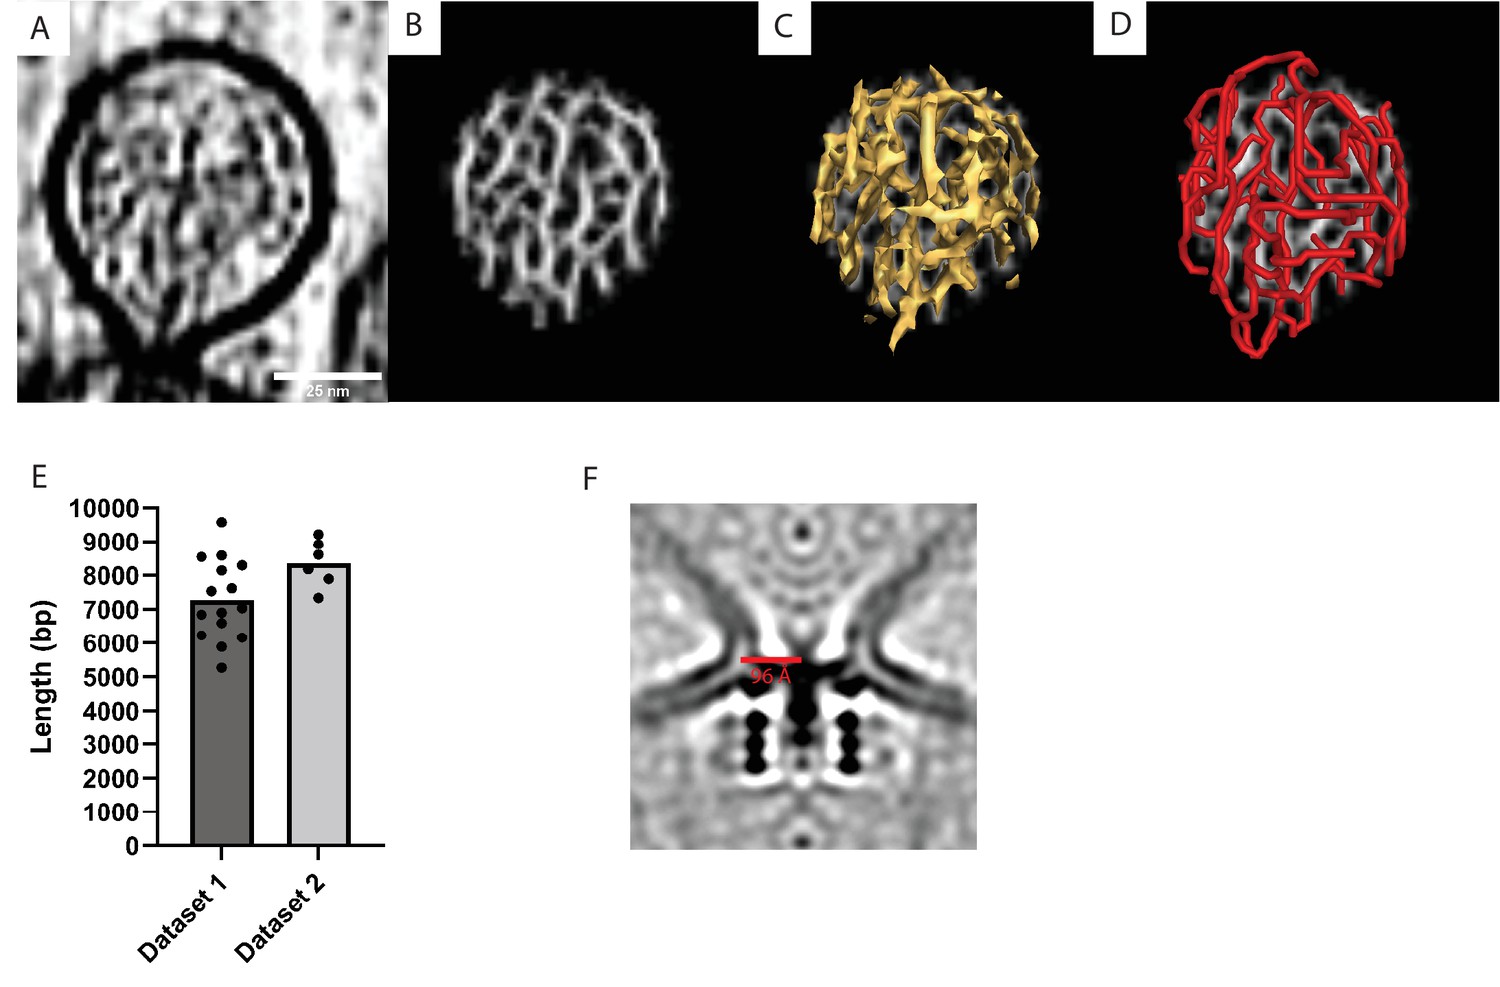
Tracing of RNA in the spherule lumen and membrane neck diameter.
(A) Slice through a tomogram highlighting the viral RNA in the spherule lumen. Scale bar, 25 nm. (B) The output of the cylinder correlation operation on the volume shown in (A), as performed in Amira’s filament tracing module (Rigort et al., 2012). (C) Isosurface view of (B). (D) Filament model generated by correlation line tracing of the volume shown in (B). (E) Length of the traced RNA in Ångström. One dot corresponds to an individual spherule, and the bars represent the average value in each dataset (being tomograms acquired on different cells). (F) The radius of the neck of a spherule is 96 Å.
Figure 4—figure supplement 2
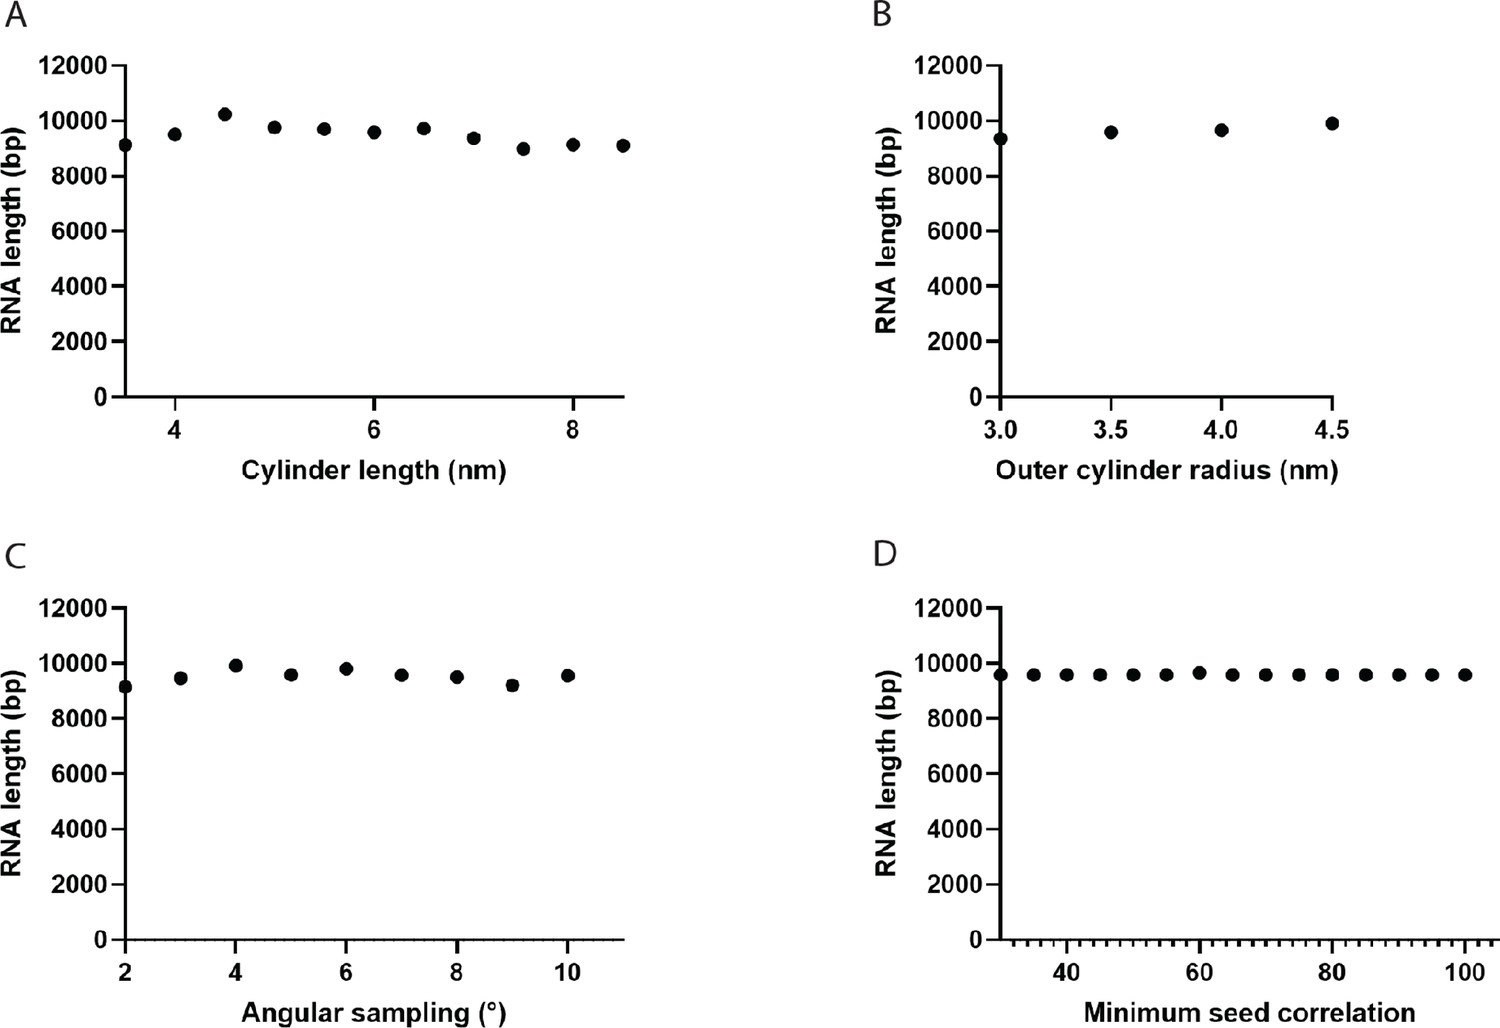
Dependence of the total filament length on filament tracing parameters.
(A) Length of the cylinder templates used for cross-correlation calculation. A value of 6 nm was used in this study. (B) Radius of the outer cylinder mask. A value of 3.5 nm was used. (C) Maximum allowed angle between adjacent cylinder fragments during the tracing. A value of 5° was used. (D) Cutoff value for the seed correlation between points following the RNA in cryo-tomograms. A value of 65 was used.
Figure 4—figure supplement 3
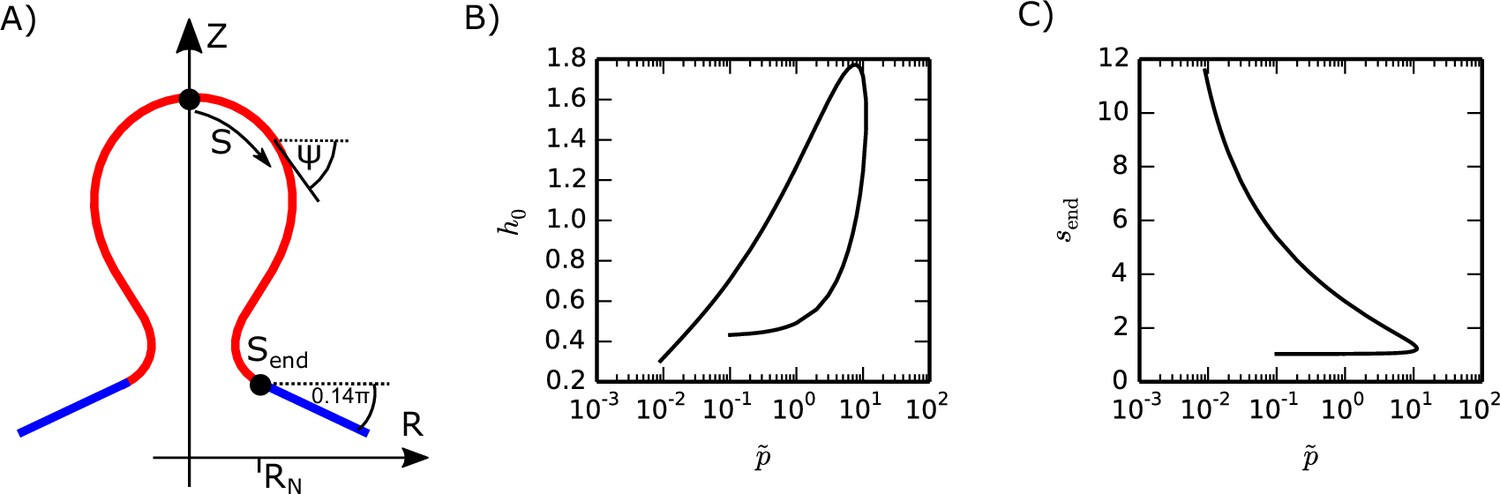
Spherule shape parameterization.
(A) The spherule shape is parameterized by the arc length and the azimuthal angle , where we consider a cylindrically symmetric shape. (B and C) Values for and that solve the shape equations, Equation (T17) with the boundary conditions, Equation (T19) for .
Figure 5
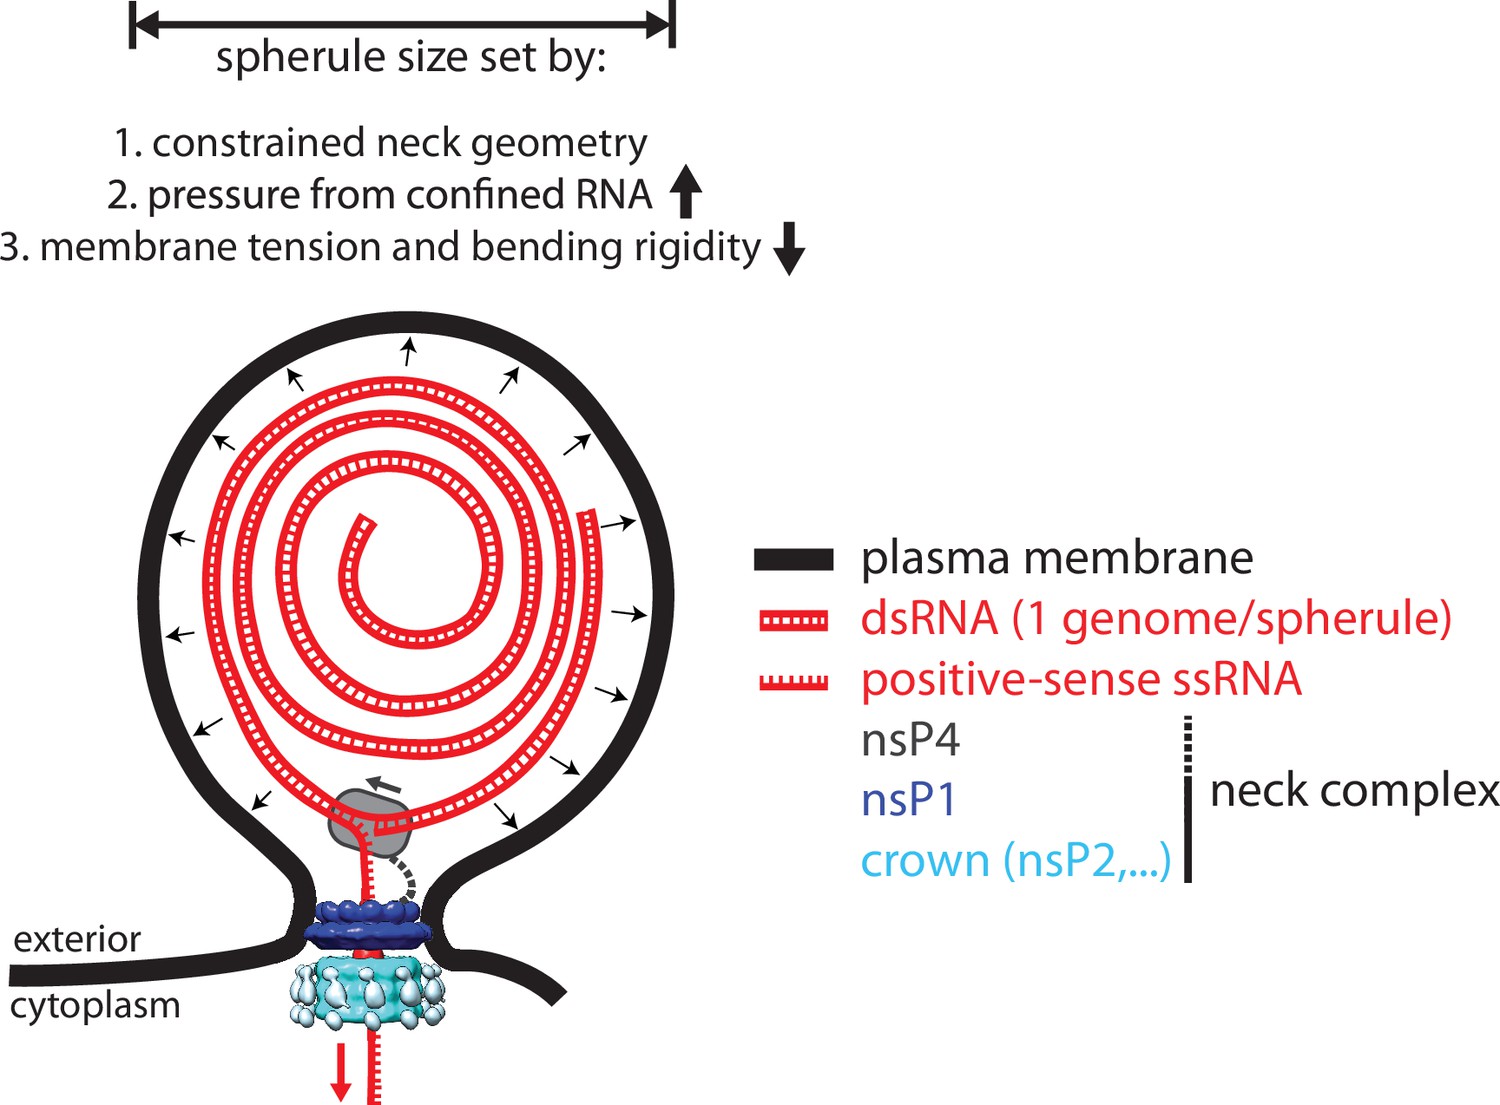
A model for the interplay between membrane, RNA, and proteins in the chikungunya virus (CHIKV) spherule.
Each spherule contains a single viral genome, to >80% present in dsRNA form. The membrane shape is determined by the confined neck geometry, the pressure exerted by the confined genome, and the tension and stiffness of the membrane. NsP1 determines the neck geometry and serves an base plate for assembly of an additional 1.2 MDa complex. Biochemical evidence indicates that nsP2 is part of the neck complex, and an association of the viral polymerase nsP4 with the neck complex, although not directly addressed in this article, would be consistent with the suggested strand-displacement replication mode that produces several positive-sense strands from each spherule.
Tables
Key resources table
| Reagent type (species) or resource | Designation | Source or reference | Identifiers | Additional information |
|---|---|---|---|---|
| Strain and strain background (chikungunya virus [CHIKV]) | CHIKV viral replicon particles (VRPs) | DOI:10.1186/1743–422X-10-235 | The viral genome is split into three RNAs, as described in the DOI, resulting in VRPs that cause a single-cycle infection. | |
| Strain and strain background (Escherichia coli) | BL21(DE3) | In-house stock | Used for protein expression. | |
| Strain and strain background (E. coli) | XL10 | In-house stock | Used for cloning. | |
| Cell line: (Mesocricetus auratus) | Baby hamster kidney (BHK)-21 (C-13) | ATCC | Cat: CCL-10 | Fibroblast cell line. |
| Commercial assay and kit | LookOut Mycoplasma PCR detection kit | Sigma-Aldrich | Cat: MP0035 | Outcome was negative throughout this work. |
| Recombinant DNA reagent | CHIKV nsP1 E. coli expression plasmid | This paper | Cloned for CHIKV nsP1 protein expression. Synthetic gene based on GenBank: KT449801.1. Available upon request. | |
| Recombinant DNA reagent | CHIKV nsP2 E. coli expression plasmid | This paper | Cloned for CHIKV nsP2 protein expression. Synthetic gene based on GenBank: KT449801.1. Available upon request. | |
| Chemical compound and drug | Protease Inhibitor cocktail | In-house preparation | Benzamidine: Sigma-Aldrich Cat: B6506-25G PMSF: VWR Cat: 0754–5 G Leupeptin: Alfa Aesar Cat: 15483809 | |
| Chemical compound and drug | 1-palmitoyl-2-oleoyl-sn-glycero-3-phosphocholine (POPC) | Avanti Polar lipids | Cat: 850457 C | |
| Chemical compound and drug | 1-palmitoyl-2-oleoyl-sn-glycero-3-phospho-l-serine (POPS) | Avanti Polar lipids | Cat: 840034 C | |
| Chemical compound and drug | 1-palmitoyl-2-oleoyl-sn-glycero-3-phospho-(1′-rac-glycerol) (POPG) | Avanti Polar lipids | Cat: 840457 C | |
| Chemical compound and drug | Phosphatidylinositol (PI) | Avanti Polar lipids | Cat: 840042 C | |
| Chemical compound and drug | PI(4)P | Avanti Polar lipids | Cat: 840045 P | |
| Chemical compound and drug | PI(4,5)P2 | Avanti Polar lipids | Cat: 840046 P | |
| Chemical compound and drug | Cholesterol | Avanti Polar lipids | Cat: 700100 P | |
| Chemical compound and drug | ATTO-647N-DOPE | Sigma-Aldrich | Cat: 42247–1 MG | Manufactured by ATTO-TEC. |
| Chemical compound and drug | ATTO- 488 NHS | Invitrogen | Cat: 41698–1 MG-F | Manufactured by ATTO-TEC. |
| Software and algorithm | ImageLab | Bio-Rad | Used for gel quatification. | |
| Software and algorithm | Prism | Graph-Pad | Used for generation of plots. | |
| Software and algorithm | ImageJ | NIH | Confocal images were processed using ImageJ. | |
| Software and algorithm | DiscoverMP software | Refeyn Ltd | For mass photometry data processing. | |
| Software and algorithm | SerialEM | DOI:10.1016/j.jsb.2005.07.007 | Data acquisition for cryo-electron tomography. | |
| Software and algorithm | MotionCor2 | DOI:10.1038/nmeth.4193 | Motion correction of cryo-ET data. | |
| Software and algorithm | CTFFIND4 | DOI:10.1016/j.jsb.2015.08.008 | CTF (contrast transfer function) correction of cryo-ET data. | |
| Software and algorithm | IMOD | DOI:10.1006/jsbi.1996.0013 | Reconstruction of cryo-electron tomograms. | |
| Software and algorithm | Amira | Thermo Fisher Scientific | Segmentation of cryo-electron tomograms and filament tracing. | |
| Software and algorithm | Dynamo | DOI:10.1016/j.jsb.2011.12.017 | Subtomogram averaging. | |
| Software and algorithm | MATLAB | Mathworks, Inc. | General image processing and running Dynamo. | |
| Software and algorithm | UCSF chimera | DOI:10.1002/jcc.20084 | Visualization and segmentation of subtomogram averages. |
Table 1
Summary of the cryo-ET data collection parameters.
| Data collection | |
|---|---|
| Microscope | Titan Krios G2 |
| Acceleration voltage (keV) | 300 |
| Camera | Gatan K2 Summit |
| Nominal magnification | 33,000 |
| Energy filter | Yes, BioQuantum |
| Slit width (eV) | 20 |
| Pixel size in super-resolution mode (Å) | 2.18 |
| Defocus range (µm) | –3 to –5 |
| Tilt range (°) | –60 to +60 |
| Tilt increment (°) | 2 |
| Total dose (e−/Å2) | 80–120 |
| Tomograms used for analyses | 9 |
Table 2
Lipid compositions used to prepare multilamellar vesicles (MLVs).
| MLVs with (–1) charged lipids | |||
|---|---|---|---|
| MLVs (equivalent charge %) | 1-Palmitoyl-2-oleoyl-sn-glycero-3-phospho-l-serine/1-palmitoyl-2-oleoyl-sn-glycero-3-phospho-(1′-rac-glycerol)/phosphatidylinositol (PI) (mol %) | Cholesterol (mol %) | 1-Palmitoyl-2-oleoyl-sn-glycero-3-phosphocholine (POPC) (mol %) |
| PS/PG/PI (0 %) | 0 | 20 | 80 |
| PS/PG/PI (20 %) | 20 | 20 | 60 |
| PS/PG/PI (40 %) | 40 | 20 | 40 |
| PS/PG/PI (60 %) | 60 | 20 | 20 |
| PS/PG/PI (80 %) | 80 | 20 | 0 |
| MLVs with (–2.5) charged lipid | |||
| MLVs (equivalent charge %) | PI(4)P (mol %) | Cholesterol (mol %) | POPC (mol %) |
| PI(4)P (0 %) | 0 | 20 | 80 |
| PI(4)P (20 %) | 8 | 20 | 72 |
| PI(4)P (40 %) | 16 | 20 | 64 |
| PI(4)P (60 %) | 24 | 20 | 56 |
| PI(4)P (80 %) | 32 | 20 | 48 |
| MLVs with (–4) charged lipid | |||
| MLVs (equivalent charge %) | PI(4,5)P2 (mol %) | Cholesterol (mol %) | POPC (mol %) |
| PI(4,5)P2 (0 %) | 0 | 20 | 80 |
| PI(4,5)P2 (20 %) | 5 | 20 | 75 |
| PI(4,5)P2 (40 %) | 10 | 20 | 70 |
| PI(4,5)P2 (60 %) | 15 | 20 | 65 |
| PI(4,5)P2 (80 %) | 20 | 20 | 60 |
Additional files
Download links
A two-part list of links to download the article, or parts of the article, in various formats.
Downloads (link to download the article as PDF)
Open citations (links to open the citations from this article in various online reference manager services)
Cite this article (links to download the citations from this article in formats compatible with various reference manager tools)
Architecture of the chikungunya virus replication organelle
eLife 11:e83042.
https://doi.org/10.7554/eLife.83042


