Multiple polarity kinases inhibit phase separation of F-BAR protein Cdc15 and antagonize cytokinetic ring assembly in fission yeast
- Department of Cell and Developmental Biology, Vanderbilt University School of Medicine, United States
- Department of Physics, Lehigh University, United States
- Center for Computational Biology, Flatiron Institute, United States
Figures
Figure 1
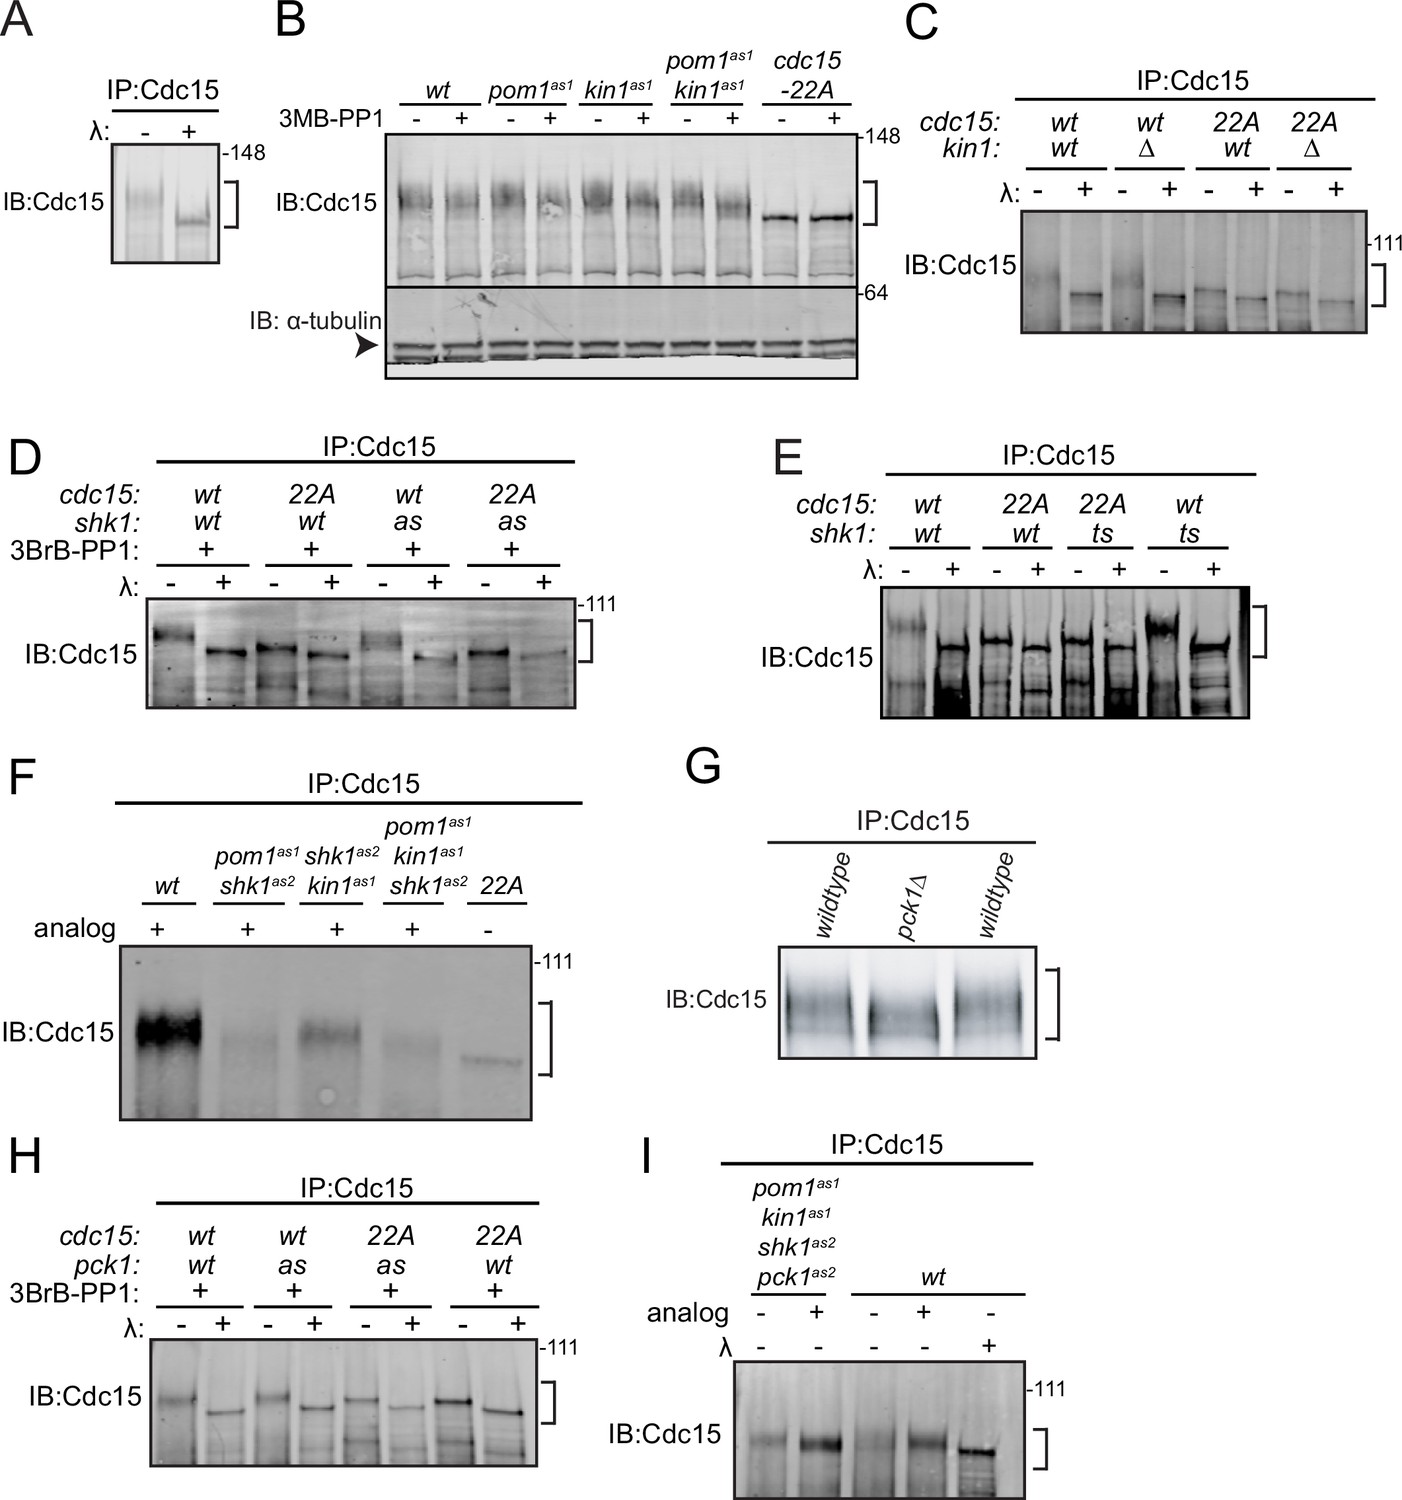
Cdc15 phosphorylation is regulated by polarity kinases Kin1, Shk1, and Pck1.
Denatured protein lysates were prepared from the indicated strains. Anti-Cdc15 was used to immunoprecipitate (IP) Cdc15, which was then treated with λ protein phosphatase (λ) or buffer control. IP samples were separated by SDS-PAGE and immunoblotted for Cdc15 (A, C, D, E, F, G, H and I). (B) Denatured protein lysates from the indicated strains were separated by SDS-PAGE and then immunoblotted for Cdc15 and α-tubulin. In (B), α-tubulin is indicated with an arrowhead. The positions of Cdc15 isoforms are indicated with brackets. The indicated molecular mass markers are in kDa.
-
Figure 1—source data 1
Raw Western blot images with labeled band of interest.
- https://cdn.elifesciences.org/articles/83062/elife-83062-fig1-data1-v1.zip
Figure 2 with 1 supplement
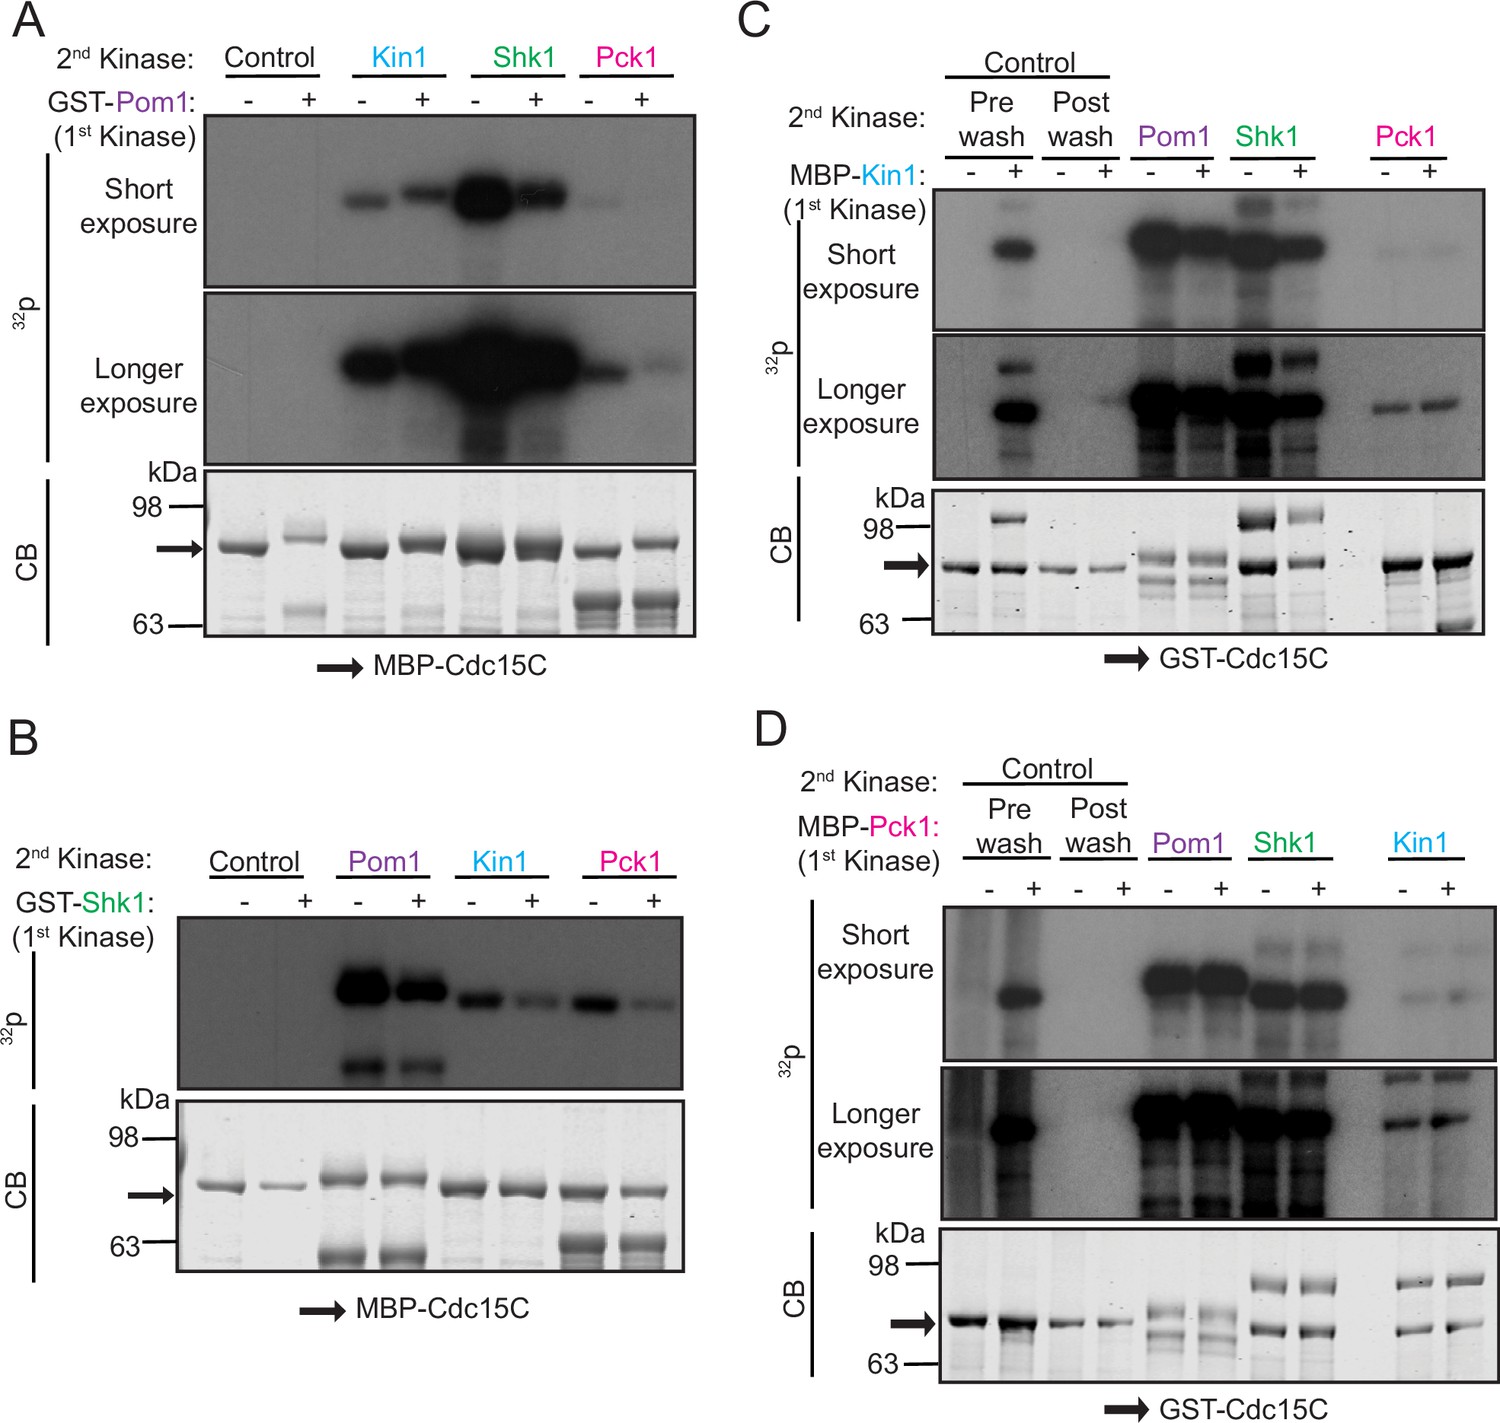
Polarity kinases phosphorylate overlapping sites on Cdc15.
(A–D) In vitro kinase assays were performed using recombinant GST-Pom1 (A), GST-Shk1 (B), MBP-Kin1 (C), or MBP-Pck1 (D) with the indicated substrate (MBP-Cdc15C or GST-Cdc15C). After removing the first kinase, a second in vitro kinase assay was done with one of the other three kinases in the presence of radiolabeled γ-32P-ATP. Kinase reactions were analyzed by SDS-PAGE, stained with CB (bottom) and 32P incorporation was detected by autoradiography (top and middle). The indicated molecular mass markers are in kDa. Arrows indicate MBP-Cdc15C or GST-Cdc15C.
-
Figure 2—source data 1
Raw Coomassie stained gel images and full autoradiography images with the labeled band of interest.
- https://cdn.elifesciences.org/articles/83062/elife-83062-fig2-data1-v1.zip
Figure 2—figure supplement 1
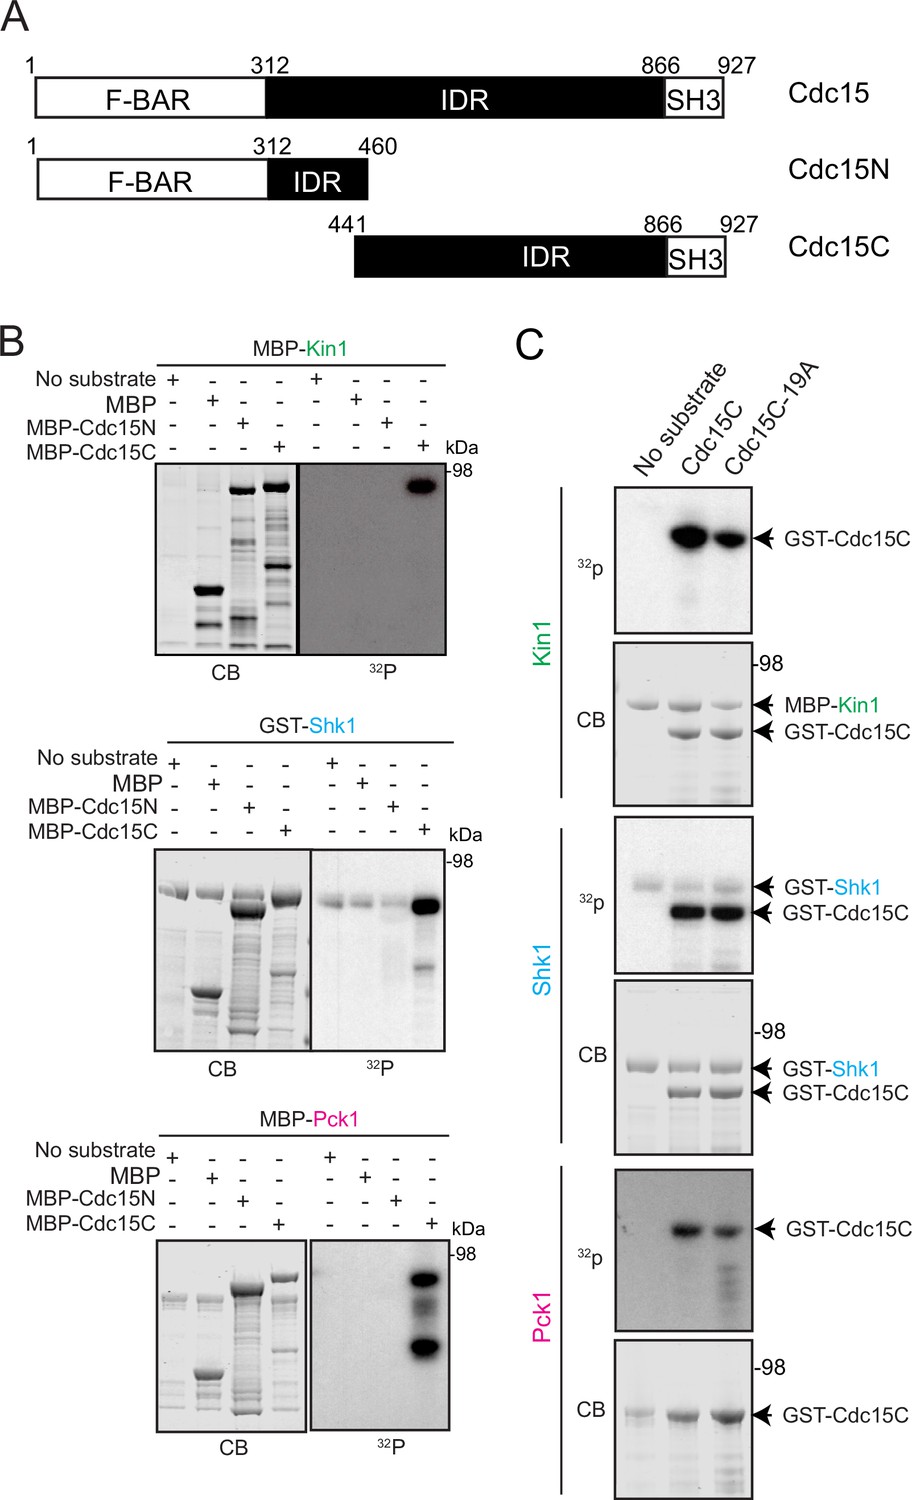
In vitro kinase assays show Cdc15C is directly phosphorylated on its C-terminus by Kin1, Shk1 or Pck1.
(A) Schematic of Cdc15 and the Cdc15 fragments used in in vitro kinase reactions. (B) Kin1, Shk1, and Pck1 were added into in vitro kinase assays with either MBP, MBP-tagged Cdc15C, or MBP-Cdc15N. Kinase reactions were analyzed by SDS-PAGE, stained with Coomassie Blue (CB) and 32P incorporation was detected by autoradiography. (C) Kinase reactions with the indicated protein kinases and GST-tagged Cdc15C or GST-tagged Cdc15C in which the 19 Pom1 phosphorylation sites were substituted with alanine (Ala). Kinase reactions were analyzed by SDS-PAGE, stained with CB, and 32P incorporation was detected by autoradiography. The indicated molecular mass markers are in kDa.
-
Figure 2—figure supplement 1—source data 1
Raw Coomassie stained gel images and full autoradiography images with the labeled band of interest.
- https://cdn.elifesciences.org/articles/83062/elife-83062-fig2-figsupp1-data1-v1.zip
Figure 3 with 3 supplements

Identification of Cdc15 phosphosites for Kin1, Shk1, and Pck1.
(A) Schematic of Cdc15 phosphorylation mutants. Numbers in red type indicate phosphorylation sites common to two or more kinases. (B–D) In vitro kinase assays using recombinant GST-Kin1 (B), GST-Shk1 (C), or MBP-Pck1 (D), and wildtype or mutant GST-Cdc15C proteins as substrates. All kinase assays were done in the presence of radiolabeled γ-32P-ATP and the reactions were separated by SDS-PAGE, stained with CB (bottom) and 32P incorporation was detected by autoradiography (top). (E) Immunoprecipitation (IP) of Cdc15 of the indicated strain, which was then treated with λ- phosphatase (λ) or buffer control. (F) Cell lysates prepared from the indicated genotypes and arrests were subjected to IP for Cdc15. For (E, F), samples were separated by SDS-PAGE and immunoblotted for Cdc15. The indicated molecular mass markers are in kDa.
-
Figure 3—source data 1
Raw Western blot images, Coomassie stained gel images and full autoradiography images with the labeled band of interest.
- https://cdn.elifesciences.org/articles/83062/elife-83062-fig3-data1-v1.zip
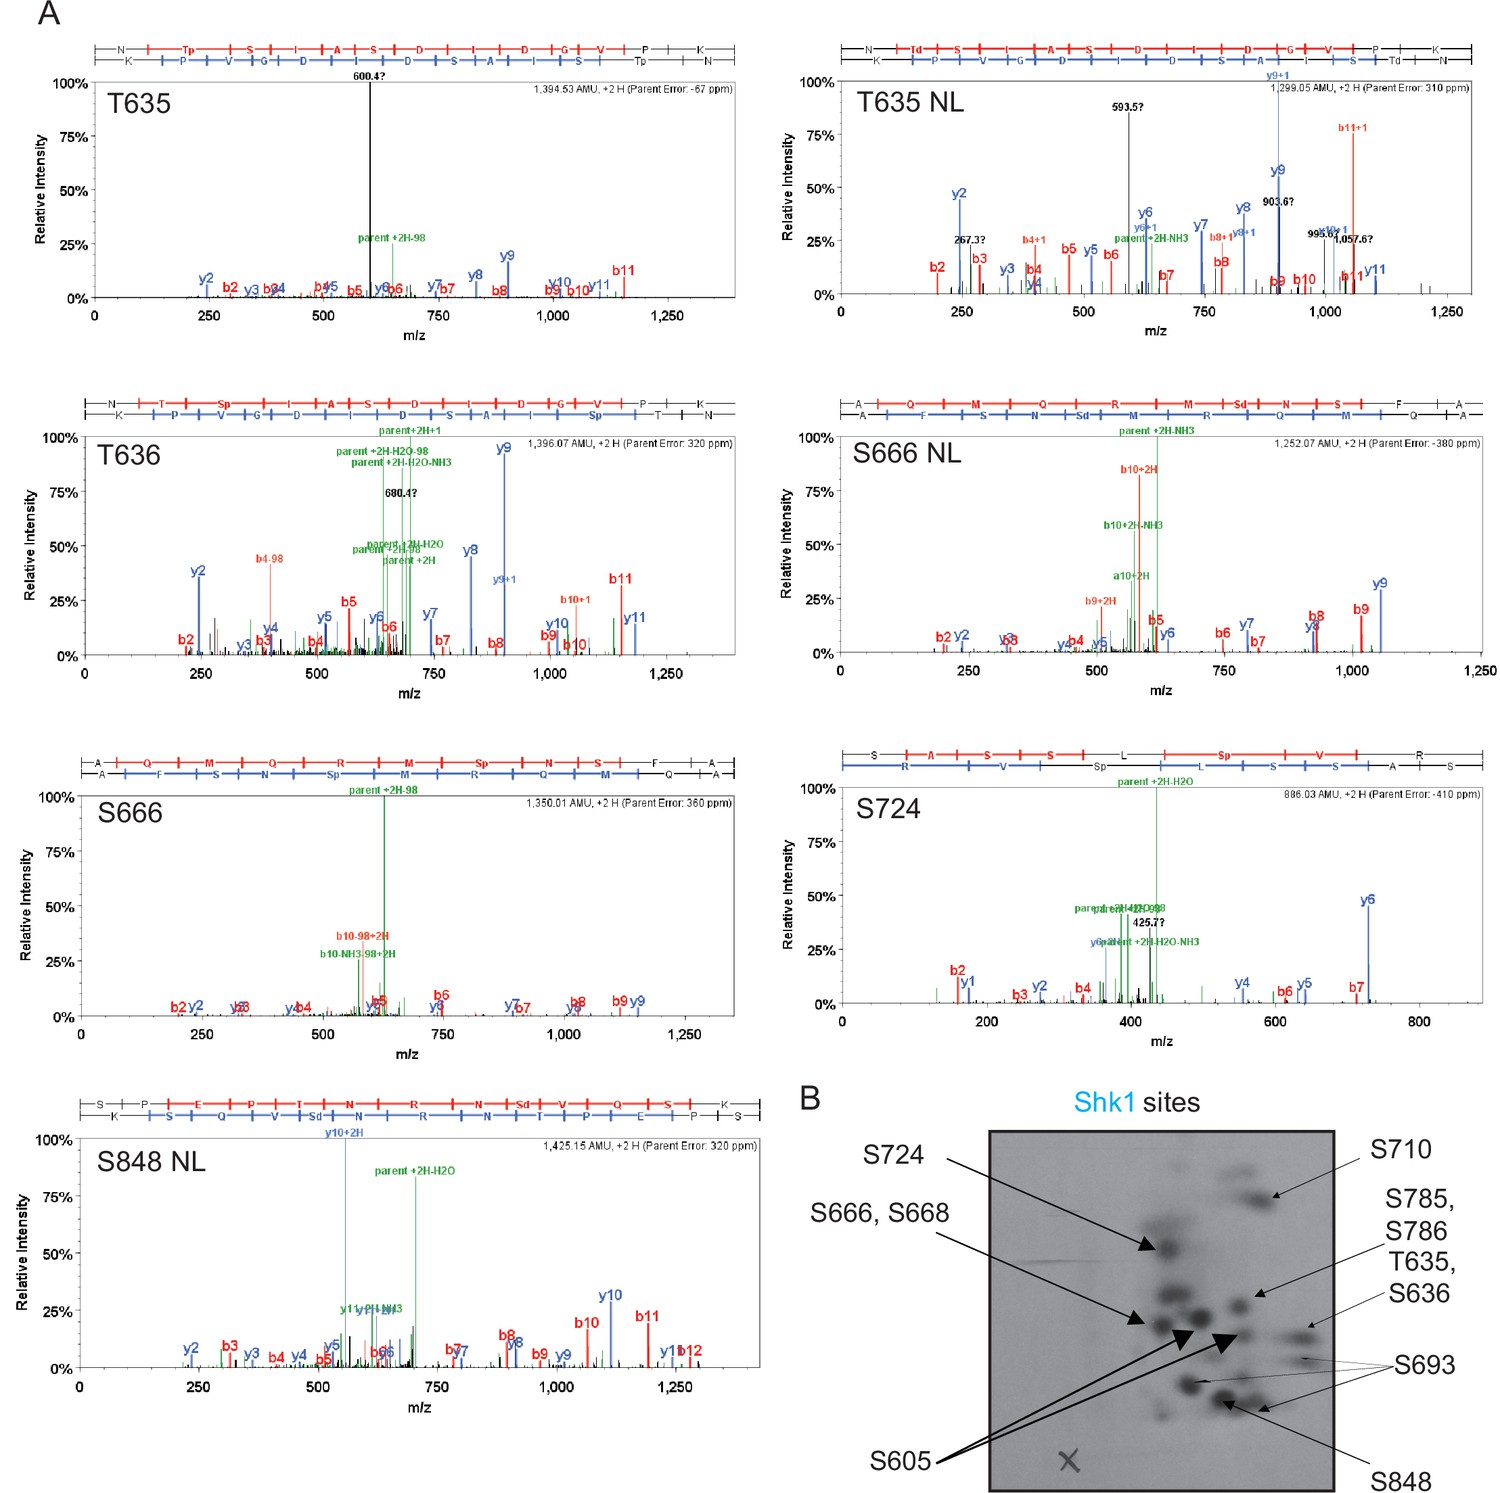
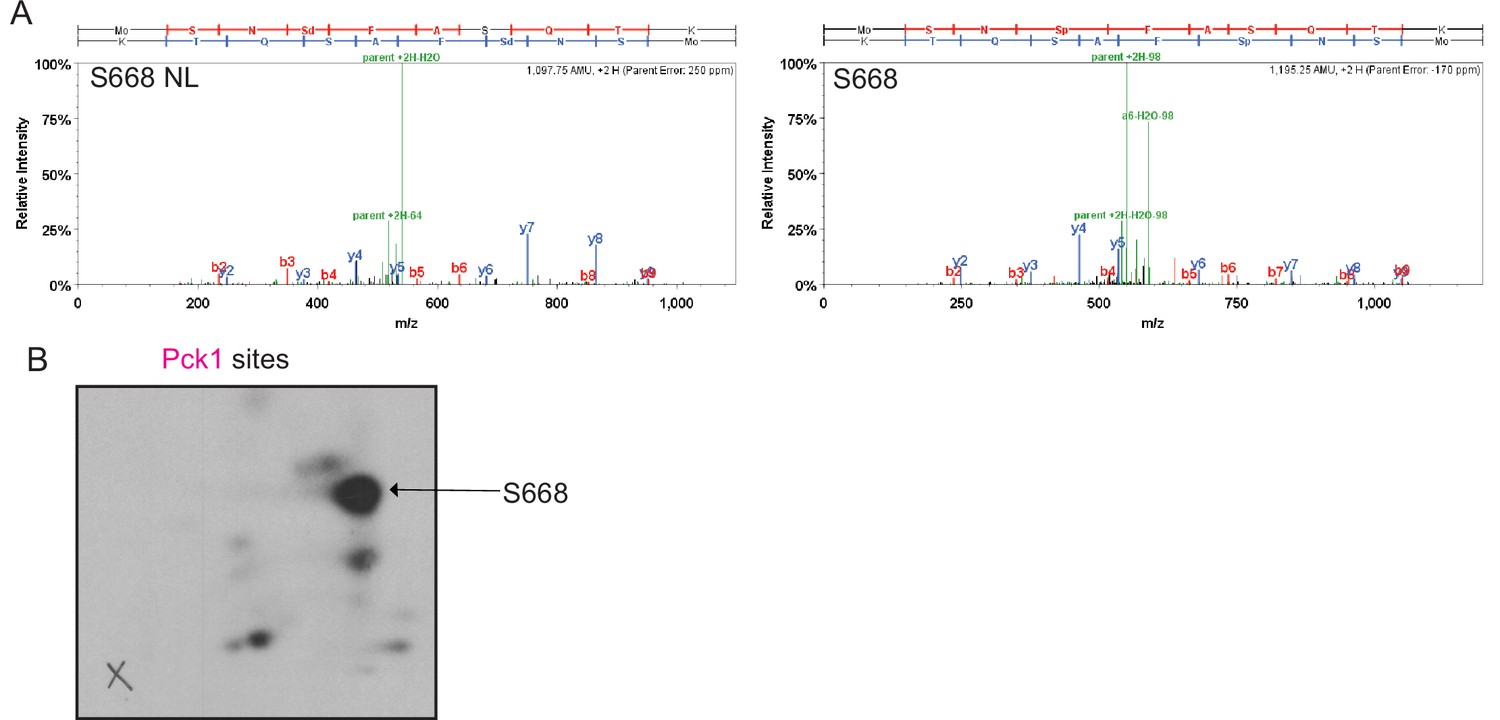
Figure 3—figure supplement 1
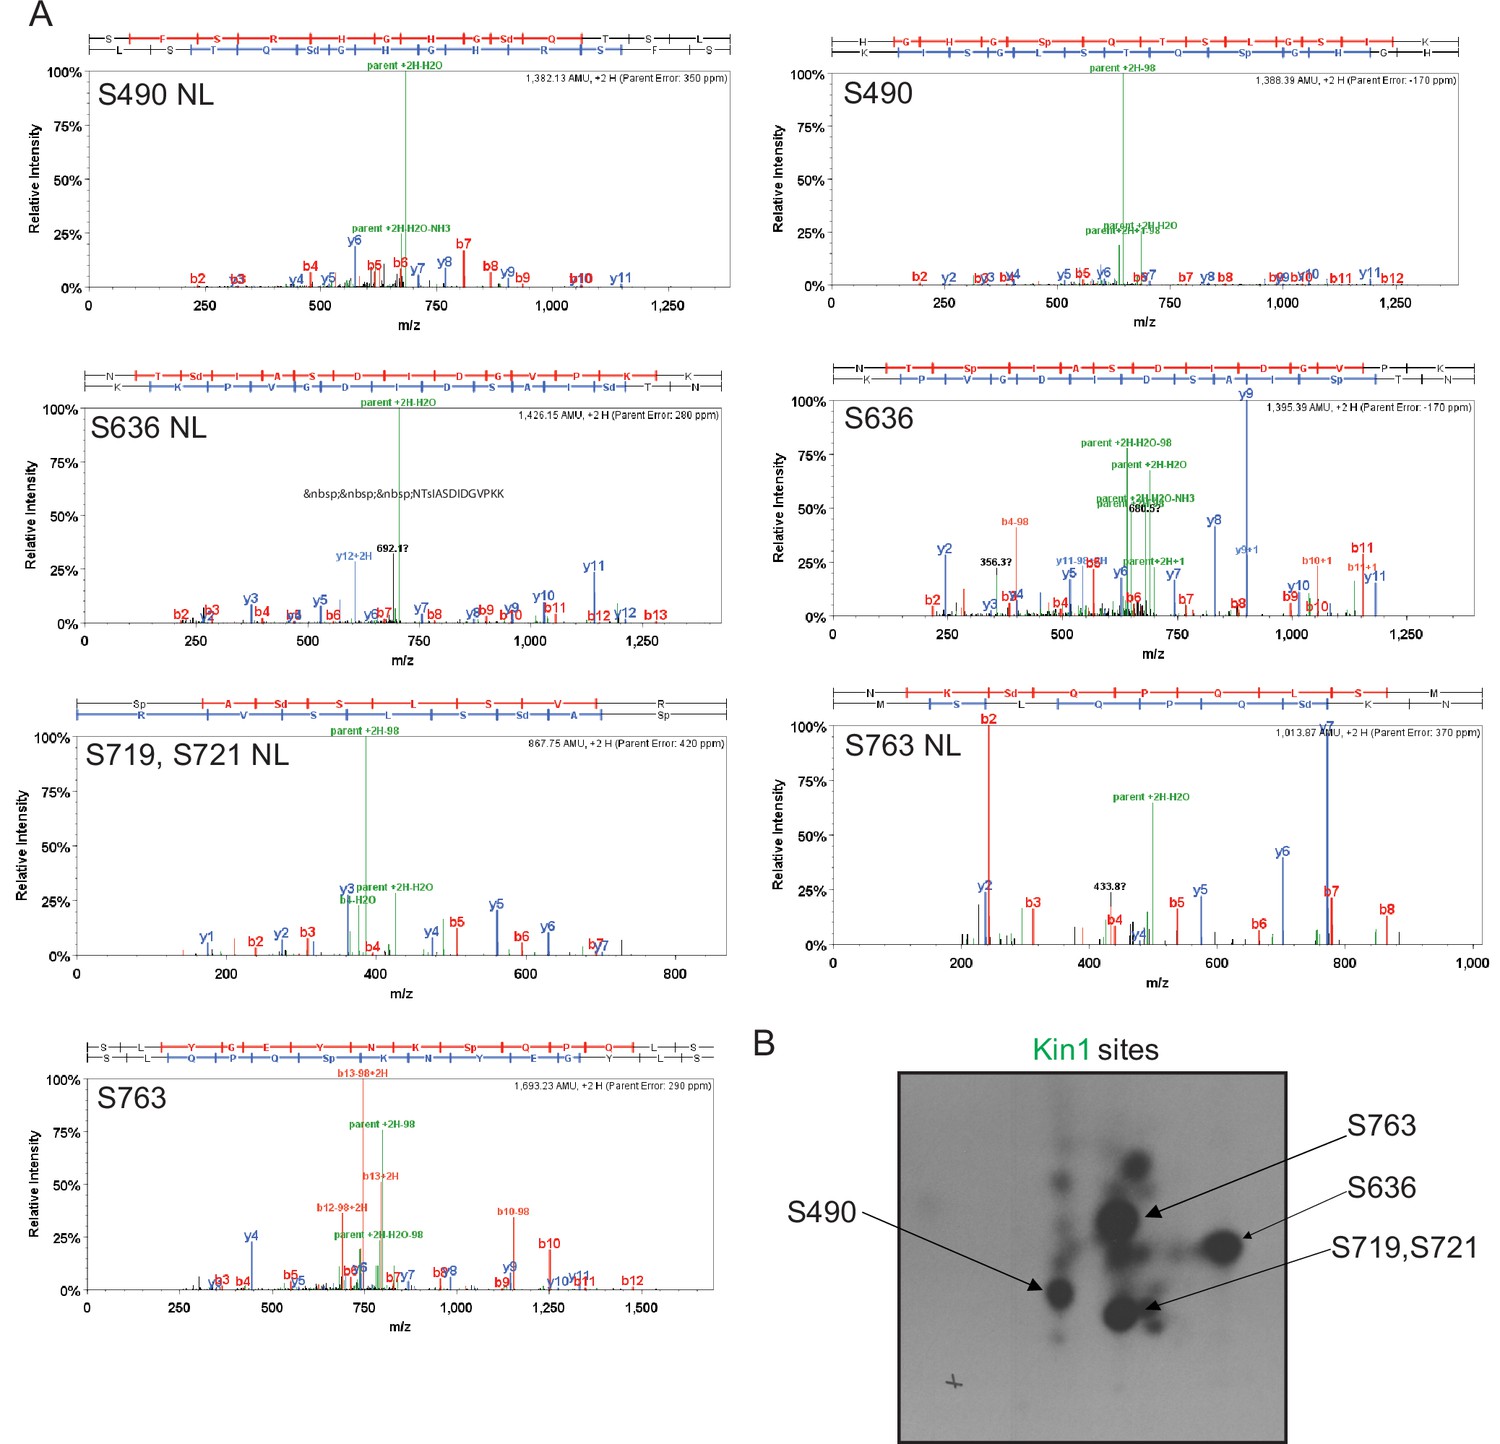
Mapping of phosphorylation sites of Kin1, Shk1, and Pck1 on Cdc15.
(A) Representative mass spectra of phosphopeptides from Cdc15 in vitro phosphorylated by Kin1 (Figure 1), Shk1 (Figure 2), or Pck1 (Figure 3) are shown. Images were extracted from Scaffold PTM; matched b and y ions are highlighted in red and blue, respectively. Ions resulting from neutral losses are highlighted in green. When available, both MS2 and MS3 (spectrum resulting from further fragmentation of the neutral loss [NL] of the phosphate from the parent ion during MS2 scan) spectra of the same site are shown. Sp/Tp: phosphorylated serine/threonine; Sd/Td: dehydrated serine/threonine (due to neutral loss of phosphate). (B) GST tagged Cdc15C was phosphorylated by MBP-Kin1, GST-Shk1, and MBP-Pck1 in presence of γ-[32P]-ATP for 30min. Proteins were digested with trypsin and peptides were separated by thin-layer electrophoresis and chromatography. Phosphopeptides were detected by autoradiography.
-
Figure 3—figure supplement 1—source data 1
Full autoradiography images from mapping of phosphorylation sites of Kin1, Shk1, and Pck1 on Cdc15.
- https://cdn.elifesciences.org/articles/83062/elife-83062-fig3-figsupp1-data1-v1.zip
Figure 3—figure supplement 2
Mapping of phosphorylation sites of Kin1, Shk1, and Pck1 on Cdc15.
-
Figure 3—figure supplement 2—source data 1
This source file contains autoradiographs of phosphopeptide maps.
- https://cdn.elifesciences.org/articles/83062/elife-83062-fig3-figsupp2-data1-v1.zip
Figure 3—figure supplement 3
Mapping of phosphorylation sites of Kin1, Shk1, and Pck1 on Cdc15.
-
Figure 3—figure supplement 3—source data 1
This source file contains autoradiographs of phosphopeptide maps.
- https://cdn.elifesciences.org/articles/83062/elife-83062-fig3-figsupp3-data1-v1.zip
Figure 4
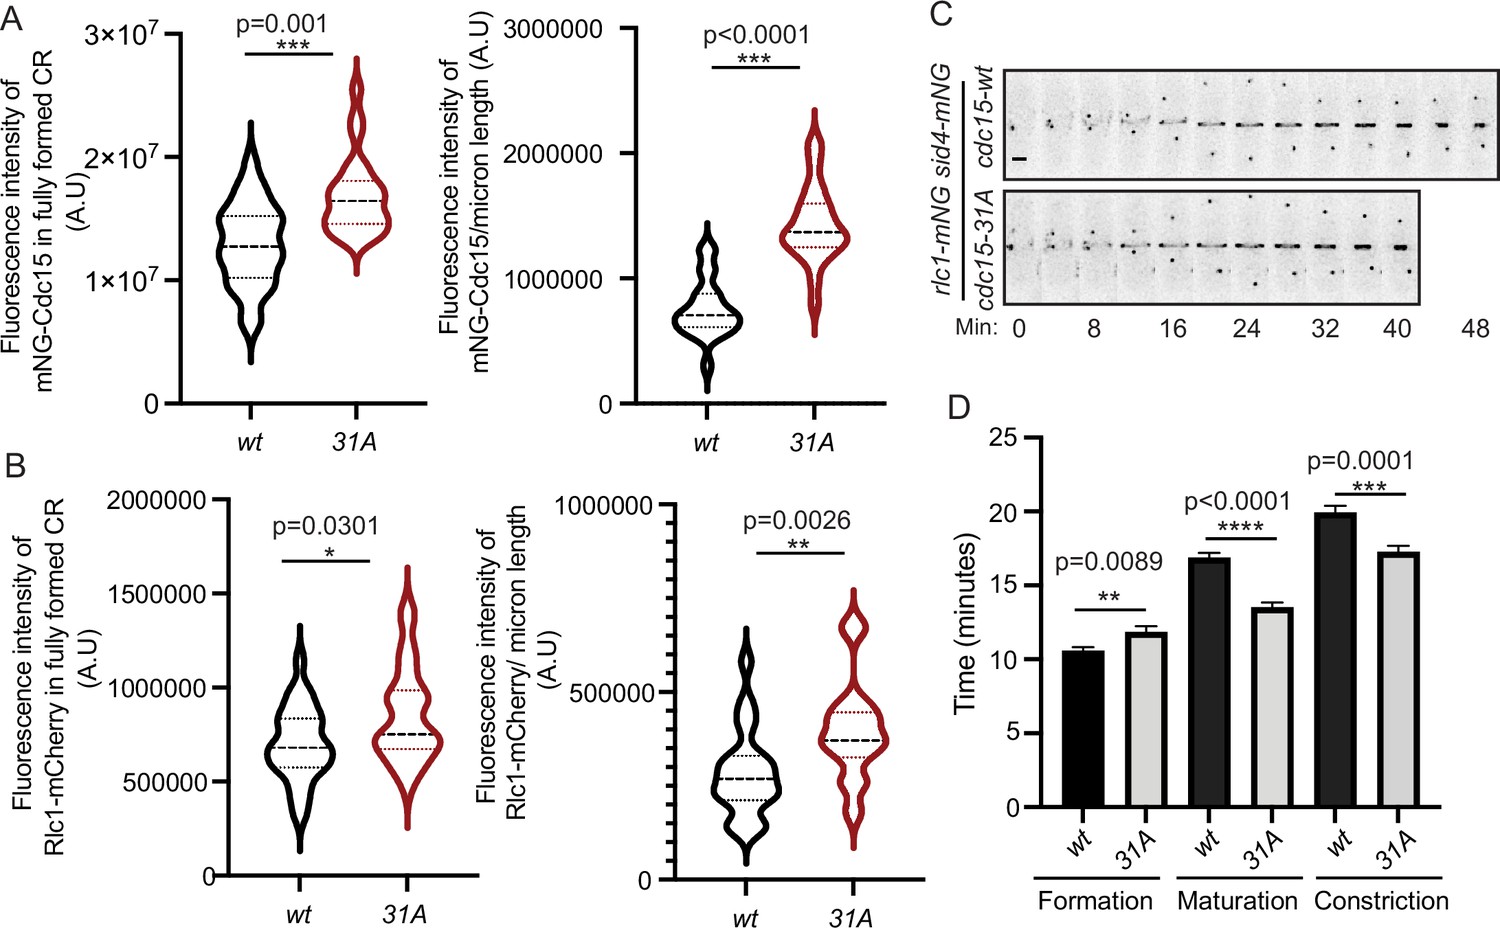
Quantification of mNG-Cdc15 abundance in the cytokinetic ring (CR) and cytokinesis dynamics of Cdc15 phosphomutants.
(A, B) Quantification of the fluorescence intensities of Cdc15 (A) or Rlc1 (B) in the fully formed CR (left) and constricting CRs (right) of wildtype and cdc15-31A cells. The fluorescence intensities of the CRs were normalized to the respective whole cell intensities. (A) n ≥ 29 cells and (B) n ≥ 26 cells (N = 3). (C) Representative montages from live-cell time-lapse movies of the indicated strains. Images were acquired every 2 min and every 4 min are shown. Numbers indicate min from SPB separation. Scale bar, 2 μm. (D) Quantification of the length of cytokinesis of the indicated strains (N = 3), n ≥ 21 cells. Error bars indicate SEM. All statistical comparisons were made using non-parametric t-test with Mann–Whitney test. *p<0.05, **p<0.01, ***p<0.001and ****p<0.0001.
-
Figure 4—source data 1
Raw xlsx and pzfx files used for analysis of the dataset.
- https://cdn.elifesciences.org/articles/83062/elife-83062-fig4-data1-v1.zip
Figure 5 with 2 supplements
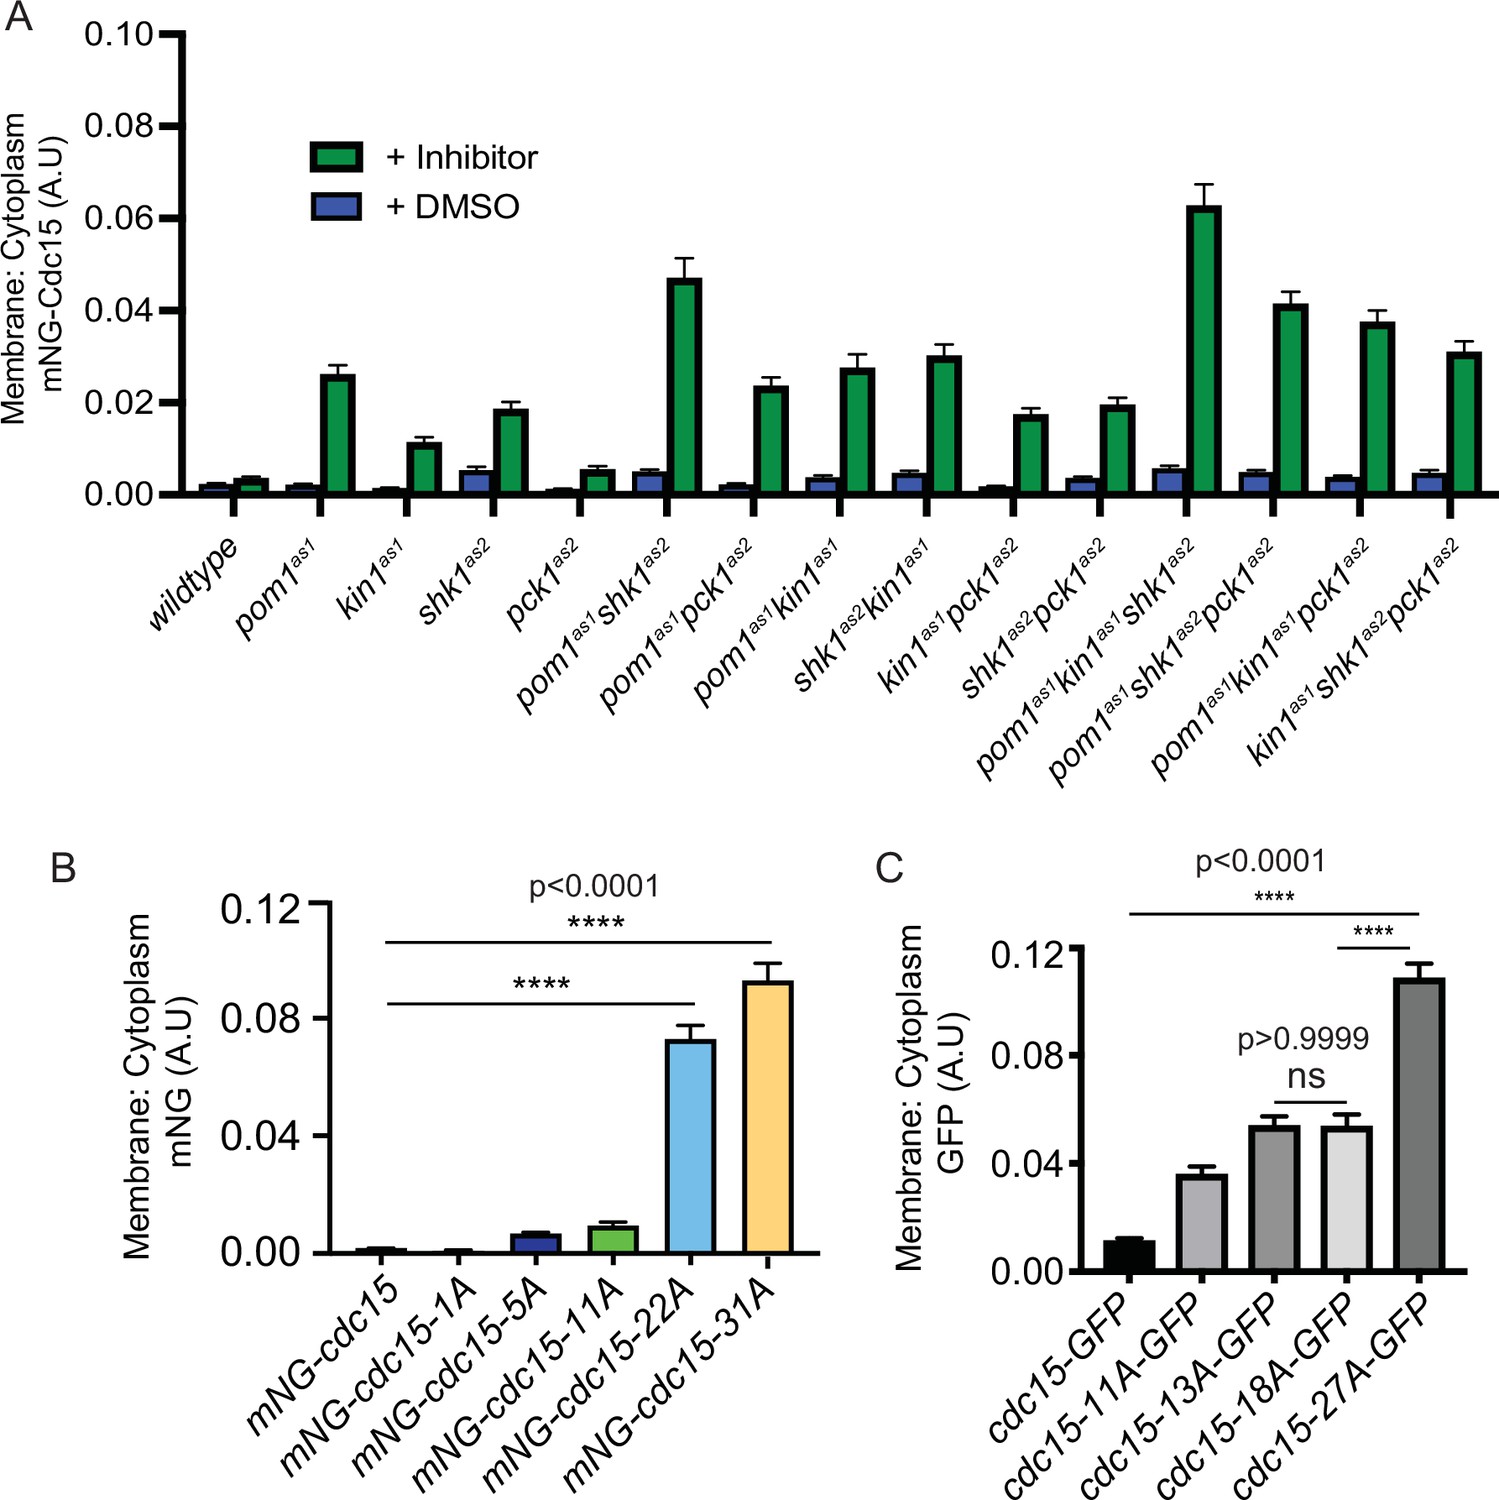
Ratio of membrane to cytoplasm localization of Cdc15 and Cdc15 phosphomutants.
(A) Ratio of membrane to cytoplasm location of mNG-Cdc15 in arbitrary units (A.U.) in the indicated strains after treatment with inhibitor(s) 15 µM 3-MB-PP1 and/or 30 µM 3BrB-PP1 for 15 min. n ≥ 97 cells. (B, C) Ratio of membrane to cytoplasm location of mNG-Cdc15 in the indicated strains. n ≥ 65 (B) and n ≥ 97 cells (C), respectively. Error bars indicate SEM (N = 3). Comparisons were made using one-way ANOVA with Tukey’s multiple-comparison test. ****p<0.0001 and ns = nonsignificant, p>0.05.
-
Figure 5—source data 1
Raw xlsx and pzfx files used for analysis of the dataset.
- https://cdn.elifesciences.org/articles/83062/elife-83062-fig5-data1-v1.zip
Figure 5—figure supplement 1
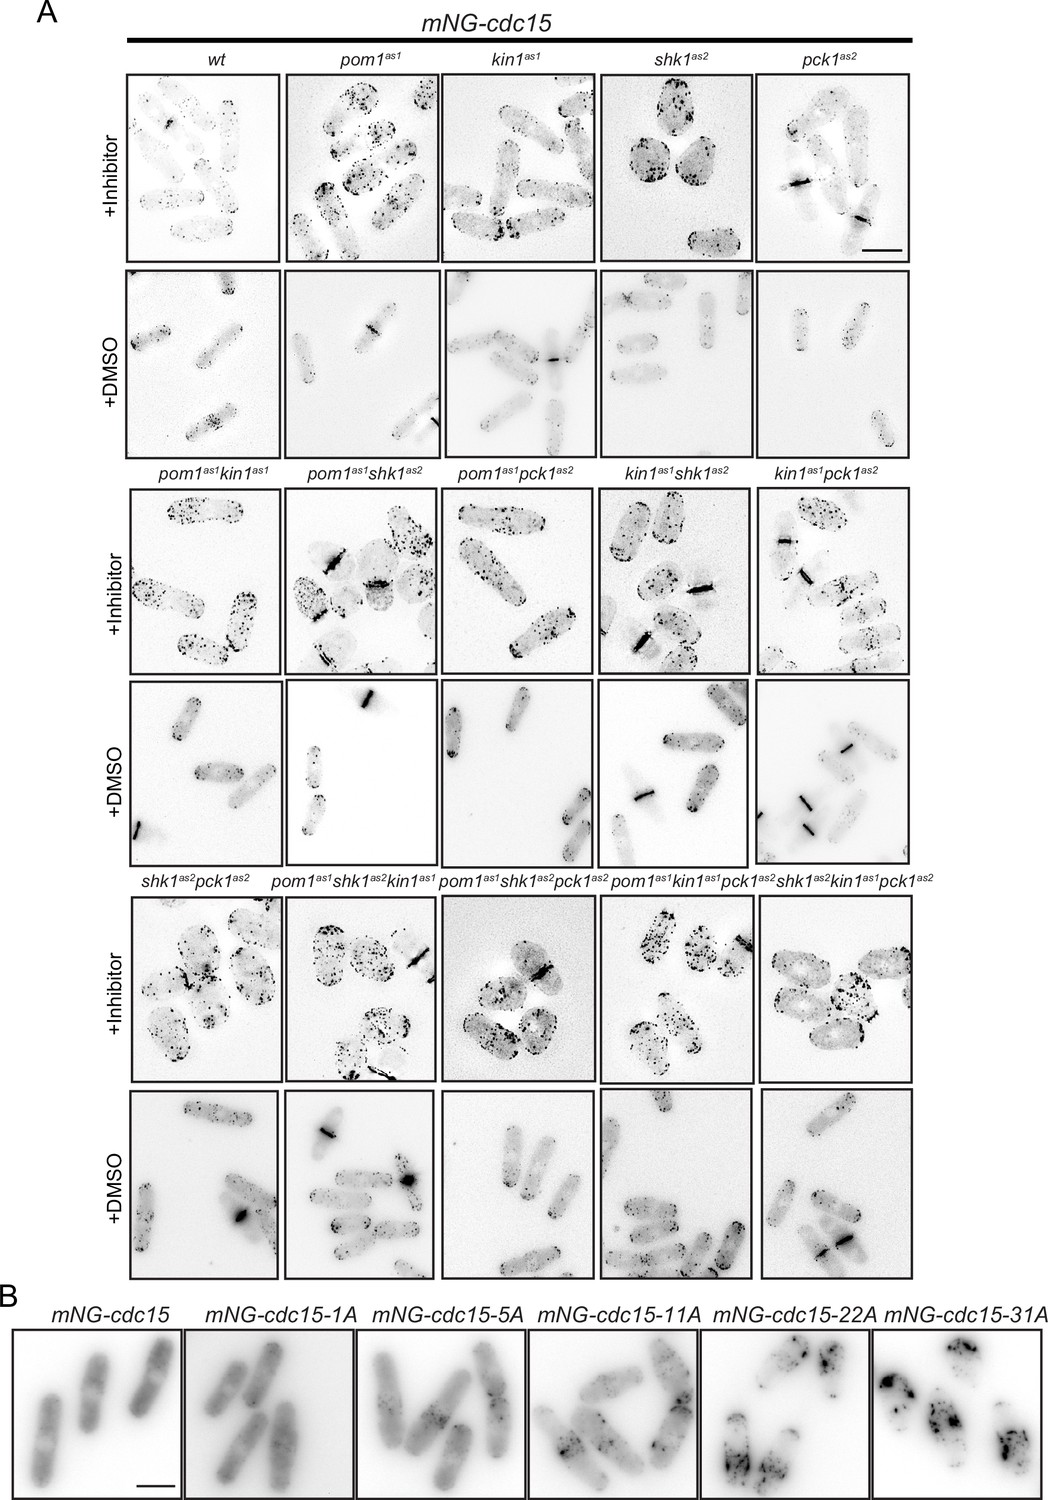
mNG-Cdc15 localization after treatment with DMSO or inhibitor(s) and in Cdc15 phosphomutants.
(A) Representative images of the indicated strains (also shown in Figure 5A) to demonstrate mNG-Cdc15 localization after treatment with inhibitor(s). All representative images were deconvolved and max projected using ImageJ. Scale bar, 10 µm. (B) Representative images of Figure 5B showing membrane-cytosol localization of the indicated Cdc15 phosphomutants. Scale bar, 5 µm.
Figure 5—figure supplement 2
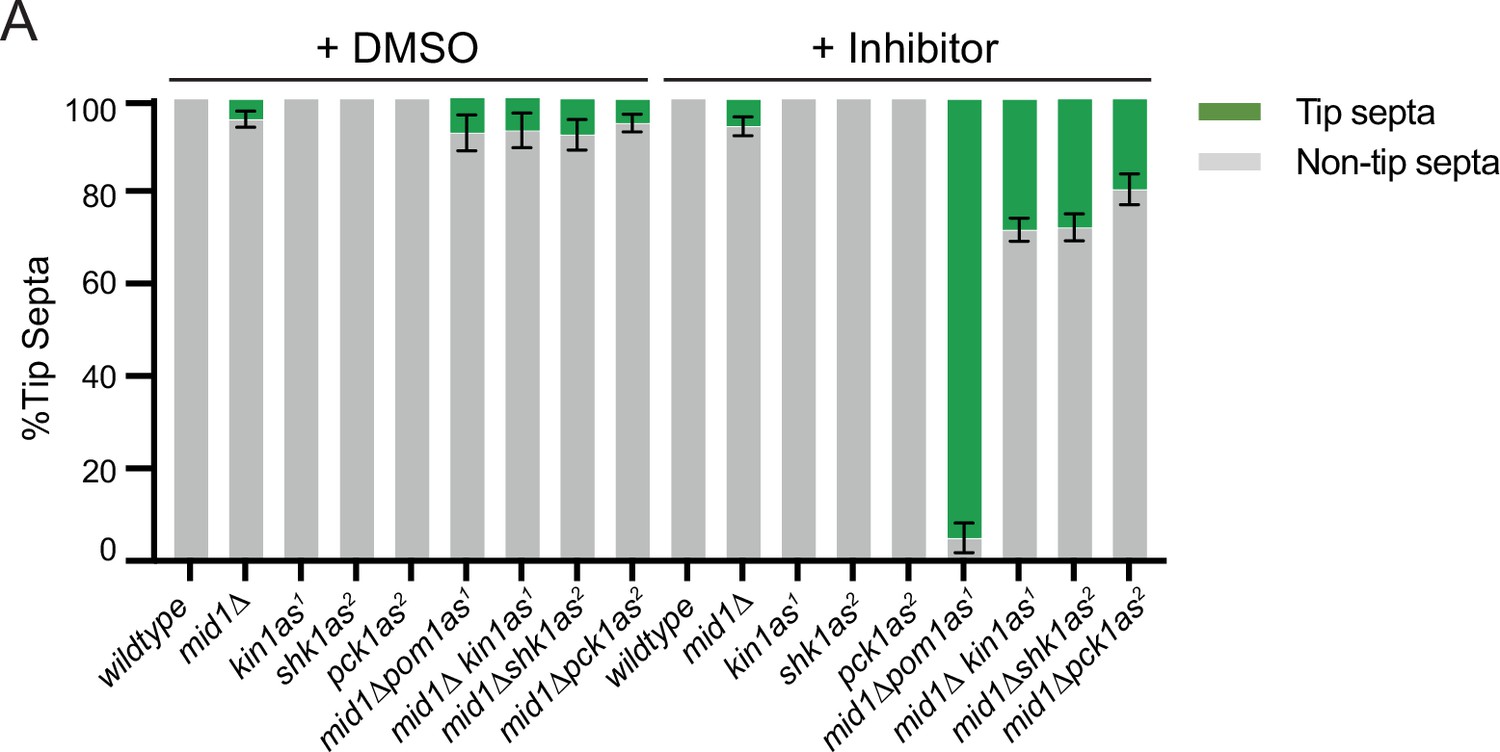
Quantification of tip-septa of the indicated strains.
(A) Quantification of the tip septa phenotype of the indicated strains after treatment with DMSO or the inhibitor(s) 3-MB-PP1 or 3-BrB-PP1 for 2 hr at 32°C from three biological replicates.
N ≥100 cells.
-
Figure 5—figure supplement 2—source data 1
Raw xlsx and pzfx files used for analysis of the dataset.
- https://cdn.elifesciences.org/articles/83062/elife-83062-fig5-figsupp2-data1-v1.zip
Figure 6 with 7 supplements
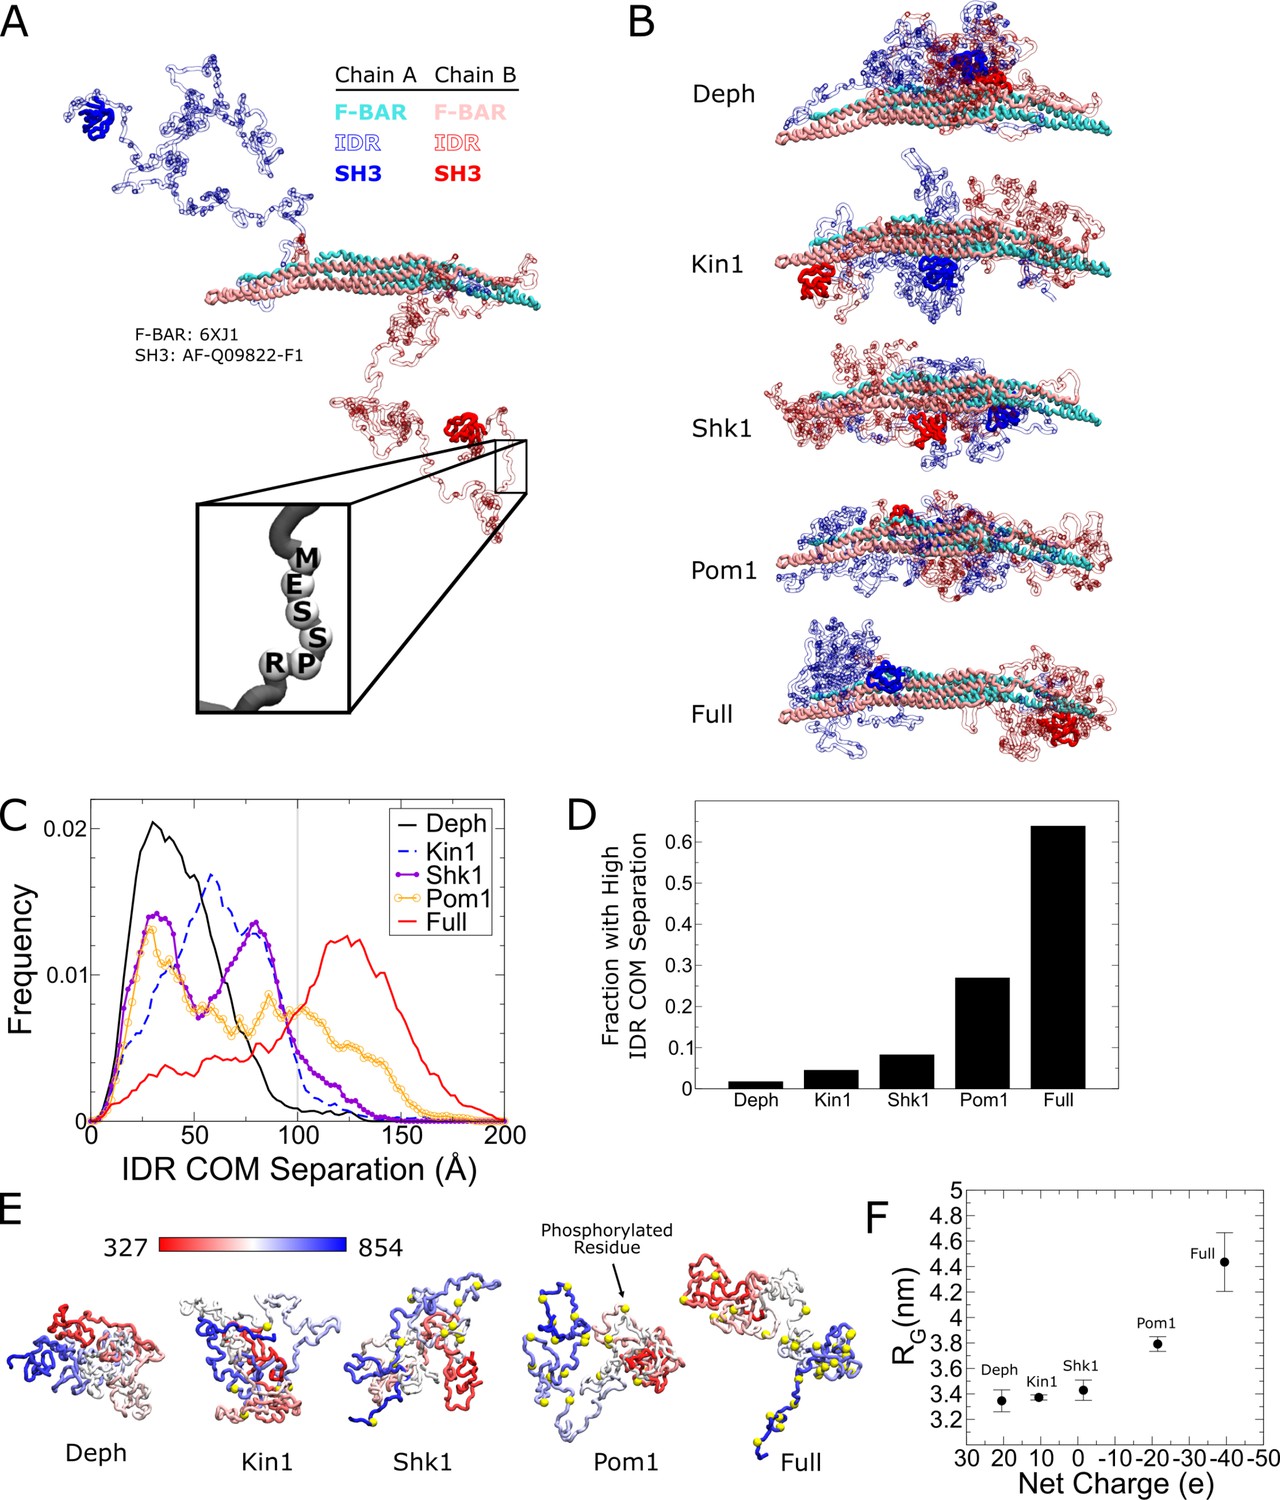
Coarse-grained molecular dynamics of Cdc15 using the Hydrophobicity Scale (HPS) model show large conformational transition induced by Cdc15 intrinsically disordered region (IDR) phosphorylation.
(A) Snapshot of an α carbon representation of a Cdc15 dimer with each amino acid represented by a single bead. The F-BAR and SH3 regions are kept rigid (PDB: 6XJ1 and AlphaFold model AF-Q09822-F1, respectively). All other residues connected with flexible linkers (inset). Snapshot shows the initial condition with the IDRs started apart from each other. (B) Representative simulation snapshots of the indicated phosphorylation state: Deph has no phosphorylation, Full includes all sites from Figure 3, otherwise the label states that the model includes all sites of the named kinase. (C) Frequency distribution of distance between the center of mass (COM) of each IDR. Gray line indicates 100 Å. Ten independent simulations of at least 1.9 µs were performed for each phosphorylation state with half initialized with the IDRs apart (panel A or Figure 6—figure supplement 5A) and half with the IDRs interacting (Figure 6—figure supplement 5B). (D) Fraction of trajectories of indicated states with COM separation greater than 100 Å. (E) Representative snapshots of simulations of single Cdc15 IDR (residues 327–854, connected with flexible linkers) in different phosphorylation states. (F) Average radius of gyration, RG, versus net charge of the chain (phosphorylation charge treated as –2e.) Error bars as described in 'Materials and methods’.
-
Figure 6—source data 1
Raw csv files used to plot the dataset.
- https://cdn.elifesciences.org/articles/83062/elife-83062-fig6-data1-v1.zip
Figure 6—figure supplement 1
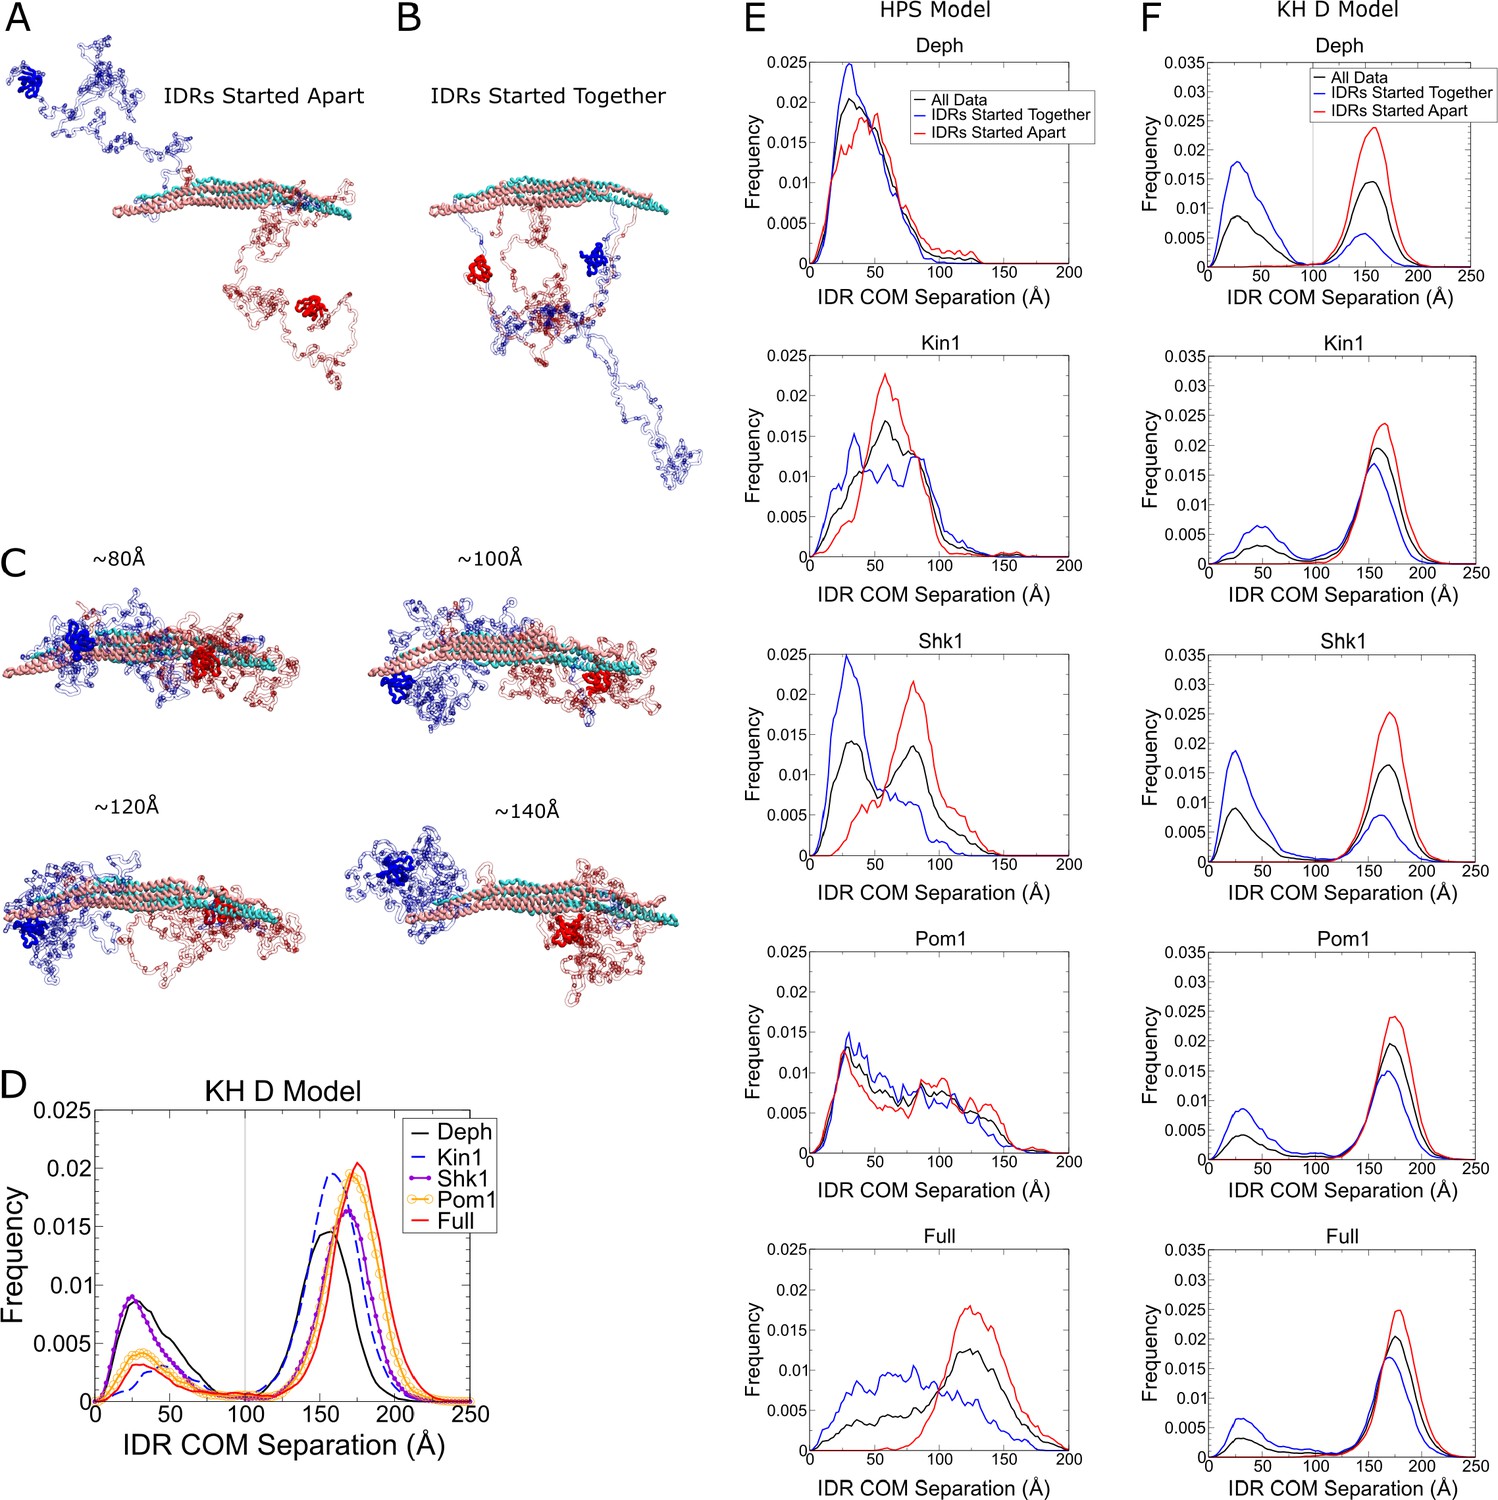
Comparison of Hydrophobicity Scale (HPS) and Kim and Hummer model D (KH D) for Cdc15 dimers and convergence properties of simulations.
(A, B) Snapshots of initial configurations for both the HPS and KH D models. Ten independent simulations of the Cdc15 dimer in each phosphorylation state were performed of at least 1.9 µs for HPS (at least 10 µs for KH D), with half initialized with IDRs apart and half with the IDRs interacting. A higher temperature of 350 K was used for KH D model. (C) Representative simulation snapshots at the indicated center of mass (COM) distance between each intrinsically disordered region (IDR). (D) Frequency distribution of distance between the COM of each IDR in the KH D model, averaged over all simulations (as in Figure 6F for HPS model). Gray line indicates 100 Å. A tendency for increased IDR separation with increased phosphorylation similar to the HPS model can be observed. However, as shown in panels (E, F), the IDRs mostly remain trapped into fused or segregated states according to their initial conditions of panel (A) so the bimodal distribution reflects the initial conditions rather than equilibrium. (E) Frequency distributions of distance between the COM of each IDR in the HPS models, according to the initial condition of panel (A). Distributions approach a common curve independent of the initial condition, indicating that simulations approach equilibrium, though less so for the Full and Shk1 cases. (F) Same as panel (E), for the KH D model. The COM remains close to the respective initial condition, indicating lack of KH D model equilibration. A fraction of the Pom1 and full cases, however, still separate to COM above 100 Å, even if started together.
-
Figure 6—figure supplement 1—source data 1
Raw csv files used to plot the dataset.
- https://cdn.elifesciences.org/articles/83062/elife-83062-fig6-figsupp1-data1-v1.zip
Figure 6—figure supplement 2
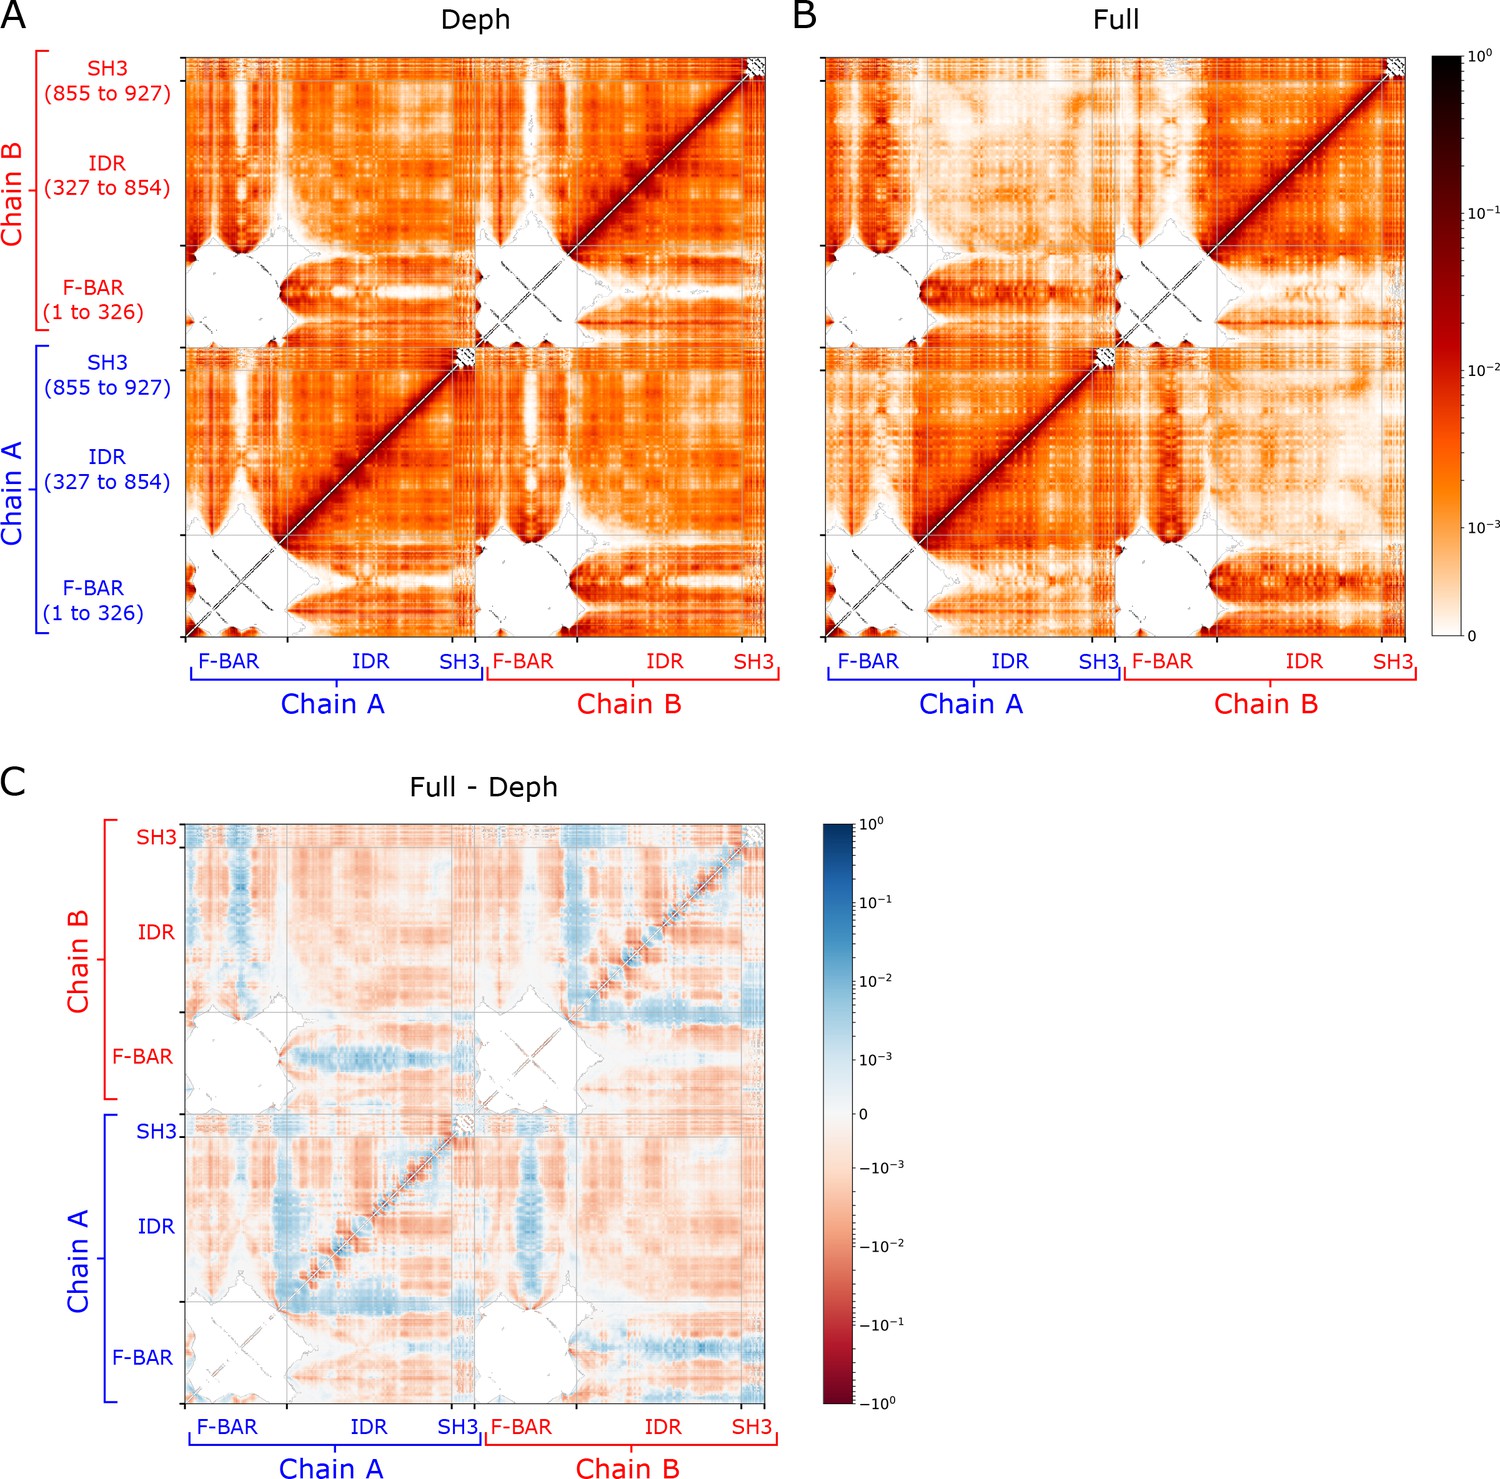
Cdc15 dimer simulation contact maps in the Hydrophobicity Scale (HPS) model.
(A, B) Residue to residue contact frequency for the dephosphorylated (Deph) and fully phosphorylated (Full) protein models, calculated with a 10 Å cutoff, over all 10 simulations of Figure 6 and Figure 6—figure supplement 1E. (C) Difference of the plots in panels (A, B) such that blue indicates an increase in contacts in the fully phosphorylated (Full) state. Blue and red striped patterning occurs for the contacts between F-BAR and intrinsically disordered region (IDR), and between F-BAR and SH3 domains. The predominantly blue regions, indicating increased contacts, occur at the poles of the F-BAR, while the predominantly red regions occur toward the middle of the F-BAR (see Figure 6—figure supplement 3). The region of inter-chain IDR contacts is red overall, indicating decreased interaction between the IDRs in the fully phosphorylated case.
-
Figure 6—figure supplement 2—source data 1
Raw data files used to plot the dataset.
- https://cdn.elifesciences.org/articles/83062/elife-83062-fig6-figsupp2-data1-v1.zip
Figure 6—figure supplement 3
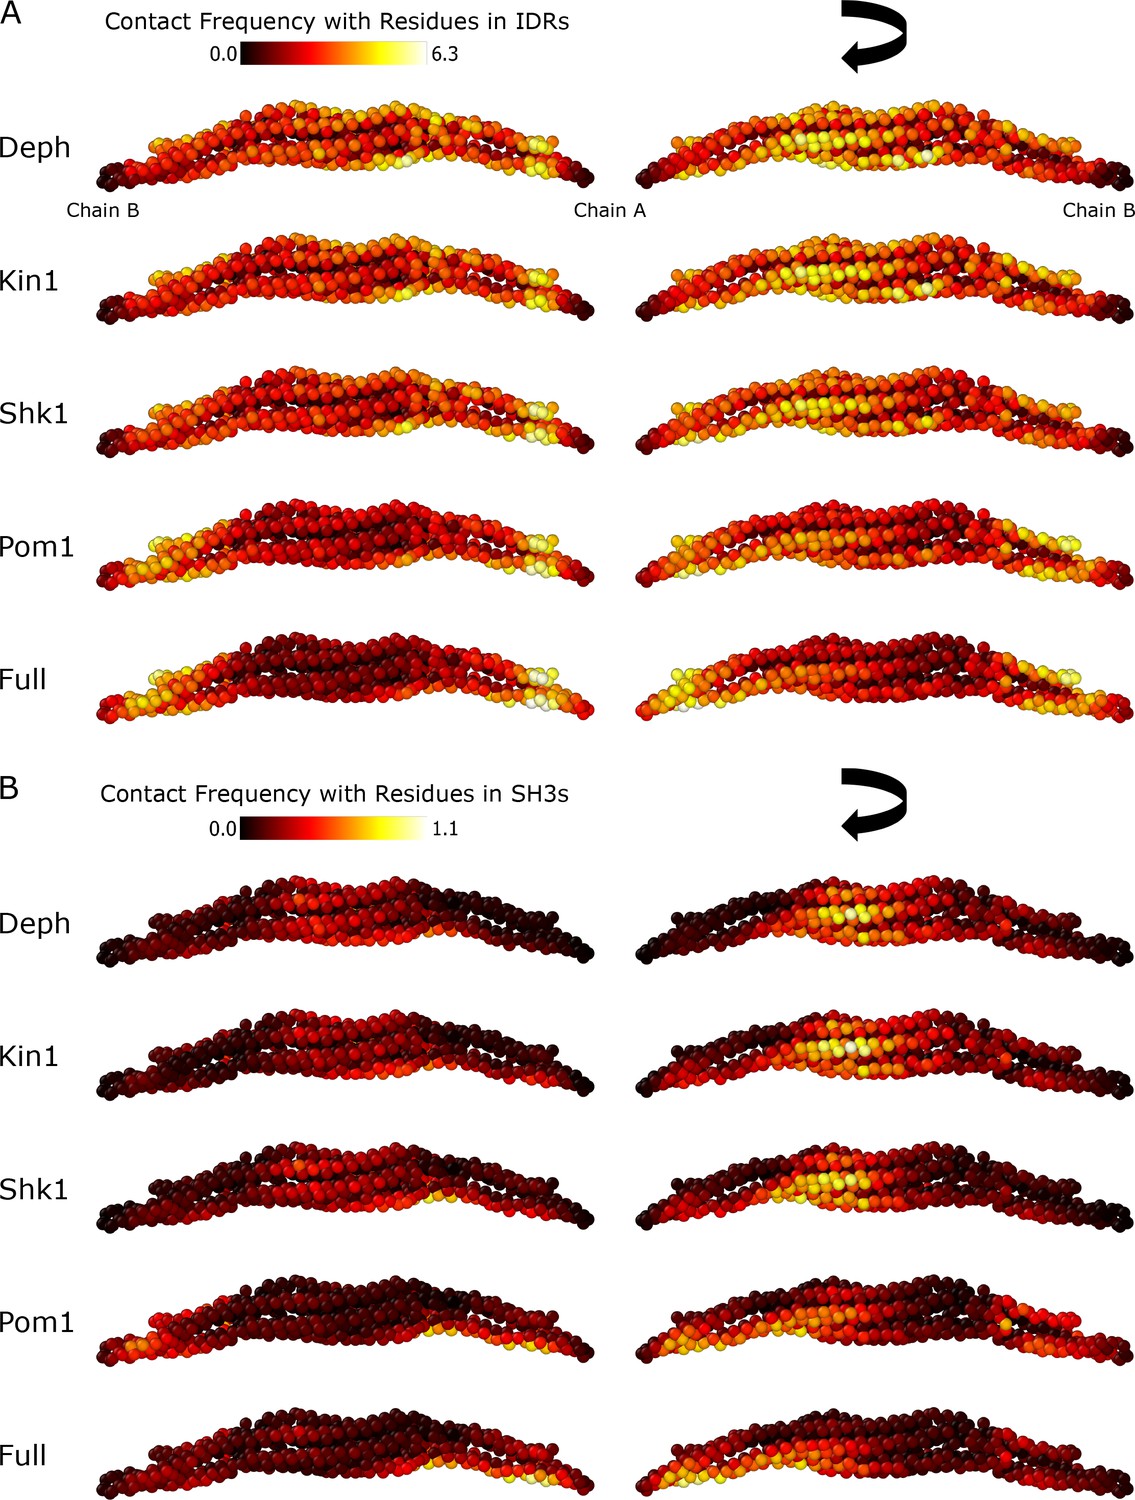
Cdc15 dimer simulation F-BAR contacts in the Hydrophobicity Scale (HPS) model.
(A) Spatial depiction the contact frequency of the residues on either side of the F-BAR with any residues in the intrinsically disordered region (IDR) (sum of contact frequency with residues 301–869 in chain A, or 299–869 in chain B), calculated with a 10 Å cutoff. (B) Same as panel (A) but for contacts with any residues in the SH3 (sum of contact frequency with residues 870–927 in either chain). The value is averaged over all 10 simulations of Figure 6.
-
Figure 6—figure supplement 3—source data 1
Raw xyz files used to plot the dataset.
- https://cdn.elifesciences.org/articles/83062/elife-83062-fig6-figsupp3-data1-v1.zip
Figure 6—figure supplement 4
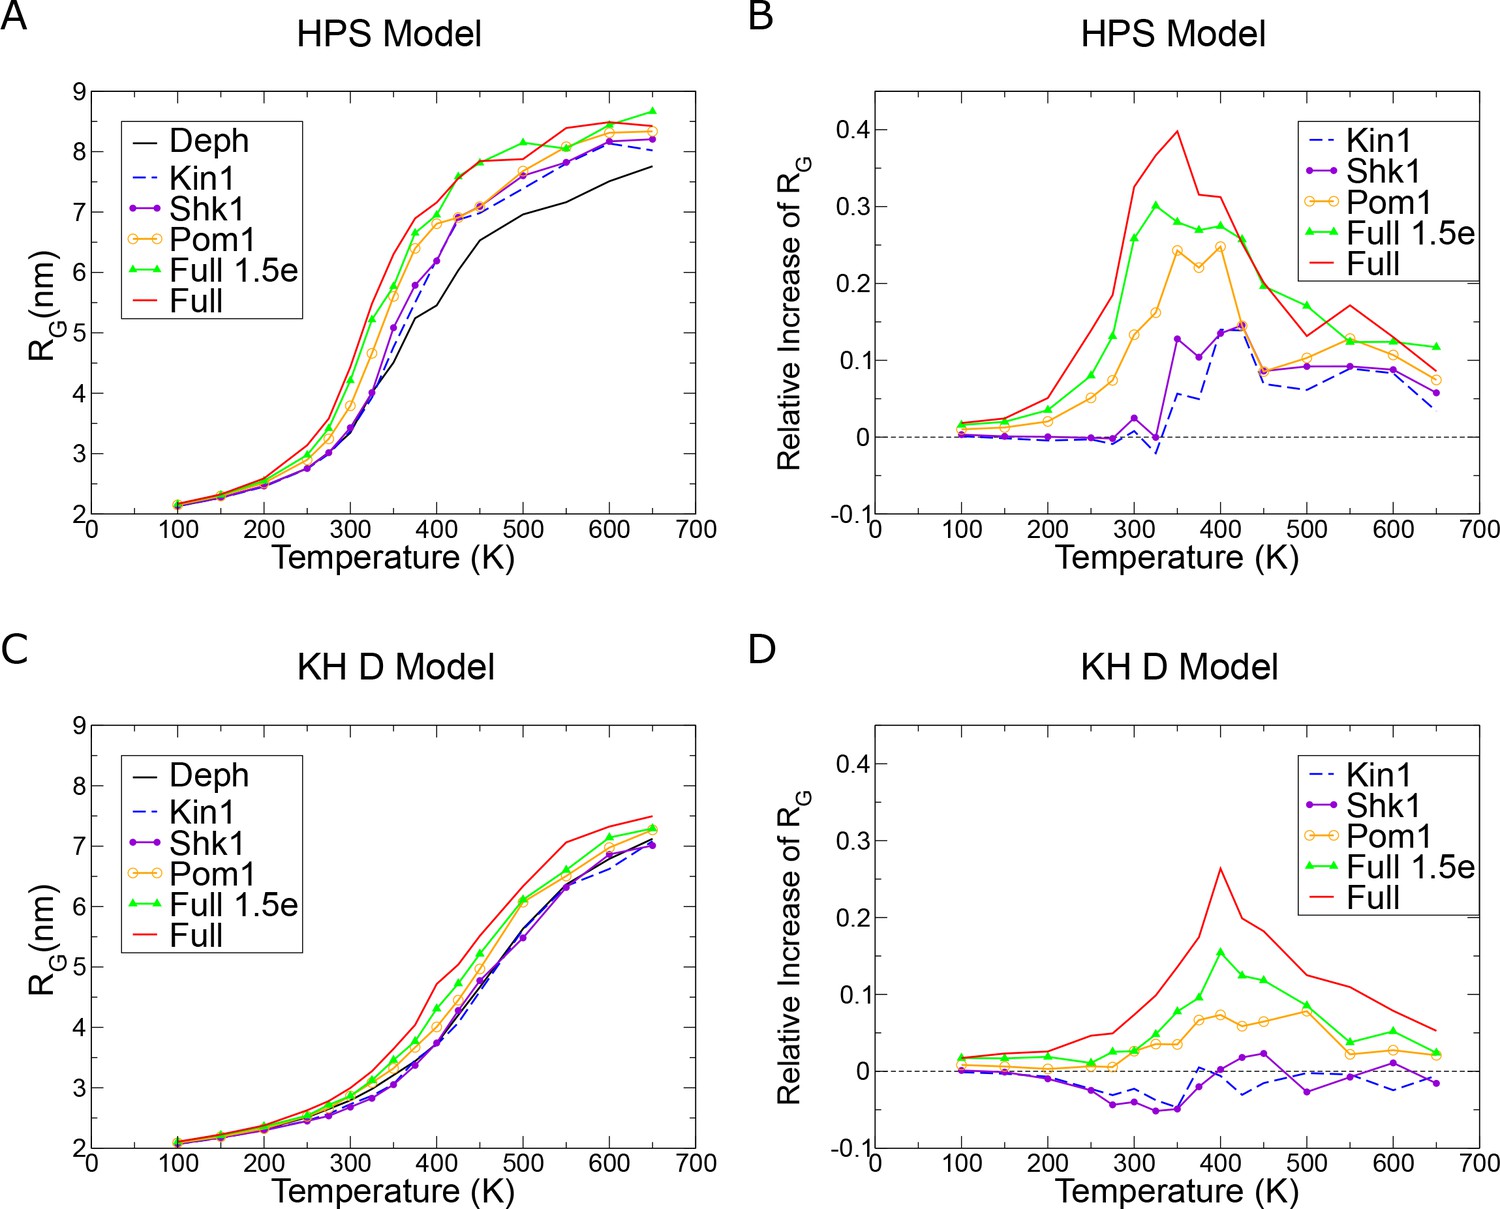
Cdc15 intrinsically disordered region (IDR) size in single chain simulations.
(A, C) RG vs. temperature in the indicated model. (B, D) Increase in RG calculated relative to the dephosphorylated (Deph) case in the indicated model. For each model, independent simulations were run at 16 different temperatures chosen to span the coil-to-globule transition. For Hydrophobicity Scale (HPS), trajectory durations for each temperature range from 3.8 to 21.4 μs depending on convergence efficiency, with the most collapsed simulations running for the shortest time. Kim and Hummer model D (KH D) trajectories range from 5.8 to 30.7 μs.
-
Figure 6—figure supplement 4—source data 1
Raw csv files used to plot the dataset.
- https://cdn.elifesciences.org/articles/83062/elife-83062-fig6-figsupp4-data1-v1.zip
Figure 6—figure supplement 5
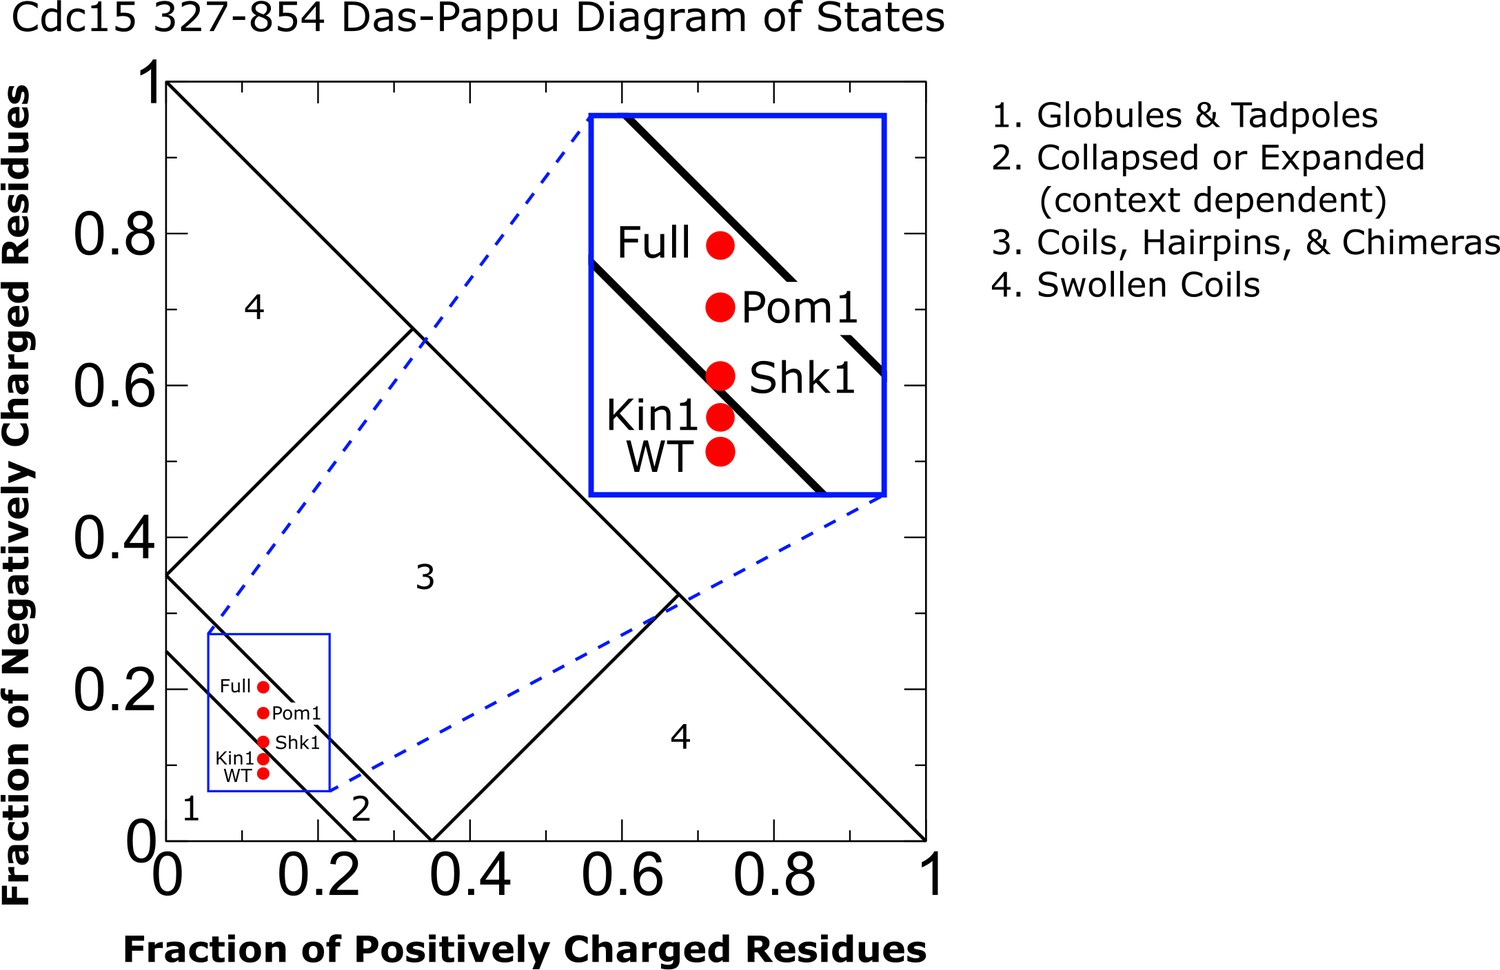
Diagram of states for Cdc15 intrinsically disordered region (IDR).
Diagram of states for the Cdc15 IDR (residues 327–854) treating phosphorylation charge as –2e as in the Hydrophobicity Scale (HPS) model of Perdikari et al. and in our implementation of the Kim and Hummer model D (KH D).
-
Figure 6—figure supplement 5—source data 1
Raw csv files used to plot the dataset.
- https://cdn.elifesciences.org/articles/83062/elife-83062-fig6-figsupp5-data1-v1.zip
Figure 6—video 1
Simulation of Cdc15 dimer in the Hydrophobicity Scale (HPS) model with intrinsically disordered regions (IDRs) started apart.
The Cdc15 dimer is represented as described in Figure 6A. One of the five independent trajectories is shown starting in the IDRs apart initial condition (Figure 6—figure supplement 1A) for both the dephosphorylated case (top) and the fully phosphorylated case (bottom). In the dephosphorylated case, the IDRs from each chain spend the majority of the time interacting with each other near the center of the F-BAR. In the fully phosphorylated case, the IDRs mostly remain separated and localized to the F-BAR poles while occasionally interacting with each other.
Figure 6—video 2
Simulation of Cdc15 dimer in the Hydrophobicity Scale (HPS) model with intrinsically disordered regions (IDRs) started interacting.
Same as Figure 6—video 1 but starting in the IDRs interacting initial condition (Figure 6—figure supplement 1B). In the dephosphorylated case, the IDRs from each chain remain interacting with each other and localize mostly toward the center of the F-BAR. In the fully phosphorylated case, the IDRs are able to separate from each other (1776 ns) and are localized less to the center of the F-BAR throughout the trajectory.
Figure 7 with 2 supplements
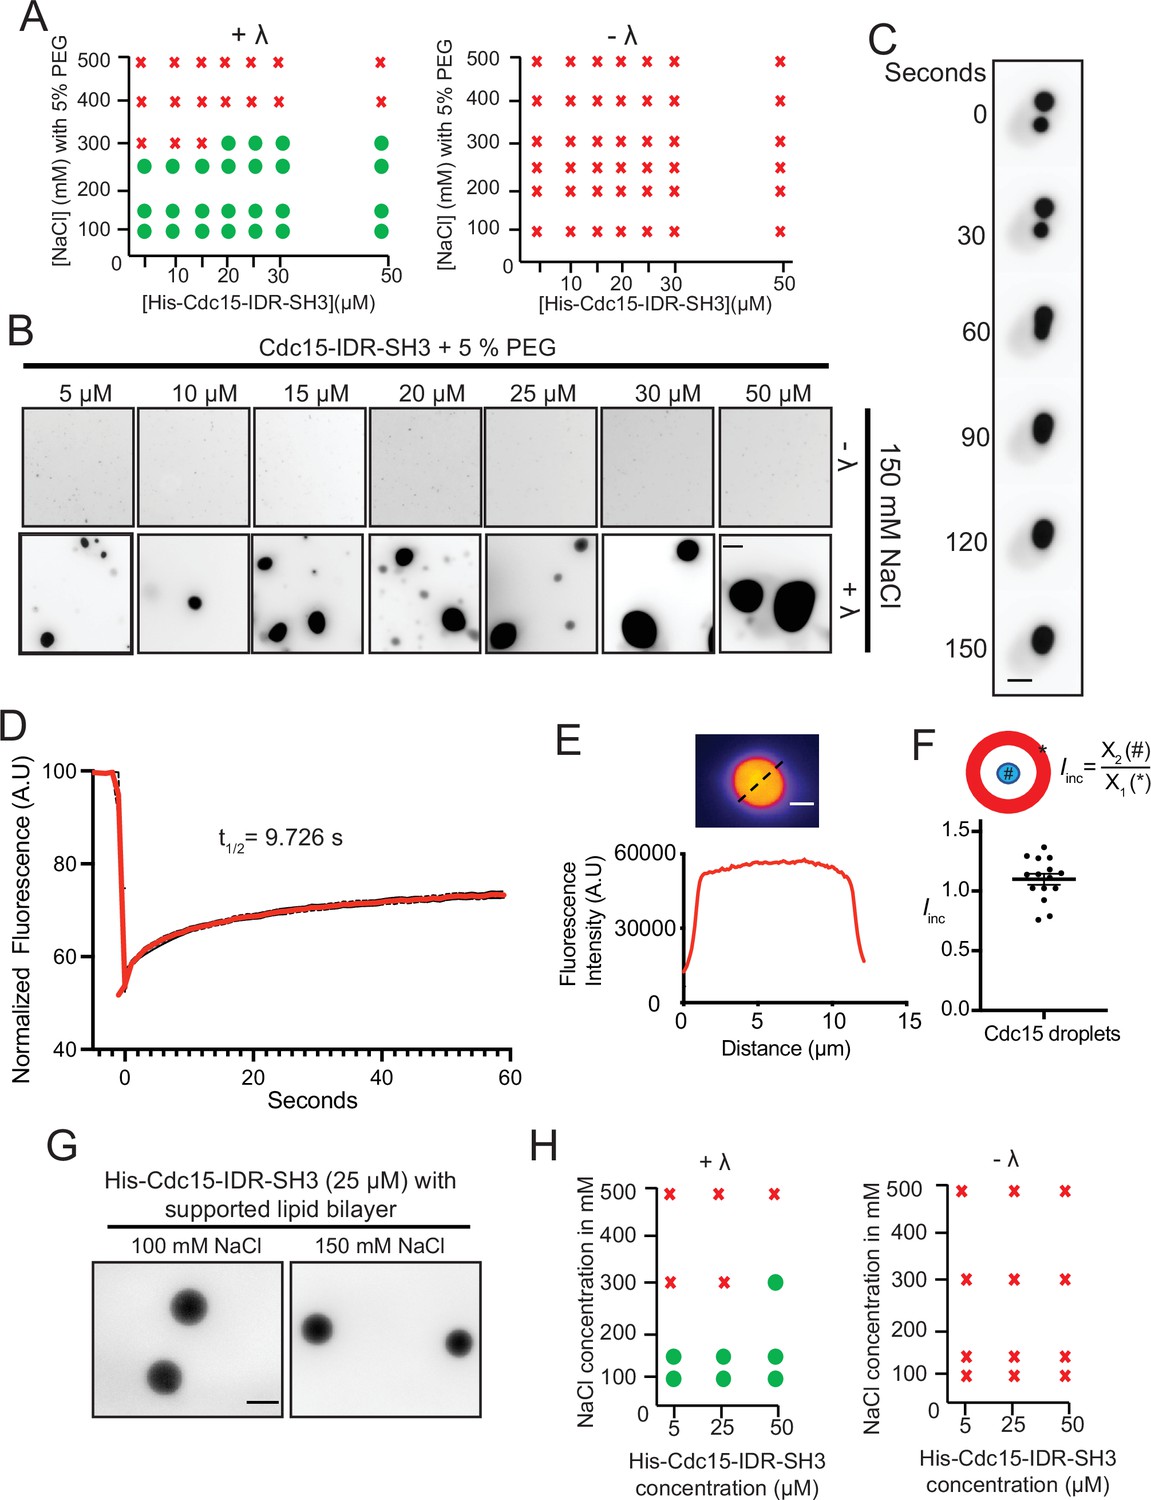
Cdc15-IDR-SH3 phase separates in a phosphoregulated manner.
(A) Phase diagrams showing whether purified Pom1-phosphorylated Cdc15-IDR-SH3 labeled with Alexa-488 succinimide ester dye formed droplets at different protein concentrations, NaCl concentrations, and with or without λ-phosphatase (λ) treatment. (B) In vitro droplet formation at different concentrations of Pom1-phosphorylated Cdc15-IDR-SH3 in 50 mM Tris pH 7.4, 150 mM NaCl with 5% PEG after treatment with λ (lower panel). Scale bar, 10 μm. (C) Time-lapse analysis showing fusion of droplets containing Cdc15-IDR-SH3 after treatment with λ. Phase separation assays were performed in 50 mM Tris pH 7.4, 150 mM NaCl. Scale bar, 5 μm. (D) FRAP dynamics of Cdc15–IDR-SH3 condensates after partial bleaching. In these experiments, droplets were formed in 50 mM Tris pH 7.4, 150 mM NaCl without PEG and with 25 μM of labeled protein. n = 10, N = 3. (E) Fluorescent image (top) and line scan (bottom) performed through the center of a droplet. (F) Incorporation index (Iinc = Intensitycenter / Intensityedge) for Cdc15-IDR- Alexa-488 when dephosphorylated at 50 mM Tris pH 7.4, 150 mM NaCl, 5% PEG with 25 μM of protein. n = 15 droplets. (G, H) TIRF imaging was used to detect condensates of labeled His-Cdc15-IDR-SH3 on supported lipid bilayers that include Ni-NTA lipids. (G) Condensate formation at 25 μM His-Cdc15-IDR-SH3 on a supported lipid bilayer after treatment with λ-phosphatase in 50 mM Tris pH 7.4, 250 mM NaCl. Scale bar, 5 μm. (H) Phase diagrams of purified His-Cdc15-IDR-SH3 labeled with Alexa-488 on a supported lipid bilayer.
-
Figure 7—source data 1
Mov file for Figure 7C, raw xlsx and pzfx files for Figure 7D–F.
- https://cdn.elifesciences.org/articles/83062/elife-83062-fig7-data1-v1.zip
Figure 7—figure supplement 1
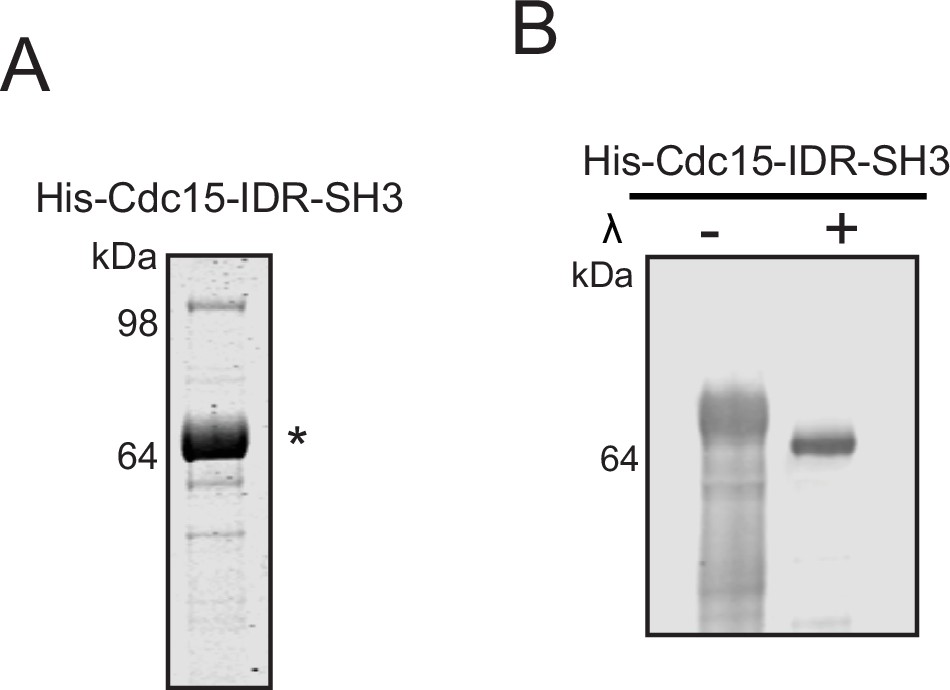
Cdc15-IDR-SH3 purification.
(A) Purified Cdc15-IDR-SH3 used for in vitro phase separation assays was resolved by SDS-PAGE and stained with CB. (B) Before the in vitro droplet assays, samples of purified Cdc15-IDR-SH3 with and without treatment of λ phosphatase (λ) were separated by SDS-PAGE and immunoblotted for Cdc15. The indicated molecular mass markers are in kDa. * indicates His-CDc15-IDR-SH3.
-
Figure 7—figure supplement 1—source data 1
Raw Western blot images and Coomassie stained gel images with the labeled band of interest.
- https://cdn.elifesciences.org/articles/83062/elife-83062-fig7-figsupp1-data1-v1.zip
Figure 7—video 1
Fusion event of Cdc15-IDR-SH3 droplet represented at Figure 7C.
Figure 8 with 1 supplement
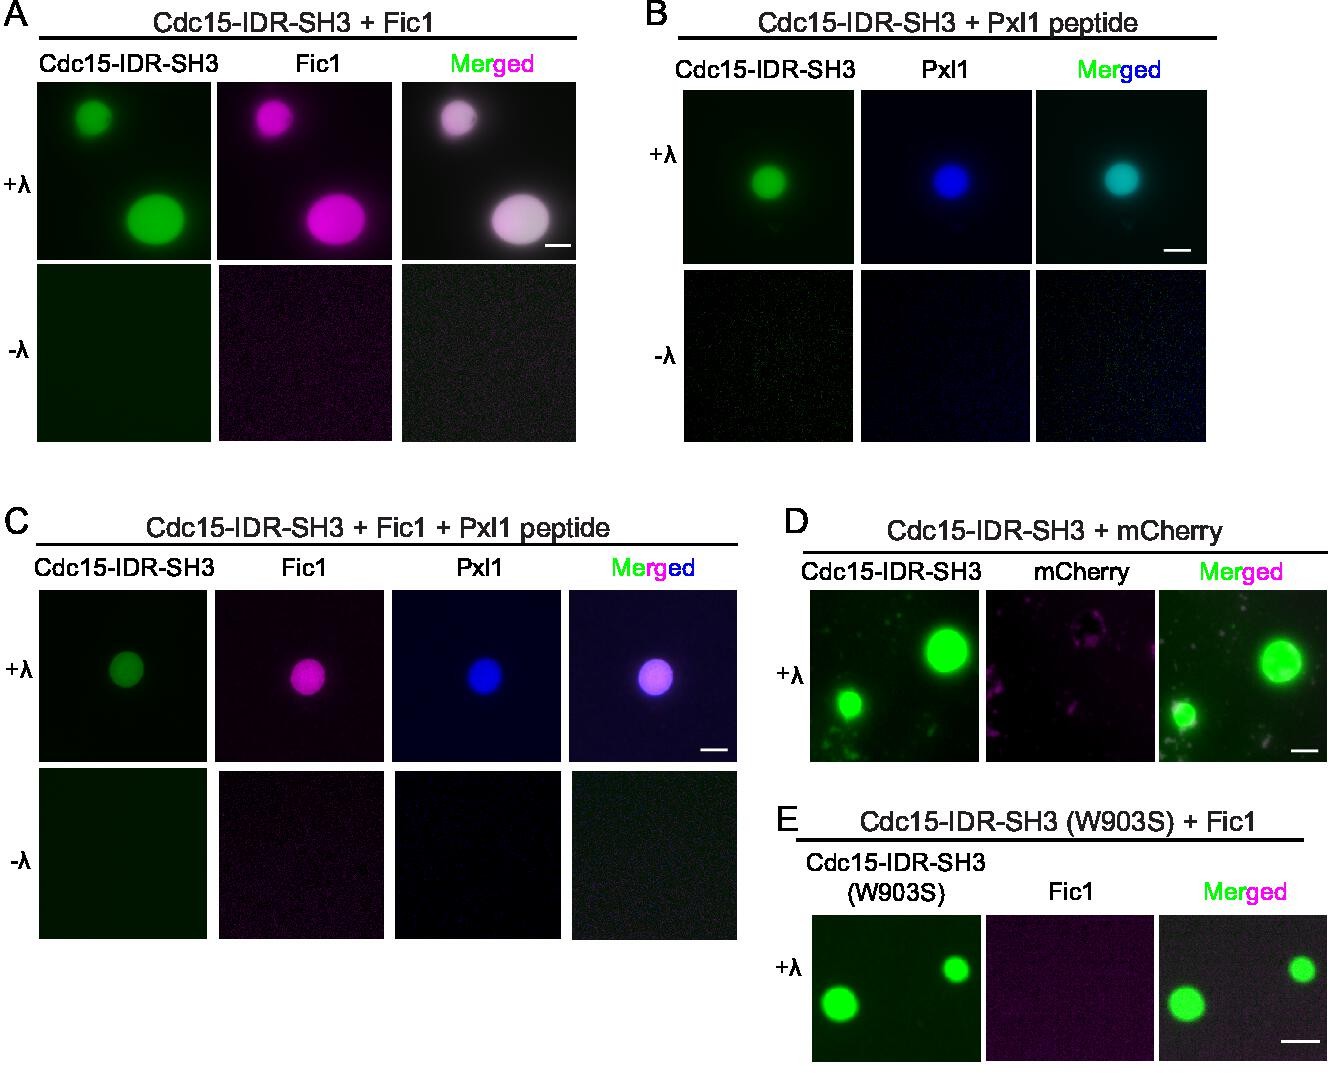
Cdc15 promotes in vitro phase separation of its SH3 domain binding partners, Fic1 and Pxl1.
Images of droplets formed after (A) Pom1-phosphorylated Cdc15-IDR-SH3 (Alexa 488 labeled) and Fic1 (Alexa 647 labeled), (B) Pom1-phosphorylated Cdc15-IDR-SH3 (Alexa 488 labeled) and Pxl1 (residues 177–188; Alexa 405 labeled), or (C) Pom1-phosphorylated Cdc15-IDR-SH3 (Alexa 488 labeled), Fic1 (Alexa 647 labeled), and Pxl1 (residues 177–188; Alexa 405 labeled) were mixed at 10 μM concentration each and treated or not with λ-phosphatase (λ). No visible droplets were detected when Cdc15 remained phosphorylated. (D) Images of droplets formed when Pom1-phosphorylated Cdc15-IDR-SH3 (Alexa 488 labeled) and mCherry were mixed at 10 μM concentration each and then dephosphorylated with λ phosphatase. (E) Images of droplets formed when Pom1-phosphorylated Cdc15-IDR-SH3 (W903S) (Alexa 488 labeled) and Fic1 (Alexa 647 labeled) were mixed at 10 μM concentration each and then treated with λ phosphatase. (A–E) Assays were performed in 50 mM Tris pH 7.4, 150 mM NaCl, and 5% PEG. Scale bars, 5 μm.
Figure 8—figure supplement 1
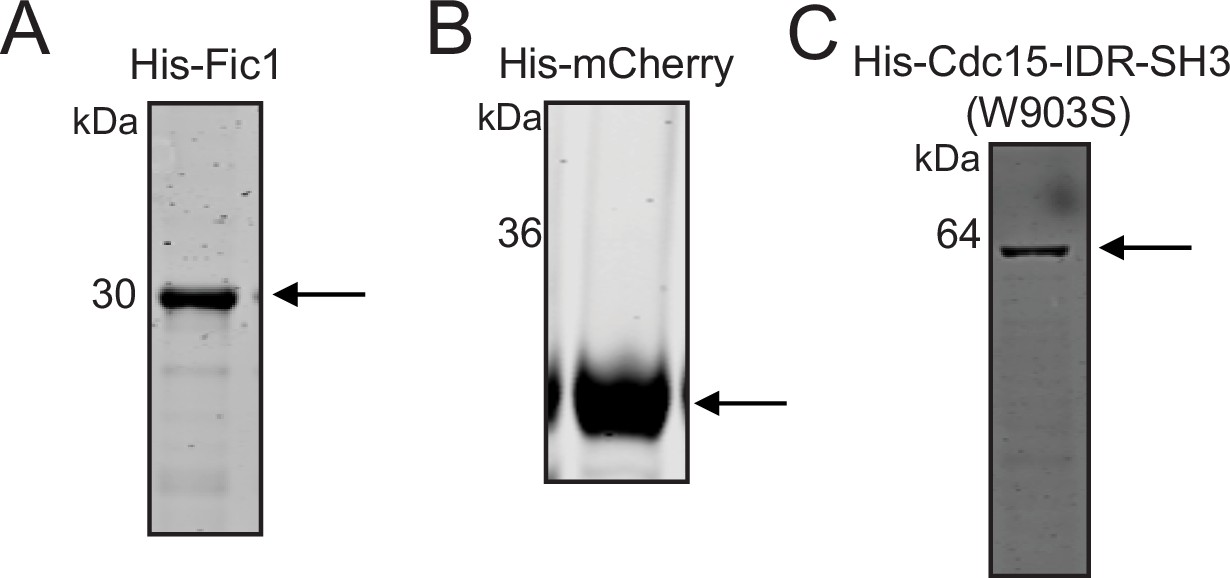
Purification of His-Fic1, His-mCherry, and His-Cdc15-IDR-SH3 (W903S).
Purified recombinant proteins used for in vitro droplet assay: (A) His-Fic1, (B) His-mCherry, and (C) Pom1-phosphorylated His-Cdc15-IDR-SH3 (W903S) were resolved by SDS-PAGE and then stained with CB. The indicated molecular mass markers are in kDa. Arrows indicate the proteins mentioned above in (A–C).
-
Figure 8—figure supplement 1—source data 1
Raw Coomassie stained gel images with the labeled band of interest.
- https://cdn.elifesciences.org/articles/83062/elife-83062-fig8-figsupp1-data1-v1.zip
Figure 9 with 3 supplements

Full-length Cdc15 promotes in vitro phase separation of its F-BAR and SH3 domain binding partners.
Images of droplets formed with (A) 10 μM each full-length Pom1-phosphorylated Cdc15 (E30K, E152K) (Alexa 488 labeled) treated or not with λ-phosphatase and incubated with Fic1 (Alexa 647 labeled), Pxl1 (residues 177–188; Alexa 405 labeled), and Cdc12 (residues 20–40; unlabeled). (B) 10 μM each of full length Pom1-phosphorylated Cdc15 (E30K, E152K) (Alexa 488 labeled) treated or not with λ phosphatase and incubated with Fic1 (Alexa 647 labeled), Pxl1 (residues 177–188; unlabeled), and Cdc12 (residues 20–40; Alexa 405 labeled). Phase separation assays were performed in 50 mM Tris pH 7.4, 250 mM NaCl with 5% PEG. Scale bars, 5 μm.
Figure 9—figure supplement 1
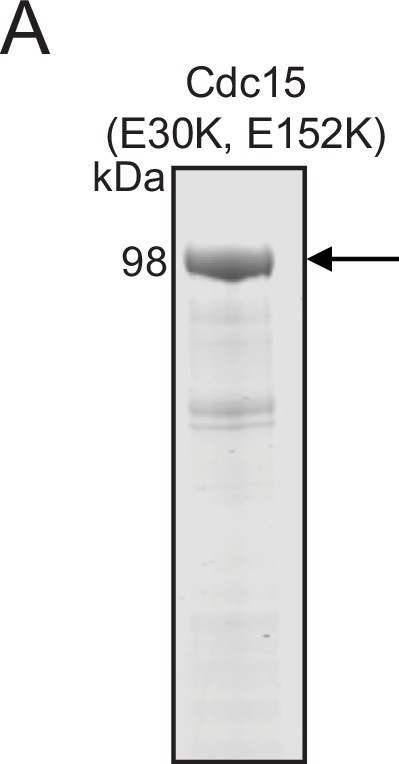
Purification of full-length Pom1-phosphorylated Flag-Cdc15 (E30K, E152K).
(A) Purified recombinant Pom1-phosphorylated Flag-Cdc15 (E30K, E152K) was resolved by SDS-PAGE and then stained with CB. The indicated molecular mass markers are in kDa. Arrow indicates Flag-Cdc15 (E30K, E152K).
-
Figure 9—figure supplement 1—source data 1
Raw Coomassie stained gel image with the labeled band of interest.
- https://cdn.elifesciences.org/articles/83062/elife-83062-fig9-figsupp1-data1-v1.zip
Figure 9—video 1
Apparent fission events of the mNG-Cdc15 condensates in mNG-Cdc15-31A strain shown in Figure 9C.
Figure 9—video 2
Apparent fusion events of the mNG-Cdc15 condensates in mNG-Cdc15-31A strain shown in Figure 9C.
Figure 10
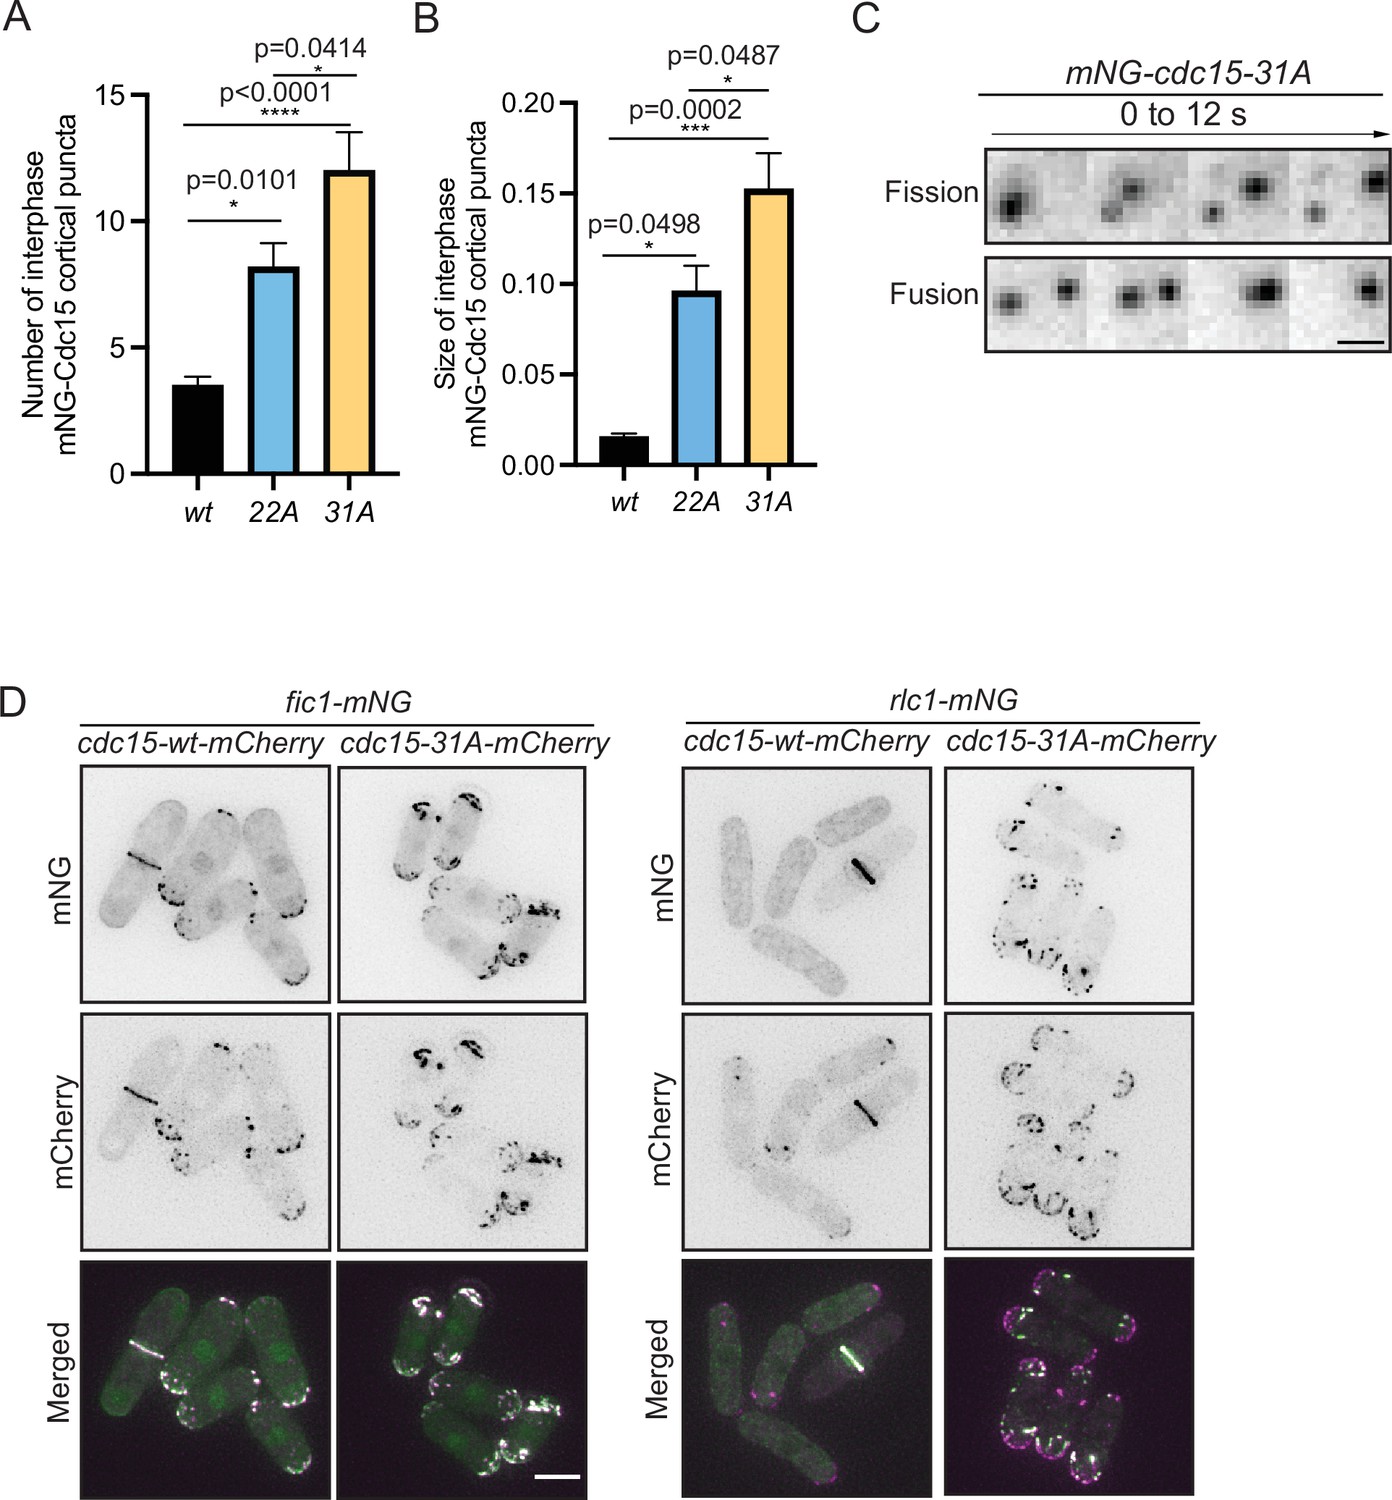
Cdc15 assembles into condensates and shows dynamic property in vivo.
(A, B) Quantification of the number (A) and size (B) of Cdc15 condensates in the cortex of the indicated strains during interphase. n ≥ 10 cells, N = 3. Error bars indicate SEM. Comparisons were made using one-way ANOVA with Tukey’s multiple-comparison test. *p<0.05, **p<0.01, ***p<0.001, and ****p<0.0001. (C) mNG-Cdc15 condensates undergoing apparent fission (top) and fusion (bottom) events in mNG-cdc15-31A strain. Scale bar, 2 μm. (D) Representative images to show Fic1-mNG (left), Rlc1-mNG (right) co-localizing with Cdc15-mCherry from the indicated cdc15-wt and cdc15-31A strains. Scale bar, 5 μm.
-
Figure 10—source data 1
Raw xlsx and pzfx files for Figure 10A and B and mov file for Figure 10C.
- https://cdn.elifesciences.org/articles/83062/elife-83062-fig10-data1-v1.zip
Additional files
-
Supplementary file 1
S. pombe strains used in this study.
- https://cdn.elifesciences.org/articles/83062/elife-83062-supp1-v1.docx
-
Supplementary file 2
DNA oligos and peptides used for this study.
- https://cdn.elifesciences.org/articles/83062/elife-83062-supp2-v1.xlsx
-
Supplementary file 3
Protein concentration measurement data using BCA method.
- https://cdn.elifesciences.org/articles/83062/elife-83062-supp3-v1.xlsx
-
MDAR checklist
- https://cdn.elifesciences.org/articles/83062/elife-83062-mdarchecklist1-v1.pdf
Download links
A two-part list of links to download the article, or parts of the article, in various formats.
Downloads (link to download the article as PDF)
Open citations (links to open the citations from this article in various online reference manager services)
Cite this article (links to download the citations from this article in formats compatible with various reference manager tools)
Multiple polarity kinases inhibit phase separation of F-BAR protein Cdc15 and antagonize cytokinetic ring assembly in fission yeast
eLife 12:e83062.
https://doi.org/10.7554/eLife.83062


