Iron chelation improves ineffective erythropoiesis and iron overload in myelodysplastic syndrome mice
- Division of Hematology and Medical Oncology, Tisch Cancer Institute, Icahn School of Medicine at Mount Sinai, United States
- State Key Laboratory of Experimental Hematology, National Clinical Research Center for Blood Diseases, Division of Pediatric Blood Diseases Center, Institute of Hematology & Blood Diseases Hospital, Chinese Academy of Medical Sciences & Peking Union Medical College, China
- Division of Hematology and Medical Oncology, Albert Einstein College of Medicine, United States
- Department of Hematology, Hadassah Medical Center, Hebrew University, Israel
Figures
Figure 1 with 6 supplements
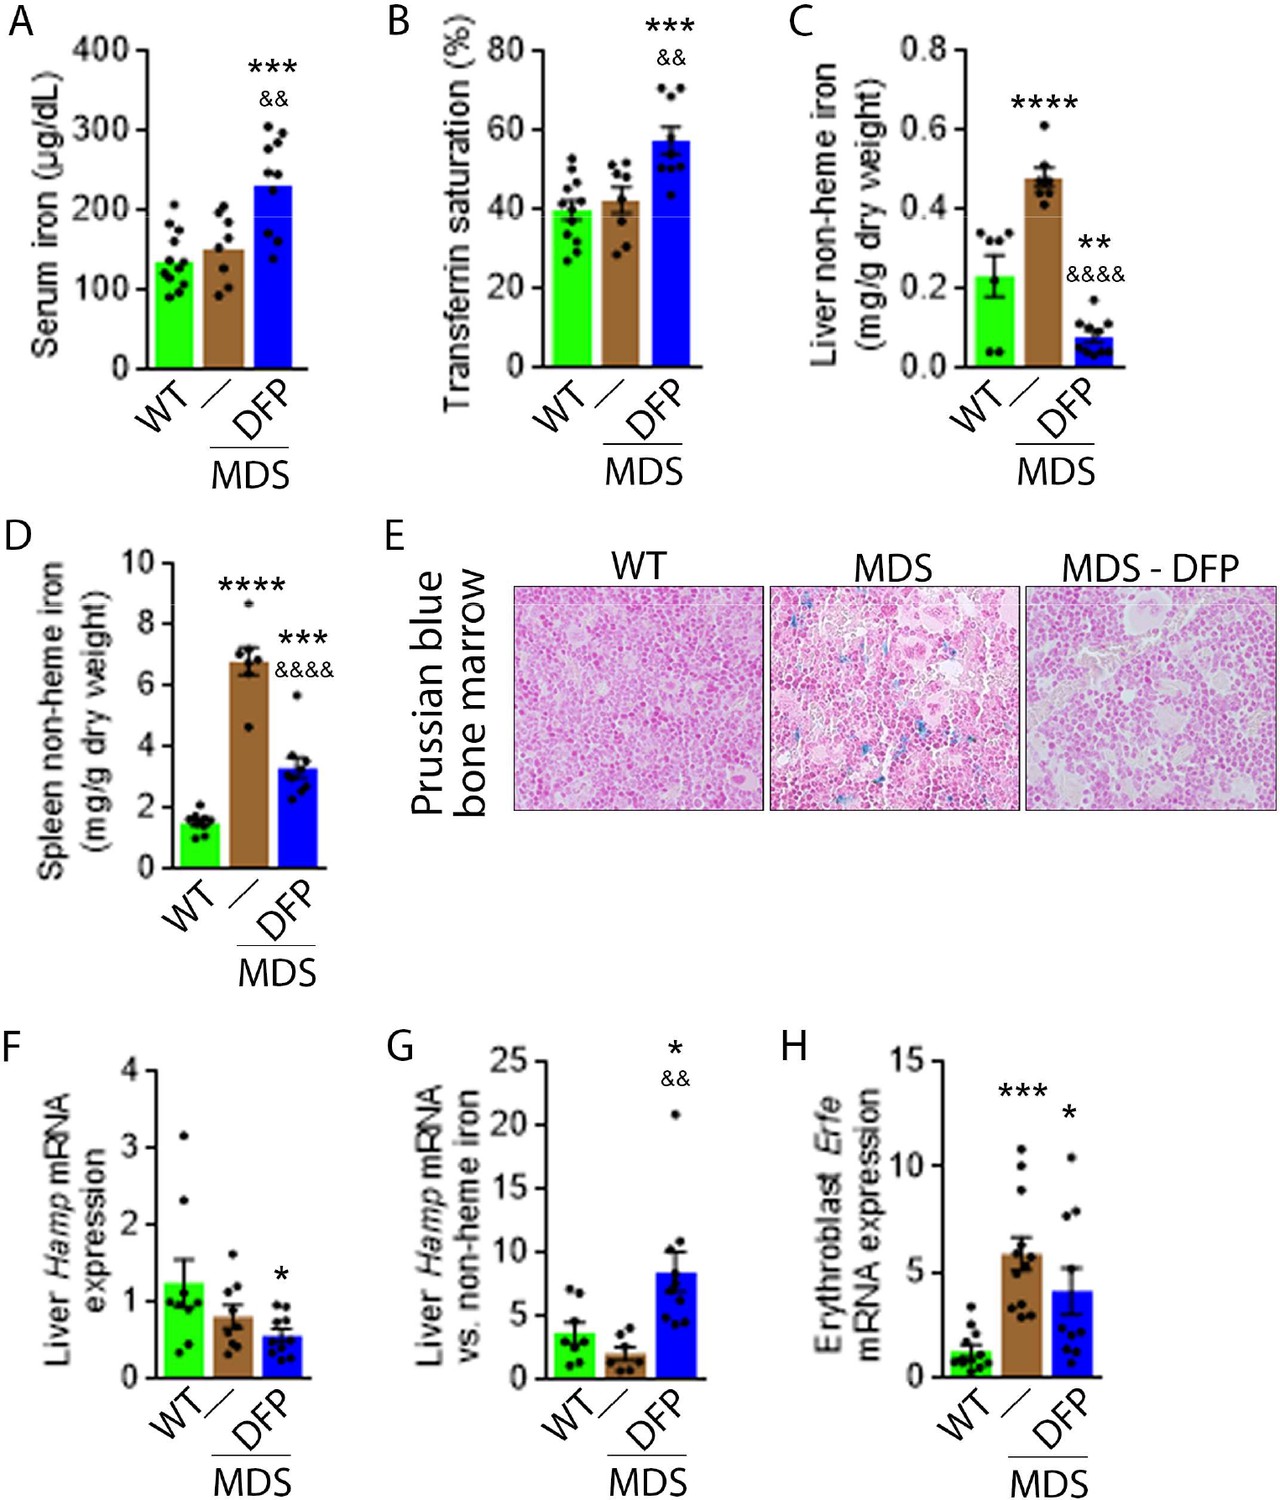
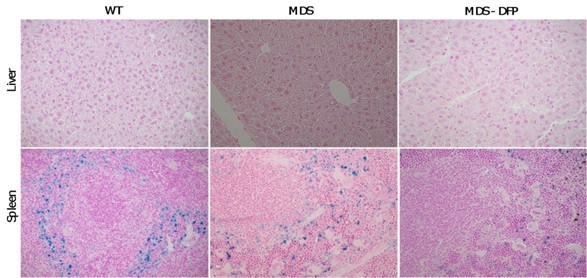
DFP reverses parenchymal iron overload and restores hepcidin iron responsiveness in MDS mice.
DFP results in increased serum iron (A) and transferrin saturation (B) while reducing parenchymal iron in the liver, spleen, and bone marrow (C-E). While liver Hamp mRNA expression is unchanged in WT, MDS, and DFP-treated MDS mice (F), Hamp responsiveness to iron is normalized in DFP-treated MDS mice (G) (n=7–10 mice/group). (H) DFP results in more normal Erfe mRNA expression (n=10–12 mice/group) in sorted bone marrow erythroblasts from MDS mice analyzed after 1 month of treatment. *p<0.05 vs. WT; **p<0.01 vs. WT; ***p<0.001 vs. WT; ****p<0.0001 vs. WT; &p<0.05 vs. MDS; &&p<0.01 vs. MDS; &&&&p<0.0001 vs. MDS; Abbreviations: WT = wild type; MDS = myelodysplastic syndrome; DFP = deferiprone; Hamp = hepcidin; Erfe = erythroferrone.
-
Figure 1—source data 1
Source data for iron-related parameters in wild type (WT), myelodysplastic syndrome (MDS), and DFP-treated MDS mice.
- https://cdn.elifesciences.org/articles/83103/elife-83103-fig1-data1-v1.xlsx
Figure 1—figure supplement 1

Erythroblast apoptosis in MDS mice.
Bone marrow erythroblasts were isolated using flow gating strategy and apoptosis was measured using activated caspase 3/7. Erythroblast apoptosis is elevated in ProE, BasoE, PolyE, and OrthoE from MDS mice (n=9–11 mice/group). *p<0.05 vs. WT; **p<0.01 vs. WT; WT = wild type; MDS = myelodysplastic syndrome; ProE = pro-erythroblasts; BasoE = basophilic erythroblasts; PolyE = polychromatophilic erythroblasts; OrthoE = orthochromatophilic erythroblasts; Act casp 3/7=activated caspase 3 and 7.
-
Figure 1—figure supplement 1—source data 1
Source data for flow analysis of apoptosis measured by activated caspase 3/7 in bone marrow erythroblasts from wild type (WT) and myelodysplastic syndrome (MDS) mice.
- https://cdn.elifesciences.org/articles/83103/elife-83103-fig1-figsupp1-data1-v1.xlsx
Figure 1—figure supplement 2

Quantification of serum DFP concentration in DFP-treated WT and MDS mice.
Serum DFP concentration is measurable in DFP-treated MDS mice. (n=3–5 mice/group). WT = wild type; MDS = myelodysplastic syndrome; DFP = deferiprone.
-
Figure 1—figure supplement 2—source data 1
Source data for serum deferiprone (DFP) concentration in DFP-treated wild type (WT) and myelodysplastic syndrome (MDS) mice.
- https://cdn.elifesciences.org/articles/83103/elife-83103-fig1-figsupp2-data1-v1.xlsx
Figure 1—figure supplement 3

DFP resulted in similar effects on transferrin saturation in male and female MDS mice.
Similarly elevated transferrin is observed in male and female DFP-treated MDS mice (n=3–4 male mice/group and n=4–6 female mice/group). *p<0.05 vs. control; Con = control; DFP = deferiprone; sat = saturation.
-
Figure 1—figure supplement 3—source data 1
Source data for transferrin saturation in male and female myelodysplastic syndrome (MDS) and DFP-treated MDS mice.
- https://cdn.elifesciences.org/articles/83103/elife-83103-fig1-figsupp3-data1-v1.xlsx
Figure 1—figure supplement 4
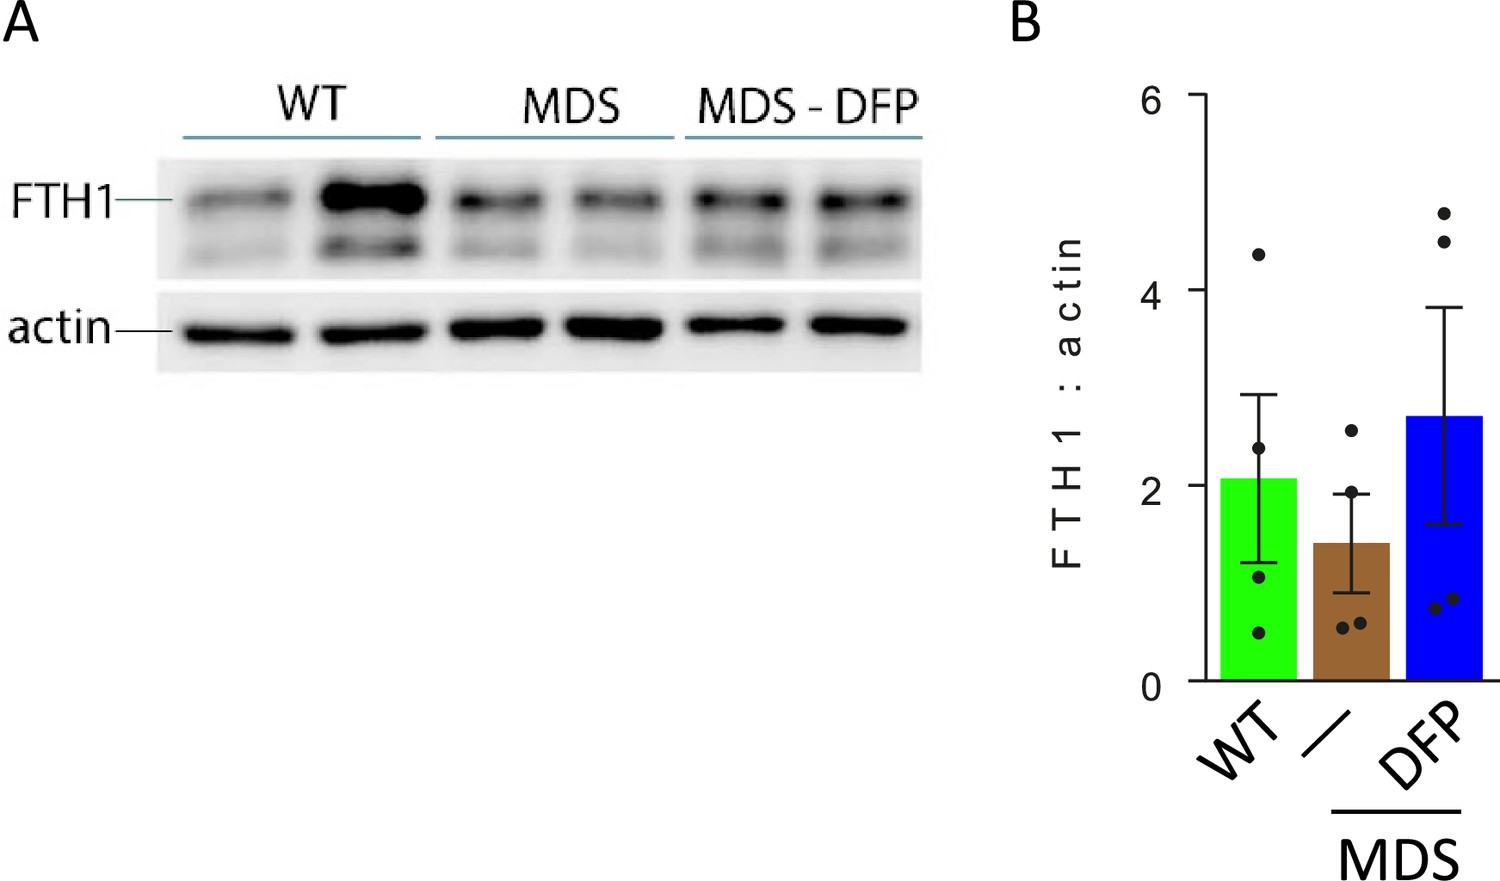
Bone marrow erythroblast ferritin is increased in DFP-treated MDS mice.
(A) Western blot of bone marrow CD45 negative cell protein extracts demonstrate no difference in FTH1 between WT, MDS, and DFP-treated MDS mice; the gel is quantified in (B) (n=2 mice/group, experiments repeated twice). WT = wild type; MDS = myelodysplastic syndrome; DFP = deferiprone; FTH1 = ferritin heavy chain. &p<0.05 vs. MDS.
-
Figure 1—figure supplement 4—source data 1
Western blots with ferritin H antibody staining relative to actin in bone marrow erythroblast enriched CD45 negative cells from wild type (WT), myelodysplastic syndrome (MDS), and DFP-treated MDS mice.
- https://cdn.elifesciences.org/articles/83103/elife-83103-fig1-figsupp4-data1-v1.zip
-
Figure 1—figure supplement 4—source data 2
Source data for quantification of ferritin heavy chain (FTH1) protein concentration relative to actin in bone marrow erythroblast enriched CD45 negative cells from wild type (WT), myelodysplastic syndrome (MDS), and DFP-treated MDS mice.
- https://cdn.elifesciences.org/articles/83103/elife-83103-fig1-figsupp4-data2-v1.xlsx
Figure 1—figure supplement 5
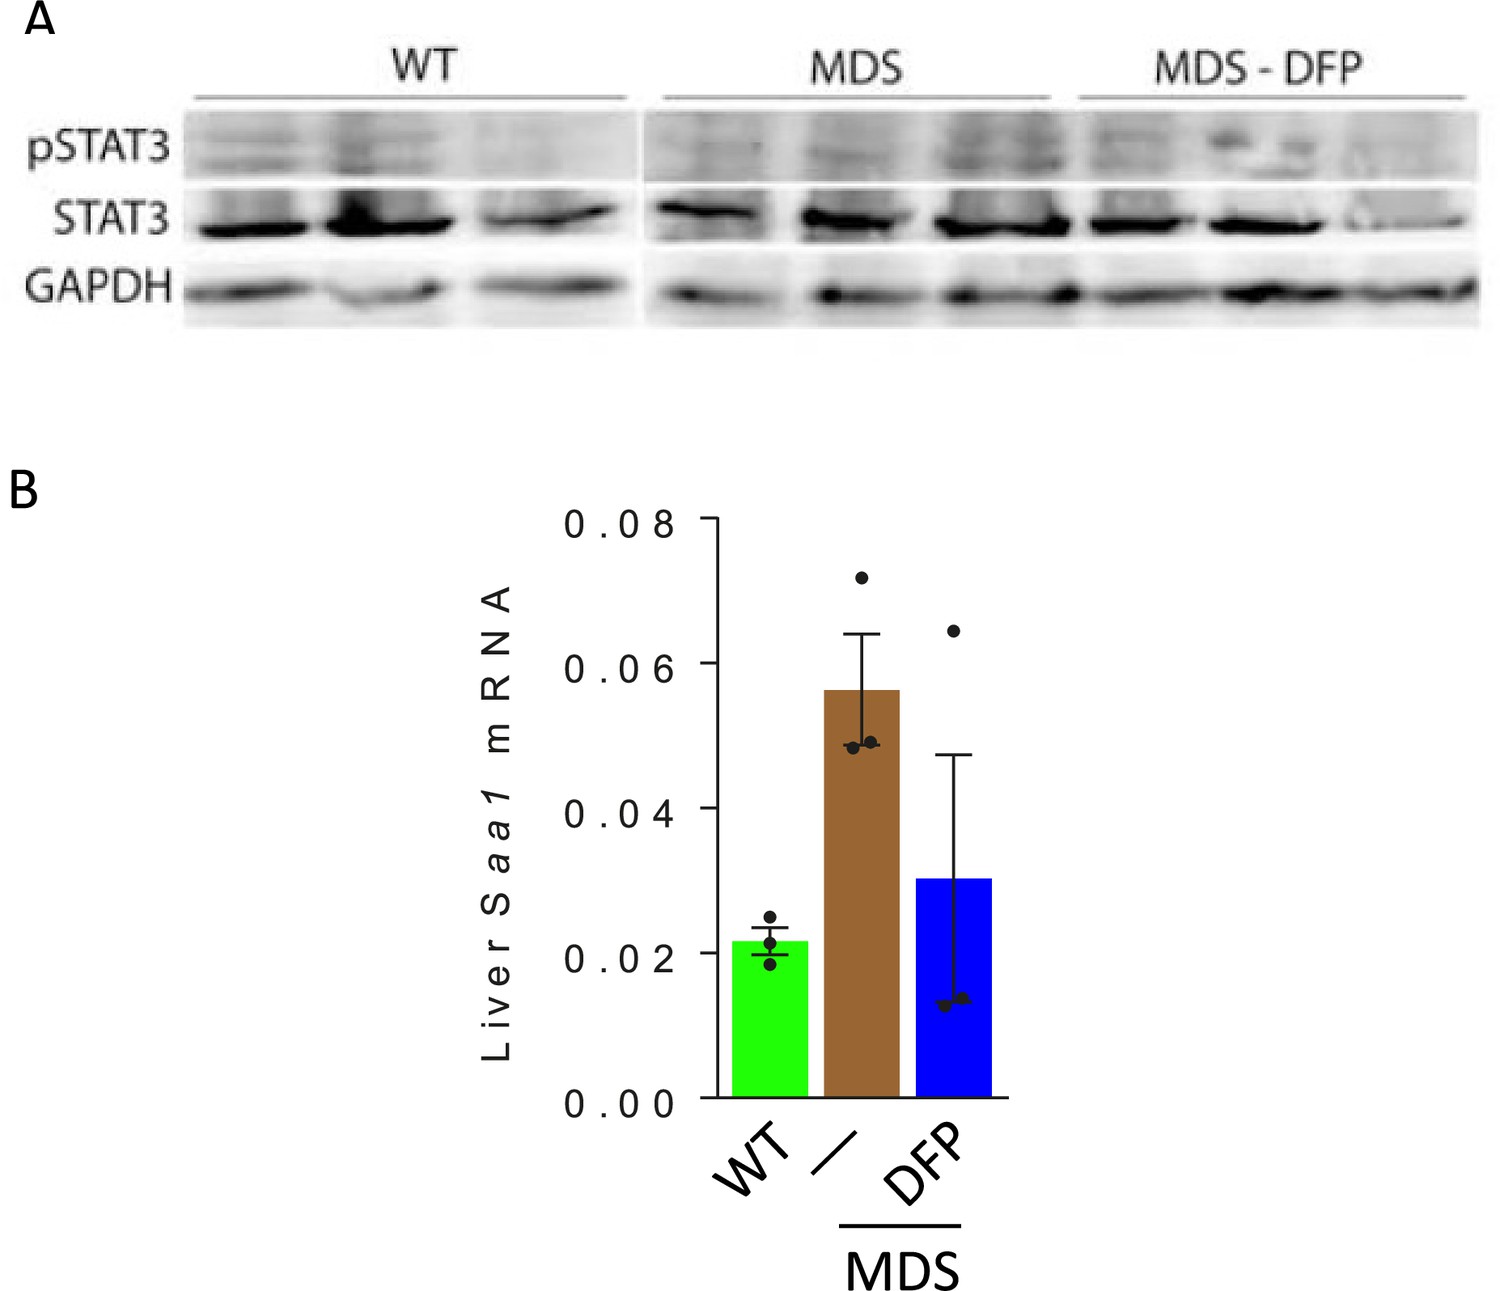
Effects of DFP on the liver STAT3 expression in MDS mice.
Western blot of liver protein extracts demonstrate no obvious differences in STAT3 signaling (A), and no differences in Saa1 mRNA expression (B), demonstrating no change in the inflammatory signaling pathway to hepcidin expression between WT, MDS, and DFP-treated MDS mice (n=3 mice/group). WT = wild type; MDS = myelodysplastic syndrome; DFP = deferiprone; pSTAT3=phosphorylated signal transducer and activator of transcription 3; GAPDH = glyceraldehyde 3-phosphate dehydrogenase; Saa1 = serum amyloid A1.
-
Figure 1—figure supplement 5—source data 1
Western blots with STAT3 and pSTAT3 antibody staining relative to GAPDH in liver from wild type (WT), myelodysplastic syndrome (MDS), and DFP-treated MDS mice.
- https://cdn.elifesciences.org/articles/83103/elife-83103-fig1-figsupp5-data1-v1.zip
-
Figure 1—figure supplement 5—source data 2
Source data for Saa1 in liver from wild type (WT), myelodysplastic syndrome (MDS), and DFP-treated MDS mice.
- https://cdn.elifesciences.org/articles/83103/elife-83103-fig1-figsupp5-data2-v1.xlsx
Figure 1—figure supplement 6

Effect of DFP on erythroblast Erfe expression in WT mice.
Sorted bone marrow erythroblast Erfe mRNA expression between WT and DFP-treated WT mice (n=5–12 mice/group). *p<0.05 vs. WT DFP; WT = wild type; DFP = deferiprone; Erfe = erythroferrone.
-
Figure 1—figure supplement 6—source data 1
Source data for erythroferrone (Erfe) in sorted bone marrow erythroblasts from wild type (WT) and DFP-treated WT mice.
- https://cdn.elifesciences.org/articles/83103/elife-83103-fig1-figsupp6-data1-v1.xlsx
Figure 2 with 1 supplement
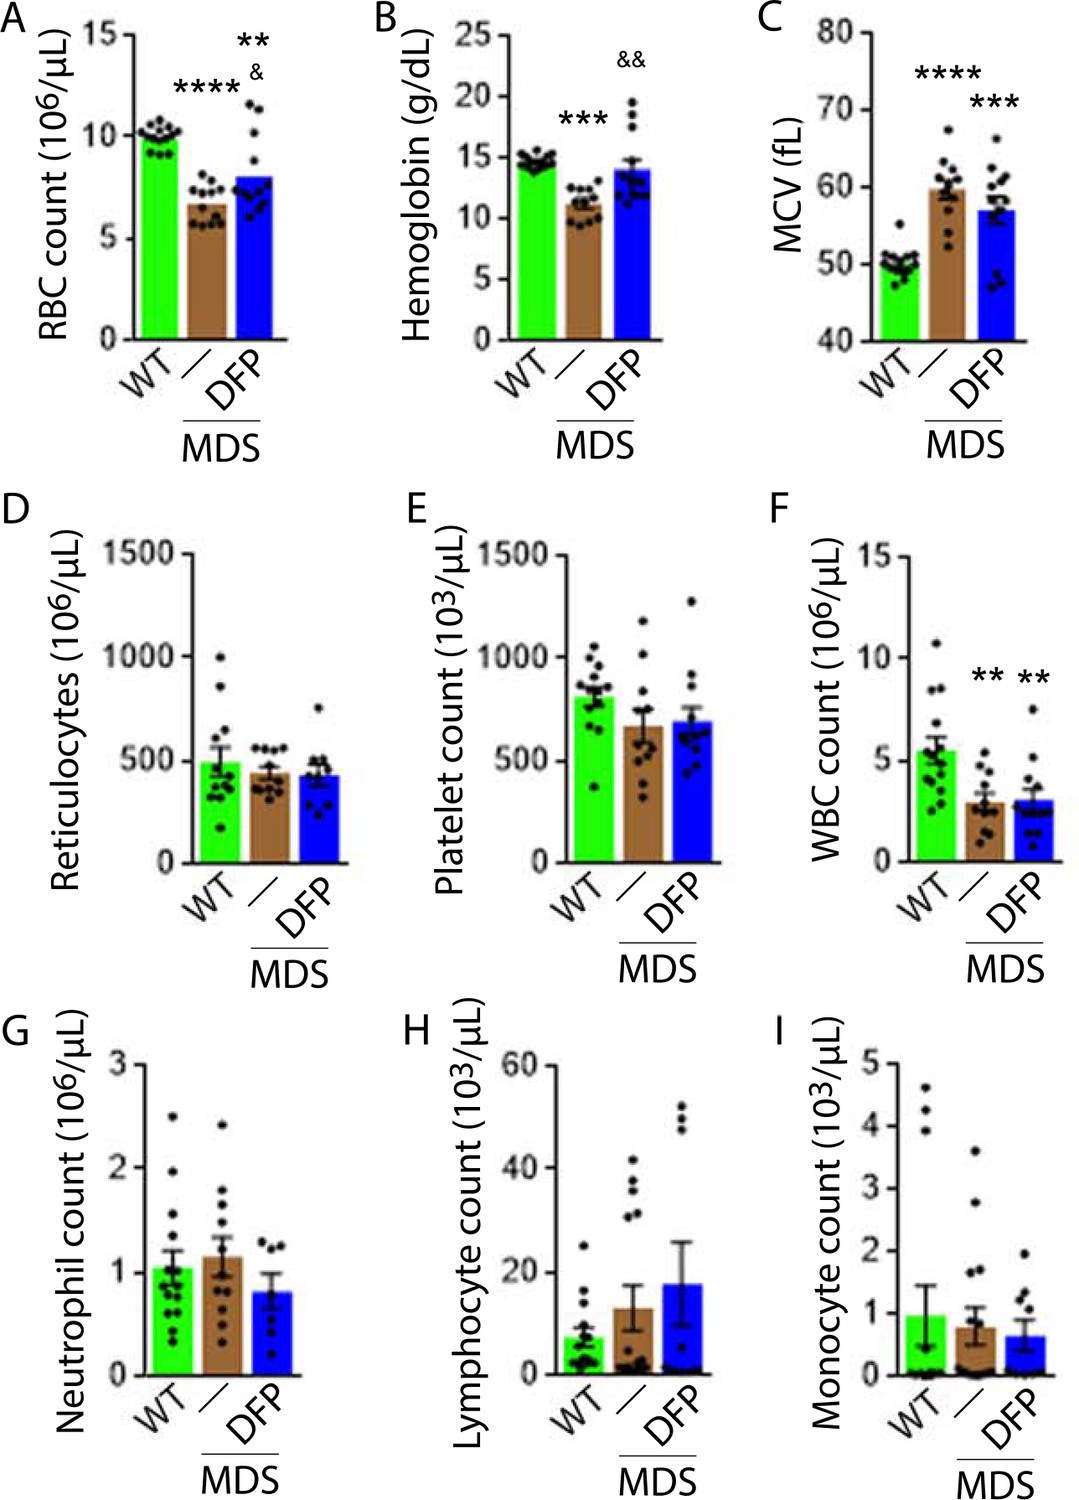
Elevated MCV anemia in MDS mice is partially reversed by DFP.
Circulating RBC count (A), hemoglobin (B), MCV (C), reticulocyte count (D), platelet count (E), WBC count (F), neutrophil count (G), lymphocyte count (H), and monocyte count (i) in WT, MDS, and DFP-treated MDS mice (n=10–14 mice/group) analyzed after 1 month of treatment. *p<0.05 vs. WT; **p<0.01 vs. WT; ***p<0.001 vs. WT; ****p<0.0001 vs. WT; &p<0.05 vs. MDS; &&p<0.01 vs. MDS. Abbreviations: WT = wild type; MDS = myelodysplastic syndrome; DFP = deferiprone; RBC = red blood cell; MCV = mean corpuscular volume; WBC = white blood cell.
-
Figure 2—source data 1
Source data for circulating cell counts and other parameters in wild type (WT), myelodysplastic syndrome (MDS), and DFP-treated MDS mice.
- https://cdn.elifesciences.org/articles/83103/elife-83103-fig2-data1-v1.xlsx
Figure 2—figure supplement 1

DFP resulted in similar effects on hemoglobin in male and female myelodysplastic syndrome (MDS) mice.
Similarly elevated hemoglobin is observed in male and female DFP-treated MDS mice (n=4–6 male mice/group and n=4–9 female mice/group). *p<0.05 vs. control; Con = control; DFP = deferiprone.
-
Figure 2—figure supplement 1—source data 1
Source data for hemoglobin in male and female myelodysplastic syndrome (MDS) and DFP-treated MDS mice.
- https://cdn.elifesciences.org/articles/83103/elife-83103-fig2-figsupp1-data1-v1.xlsx
Figure 3 with 6 supplements
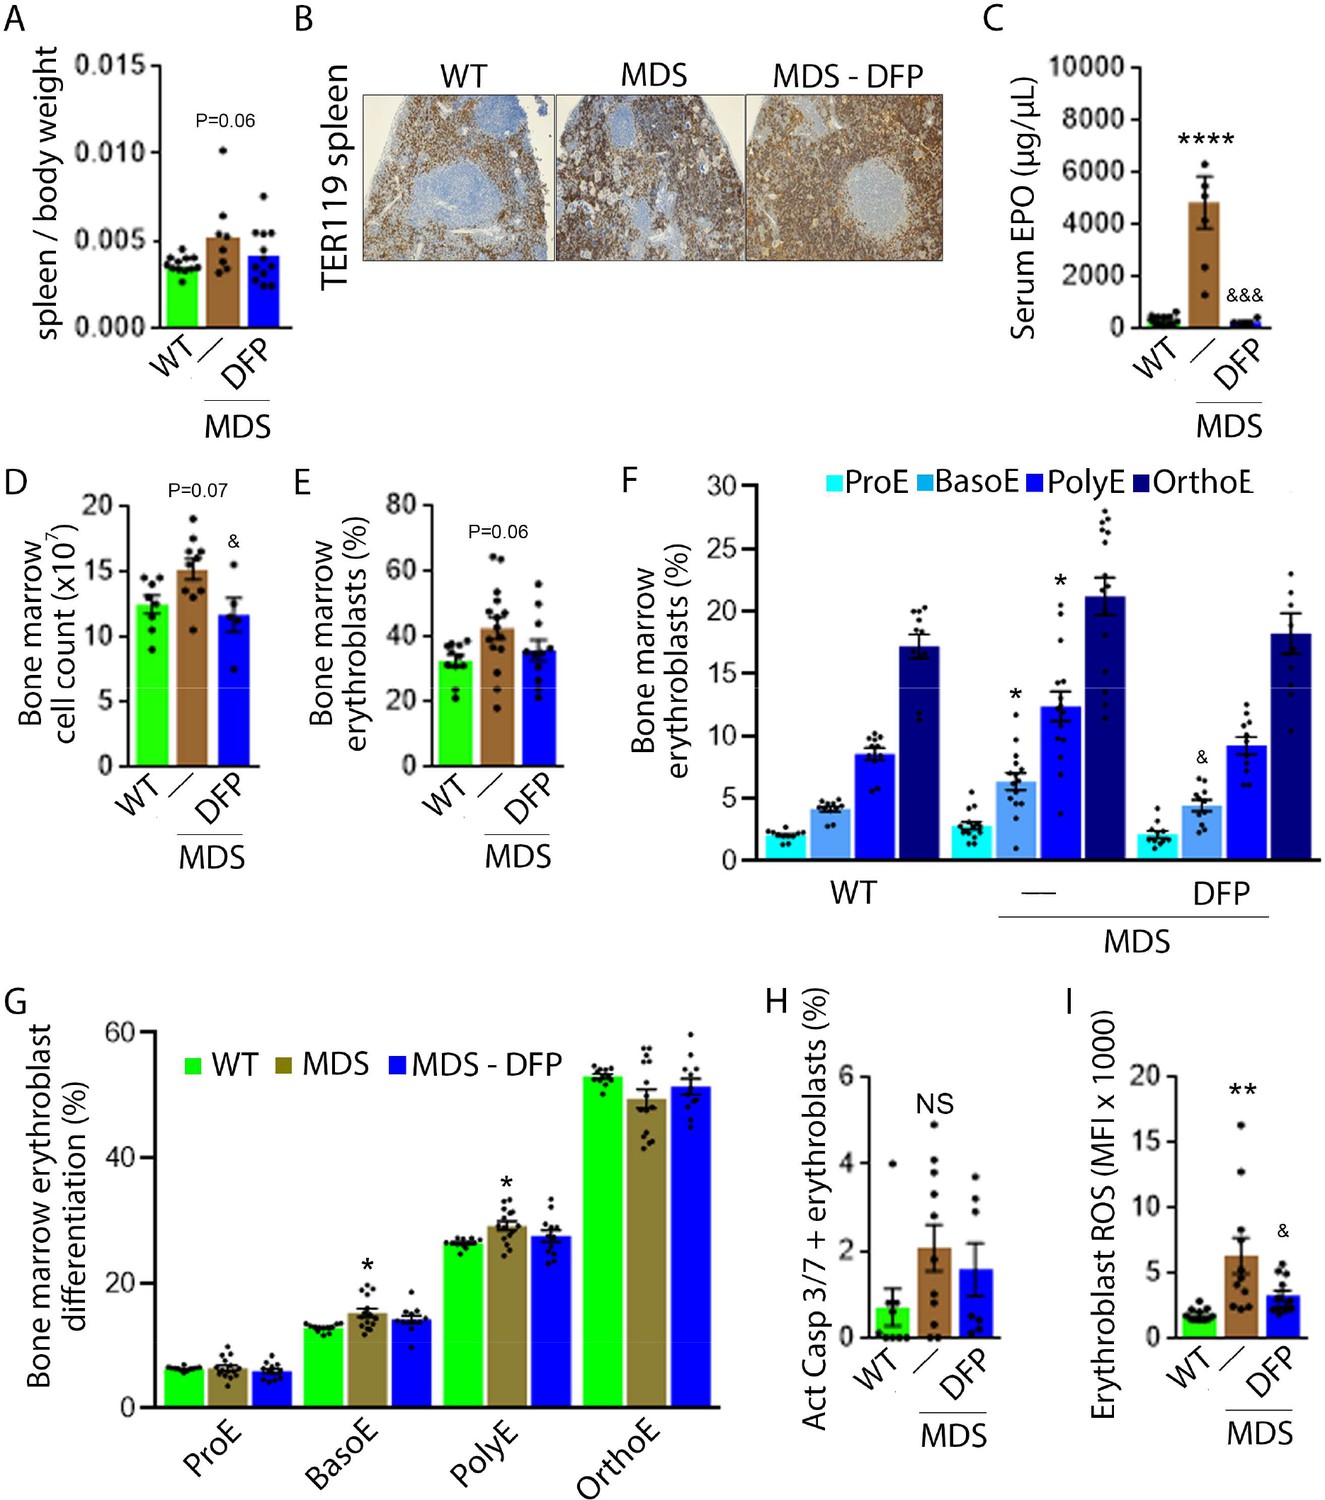
Expanded and ineffective erythropoiesis in MDS mice is partially reversed by DFP.
Spleen weight (n=11–12 mice/group) (A), splenic architecture (n=5 mice/group) (B), serum EPO concentration (n=5–12 mice/group) (C), bone marrow erythroblast count (n=13–15 mice/group) (D), and the total fraction of erythroblasts in the bone marrow (n=13–15 mice/group) (E) are more normal in DFP-treated MDS mice analyzed after 1 month of treatment. The fraction of all stages of terminal erythropoiesis is increased in MDS relative to WT mice in BasoE and PolyE stages and decreased in DFP-treated relative to untreated MDS mice in BasoE stages (n=13–15 mice/group) (F). Erythroblast differentiation in the bone marrow, decreased in MDS relative to WT, is normalized in DFP-treated relative to untreated MDS mice (n=13–15 mice/group) (G). In addition, erythroblast apoptosis, as measured by activated caspase 3/7, is unchanged in DFP-treated MDS mice (n=7–11 mice/group) (H). Finally, erythroblast ROS is decreased in DFP-treated relative to untreated MDS mice (n=11–12 mice/group) (i) analyzed after 1 month of treatment. *p<0.05 vs. WT; **p<0.01 vs. WT; ****p<0.0001 vs. WT; &p<0.05 vs. MDS; &&&p<0.001 vs. MDS; Abbreviations: WT = wild type; MDS = myelodysplastic syndrome; DFP = deferiprone; EPO = erythropoietin; Act casp 3/7 = activated caspase 3 and 7; ROS = reactive oxygen species; ProE = pro-erythroblasts; BasoE = basophilic erythroblasts; PolyE = polychromatophilic erythroblasts; OrthoE = orthochromatophilic erythroblasts; NS = not significant.
-
Figure 3—source data 1
Source data for erythropoiesis-related parameters in serum, bone marrow, and spleen from wild type (WT), myelodysplastic syndrome (MDS), and DFP-treated MDS mice.
- https://cdn.elifesciences.org/articles/83103/elife-83103-fig3-data1-v1.xlsx
Figure 3—figure supplement 1

DFP resulted in similar effects on erythropoiesis in male and female myelodysplastic syndrome (MDS) mice.
Bone marrow erythroblasts are decreased to a similar degree in male and female DFP-treated MDS mice (n=4–7 male mice/group and n=8–9 female mice/group). *p<0.05 vs. control; Con = control; DFP = deferiprone.
-
Figure 3—figure supplement 1—source data 1
Source data for bone marrow erythroblasts in male and female myelodysplastic syndrome (MDS) and DFP-treated MDS mice.
- https://cdn.elifesciences.org/articles/83103/elife-83103-fig3-figsupp1-data1-v1.xlsx
Figure 3—figure supplement 2

DFP has no effect on circulating red blood cell parameters and serum erythropoietin in WT mice.
No differences are observed in RBC count (A), hemoglobin (B), MCV (C), reticulocytes (D), or serum EPO concentration (E) from DFP-treated relative to untreated WT mice (n=5–14 mice/group). WT = wild type; DFP = deferiprone; RBC = red blood cell; MCV = mean corpuscular volume; EPO = erythropoietin.
-
Figure 3—figure supplement 2—source data 1
Source data for circulating red blood cell parameters and serum erythropoietin from wild type (WT) and DFP-treated WT mice.
- https://cdn.elifesciences.org/articles/83103/elife-83103-fig3-figsupp2-data1-v1.xlsx
Figure 3—figure supplement 3
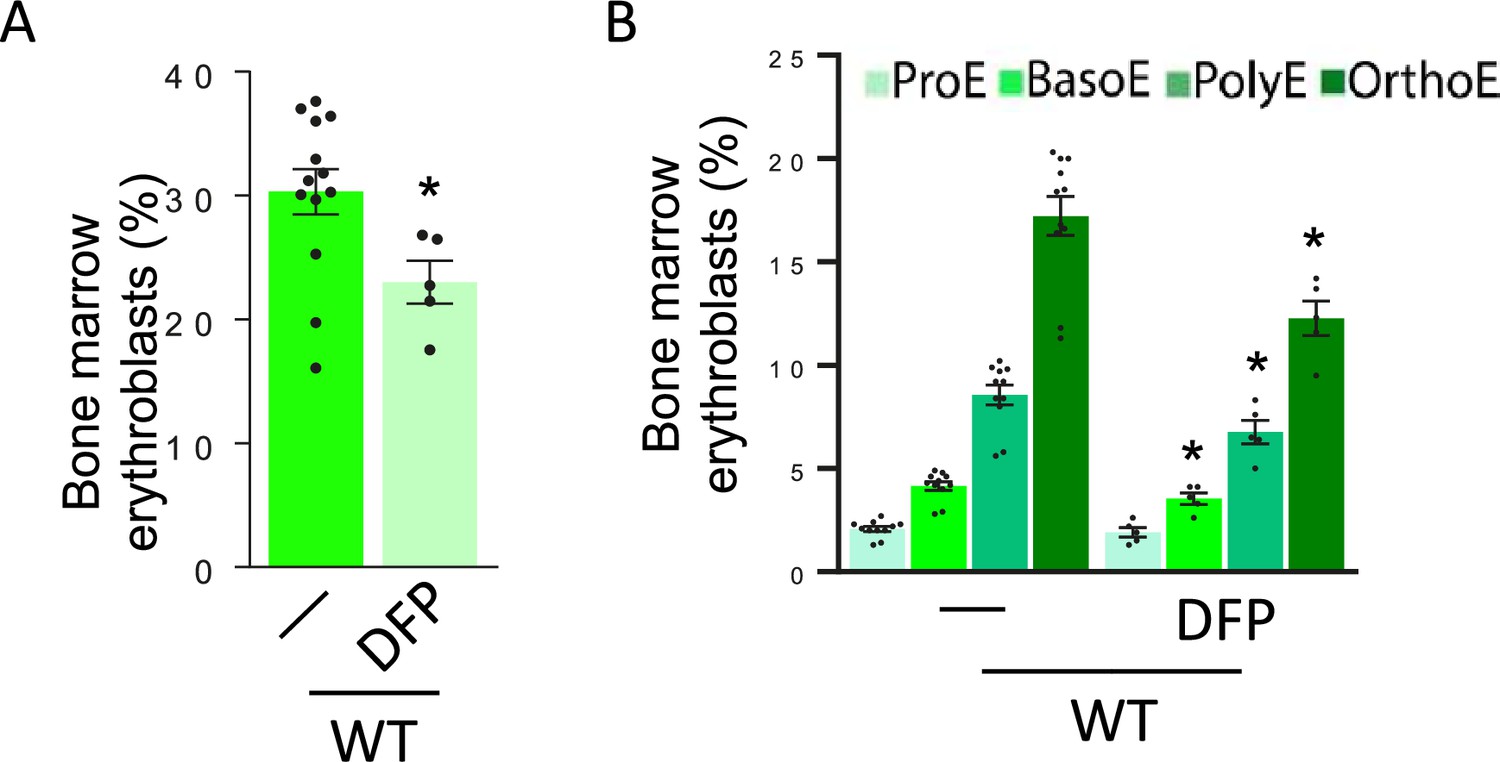
Effect of DFP on erythropoiesis in WT mice.
Bone marrow erythroblast fraction (n=5–13 mice/group) significantly decreased (A) particularly as a consequence of fewer BasoE, PolyE, and OrthoE (B) in DFP-treated WT mice (n=5–11 mice/group). *p<0.05 vs. WT; WT = wild type; DFP = deferiprone; ProE = pro-erythroblasts; BasoE = basophilic erythroblasts; PolyE = polychromatophilic erythroblasts; OrthoE = orthochromatophilic erythroblasts.
-
Figure 3—figure supplement 3—source data 1
Source data for total bone marrow erythroblasts from wild type (WT) and DFP-treated WT mice.
- https://cdn.elifesciences.org/articles/83103/elife-83103-fig3-figsupp3-data1-v1.xlsx
-
Figure 3—figure supplement 3—source data 2
Source data for bone marrow ProE, BasoE, PolyE, and OrthoE erythroblasts from wild type (WT) and DFP-treated WT mice.
- https://cdn.elifesciences.org/articles/83103/elife-83103-fig3-figsupp3-data2-v1.xlsx
Figure 3—figure supplement 4

DFP has no effect on erythroblast apoptosis and reactive oxygen species in WT mice.
Erythroblast apoptosis, as measured by activated caspase 3 and 7 (n=6–9 mice/group) (A), and ROS (B) are unchanged in DFP-treated relative to untreated WT mice (n=5–9 mice/group). WT = wild type; DFP = deferiprone; Act casp 3/7 = activated caspase 3 and 7; ROS = reactive oxygen species.
-
Figure 3—figure supplement 4—source data 1
Source data for bone marrow erythroblast apoptosis as measured by activated caspase 3/7 and ROS from wild type (WT) and DFP-treated WT mice.
- https://cdn.elifesciences.org/articles/83103/elife-83103-fig3-figsupp4-data1-v1.xlsx
Figure 3—figure supplement 5

Quantification of serum DFP-glucuronide concentration in DFP-treated WT and MDS mice.
Serum concentration of DFP and of its metabolite, DFP-G, is significantly lower in DFP-treated MDS relative to DFP-treated WT mice (n=5 mice/group). *p<0.05 vs. WT DFP; &&p<0.01 vs. WT DFP-G; WT = wild type; MDS = myelodysplastic syndrome; DFP = deferiprone; DFP-G = DFP-glucuronide.
-
Figure 3—figure supplement 5—source data 1
Source data for serum DFP and G-DFP concentrations from DFP-treated wild type (WT) and MDS mice.
- https://cdn.elifesciences.org/articles/83103/elife-83103-fig3-figsupp5-data1-v1.xlsx
Figure 3—figure supplement 6

Gating strategy for delineating erythroblasts in mouse bone marrow.
Mouse bone marrow is flushed from the femur, processed to remove debris, and filtered to collect CD45 negative flow-through cells. (A) After staining with all required antibodies, CD45-/CD11b-/Gr1- cells are gated (red) and further evaluated using TER119 and side scatter (SSC) to select all TER119 + erythroid lineage cells (red). These cells are then analyzed using forward scatter (FSC) and CD44 to gate pro-erythroblasts (ProE), basophilic erythroblasts (BasoE), polychromatophilic erythroblasts (PolyE), and orthochromatophilic erythroblasts (OrthoE) as progressive stages of terminal erythropoiesis and exclude reticulocytes and enucleated erythrocytes (blue). (B) Terminal erythropoiesis in the bone marrow is evaluated in a homogeneous manner using this gating strategy in WT, MDS, and DFP-treated MDS mice. WT = wild type; MDS = myelodysplastic syndrome; DFP = deferiprone.
Figure 4 with 2 supplements
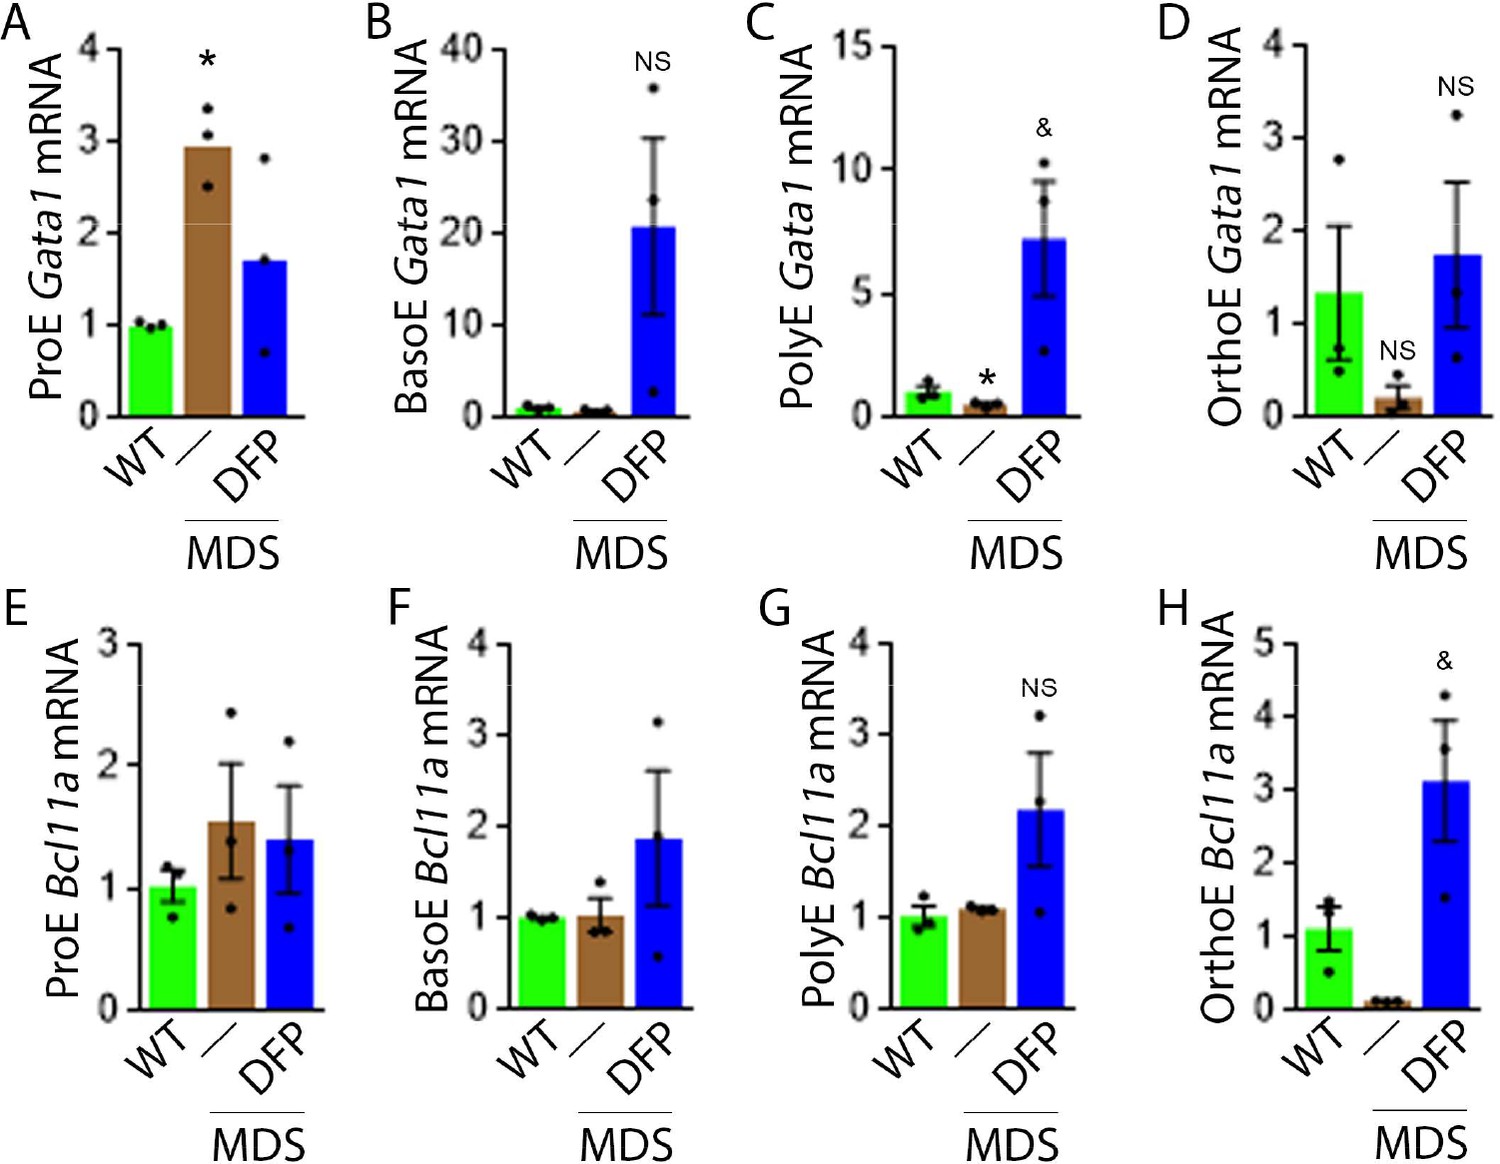
DFP leads to normalized gene expression downstream of EPO in MDS erythroblasts.
Gata1 mRNA expression is increased in sorted bone marrow ProE (A), unchanged in BasoE (B), and significantly decreased in PolyE (C) erythroblasts from MDS relative to WT mice; DFP treatment restores Gata1 mRNA expression relative to untreated MDS or WT mice in all including OrthoE (D) erythroblasts (n=15–21 mice/group). DFP treatment in MDS mice does not affect Bcl11a mRNA expression in sorted bone marrow ProE (E), BasoE (F), and PolyE (G), and increases it in OrthoE (H) erythroblasts relative to untreated MDS or WT mice (n=10–12 mice/group). *p<0.05 vs. WT; &p<0.05 vs. MDS; Abbreviations: WT = wild type; MDS = myelodysplastic syndrome; DFP = deferiprone; Gata1 = erythroid transcription factor; Bcl11a B cell lymphoma 11 a; ProE = pro-erythroblasts; BasoE = basophilic erythroblasts; PolyE = polychromatophilic erythroblasts; OrthoE = orthochromatophilic erythroblasts; NS = not significant.
-
Figure 4—source data 1
Source data for gene expression downstream of erythropoietin (EPO) in sorted bone marrow erythroblasts from wild type (WT), myelodysplastic syndrome (MDS), and DFP-treated MDS mice.
- https://cdn.elifesciences.org/articles/83103/elife-83103-fig4-data1-v1.xlsx
Figure 4—figure supplement 1

Effect of DFP on erythroblast Bcl11a expression in WT mice.
Sorted bone marrow erythroblast Bcl11a mRNA expression between WT and DFP-treated WT mice (n=5–12 mice/group). *p<0.05 vs. WT DFP; WT = wild type; DFP = deferiprone; Bcl11a = B cell lymphoma 11 a, gene name for Bcl-XL.
-
Figure 4—figure supplement 1—source data 1
Source data for B cell lymphoma (Bcl11a) in sorted bone marrow erythroblasts from wild type (WT) and DFP-treated WT mice.
- https://cdn.elifesciences.org/articles/83103/elife-83103-fig4-figsupp1-data1-v1.xlsx
Figure 4—figure supplement 2

Nuances of signaling downstream of erythropoietin (EPO) in bone marrow erythroblasts from MDS and DFP-treated MDS mice.
(A) Western blot of bone marrow CD45 negative cell protein extracts demonstrate no differences in STAT5 signaling between untreated and DFP-treated MDS mice, quantified in (B). Similarly, AKT signaling is not altered in DFP-treated MDS mice, quantified in (C), demonstrating no change in these signaling pathways in response to DFP in MDS mice (n=3 mice/group). MDS = myelodysplastic syndrome; DFP = deferiprone; pSTAT5=phosphorylated signal transducer and activator of transcription 5; pAKT = phosphorylated protein kinase B.
-
Figure 4—figure supplement 2—source data 1
Western blots with pSTAT5, STAT5, pAKT, and AKT antibody staining relative to actin in bone marrow erythroblast-enriched CD45 negative cells from myelodysplastic syndrome (MDS) and DFP-treated MDS mice.
- https://cdn.elifesciences.org/articles/83103/elife-83103-fig4-figsupp2-data1-v1.zip
-
Figure 4—figure supplement 2—source data 2
Source data for quantification of signaling via STAT5 and AKT in bone marrow erythroblast-enriched CD45 negative cells from myelodysplastic syndrome (MDS) and DFP-treated MDS mice.
- https://cdn.elifesciences.org/articles/83103/elife-83103-fig4-figsupp2-data2-v1.xlsx
Figure 5 with 2 supplements
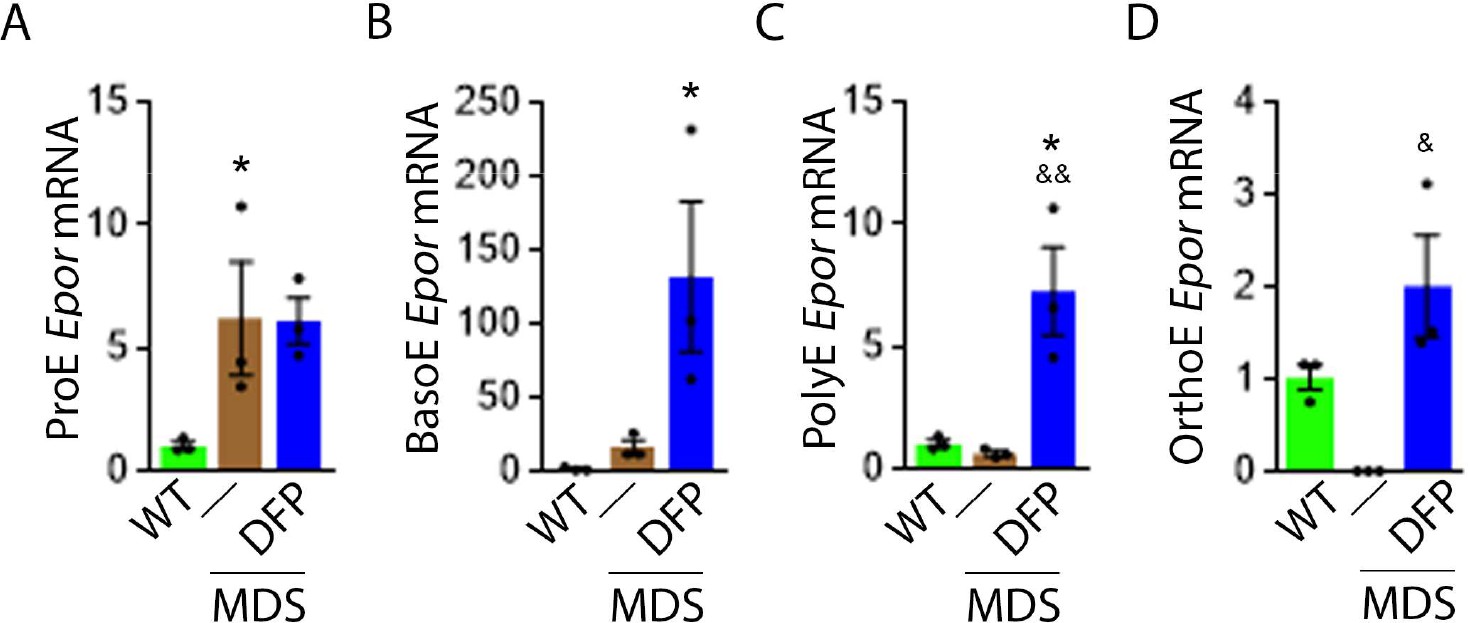
DFP increases Epor expression in MDS erythroblasts.
DFP treatment in MDS mice increases Epor mRNA expression in sorted bone marrow following ProE (A), namely in BasoE (B), PolyE (C), and OrthoE (D) erythroblasts relative to untreated MDS or WT mice. *p<0.05 vs. WT; &p<0.05 vs. MDS; &&p<0.01 vs. MDS. Abbreviations: WT = wild type; MDS = myelodysplastic syndrome; DFP = deferiprone; Epor = erythropoietin receptor; ProE = pro-erythroblasts; BasoE = basophilic erythroblasts; PolyE = polychromatophilic erythroblasts; OrthoE = orthochromatophilic erythroblasts.
-
Figure 5—source data 1
Source data for erythropoietin receptor (Epor) in sorted bone marrow erythroblasts from wild type (WT), myelodysplastic syndrome (MDS), and DFP-treated MDS mice.
- https://cdn.elifesciences.org/articles/83103/elife-83103-fig5-data1-v1.xlsx
Figure 5—figure supplement 1

Effect of DFP on erythroblast Epor expression in WT mice.
Sorted bone marrow erythroblast Epor mRNA expression between WT and DFP-treated WT mice (n=5–10 mice/group). *<0.05 vs. WT DFP; WT = wild type; DFP = deferiprone; Epor = erythropoietin receptor.
-
Figure 5—figure supplement 1—source data 1
Source data for erythropoietin receptor (Epor) in sorted bone marrow erythroblasts from wild type (WT) and DFP-treated WT mice.
- https://cdn.elifesciences.org/articles/83103/elife-83103-fig5-figsupp1-data1-v1.xlsx
Figure 5—figure supplement 2
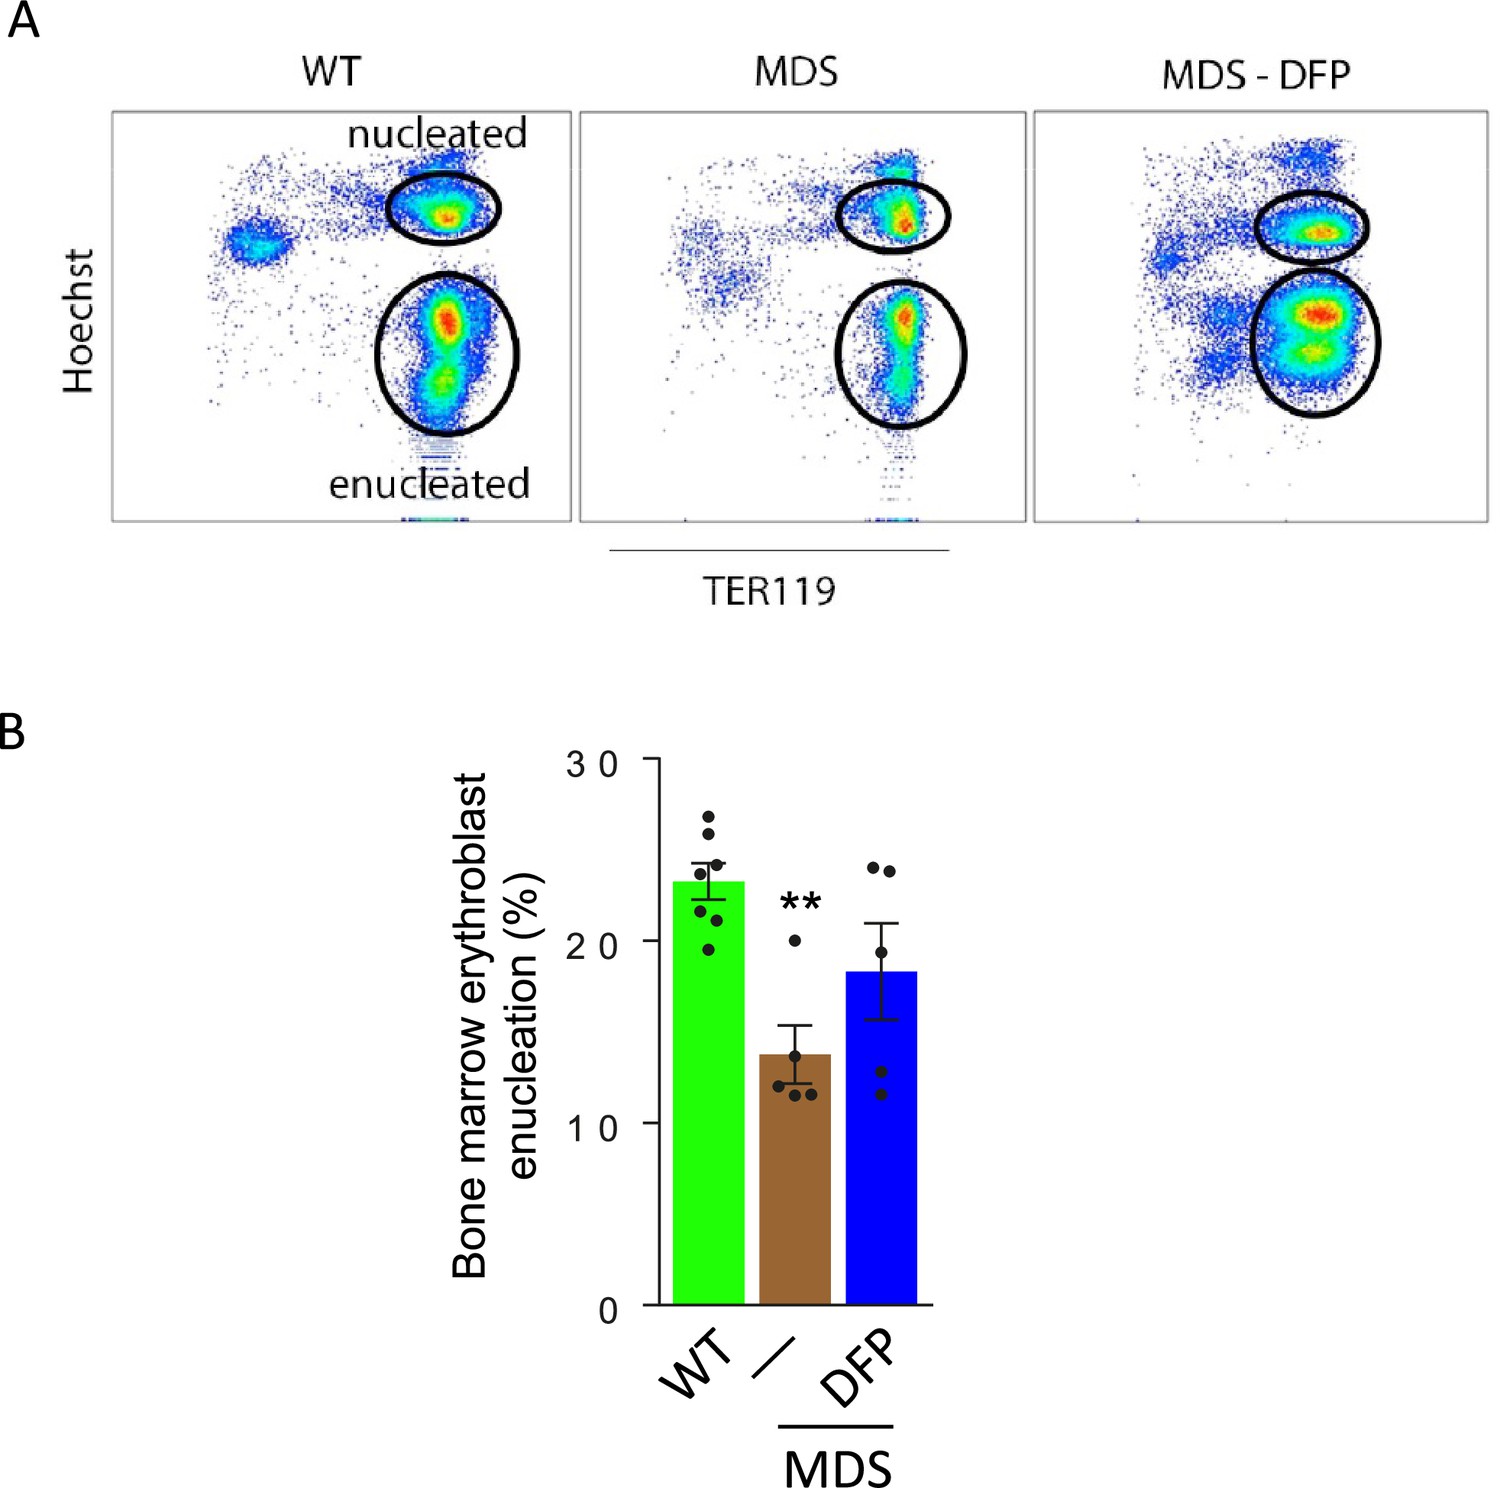
Defective enucleation in MDS erythroblasts is normalized by DFP.
(A) DFP restores erythroblast enucleation (n=5–7 mice/group) in MDS mouse bone marrow, quantified in (B) as the fraction of enucleated relative to the total of nucleated and enucleated erythroblasts, using Hoechst staining in TER119 positive cells. **p<0.01 vs. WT; Abbreviations: WT = wild type; MDS = myelodysplastic syndrome; DFP = deferiprone.
-
Figure 5—figure supplement 2—source data 1
Source data for flow analysis of enucleation in erythroblasts from wild type (WT), myelodysplastic syndrome (MDS), and DFP-treated MDS mice.
- https://cdn.elifesciences.org/articles/83103/elife-83103-fig5-figsupp2-data1-v1.xlsx
Figure 6 with 2 supplements
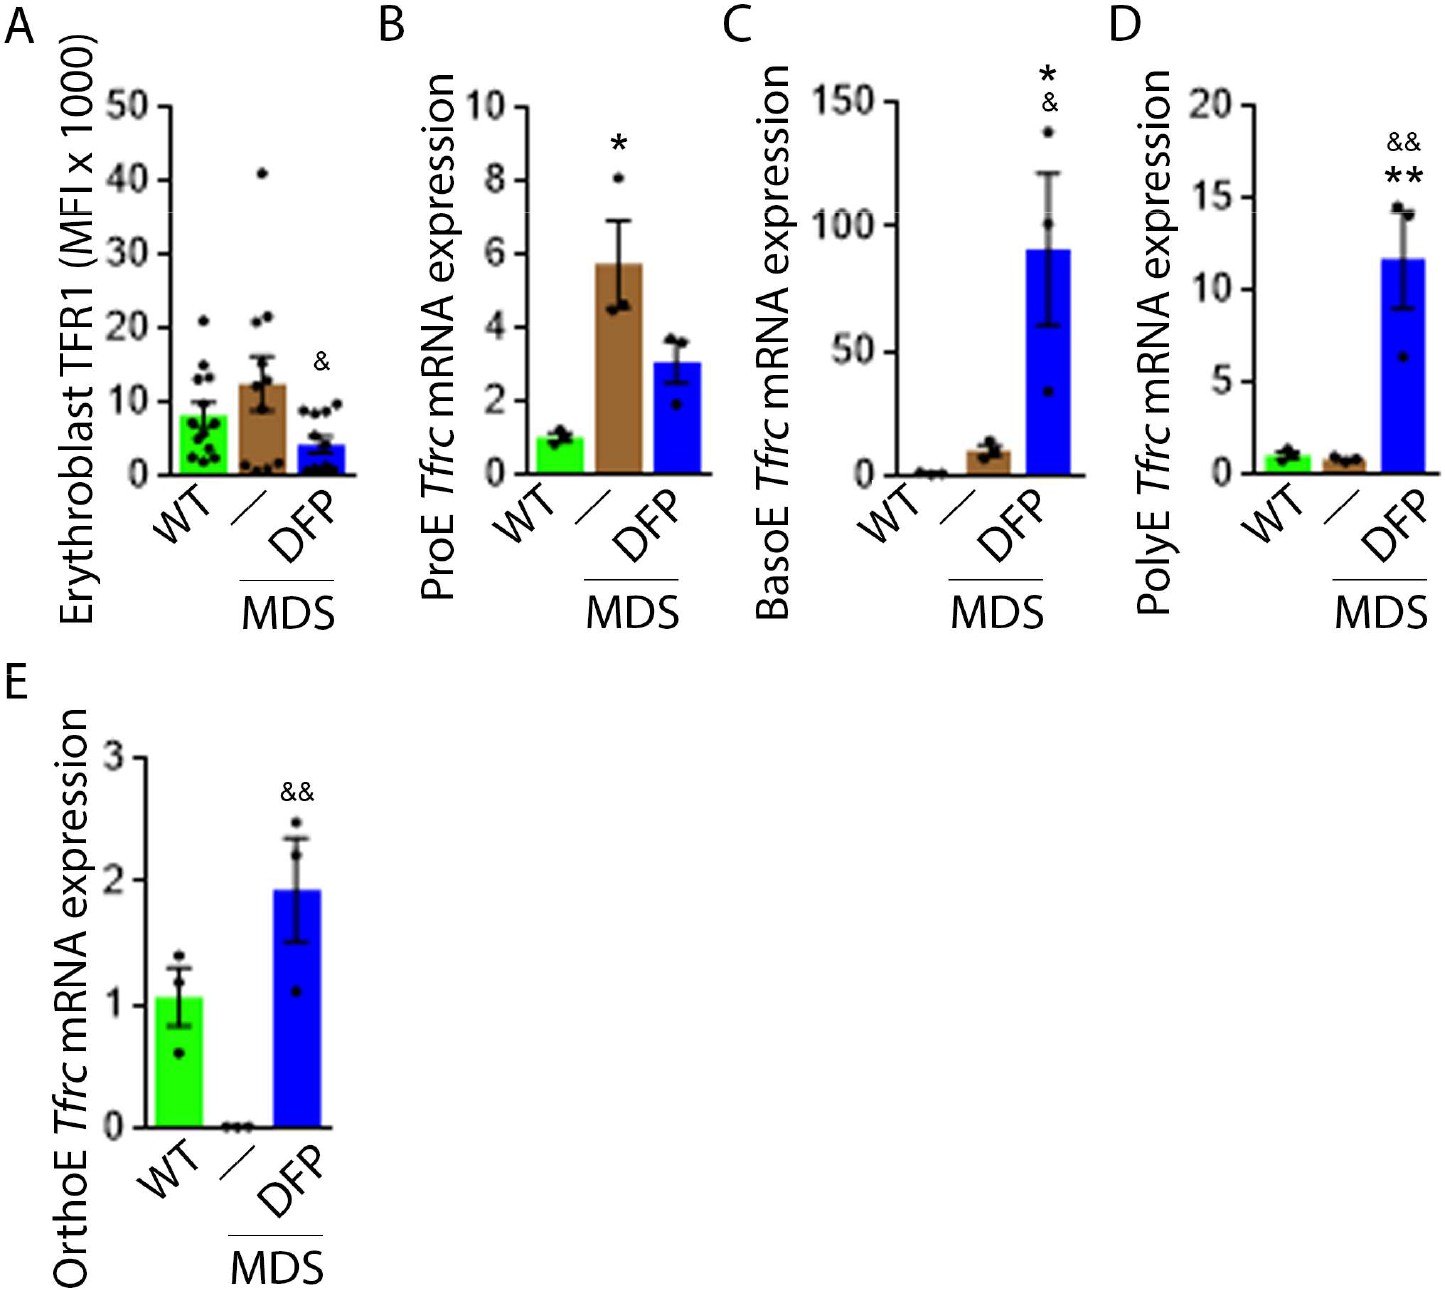
DFP normalized TFR1 expression in MDS erythroblasts.
(A) Flow cytometry gating using TER119 and CD44 was used to delineate bone marrow erythroblasts. In these gated erythroblasts, we evaluate membrane TFR1 to demonstrate its decrease in response to DFP in MDS mice (n=7–13 mice/group) analyzed after 1 month of treatment. Tfrc mRNA expression is increased in sorted bone marrow ProE (B) from MDS mice and partially normalized in DFP-treated MDS mice. Tfrc mRNA expression is normal in sorted bone marrow BasoE (C) and PolyE (D), decreased in OrthoE (E) from MDS mice, and increased in DFP-treated relative to untreated MDS mice (n=15–18 mice/group). *p<0.05 vs. WT; **p<0.01 vs. WT; &p<0.05 vs. MDS; &&p<0.01 vs. MDS; Abbreviations: WT = wild type; MDS = myelodysplastic syndrome; DFP = deferiprone; TFR1=transferrin receptor 1; ProE = pro-erythroblasts; BasoE = basophilic erythroblasts; PolyE = polychromatophilic erythroblasts; OrthoE = orthochromatophilic erythroblasts.
-
Figure 6—source data 1
Source data for flow analysis of cell surface TFR1 and Tfrc in sorted bone marrow erythroblasts from wild type (WT), myelodysplastic syndrome (MDS), and DFP-treated MDS mice.
- https://cdn.elifesciences.org/articles/83103/elife-83103-fig6-data1-v1.xlsx
Figure 6—figure supplement 1
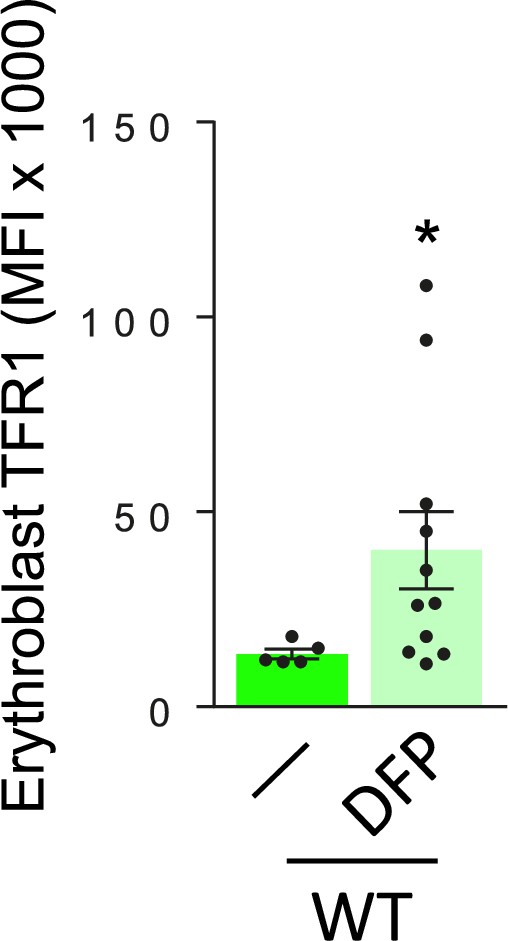
Effect of DFP on erythroblast surface TFR1 expression in WT mice.
Membrane TFR1 on bone marrow erythroblasts from WT and DFP-treated WT mice (n=5–11 mice/group). *p<0.05 vs. WT DFP; WT = wild type; DFP = deferiprone; TFR1 = transferrin receptor 1; MFI = mean fluorescence index.
-
Figure 6—figure supplement 1—source data 1
Source data for flow analysis of cell surface transferrin receptor 1 (TFR1) on bone marrow erythroblasts from wild type (WT) and DFP-treated WT mice.
- https://cdn.elifesciences.org/articles/83103/elife-83103-fig6-figsupp1-data1-v1.xlsx
Figure 6—figure supplement 2

Effect of DFP on erythroblast Tfrc expression in erythroblasts from WT mice.
Sorted bone marrow erythroblast Tfrc mRNA expression between WT and DFP-treated WT mice (n=5–7 mice/group). *p<0.05 vs. WT DFP; WT = wild type; DFP = deferiprone; Tfrc = transferrin receptor 1.
-
Figure 6—figure supplement 2—source data 1
Source data for Tfrc in sorted bone marrow erythroblasts from wild type (WT) and DFP-treated WT mice.
- https://cdn.elifesciences.org/articles/83103/elife-83103-fig6-figsupp2-data1-v1.xlsx
Figure 7 with 2 supplements
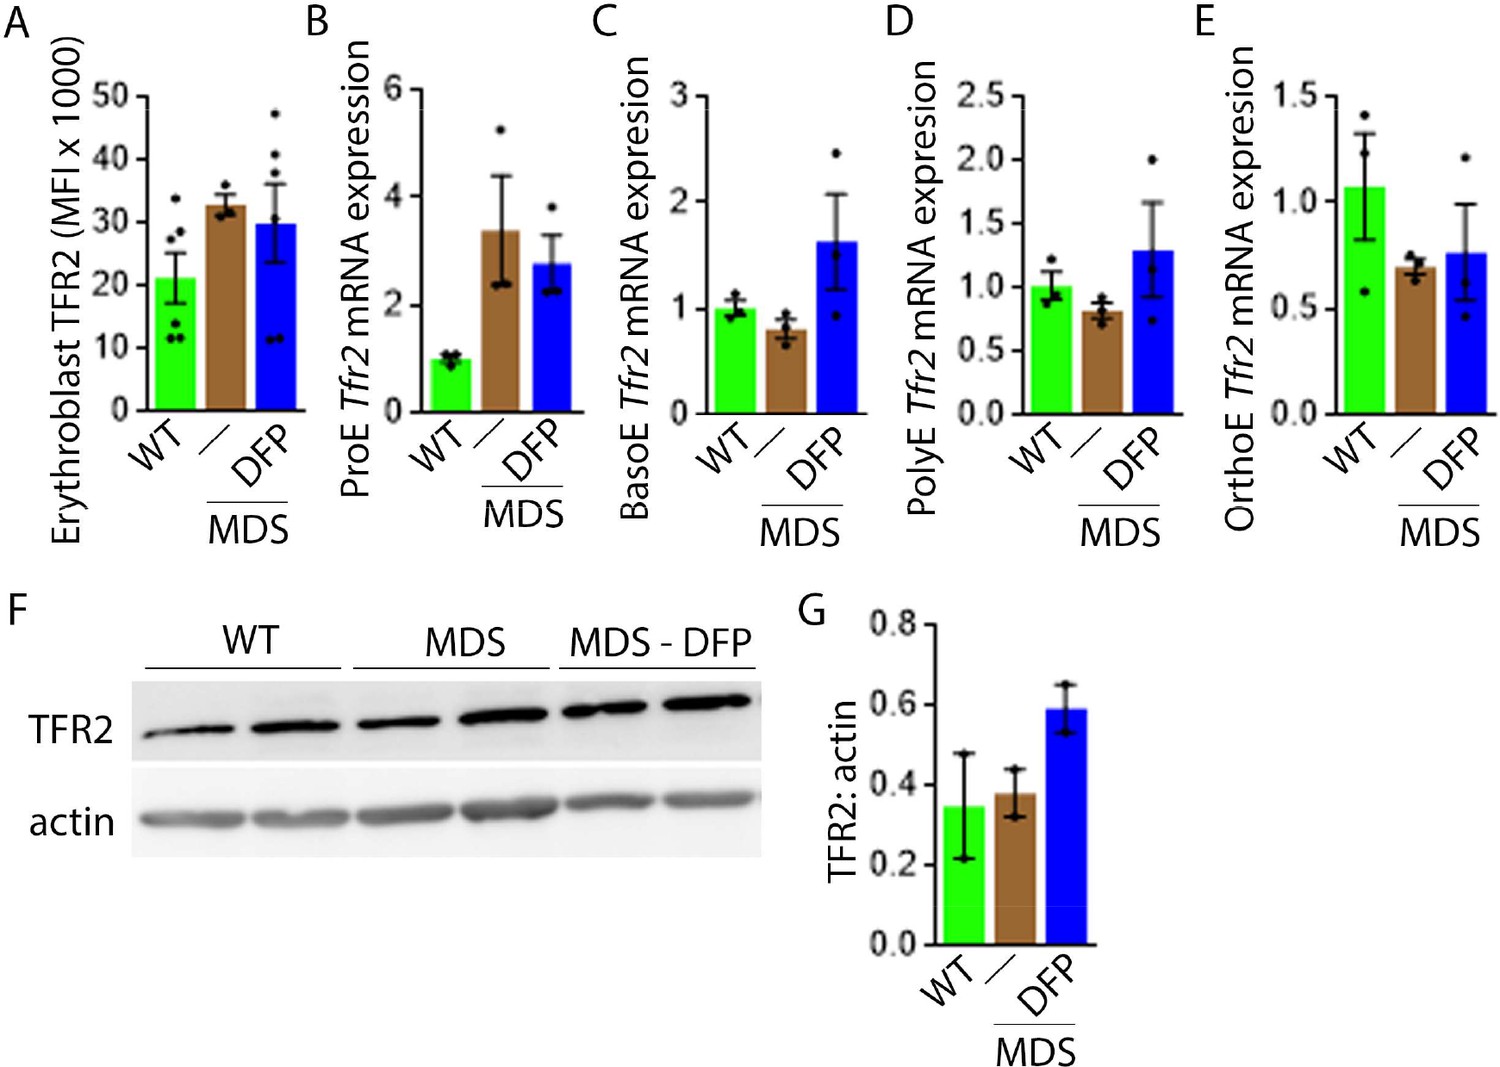
DFP does not normalize elevated TFR2 expression in MDS erythroblasts.
(A) Flow cytometry gating using TER119 and CD44 was used to delineate bone marrow erythroblasts. In these gated erythroblasts, we evaluate membrane TFR2 which is unchanged in MDS and DFP-treated MDS mice (n=6–7 mice/group) analyzed after 1 month of treatment. (B) TFR2 mRNA expression is borderline increased in sorted bone marrow ProE from MDS relative to WT mice and remains significantly elevated in DFP-treated MDS relative to WT mice (n=15–18 mice/group). When compared with sorted bone marrow ProE, TFR2 expression in sorted bone marrow BasoE (C), PolyE (D), and OrthoE (E) is significantly suppressed in MDS relative to WT mice and remains suppressed in PolyE and OrthoE from DFP-treated MDS mice (n=15–18 mice/group). (F) Western blot demonstrating TFR2 protein concentration in bone marrow erythroblasts is not different between WT, MDS, and DFP-treated MDS mice, quantified in (G) (n=3 mice/sample). *p<0.05 vs. WT; **p<0.01 vs. WT; Abbreviations: WT = wild type; MDS = myelodysplastic syndrome; DFP = deferiprone; TFR2 = transferrin receptor 2; ProE = pro-erythroblasts; BasoE = basophilic erythroblasts; PolyE = polychromatophilic erythroblasts; OrthoE = orthochromatophilic erythroblasts.
-
Figure 7—source data 1
Source data for flow analysis of cell surface transferrin receptor 2 (TFR2), TFR2 protein concentration in bone marrow erythroblast-enriched CD45 negative cells, and TFR2, in sorted bone marrow erythroblasts from wild type (WT), myelodysplastic syndrome(MDS), and DFP-treated MDS mice.
- https://cdn.elifesciences.org/articles/83103/elife-83103-fig7-data1-v1.xlsx
-
Figure 7—source data 2
Western blots with transferrin receptor 2 (TFR2) antibody staining relative to actin in bone marrow erythroblast enriched CD45 negative cells from wild type (WT), myelodysplastic syndrome (MDS), and DFP-treated MDS mice.
- https://cdn.elifesciences.org/articles/83103/elife-83103-fig7-data2-v1.zip
Figure 7—figure supplement 1
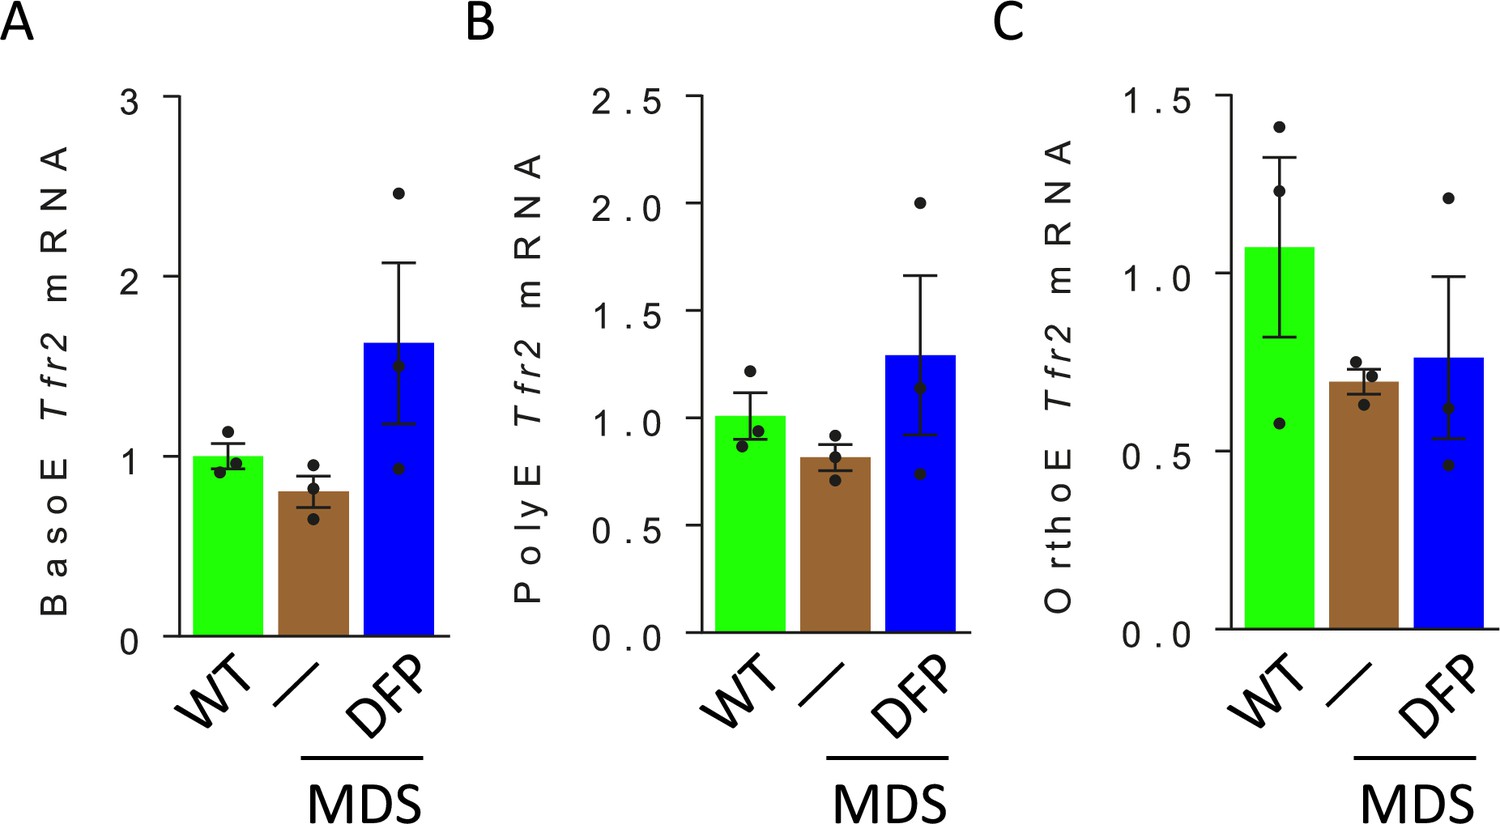
Erythroblast TFR2 mRNA expression in WT, MDS, and DFP-treated MDS mice.
No differences are observed in TFR2 mRNA expression in sorted BasoE (A), PolyE (B), and OrthoE (C) relative to ProE in WT, MDS, and DFP-treated MDS mice (n=5–15 mice/group). WT = wild type; MDS = myelodysplastic syndrome; DFP = deferiprone; TFR2 = transferrin receptor 2; ProE = pro-erythroblasts; BasoE = basophilic erythroblasts; PolyE = polychromatophilic erythroblasts; OrthoE = orthochromatophilic erythroblasts.
-
Figure 7—figure supplement 1—source data 1
Source data for transferrin receptor 2 (TFR2) in sorted bone marrow BasoE, PolyE, and OrthoE from wild type (WT), myelodysplastic syndrome (MDS), and DFP-treated MDS mice.
- https://cdn.elifesciences.org/articles/83103/elife-83103-fig7-figsupp1-data1-v1.xlsx
Figure 7—figure supplement 2

Erythroblast Scrib mRNA expression in WT, MDS, and DFP-treated MDS mice.
No differences in Scrib mRNA expression are observed in sorted bone marrow ProE (A), BasoE (B), PolyE (C), and OrthoE (D) between WT, MDS, and DFP-treated MDS mice (n=15–18 mice/group). WT = wild type; MDS = myelodysplastic syndrome; DFP = deferiprone; ProE = pro-erythroblasts; BasoE = basophilic erythroblasts; PolyE = polychromatophilic erythroblasts; OrthoE = orthochromatophilic erythroblasts; Scrib = Scribble.
-
Figure 7—figure supplement 2—source data 1
Source data for Scribble (Scrib) in sorted bone marrow erythroblasts from wild type (WT), myelodysplastic syndrome (MDS), and DFP-treated MDS mice.
- https://cdn.elifesciences.org/articles/83103/elife-83103-fig7-figsupp2-data1-v1.xlsx
Figure 8 with 2 supplements
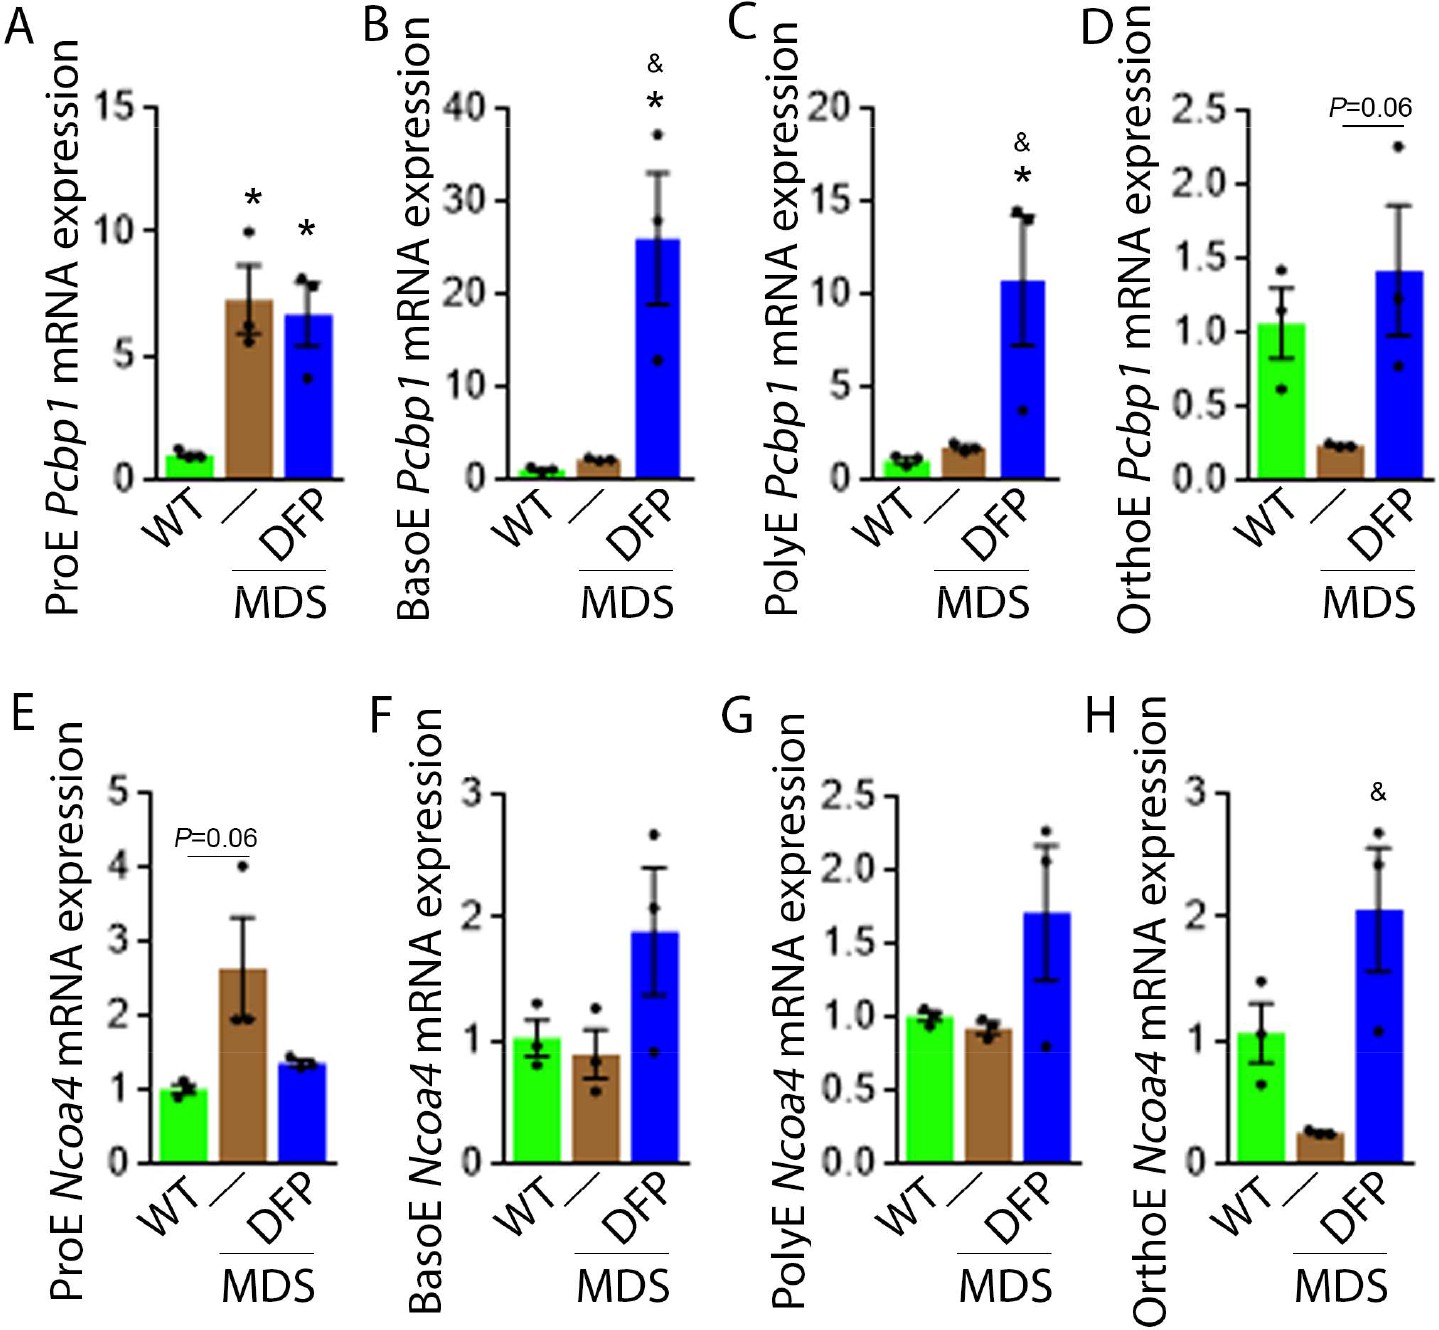
DFP alters the expression of iron chaperones in MDS erythroblasts.
Sorted bone marrow Pcbp1 mRNA expression is increased in ProE (A) from MDS relative to WT mice and remains high or is further elevated in ProE, BasoE (B), and PolyE (C) DFP-treated relative to untreated MDS mice. (D) Sorted bone marrow Pcbp1 mRNA expression is unchanged in OrthoE from MDS relative to WT mice, borderline normalized in DFP-treated MDS mice. Sorted bone marrow mRNA expression of Ncoa4 in ProE (E) is borderline increased in MDS, normalized in DFP-treated MDS mice. Sorted bone marrow mRNA expression of Ncoa4 is unchanged in BasoE (F) and PolyE (G) from MDS or DFP-treated MDS relative to WT mice. Sorted bone marrow mRNA expression of Ncoa4 in OrthoE (H) is unchanged in MDS and normalized in DFP-treated MDS mice (n=15–18 mice/group). *p<0.05 vs. WT; &p<0.05 vs. MDS; Abbreviations: WT = wild type; MDS = myelodysplastic syndrome; DFP = deferiprone; Pcbp1=Poly(rC)-binding protein 1; Ncoa4=nuclear receptor coactivator 4; ProE = pro-erythroblasts; BasoE = basophilic erythroblasts; PolyE = polychromatophilic erythroblasts; OrthoE = orthochromatophilic erythroblasts.
-
Figure 8—source data 1
Source data for Pcbp1 and Ncoa4 in sorted bone marrow erythroblasts from wild type (WT), myelodysplastic syndrome (MDS), and DFP-treated MDS mice.
- https://cdn.elifesciences.org/articles/83103/elife-83103-fig8-data1-v1.xlsx
Figure 8—figure supplement 1
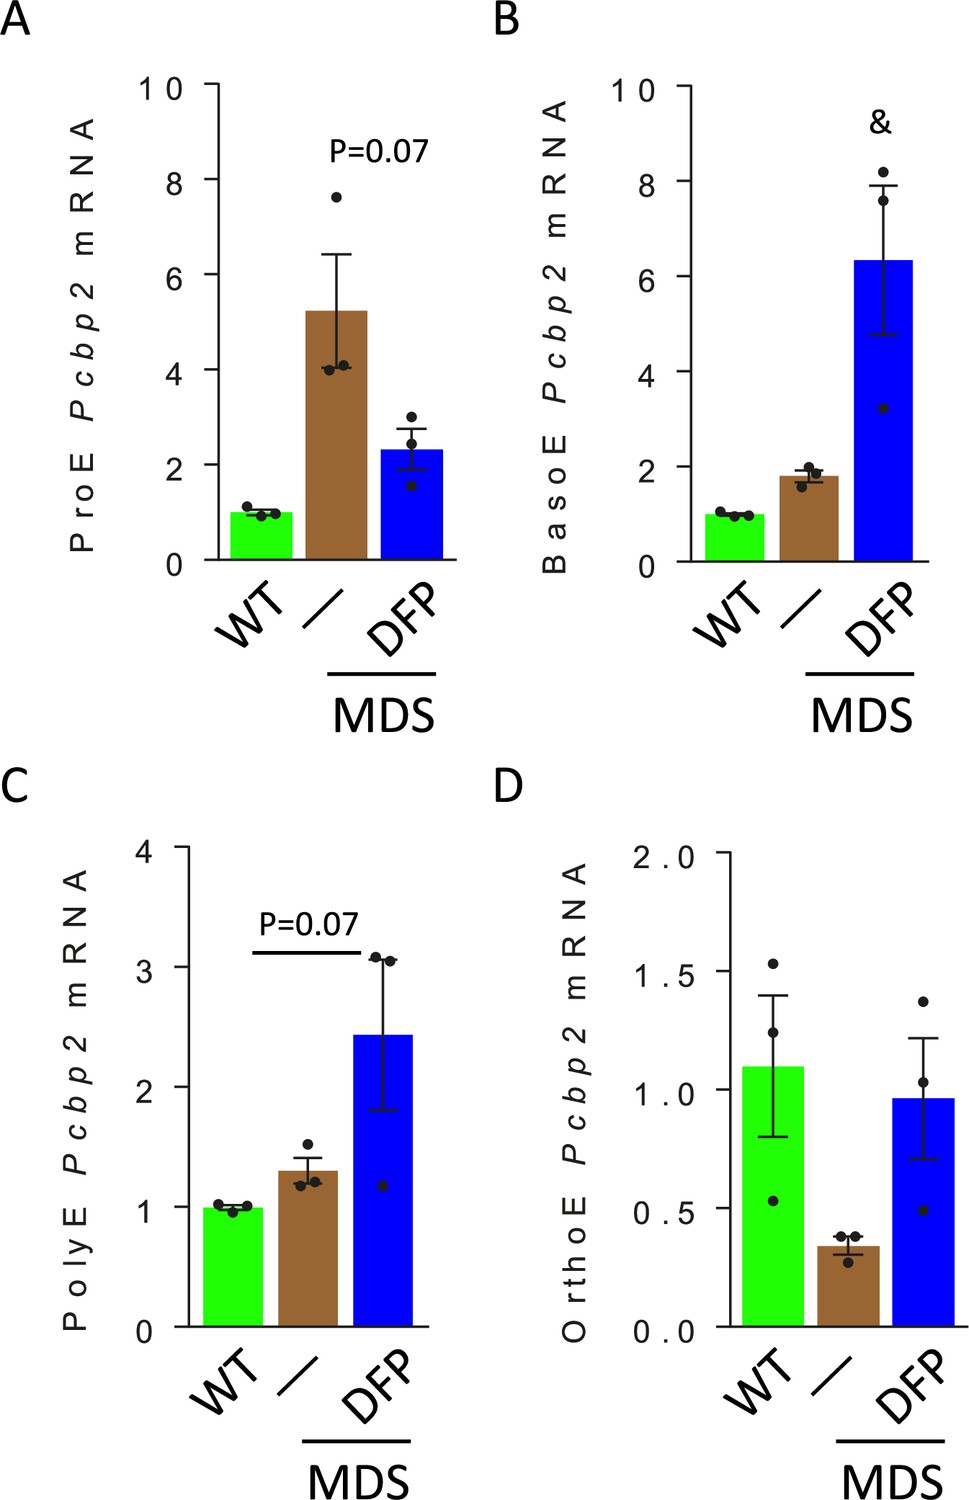
Erythroblast Pcbp2 mRNA expression in WT, MDS, and DFP-treated MDS mice.
Pcbp2 mRNA expression changes parallel those of Pcbp1 in sorted bone marrow ProE (A), BasoE (B), PolyE (C), and OrthoE (d) between WT, MDS, and DFP-treated MDS mice (n=15–18 mice / group). *p<0.05 vs. WT; &p<0.05 vs. MDS; WT = wild type; MDS = myelodysplastic syndrome; DFP = deferiprone; ProE = pro-erythroblasts; BasoE = basophilic erythroblasts; PolyE = polychromatophilic erythroblasts; OrthoE = orthochromatophilic erythroblasts; Pcbp2=Poly(rC)-binding protein 2.
-
Figure 8—figure supplement 1—source data 1
Source data for Pcbp2 in sorted bone marrow erythroblasts from wild type (WT), myelodysplastic syndrome (MDS), and DFP-treated MDS mice.
- https://cdn.elifesciences.org/articles/83103/elife-83103-fig8-figsupp1-data1-v1.xlsx
Figure 8—figure supplement 2

Erythroblast Gpx4 mRNA expression in WT, MDS, and DFP-treated MDS mice.
No differences in Gpx4 mRNA expression are observed in sorted bone marrow ProE (A), BasoE (B), PolyE (C), and OrthoE (D) between WT, MDS, and DFP-treated MDS mice (n=15–18 mice/group). WT = wild type; MDS = myelodysplastic syndrome; DFP = deferiprone; ProE = pro-erythroblasts; BasoE = basophilic erythroblasts; PolyE = polychromatophilic erythroblasts; OrthoE = orthochromatophilic erythroblasts; GPX4 = glutathione peroxidase 4.
-
Figure 8—figure supplement 2—source data 1
Source data for glutathione peroxidase 4 (Gpx4) in sorted bone marrow erythroblasts from wild type (WT), myelodysplastic syndrome (MDS), and DFP-treated MDS mice.
- https://cdn.elifesciences.org/articles/83103/elife-83103-fig8-figsupp2-data1-v1.xlsx
Figure 9
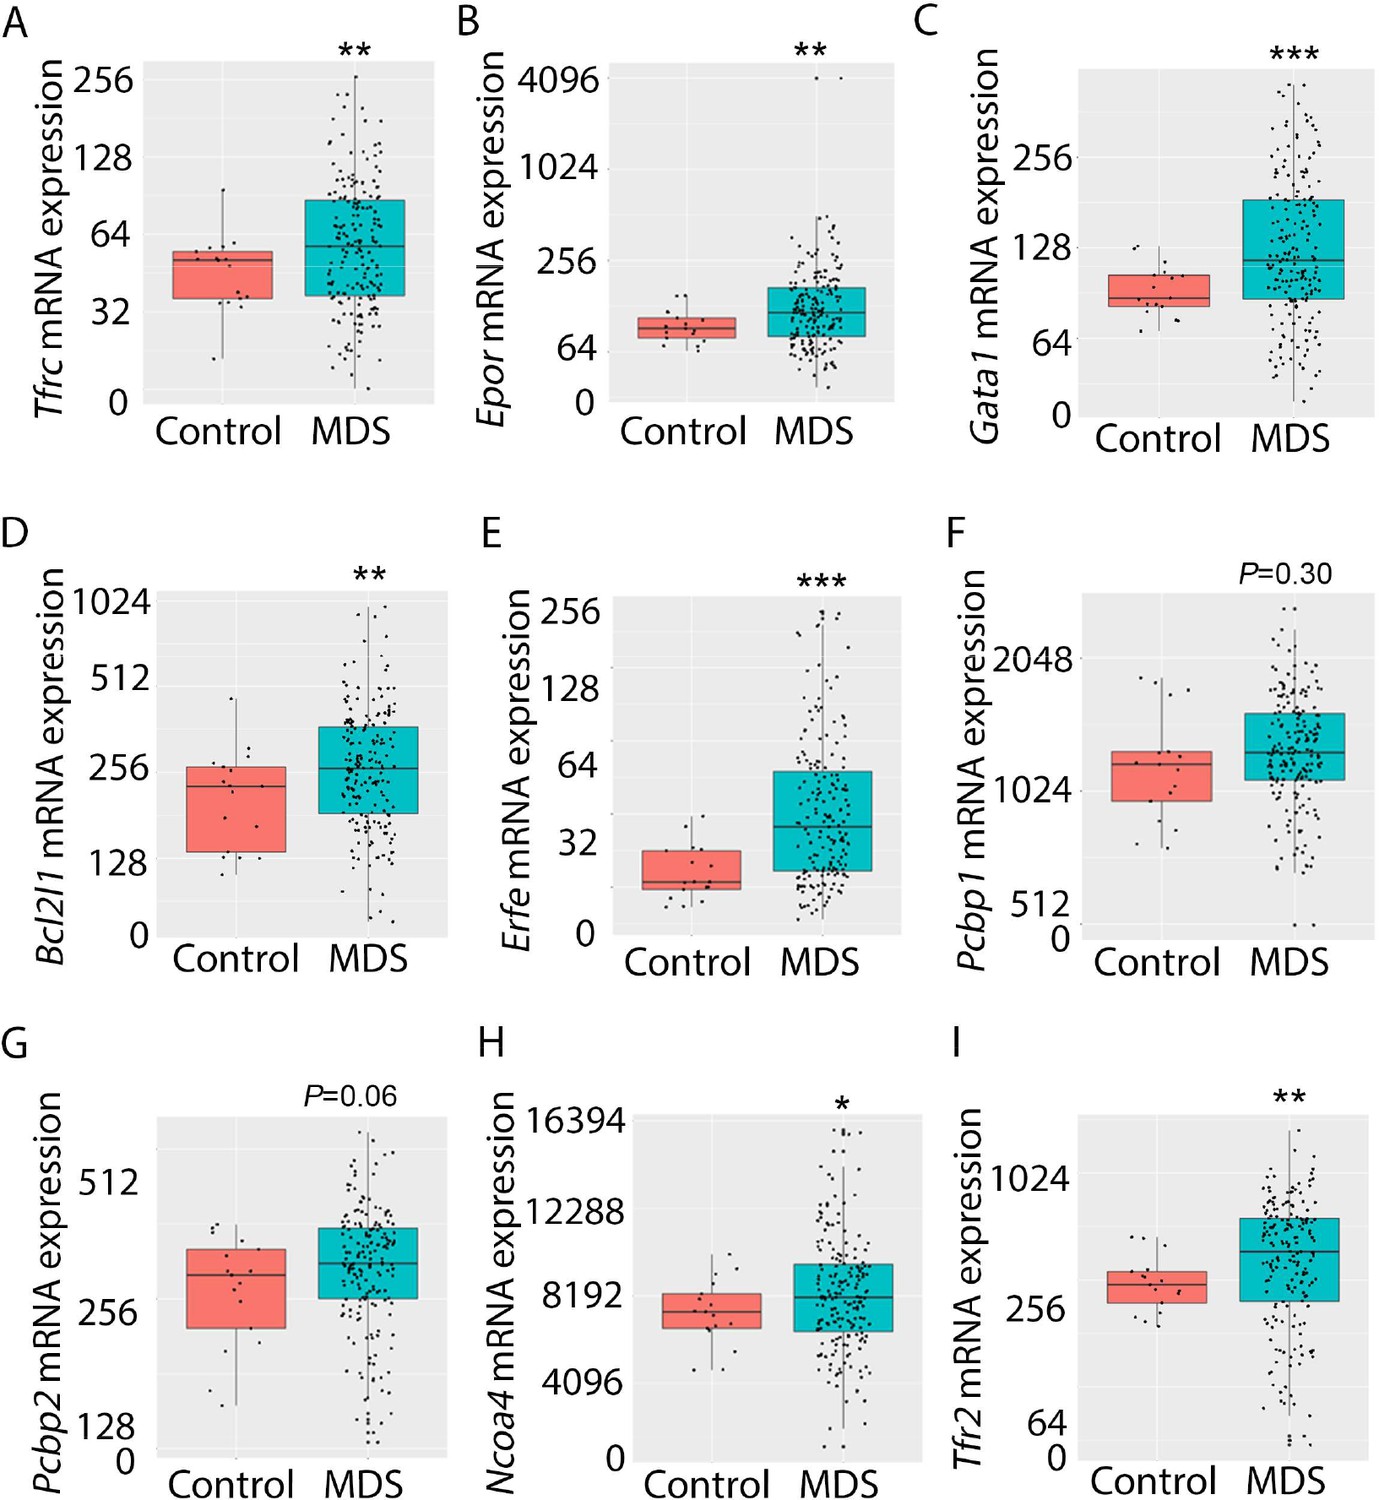
Increased expression of iron metabolism-related genes in MDS patient bone marrow stem and progenitor cells.
Increased expression of Tfrc (A), Epor (B), Gata1 (C), Bcl2l1 (D), and Erfe (E) is expected and validates the database. No difference in Pcbp1 (F), borderline increase in Pcbp2 (G), and statistically significantly increase in Ncoa4 (H) and TFR2 (I) are evident in MDS patients relative to controls, providing an important confirmation of the relevance of similar findings in MDS mice. *p<0.05, **p<0.01, ***p<0.0001 vs. control; MDS = myelodysplastic syndrome; Tfrc and TFR2 = transferrin receptor 1 and 2; Epor = erythropoietin receptor; Bcl2l1 = B cell lymphoma 2-like protein 1 (gene name for Bcl-Xl); Erfe = erythroferrone; Pcbp1 and Pcbp2 = Poly(rC)-binding protein 1 and 2; Ncoa4 nuclear receptor coactivator 4.
-
Figure 9—source data 1
Source data for iron metabolism-related genes in bone marrow stem and progenitor cells from myelodysplastic syndrome (MDS) patients vs. controls.
- https://cdn.elifesciences.org/articles/83103/elife-83103-fig9-data1-v1.xlsx
Figure 10
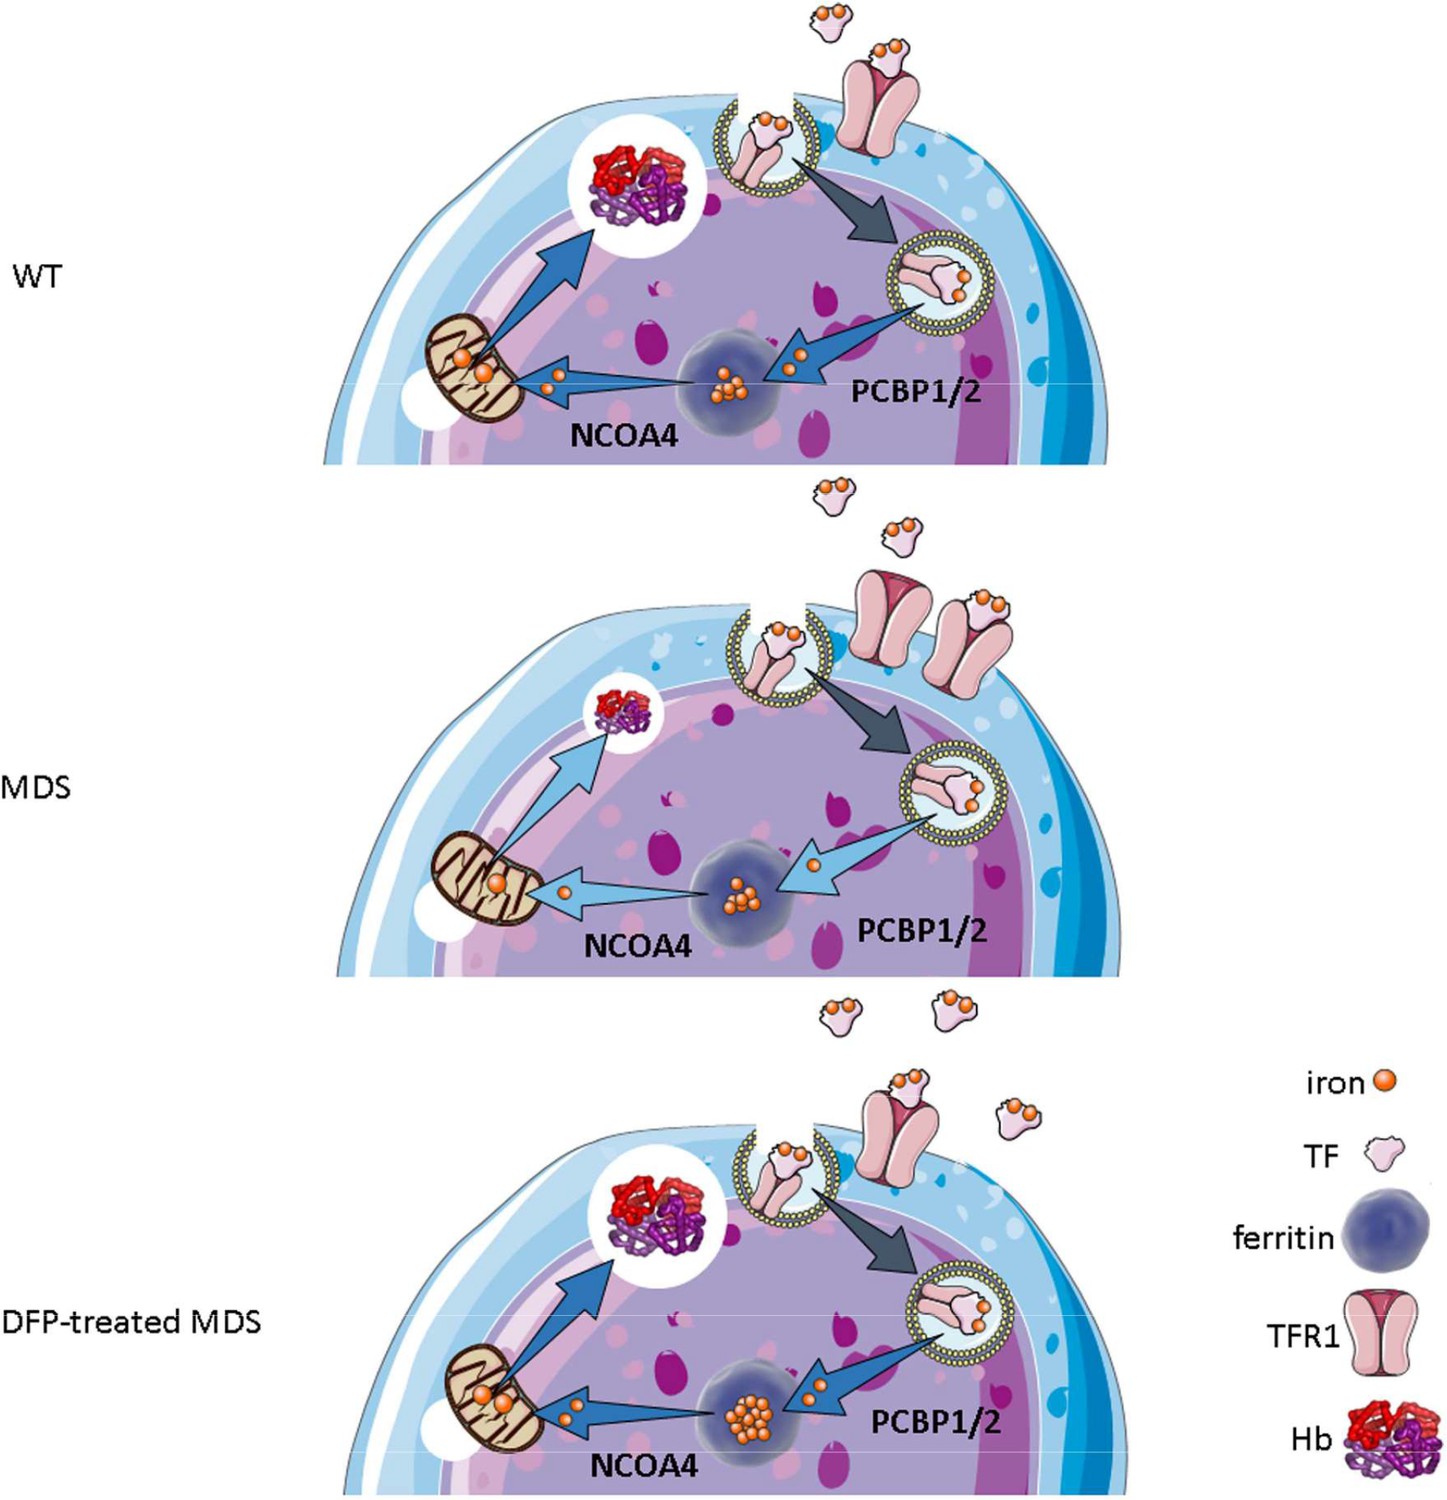
Putative function of erythroblast iron trafficking in health and in MDS before and after DFP treatment.
Erythroblast iron uptake is mediated by TFR1 via endocytosis of clathrin-coated pits. In addition, erythroblast ferritin iron delivery is an obligatory step in erythropoiesis, and chaperones, i.e., PCBP1 and PCBP2, deliver iron to ferritin while NCOA4 enable iron extraction from ferritin, leading to iron utilization for hemoglobin synthesis in the mitochondria (A). In conditions of expanded erythropoiesis, such as MDS (B), more TFR1 results in increased iron uptake, resulting in decreased PCBP1 and NCOA4; yet no change in ferritin storage. Treatment with DFP restores erythroblast iron trafficking with decreased TFR1, increased PCBP1 and NCOA4, and increased ferritin concentration (C). We propose a model in which altered iron delivery to the mitochondria correlates with increased erythroblast survival and proliferation and decreased erythroid differentiation, causing ineffective erythropoiesis in MDS, ameliorated in response to DFP. Abbreviations: WT = wild type; MDS = myelodysplastic syndrome; DFP = deferiprone; TF = transferrin; TFR1 = transferrin receptor 1; PCBP1/2=Poly(rC)-binding protein 1 and 2; NCOA4=nuclear receptor coactivator 4; Hb = hemoglobin.
Author response image 1
Tables
Table 1
Hematopoiesis- and Iron-related Characteristics of NHD13 mice.
| RBC count | Hb | MCV | Retic count | WBC count | Platelet count | Serum EPO | Bone marrow cells | Liver iron concentration | |
|---|---|---|---|---|---|---|---|---|---|
| (units) | (106 /μL) | (g/dL) | (fL) | (106 /μL) | (106 /μL) | (103 /μL) | (μg/μL) | (107 cells) | (mg/g dry weight) |
| WT | 10±0.1 | 14.7±0.1 | 50±0.5 | 495±67 | 5.5±0.6 | 759±67 | 308±48 | 12.4±0.7 | 0.23±0.07 |
| MDS | 6.73±0.29 | 11.2±0.4 | 60±1.3 | 440±30 | 3.0±0.4 | 672±80 | 4832±1,154 | 15±0.8 | 0.51±0.04 |
| *** | *** | *** | NS | ** | NS | *** | * | * |
-
WT = wild type; MDS = myelodysplastic syndrome (NHD13) mice; RBC = red blood cell; Hb = hemoglobin; MCV = mean corpuscular hemoglobin; Retic = reticulocyte; WBC = white blood cell; EPO = erythropoietin; NS = not significant; * P<0.05; ** P<0.01; *** P<0.0001.
Additional files
-
Supplementary file 1
Tables of reagents used for PCR and western blot experiments.
(a) Table of primers. (b) Table of antibodies.
- https://cdn.elifesciences.org/articles/83103/elife-83103-supp1-v1.docx
Download links
A two-part list of links to download the article, or parts of the article, in various formats.
Downloads (link to download the article as PDF)
Open citations (links to open the citations from this article in various online reference manager services)
Cite this article (links to download the citations from this article in formats compatible with various reference manager tools)
Iron chelation improves ineffective erythropoiesis and iron overload in myelodysplastic syndrome mice
eLife 12:e83103.
https://doi.org/10.7554/eLife.83103


