Universal gut microbial relationships in the gut microbiome of wild baboons
- Program in Computational Biology and Bioinformatics, Duke University, United States
- University of Groningen and University Medical Center Groningen, Department of Gastroenterology and Hepatology, Netherlands
- University of Groningen and University Medical Center Groningen, Department of Genetics, Netherlands
- Department of Biological Sciences, University of Notre Dame, United States
- Department of Biology, University of British Columbia-Okanagan Campus, Canada
- Department of Ecology, Evolution, and Behavior, University of Minnesota, United States
- Department of Biology, Duke University, United States
- Committee on Genetics, Genomics, and Systems Biology, University of Chicago, United States
- Section of Genetic Medicine, Department of Medicine, University of Chicago, United States
- Committee on Immunology, University of Chicago, United States
- Department of Evolutionary Anthropology, Duke University, United States
- Duke University Population Research Institute, Duke University, United States
- Department of Pediatrics and the Scripps Institution of Oceanography, University of California, San Diego, United States
- Department of Primate Behavior and Evolution, Max Planck Institute for Evolutionary Anthropology, Germany
- Departments of Statistical Science, Mathematics, Computer Science, and Bioinformatics & Biostatistics, Duke University, United States
- Center for Scalable Data Analytics and Artificial Intelligence, University of Leipzig, Germany
- Max Plank Institute for Mathematics in the Natural Sciences, Germany
Figures
Figure 1 with 3 supplements
Testing the generalizability of gut microbial correlations across hosts.
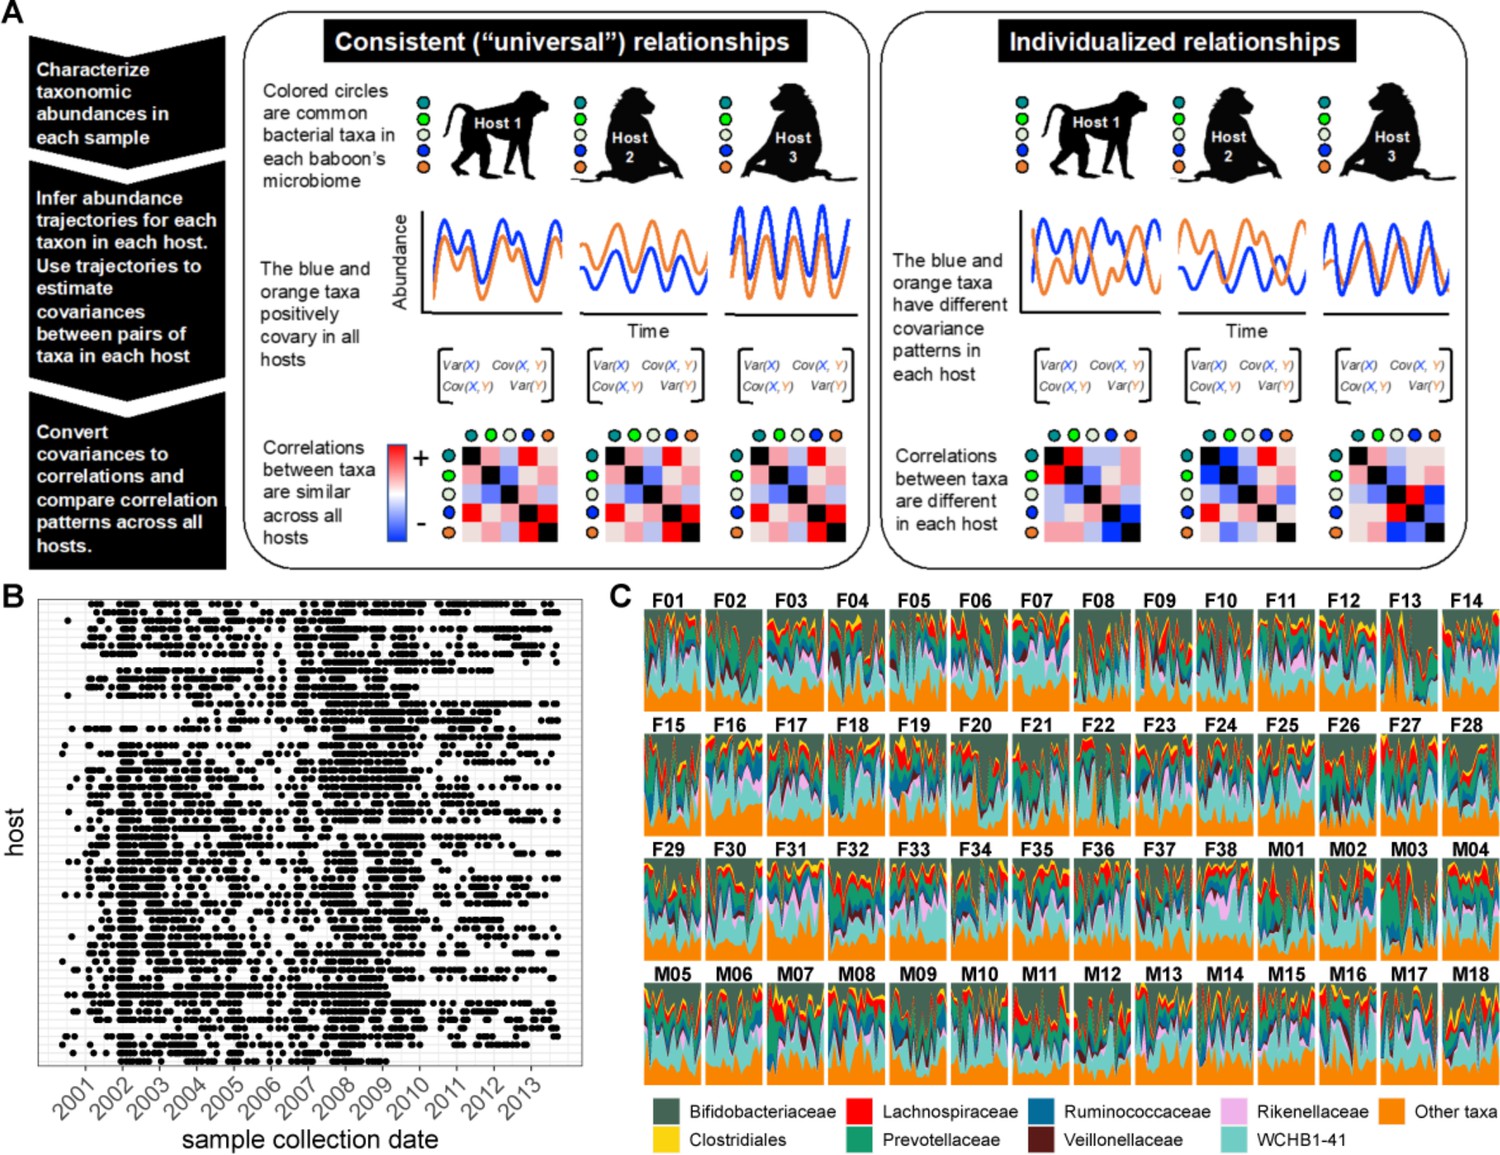
(A) Schematic illustrating our approach for testing the degree to which gut microbial abundance correlations are consistent (i.e. ‘universal’; Bashan et al., 2016) across different baboon hosts. The left-hand set of images show our expectations for consistent correlation patterns; the right-hand images show our expectation for individualized correlation patterns. Colored circles next to each baboon represent microbes found in at least 50% of samples overall (and at least 20% of samples within each host). We also excluded putative duplicate 16S gene copies (see Methods). In each host, we inferred centered log-ratio (CLR) abundance trajectories for these taxa using a multinomial logistic-normal modeling approach implemented in the R package ‘fido’ (Silverman et al., 2022). Cartoons of two such trajectories for the orange and blue taxa are below each baboon. We used these trajectories to infer covariances between each pair of taxa in all baboons (represented by covariance matrices; we only analyzed microbial pairs whose joint zero abundance was less than 5% of all samples across hosts). We then converted these covariances to Pearson’s correlations and compared bacterial correlation patterns across all hosts, shown as heat maps (red cells are positively correlated taxa; blue cells reflect negatively correlated taxa). (B) Irregular time series of fecal samples used to infer microbial CLR abundance trajectories in 56 baboon hosts (n=5534 total samples; 75–181 samples per baboon across 6–13.3 years). Each point represents a fecal sample collected from a known individual baboon (y-axis) on a given date (x-axis). Samples from the same baboon were collected a median of 20 days apart (range = 0–723 days; 25th percentile = 7 days, 75th percentile = 49 days). (C) Relative abundances of the eight most prevalent gut bacterial orders and families over time (x-axis) for all 56 hosts (samples from females are labeled with an F; male samples with an M). Microbiota composition was somewhat individualized to each host (Figure 1—figure supplement 2; Björk et al., 2022; Grieneisen et al., 2021).
Figure 1—figure supplement 1
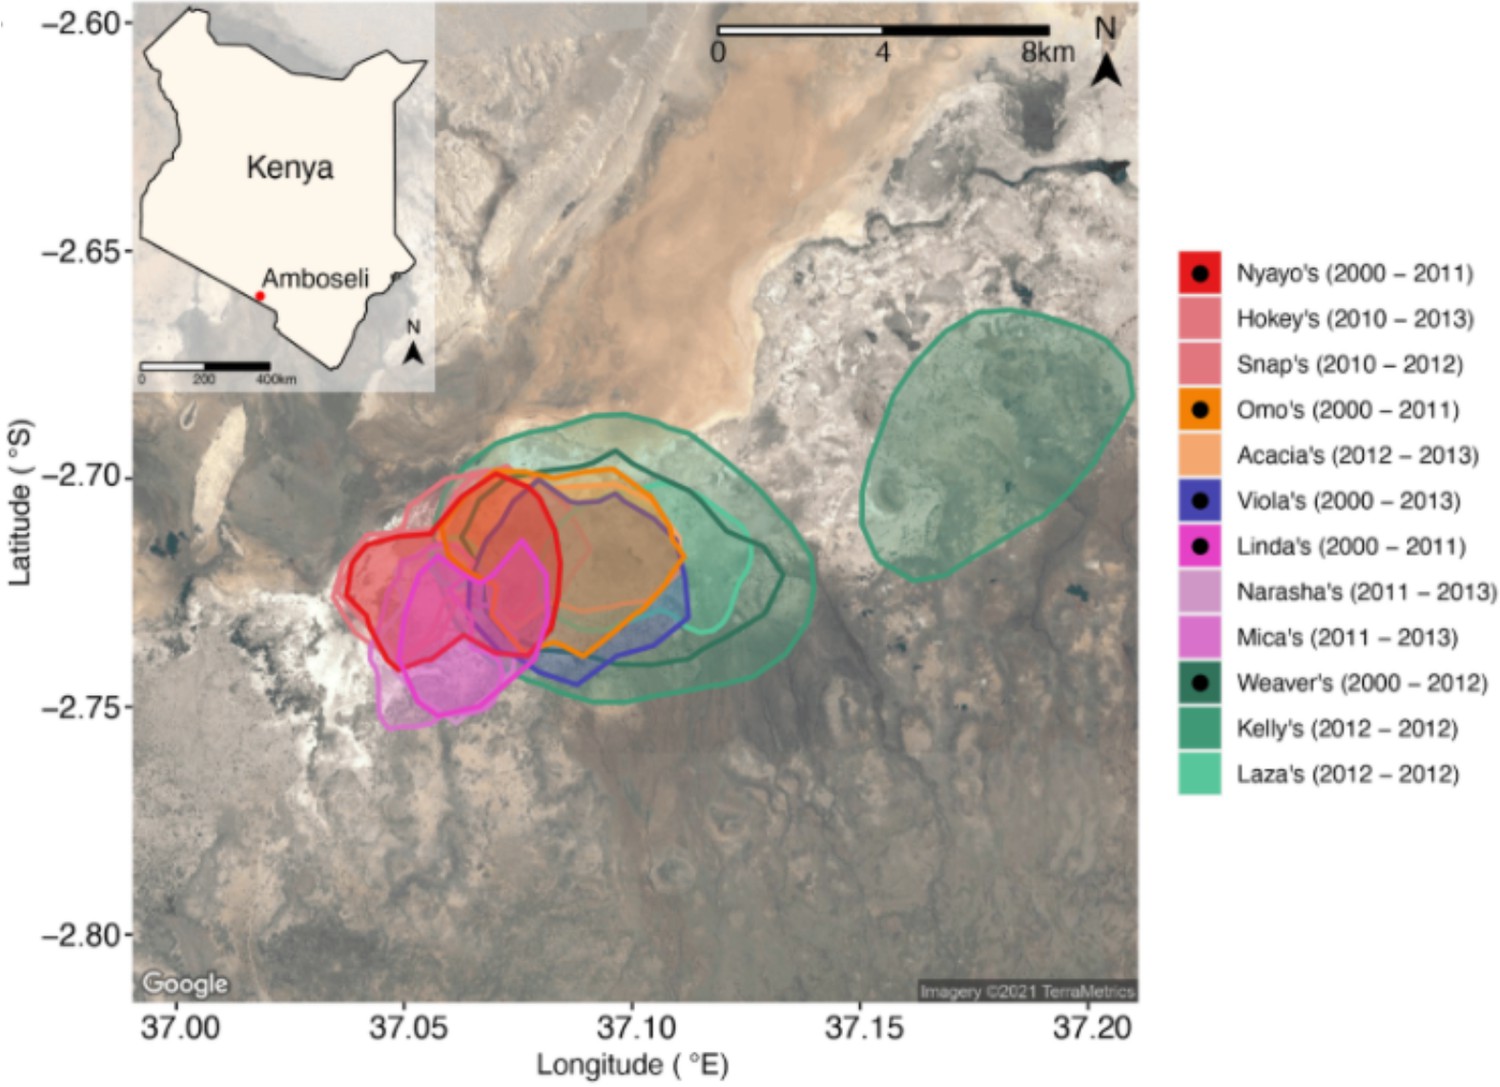
Host ranging patterns.
Ranging patterns for the baboon social groups included in this study during the period of microbiome sampling (May 19, 2000, to September 19, 2013). See Björk et al., 2022, for an in-depth analysis of environmental drivers of microbiome dynamics in this host population.
Figure 1—figure supplement 2
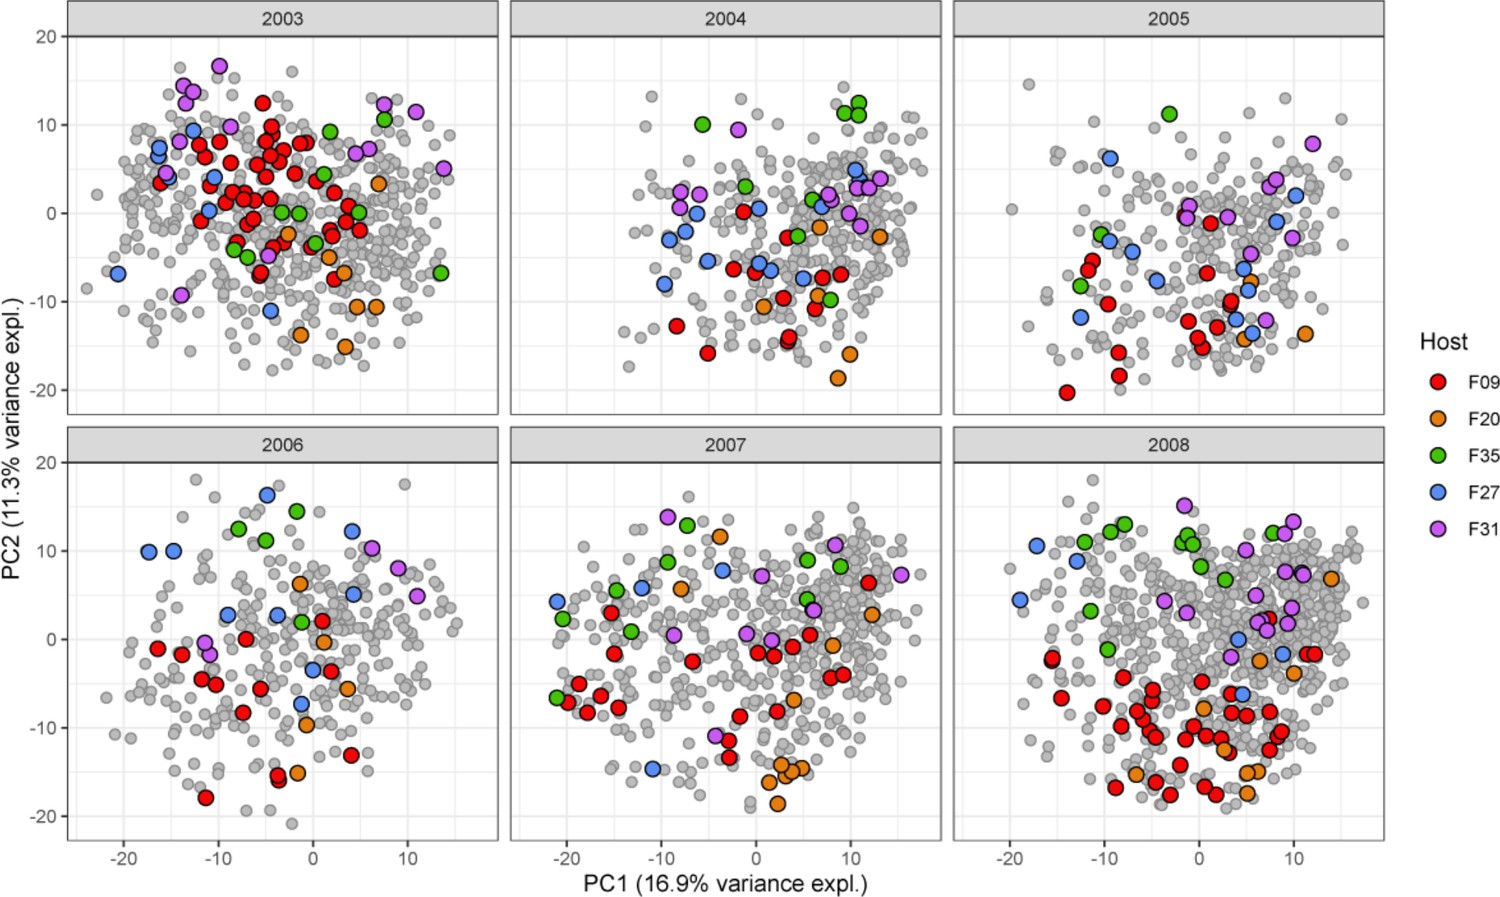
Variation across hosts.
Each baboon exhibits a somewhat distinctive gut microbial community (p<0.0001; ANOVA) summarized here by the first two principal components of centered log-ratio (CLR)-transformed amplicon sequence variant (ASV) abundances of ASVs during six representative years of sample collection (see Figure 1B). Colored dots represent one of five especially well-sampled hosts, and colors indicate samples from the same host. Gray dots represent all other samples collected in the same year.
Figure 1—figure supplement 3
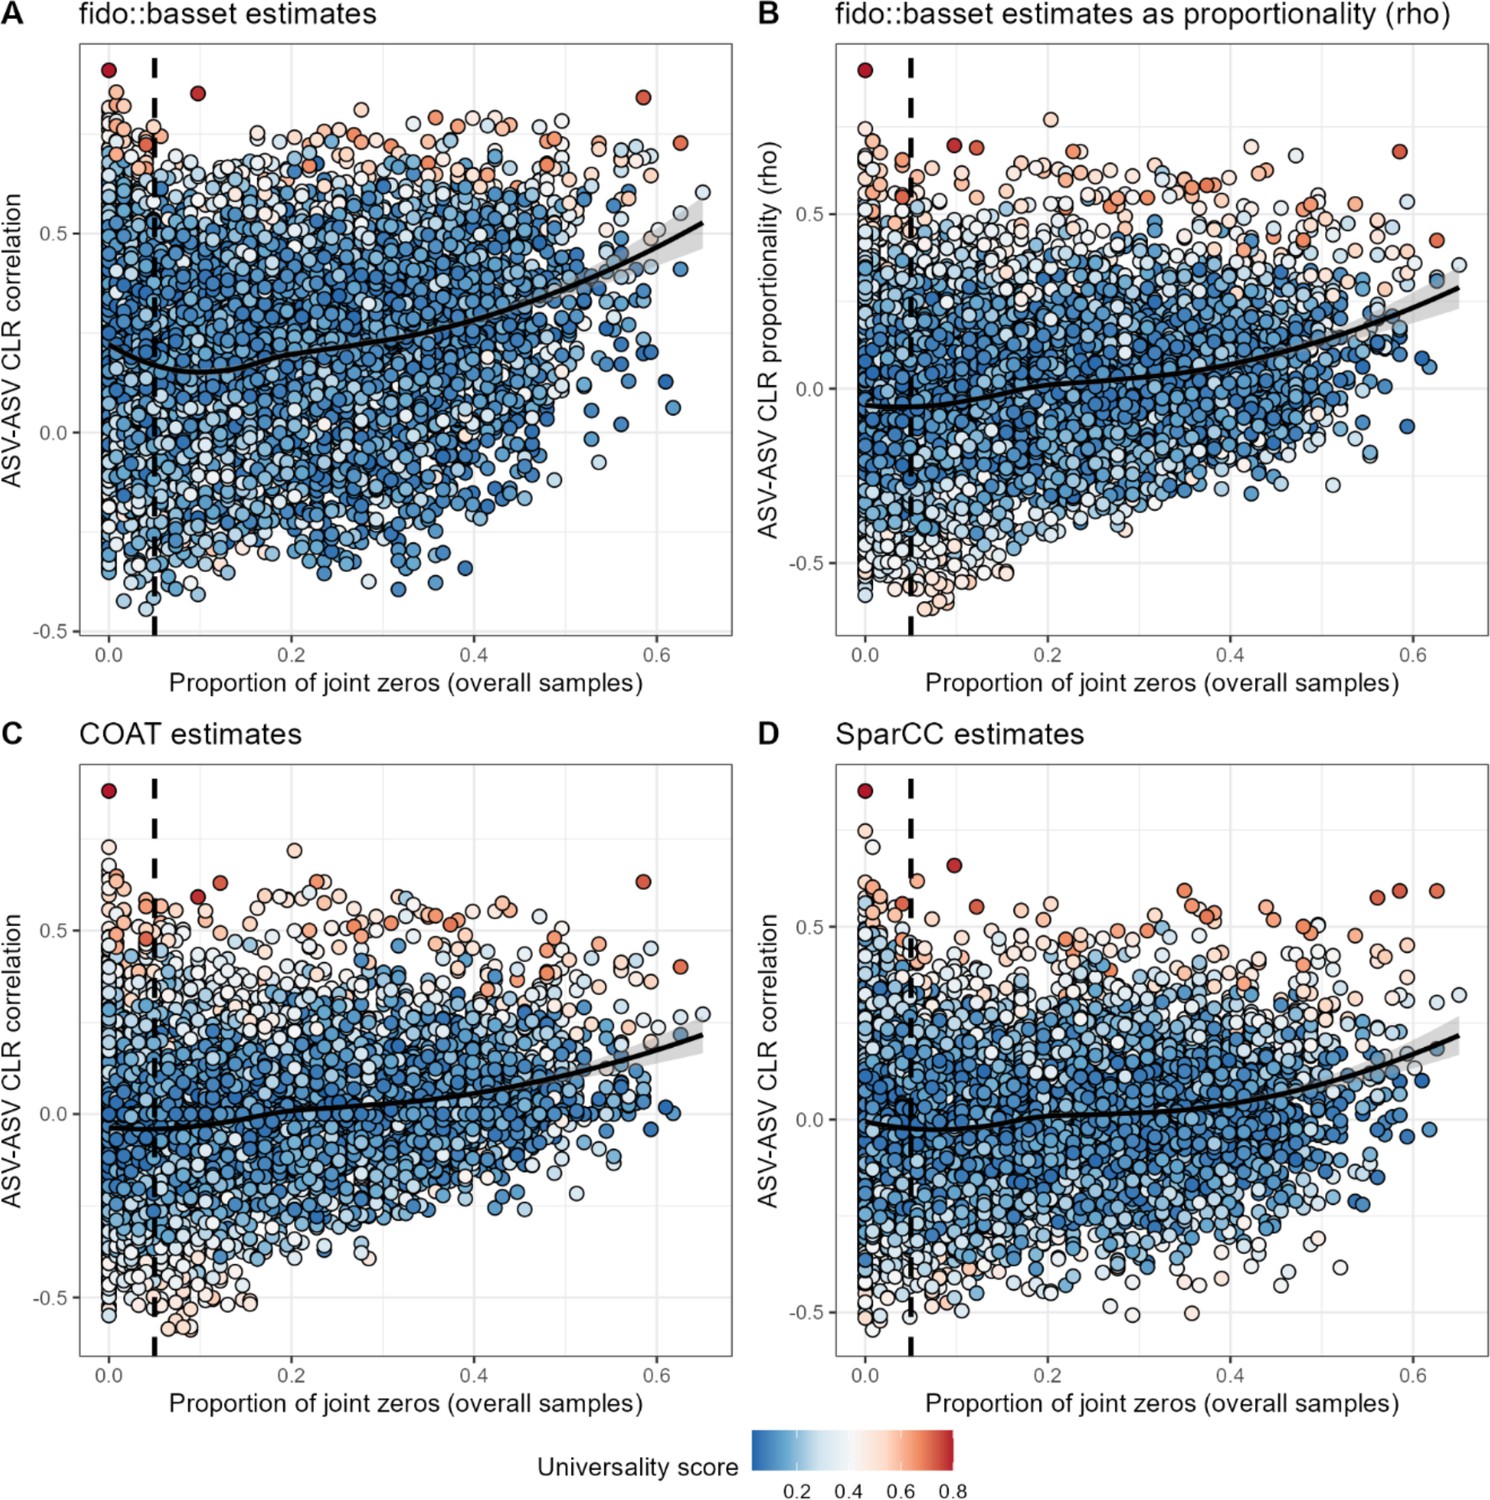
An increase in frequency of joint zeros is associated with positive ASV-ASV correlations across four methods.
ASV-ASV pairs with a high frequency of joint absences (zero abundance observations) are more likely to be estimated as positively correlated by four methods: (A) basset, reporting Pearson’s correlation; (B) basset, reporting proportionality (rho; see Quinn et al., 2017); (C) COAT (see Cao et al., 2019); or (D) SparCC (see Friedman and Alm, 2012). The vertical dashed line in all panels shows a 0.05 cutoff for the proportion of joint zeros, the cutoff used in the main text. ASV, amplicon sequence variant.
Figure 2 with 4 supplements
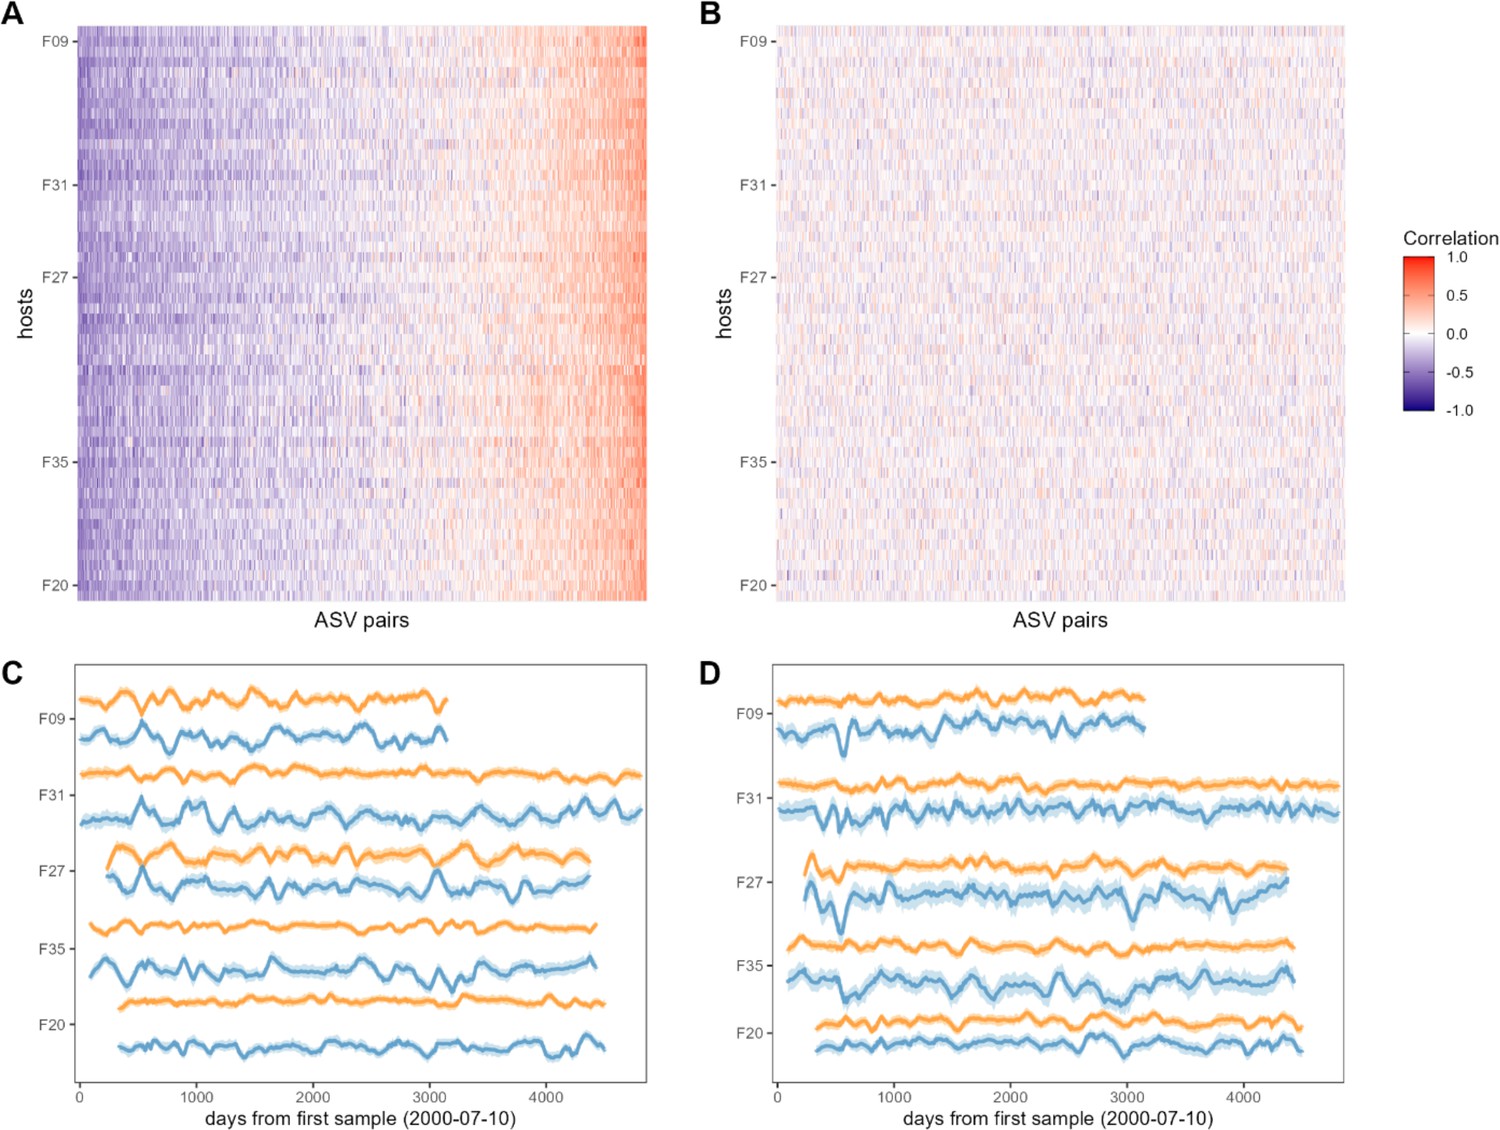
Bacterial correlation patterns across hosts.
The heat map in panel (A) shows Pearson’s correlation coefficients of centered log-ratio (CLR) abundances between all pairs of amplicon sequence variants (ASVs) (x-axis) in each of the 56 baboon hosts (y-axis). Each pair of ASVs is represented on the x-axis, including all pairwise combinations of 107 ASVs with sufficient co-occurrence, resulting in 1878 ASV-ASV correlations measured per host (105,168 total correlations across all 56 hosts). Columns are ordered by the mean correlation coefficient between ASV-ASV pairs, from negative (blue) to positive (red). (B) Pairwise correlations generated from random permutations of the data. Taxonomic identities were shuffled within samples and pairwise ASV-ASV correlations were estimated to produce a null model of ASV-ASV correlation patterns within and between hosts. Column order is the same as in panel A. Panels (C) and (D) show example trajectories of CLR abundances for two pairs of ASVs in the same five hosts. Panel (C) shows a strongly negatively correlated pair (median r across all hosts = −0.461; two ASVs in order Clostridiales: ASV36 (orange) and ASV59 (blue); Supplementary file 1a and d) and panel (D) shows a strongly positively correlated pair (median r across all hosts = 0.508; two ASVs in genus Bifidobacterium; ASV1 (orange) and ASV4 (blue); Supplementary file 1a and d).
Figure 2—figure supplement 1
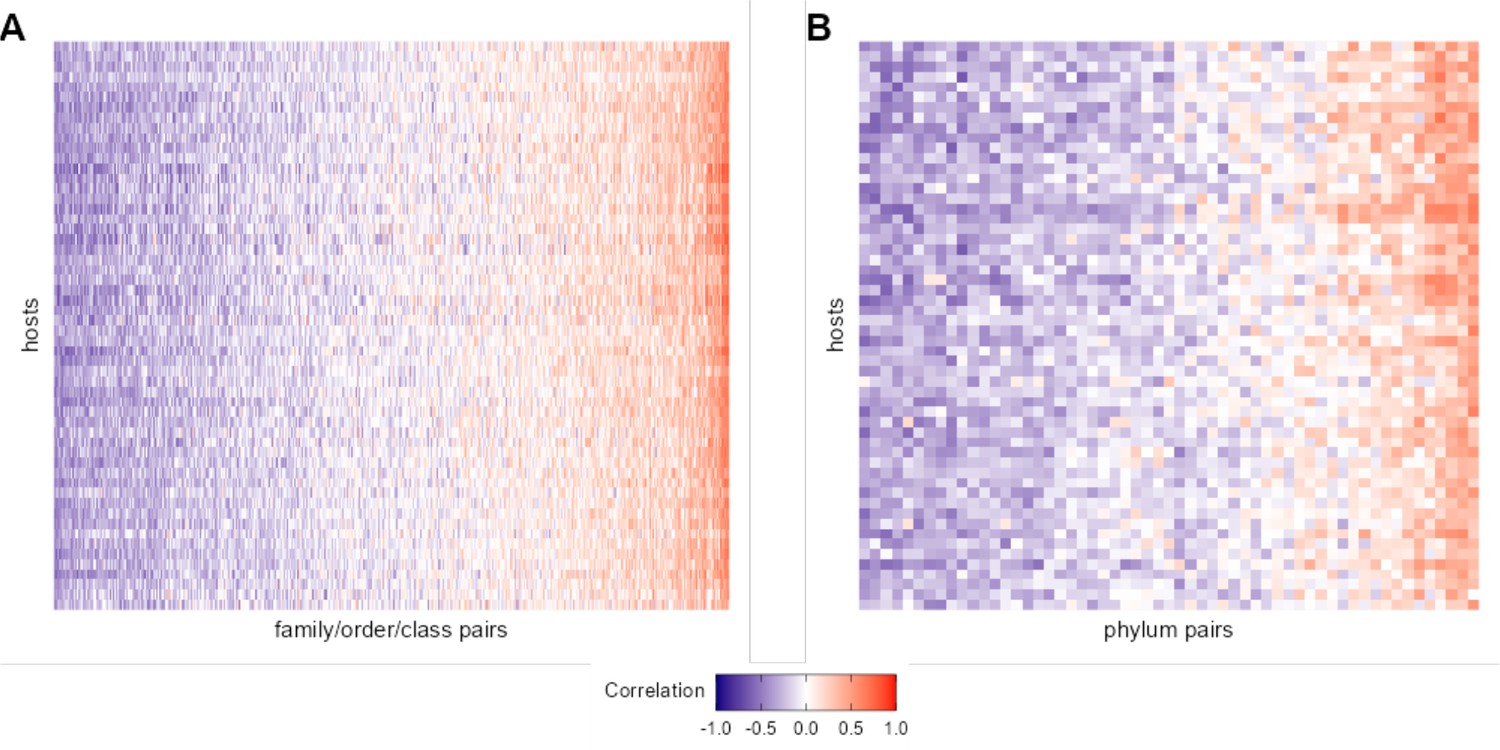
Heat maps of correlation of centered log-ratio (CLR) taxon pairs at taxonomic levels higher than amplicon sequence variant (ASV).
Each heat map shows the Pearson’s correlation coefficient of CLR abundances between pairs of taxa that met our filtering criteria (x-axis) in each of the 56 baboons (y-axis). Panel (A) gives 473 pairs of taxa agglomerated to the most granular possible family, order, or class. Panel (B) gives 57 phylum-phylum pairs. See Figure 2A for a heat map of ASV-ASV correlation patterns across hosts.
Figure 2—figure supplement 2
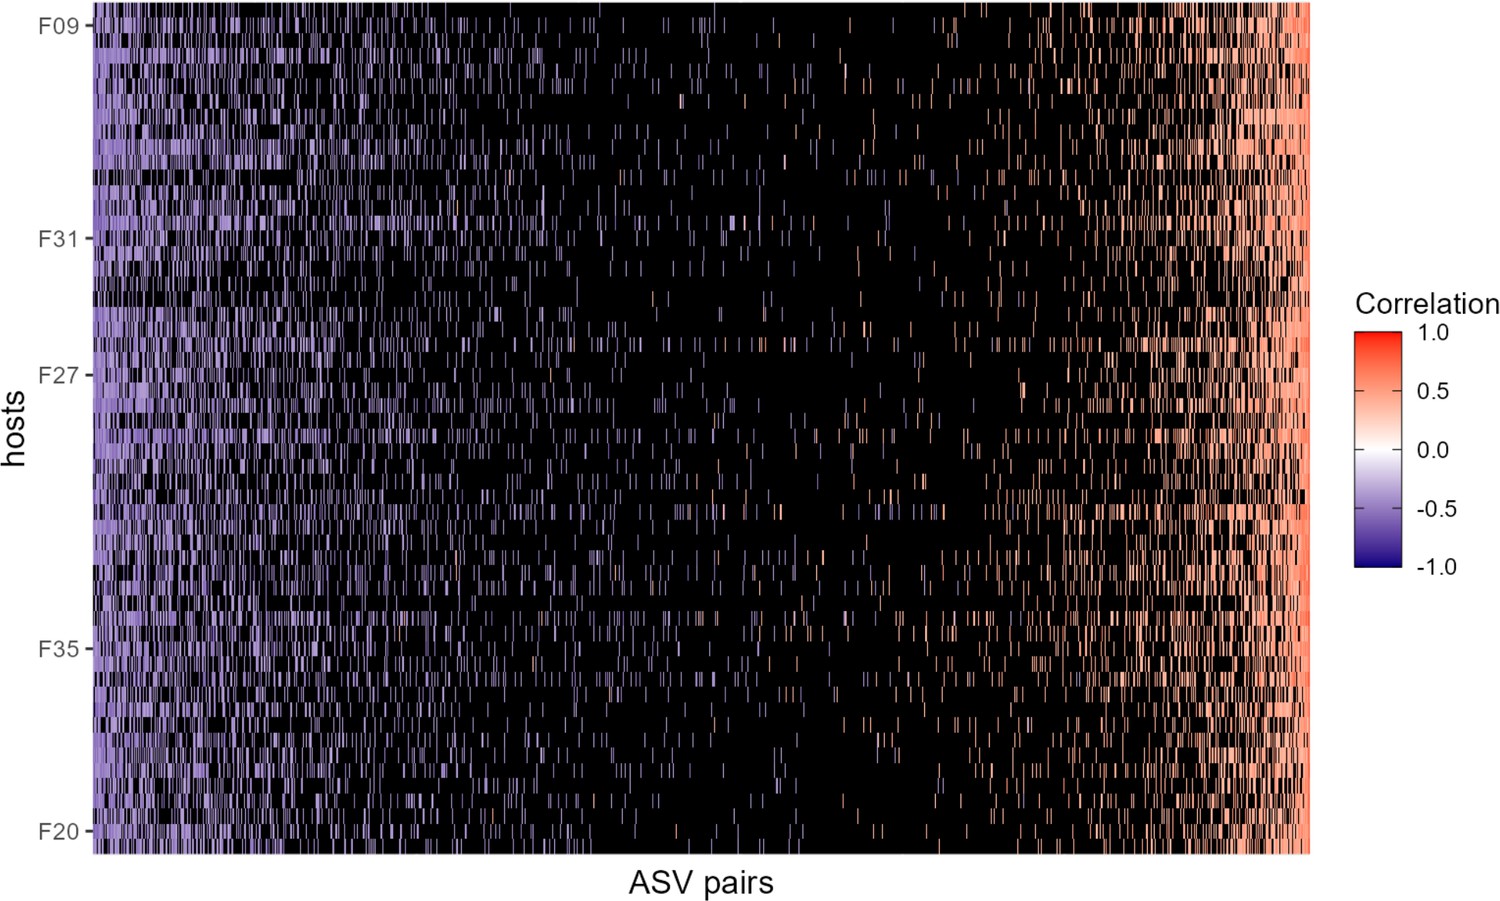
Heat map of correlation of amplicon sequence variant (ASV)-level centered log-ratio (CLR) taxon pairs where pairs not exceeding confidence cutoffs have been omitted.
This heat map is identical to the one shown in Figure 2A in the main text, but black cells represent host-level ASV pairs whose estimated CLR correlation did not exceed the confidence cutoffs described in Figure 2—figure supplement 3, that is a CLR ASV-ASV correlation of less than –0.342 or greater than 0.328. The orientation of rows and columns is the same as in Figure 2A.
Figure 2—figure supplement 3
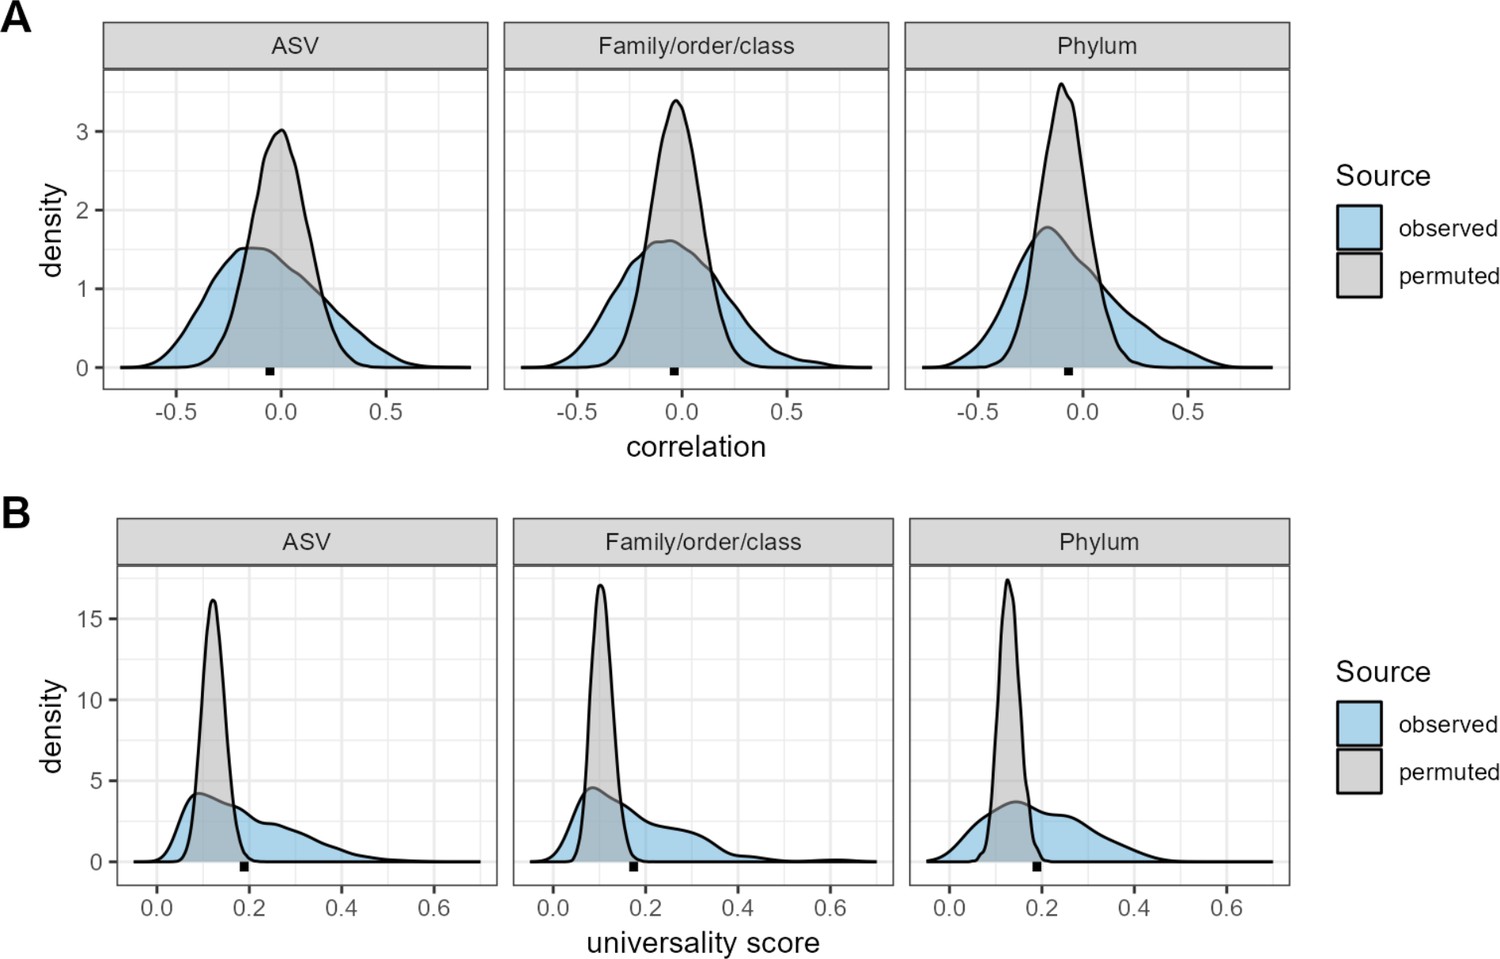
Confidence cutoffs for correlations and universality scores.
The three plots in panel (A) show density distributions of the observed correlations between taxa (blue distributions) compared to random expectation (gray distributions) for three taxonomic partitions of the data: amplicon sequence variants (ASVs), family/order/class-level assignments, and phyla. The random distributions were generated by permuting the data 10 times per-host, shuffling taxonomic identities within individual microbiome samples and re-calculating taxon-taxon correlations in these permuted data sets. Mean correlations for the observed distributions are shown as black points below each distribution. The observed correlations for ASVs range from –0.767 to 0.904 (mean = –0.009; median = –0.010); for family/order/class designations range from –0.719 to 0.803 (mean = –0.028; median = –0.029); and for phyla from –0.645 to 0.687 (mean = –0.088; median = –0.092). Panel (B) shows density distributions of the observed universality scores in blue compared to random expectations in gray, for pairs of taxa at the ASVs, family/order/class-level, and phyla. Small, dashed black lines underneath each density indicate the mean observed universality score at that taxonomic level.
Figure 2—figure supplement 4
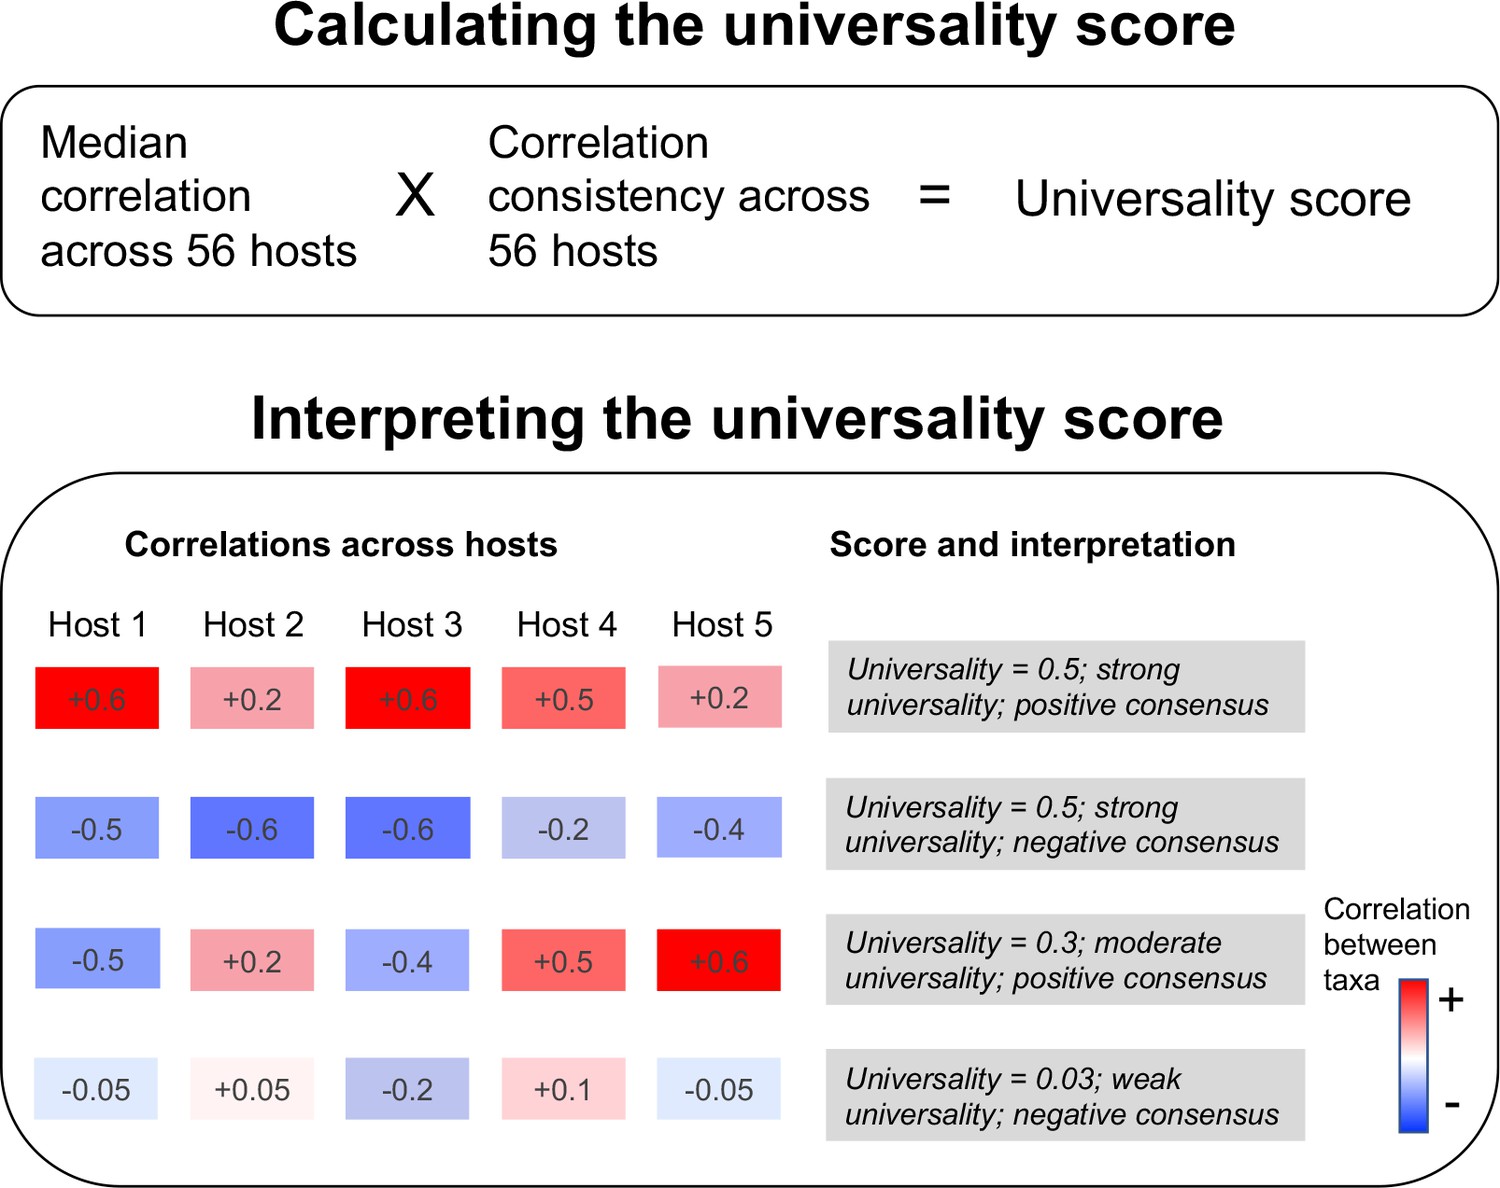
Our universality score identifies the bacterial pairs that exhibit the most consistent relationships across hosts.
The score multiplies the pair’s median correlation coefficient across hosts with its correlation consistency across hosts (i.e. proportion of hosts in which the correlation has the same sign, either positive or negative). The resulting scores range from 0 to 1, where a score of 1 equates to perfect ‘universality’ (i.e. all hosts have a correlation coefficient of 1 or all hosts have a correlation coefficient of –1). The second panel illustrates the calculation of the score for 4 hypothetical taxa pairs across 5 hosts.
Figure 3 with 2 supplements
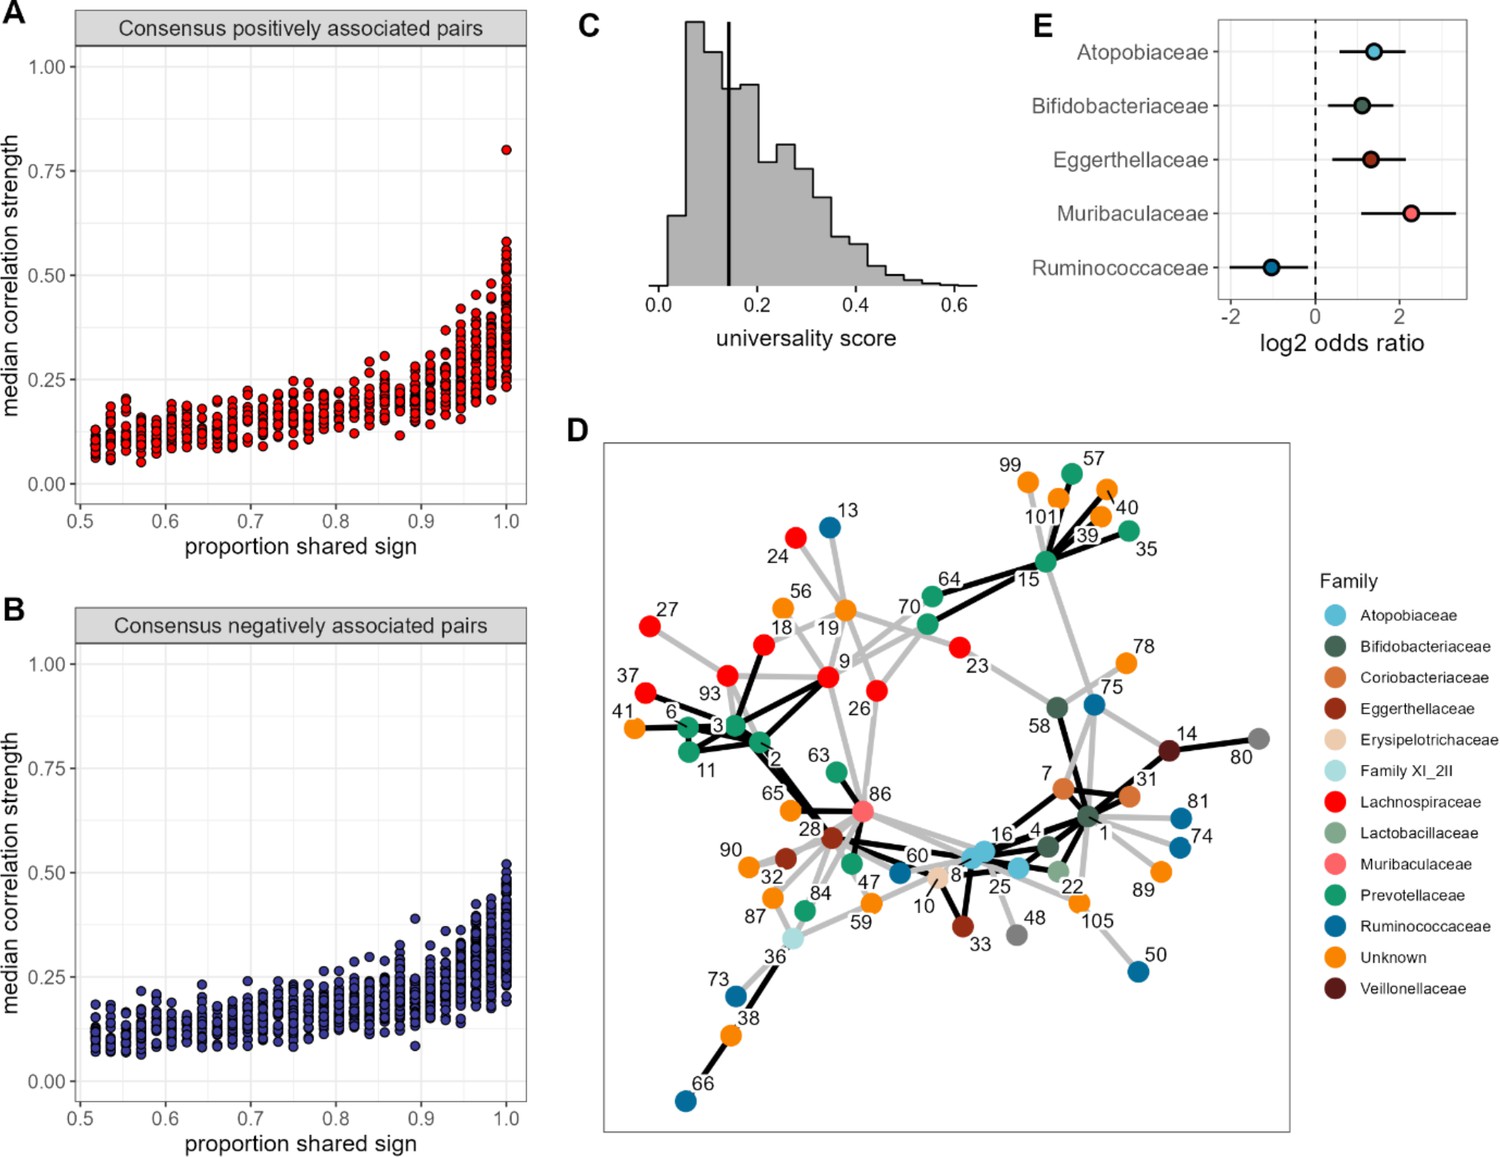
None of the amplicon sequence variant (ASV) pairs were strongly and inconsistently correlated across hosts, and the strongest and most consistently correlated ASVs are typically positively correlated.
Plots in (A) and (B) show the median correlation strength for each ASV-ASV pair across all 56 hosts as a function of the consistency in direction of that pair’s correlation across hosts, measured as the proportion of hosts that shared the majority correlation sign (positive or negative; ASV pairs that were positively correlated in half of the 56 hosts have a consistency of 0.5; ASV pairs that were positively [or negatively] correlated in all hosts have a consistency of 1.0). Panel (A) presents this relationship for consensus positively correlated features and panel (B) shows consensus negatively correlated features. The Spearman’s correlation between median correlation strength and the proportion of shared sign for all correlated features is 0.844 (p<0.0001). Multiplying the two axes in either panel (A) or (B) creates a ‘universality score’ (Figure 2—figure supplement 4), whose distribution is shown in panel (C). This score reflects the strength and consistency of pairwise microbial correlations across hosts and ranges from 0 to 1, where a score of 1 indicates ASV-ASV pairs with perfect correlations of the same sign in all hosts. A vertical line indicates the minimum significant universality score. (D) Correlation networks for the top 5% most strongly and consistently correlated ASV pairs across hosts (i.e. the top 5% highest universality scores; pairs with rank 1–93 in Supplementary file 1d). Network edges are colored by the consensus sign of the correlation between that pair (black for pairs where most hosts had a positive correlation; gray for pairs where most hosts had a negative correlation). Node labels indicate the ASV identity in Supplementary file 1a and colors represent bacterial families. (E) Significantly enriched bacterial families in the network in panel D (Fisher’s exact test p<0.01 all, FDR≤0.05; see Supplementary file 1e enrichment statistics for all families).
Figure 3—figure supplement 1
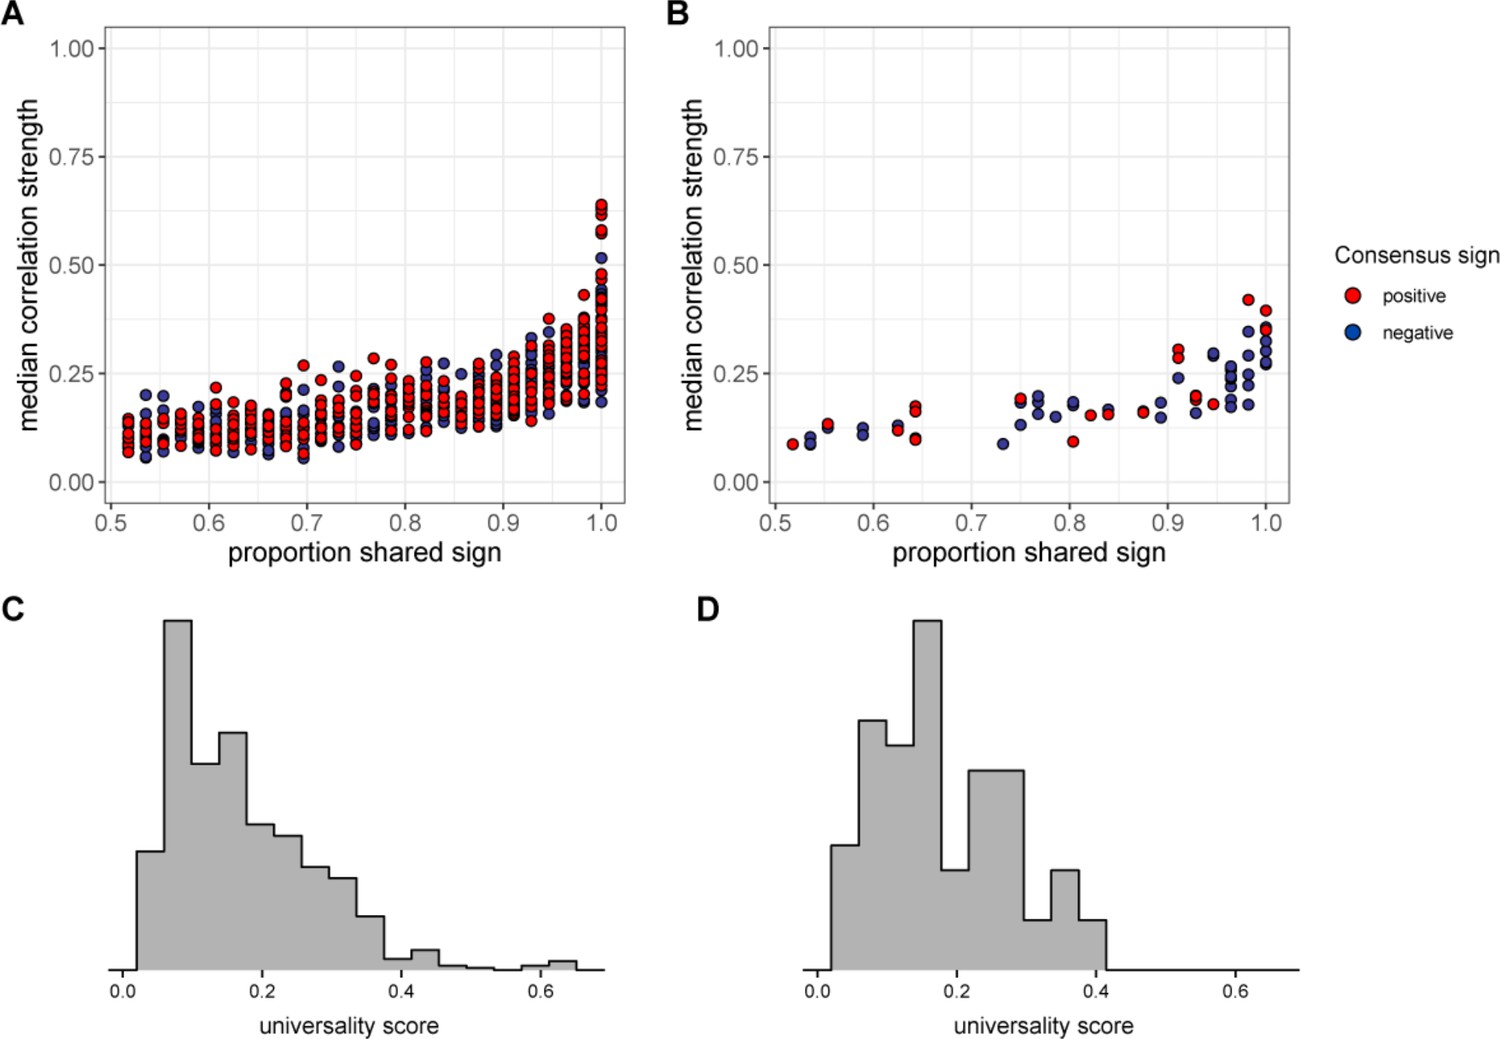
Universality at taxonomic levels higher than amplicon sequence variant (ASV).
The plot in (A) shows the median absolute value of each family/order/class pair’s correlation coefficient across hosts as a function of correlation consistency, measured as the proportion of hosts that shared the majority correlation sign (positive or negative; taxon pairs that were positively correlated in half of the 56 hosts have a consistency of 0.5; pairs that were positively [or negatively] correlated in all hosts have a consistency of 1.0). Panel (B) plots the same estimates for phylum-phylum pairs. Multiplying the two axes in panels (A) and (B) creates a universality score reflecting the strength and consistency of pairwise microbial correlations across hosts. Universality score distributions for family/order/class pairs are shown in panel (C) and scores for phylum pairs are shown in panel (D).
Figure 3—figure supplement 2
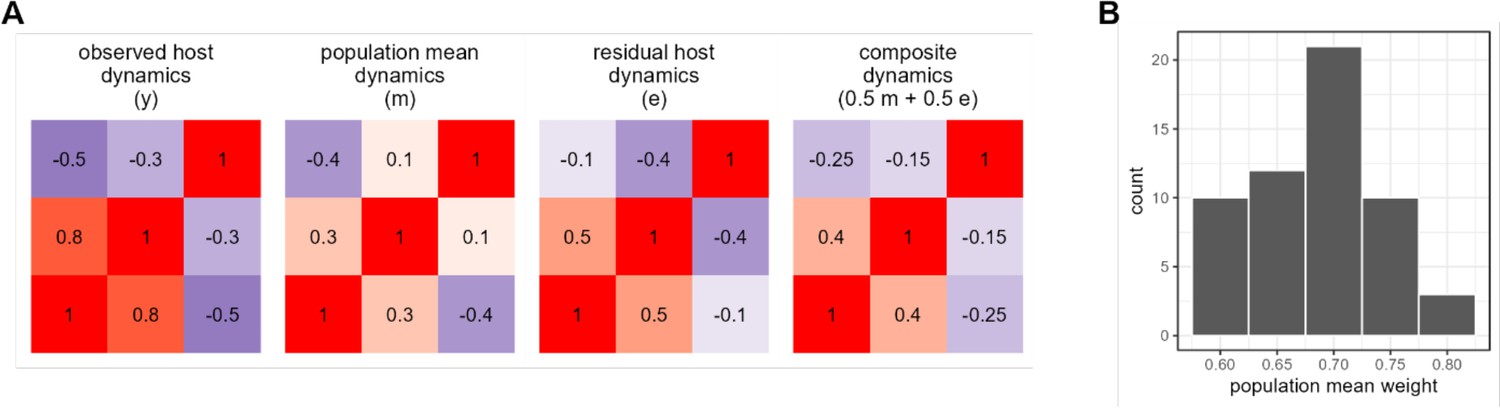
Quantifying the relative strength of universal versus individualized dynamics.
Panel (A) shows observed (y), population mean (m), and host residual dynamics (e = ym) for a single hypothetical host with three amplicon sequence variants (ASVs). The fourth matrix shows a simulated case where host-level and population-level mean dynamics are added in equal proportions (0.5m + 0.5e) to approximate y. We estimate the proportion host- versus individual-level signal as the combination of mean and residual which best approximates y. Panel (B) shows the results of this procedure applied to the Amboseli data, giving a per-host estimate of population-level contribution to the observed centered log-ratio (CLR) ASV-ASV correlations.
Figure 4 with 5 supplements
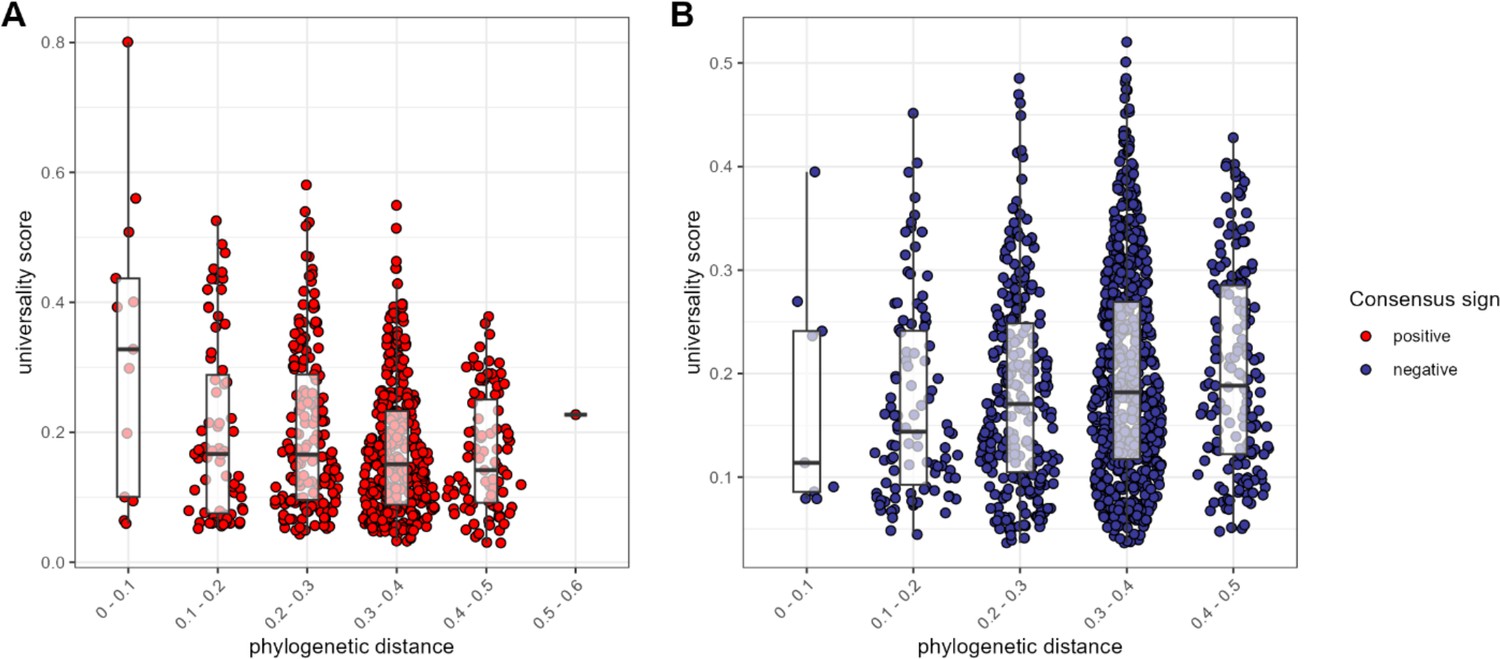
The most consistent amplicon sequence variant (ASV)-level correlations are positive and often between close evolutionary relatives.
Pairwise universality scores are plotted as a function of phylogenetic distance between the ASV-ASV pair for consensus positively correlated pairs in red (A) and negatively correlated pairs in blue (B). Phylogenetic distance (x-axis) is binned into 0.1 increments; each point represents a given ASV pair, and box plots represent the median and interquartile ranges for a given interval of phylogenetic distance. Phylogenetic distance is negatively correlated with universality score in positive pairs (Pearson’s correlation for positively associated ASV pairs = −0.232, p-value <0.0001), and positively correlated with universality score in negatively associated pairs (Pearson’s correlation for negatively associated ASV pairs = 0.106, p=0.004). Full estimates are given in Supplementary file 1f.
Figure 4—figure supplement 1
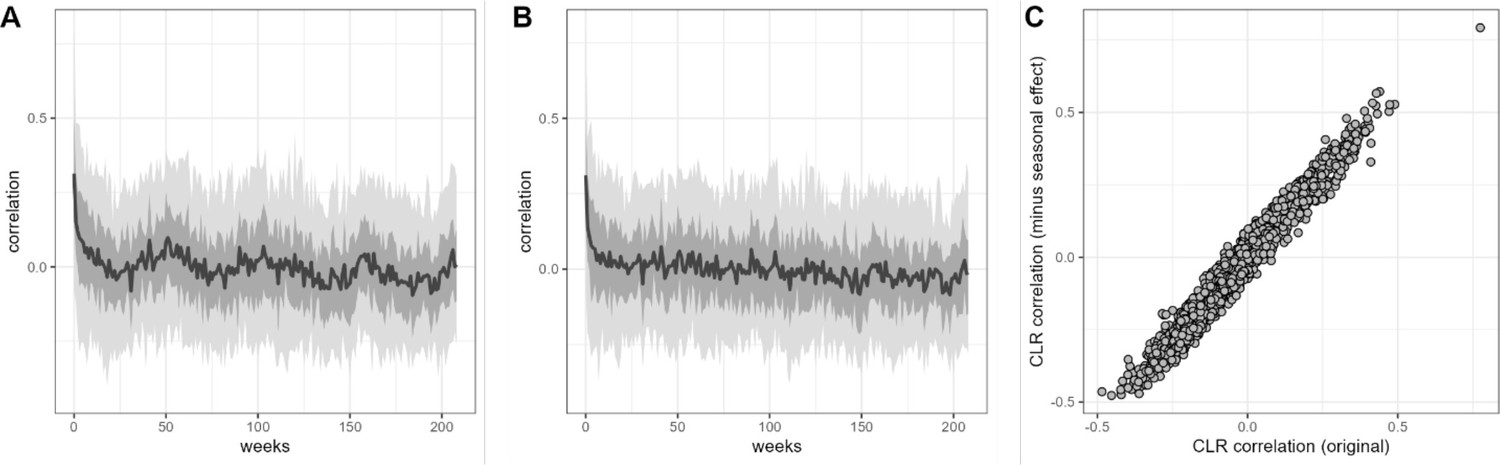
Estimates of centered log-ratio (CLR) ASV-ASV correlation are similar after removing seasonal trend.
Panel (A) shows sample-sample autocorrelation estimates for the CLR-transformed data from 56 baboon hosts. Panel (B) shows sample-sample autocorrelation for the same data after the removal of a seasonal trend by arima() in R. Estimates of CLR ASV-ASV correlation derived from the original (basset) model and this per-ASV linear autoregressive model is highly similar, as shown in panel (C) where r=0.982. ASV, amplicon sequence variant.
Figure 4—figure supplement 2
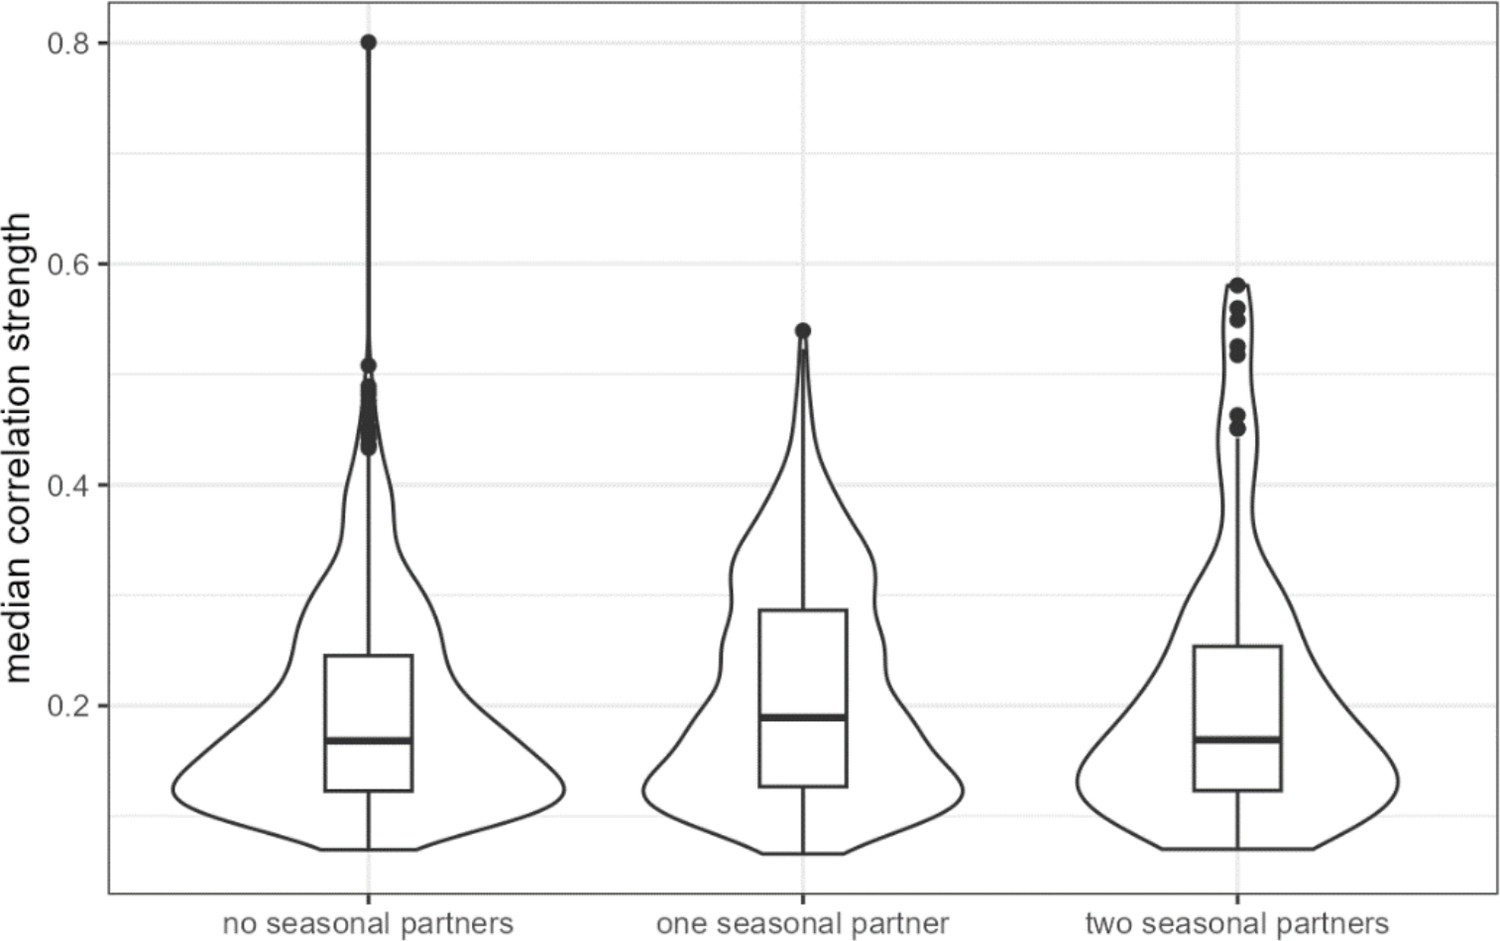
ASV-ASV pairs with two ‘seasonally varying’ partners have slightly higher median correlations across hosts.
‘Seasonally varying’ ASVs were those identified as having seasonally differential centered log-ratio (CLR) abundance in Björk et al., 2022. ASV-ASV pairs with at least one ‘seasonal’ member had significantly higher median correlation across hosts than did pairs where neither partner was seasonal (difference of 0.018, Wilcoxon rank sum test p = 0.000326). ASV, amplicon sequence variant.
Figure 4—figure supplement 3
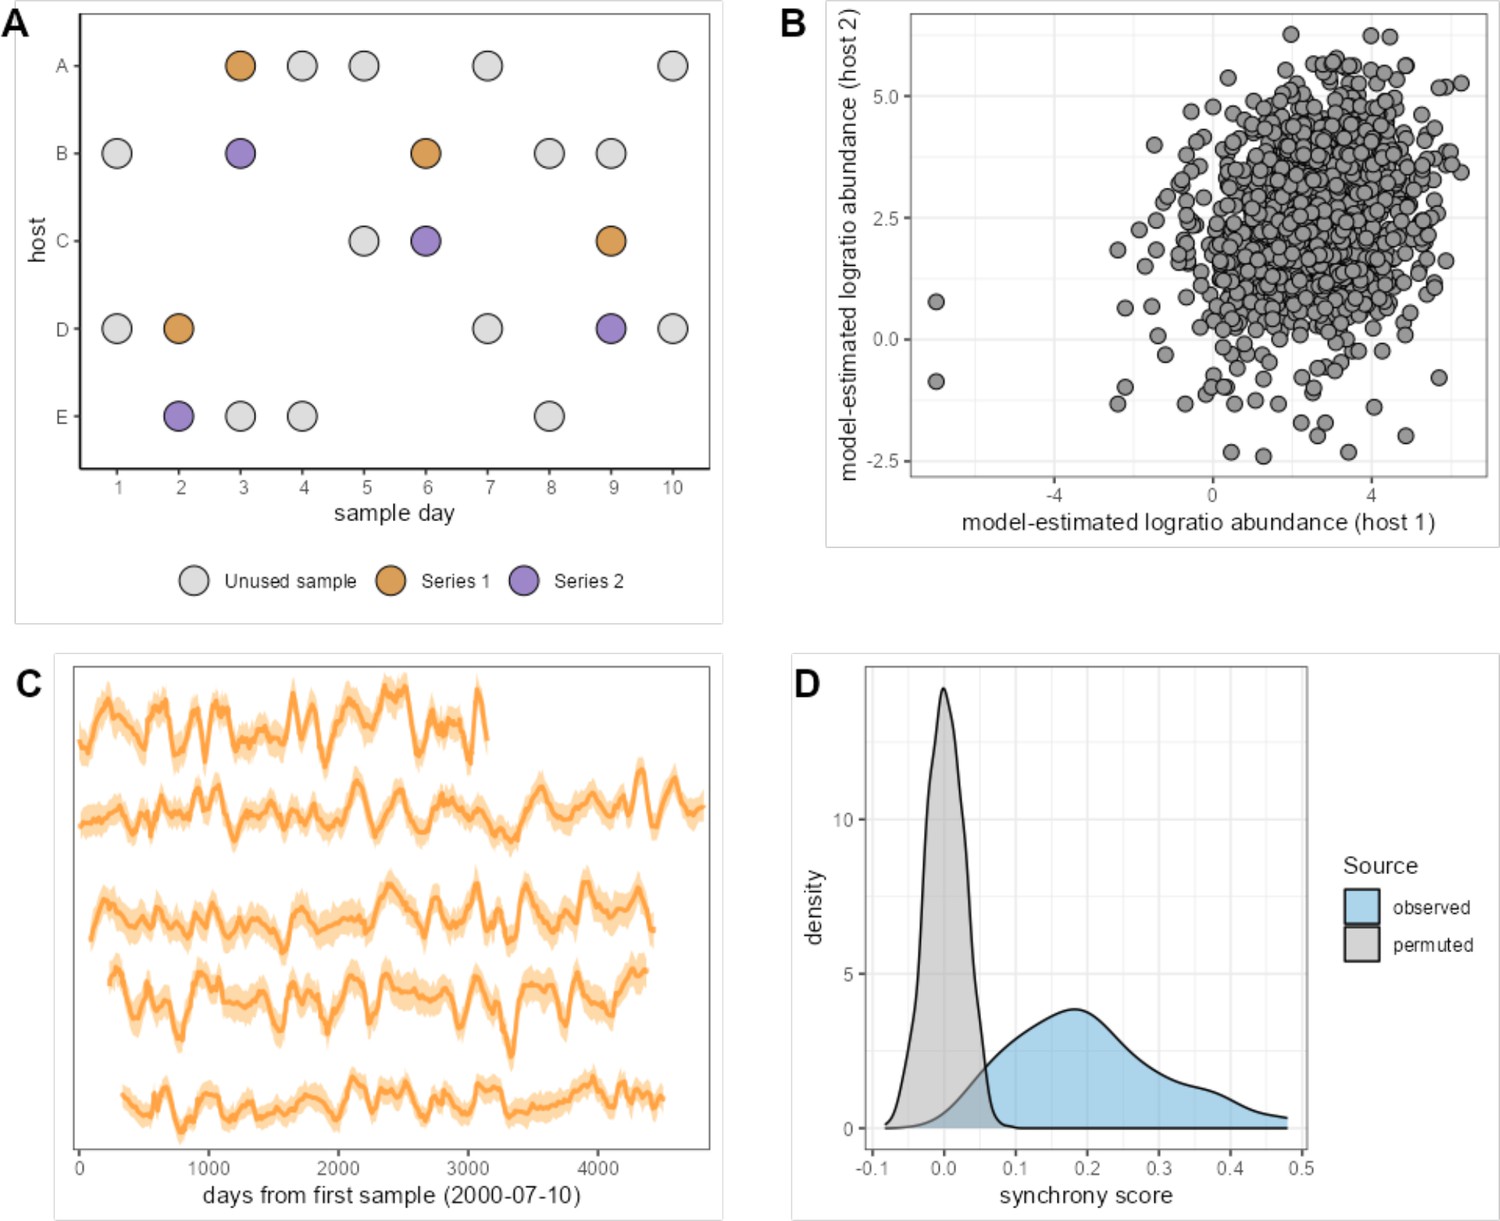
Measuring synchronized dynamics in the same amplicon sequence variant (ASV) across many hosts.
The cartoon in panel (A) shows the sample selection procedure. We selected pairs of samples from different hosts collected within 24 hr of each other, producing 20,000 ‘same-day’ pairs (e.g. purple and mustard-colored pairs on days 2, 3, 6, and 9). We subset these pairs to one same-day pair per host pair, producing 1540 same-day pairs from these thinned host series and extracted the correlated ASV abundance from these pairs. Synchrony for a given taxon is estimated as the correlation of the centered log-ratio abundance of that taxon across Series 1 and 2. Panel (B) shows the correlation between log-ratio abundance estimates in paired host samples for the most synchronous taxon, ASV #21 (Clostridiaceae 1; r = 0.480). Panel (C) shows the time-aligned model-estimated centered log-ratio abundances of ASV #23 in five well-sampled hosts that each lived in a different baboon social group (hosts from top to bottom are F09, F31, F35, F27, F20). Panel (D) shows the distribution of observed synchrony estimates for all 125 ASVs (light blue) compared to synchrony estimates from a permuted/null distribution (gray); 118 of 125 ASVs had significantly higher synchrony than expected (FDR≤ 0.05; permutation scheme).
Figure 4—figure supplement 4
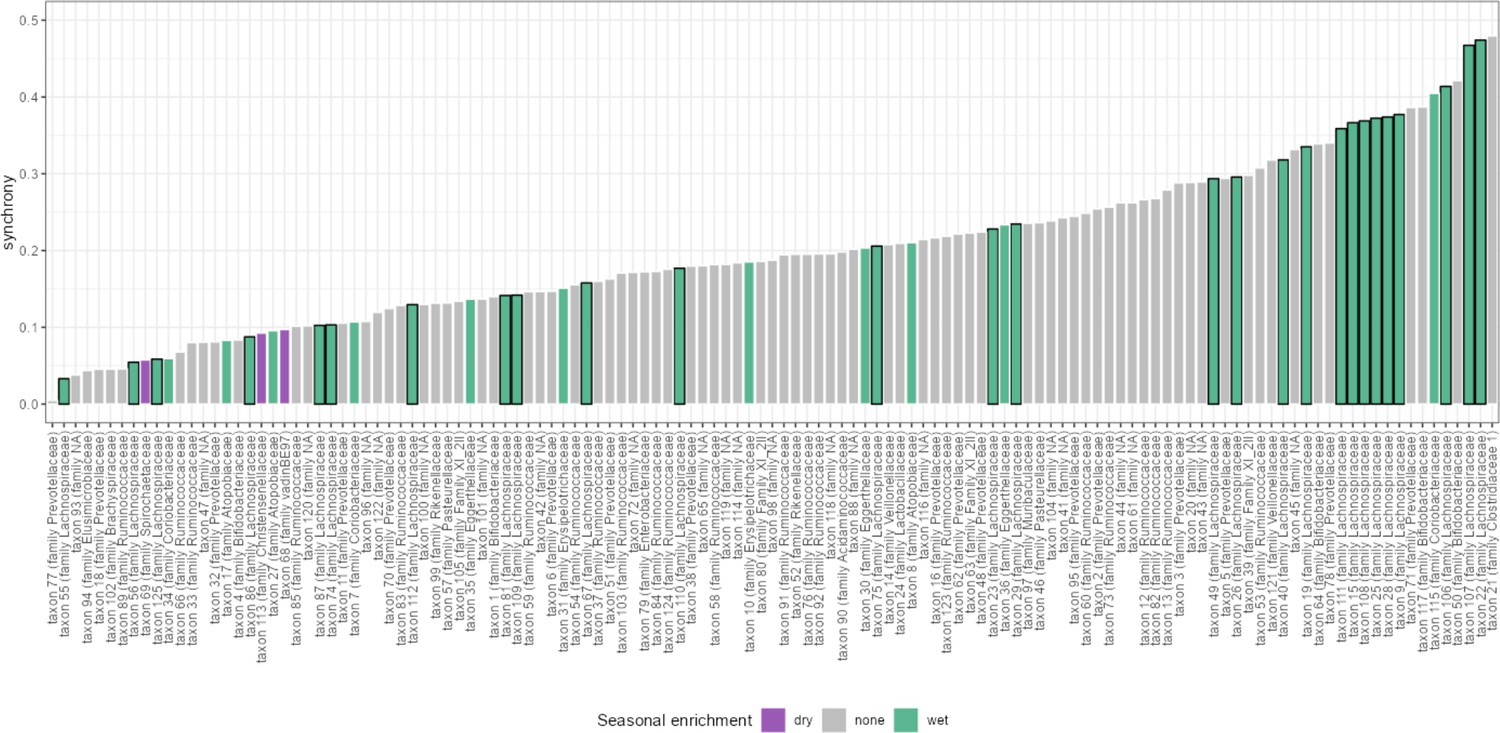
Seasonality is not associated with synchrony.
Synchrony estimates for all amplicon sequence variants (ASVs) are given as bar plots. ASVs that were identified as having seasonally differential centered log-ratio (CLR) abundance in Björk et al., 2022, are labeled by the season in which they were more abundant: dry or wet. Seasonally variable labels do not predict synchrony (ANOVA, p=0.358).
Figure 4—figure supplement 5
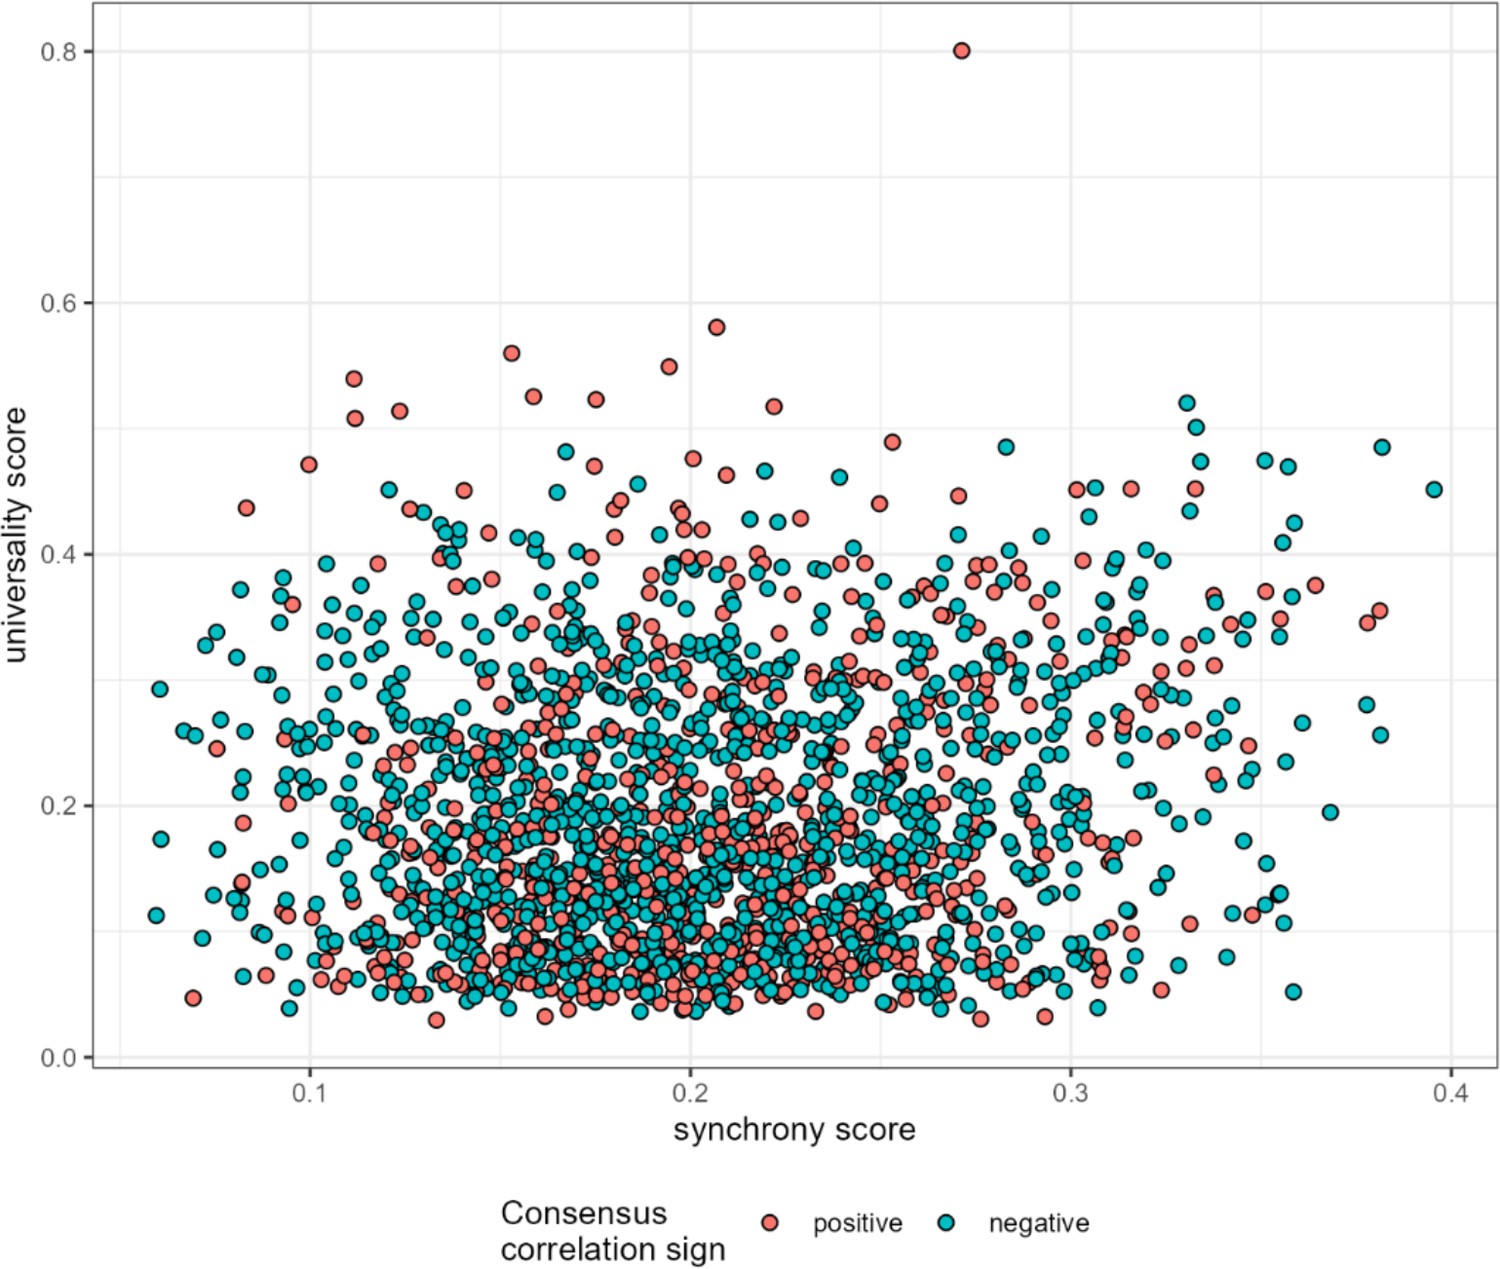
Synchrony weakly predicts universality.
Mean ASV-ASV pair synchrony estimates are plotted against universality scores for all 1878 high-confidence ASV pairs. Synchrony weakly predicts universality (r=0.116, p<0.0001). ASV, amplicon sequence variant.
Figure 5 with 3 supplements
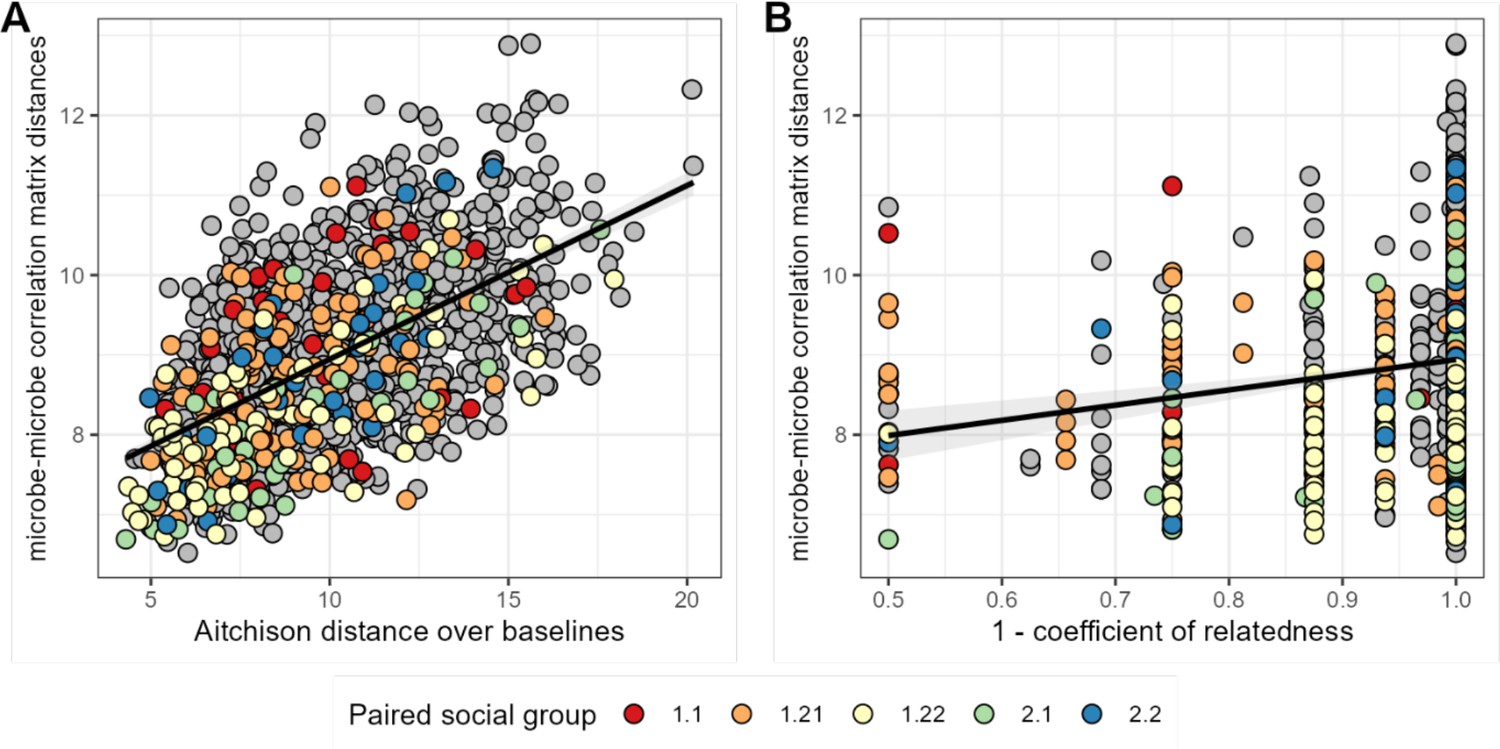
Baboons with more similar bacterial correlation patterns are more likely to have more similar baseline microbiome compositions and are slightly more likely to be genetic relatives.
In panel (A) each point is a pair of hosts; the y-axis shows the similarity of these hosts’ bacterial correlation patterns (via Frobenius distance) as a function of their microbiome compositional similarity (via Aitchison distance; Mantel: r2=0.336; p=0.001). Colors show samples from pairs of baboons living in the same social group and gray dots are pairs of animals living in different social groups. There is no detectable effect of social group on correlation pattern similarity. Panel (B) shows the same distances as a function of host genetic dissimilarity (1 – the coefficient of genetic relatedness between hosts; r2=0.009; p-value Mantel test 0.002). Colors reflect pairs of hosts living in the same social group, as in panel A.
Figure 5—figure supplement 1
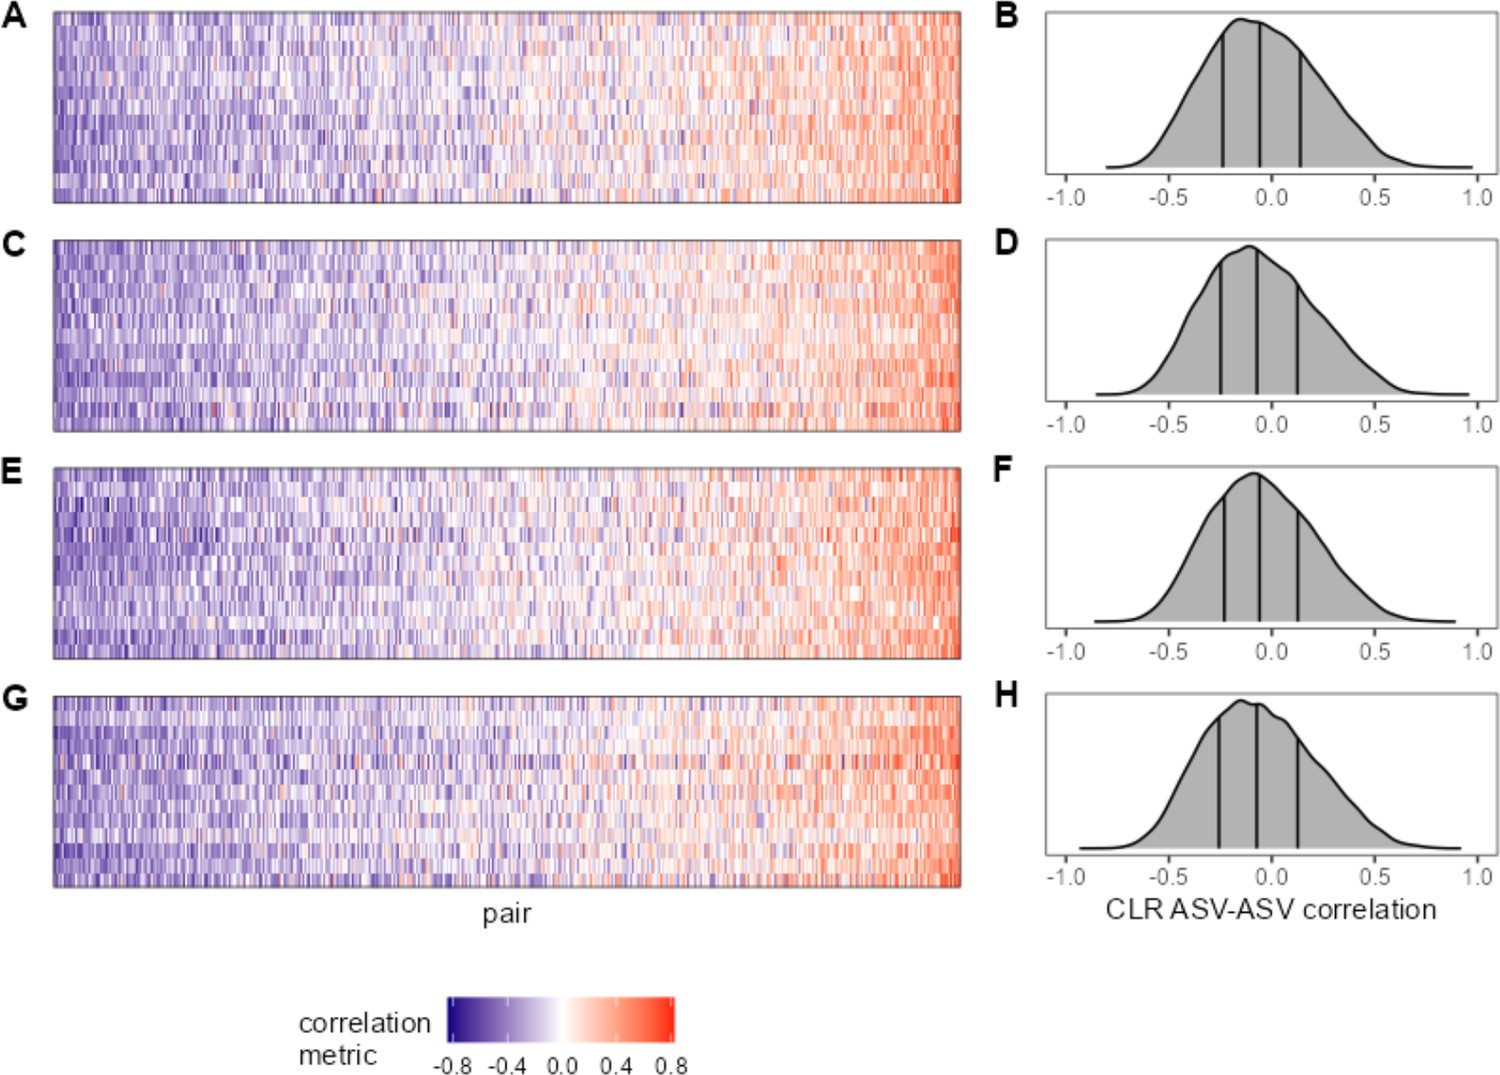
Within- and between-age bin ASV-ASV correlations are similar.
For a subset of hosts with sufficient sampling across age ‘bins’ (at least 35 samples within two of the following age ranges: juvenile = 0–6 years; prime age adult = 6–13 years; older adult = 13+ years), ASV-ASV correlation is visualized as a heat map. Panel (A) shows ‘juvenile’ ASV-ASV correlations for hosts F32, F06, F27, F36, F10, F01, F07, F35, M09, F05, M10, F22, F26 (top row to bottom) and (B) the distribution of those correlations. Panels (C) and (D) give ‘prime age’ correlations for the same hosts. Panel (E) shows prime age ASV-ASV correlations for the hosts F28, F17, F16, F31, M03, M08, F04, F12, F03, F33, M02, F14, F08 (top row to bottom) and (F) the distribution of those correlations. Panels (G) and (F) give ‘older adult’ correlations for the same hosts. ASV, amplicon sequence variant.
Figure 5—figure supplement 2
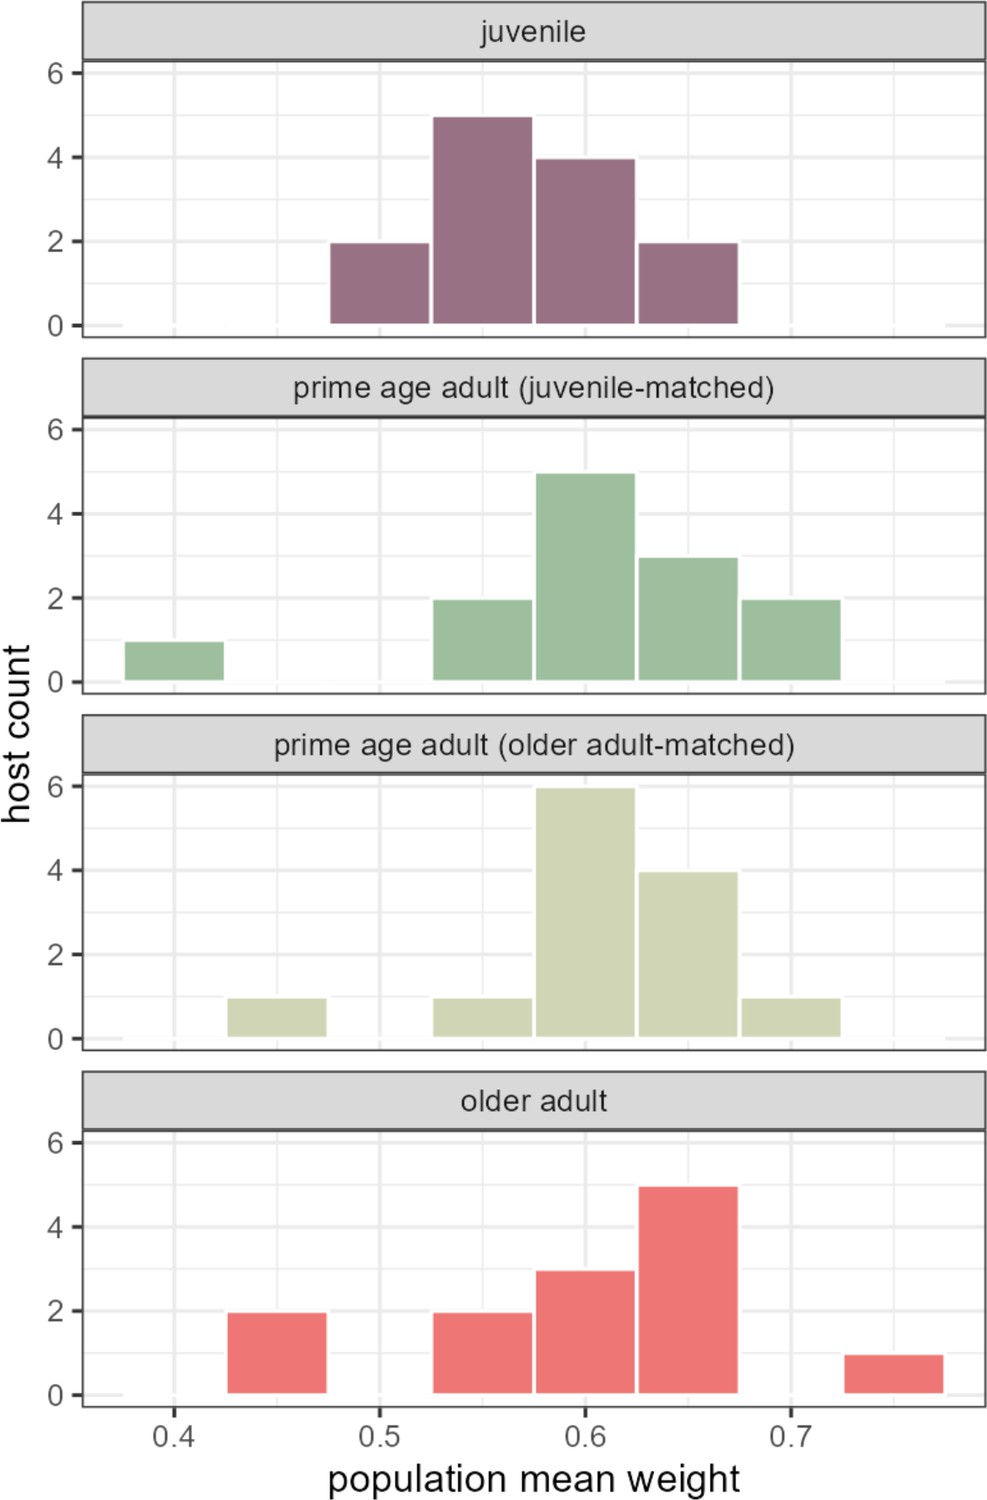
Quantifying the relative strength of universal versus individualized dynamics across age ranges.
Histograms show estimates of the population-level contribution to observed centered log-ratio (CLR) ASV-ASV correlations in each 13-host age bin. (Hosts are matched between age bins where noted.) Variation in the population-level contribution to observed CLR ASV-ASV correlations is slightly, but not significantly, larger in the prime age and older adult bins than in the juvenile bin. Compare these estimates to those obtained for overall hosts series in Figure 3—figure supplement 2. ASV, amplicon sequence variant.
Figure 5—figure supplement 3
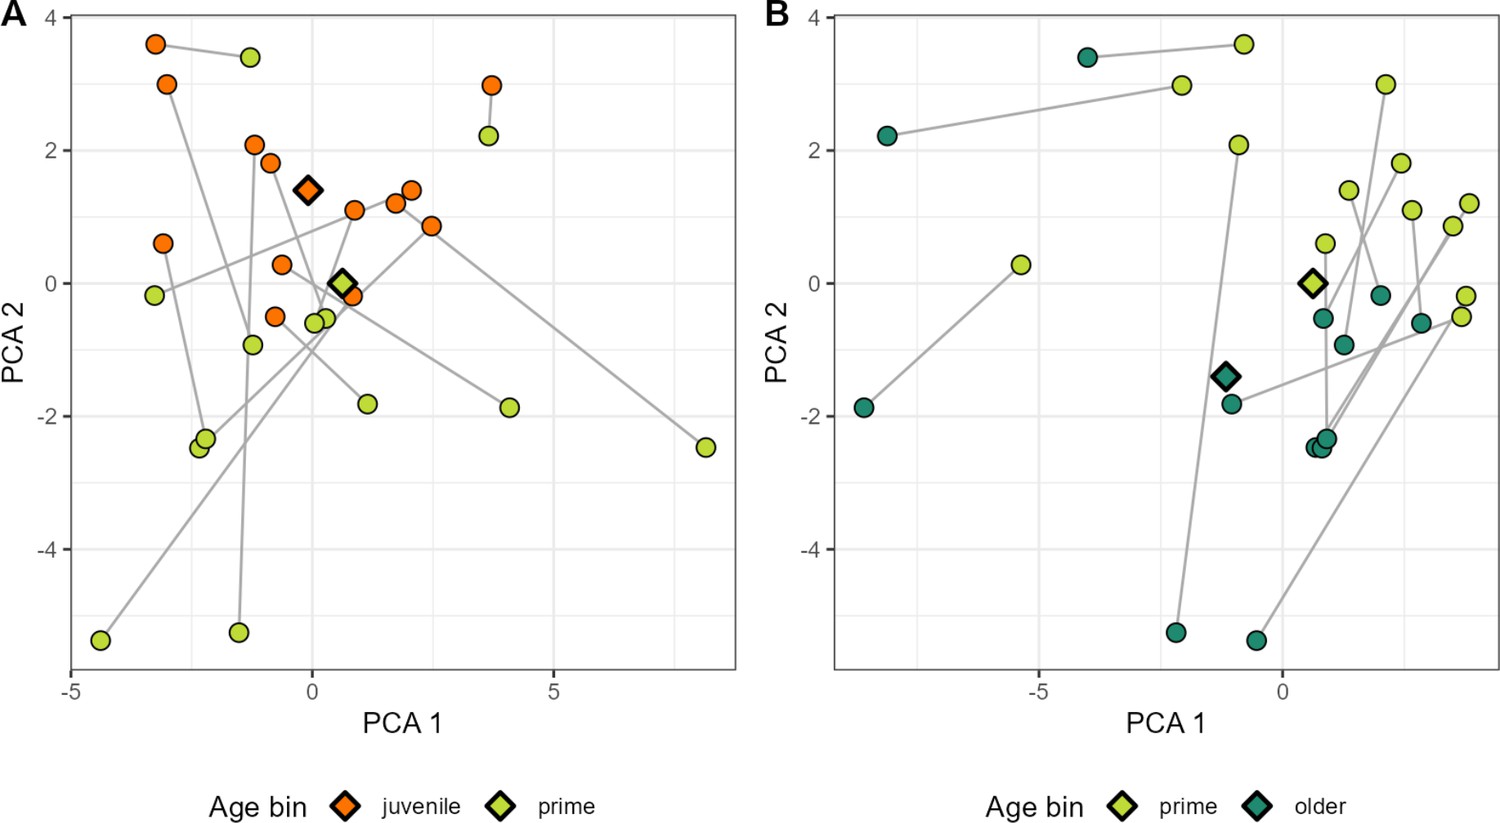
PCA plot of ASV-ASV correlations within age bins for a select set of hosts.
For a subset of hosts with sufficient sampling across age ‘bins’ (at least 35 samples within two of the following age ranges: juvenile = 0–6 years; prime age adult = 6–13 years; older adult = 13+ years), ASV-ASV correlation is visualized along principal components (PCs). Circles indicate the set of correlation estimates for a particular host within a particular age bin. Circles in panel (A) refer to ‘juvenile’ and ‘prime age’ hosts in orange and green; panel (B) refers to ‘prime age’ and older adults in light and dark green. Estimates across age bins (e.g. juvenile vs. prime age) for the same host are linked by a gray line. Diamonds indicate the centroid for each age bin. For the juvenile vs. prime age comparison in panel A, the ASV pair contributing most strongly to variation along PC1 was a genus Libanicoccus-genus Bifidobacterium pair (ASV16-ASV58). The pair contributing most strongly to placement along PC2 was a genus Lactobacillus-order Clostridiales pair (ASV22-ASV36). In the prime age adult vs. older adult embedding in panel B, the ASV pair which contributed the most to variation along PC1 was a genus Prevotella 9-unknown bacterium pair (ASV2-ASV40). The pair with the greatest contribution to PC2 was another taxonomically unresolved bacterium (ASV41) in combination with another member of family Prevotellaceae (ASV64). ASV pairs with the largest loadings in PCs 1 and 2 for both age ranges are given in Table S9. ASV, amplicon sequence variant.
Figure 6
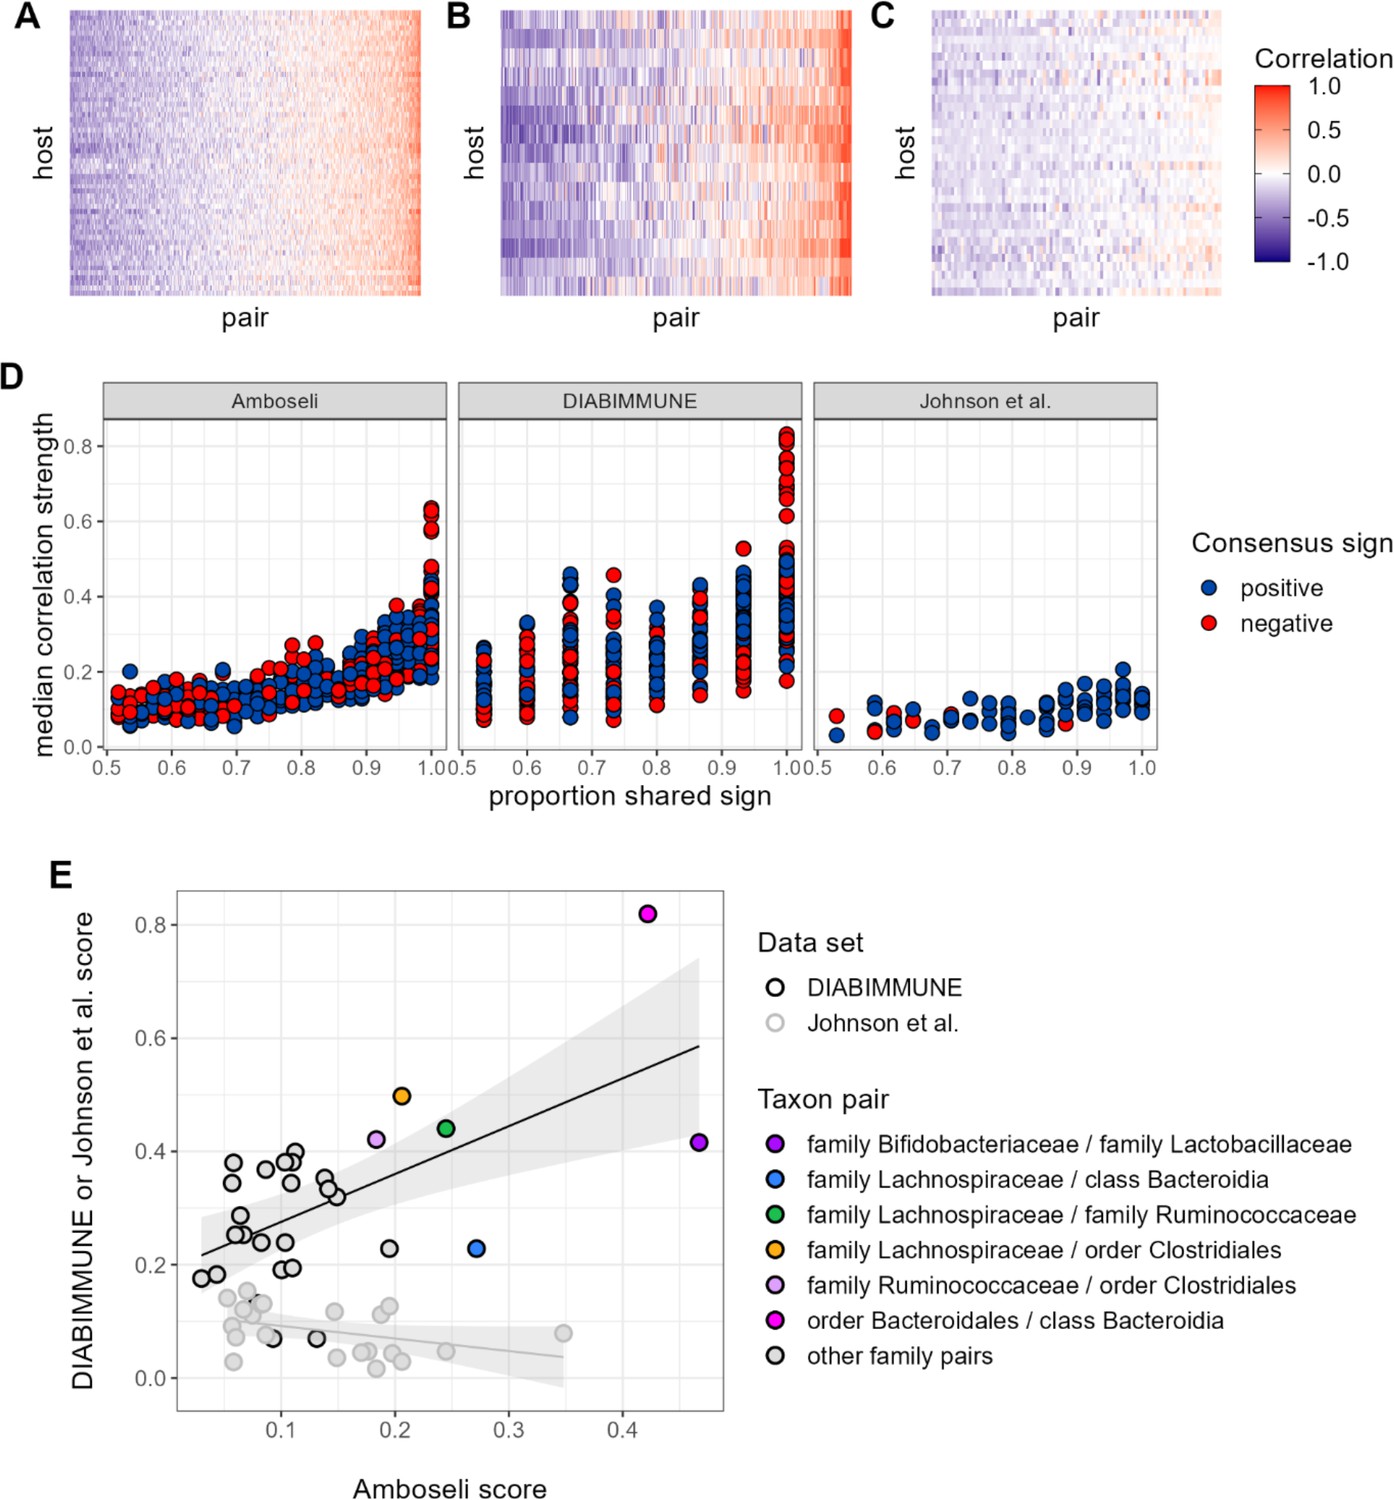
Patterns of universality in baboons are recapitulated in the DIABIMMUNE study.
Following Figure 2A, panels (A), (B), and (C) show the Pearson’s correlation coefficients of centered log-ratio (CLR) abundances between all pairs of families (x-axis) in two time series data sets from human subjects: (A) the Amboseli baboons, (B) the DIABIMMUNE cohort, consisting of 15 infants/toddlers sampled monthly over 3 years in Russian Karelia (Vatanen et al., 2016), and (C) the diet study of Johnson et al., 2019, including 34 adults sampled daily over 17 days. Following Figure 3A and B, panel (D) shows the median correlation strength of each family pair’s correlation coefficient across hosts as a function of the consistency in direction of that pair’s correlation across hosts (i.e. the proportion of hosts that shared the majority correlation sign, positive or negative). Median correlation strength is low overall in Johnson et al. (median = 0.090), whereas the Amboseli baboon and DIABIMMUNE infant/toddler cohorts show similar relationships between median correlation strength and the proportion shared correlation sign across hosts (Spearman’s r in Amboseli = 0.844; Spearman’s r in DIABIMMUNE = 0.690). (E) Universality scores for overlapping family pairs from the infant/toddler subjects of the DIABIMMUNE study and baboons in the Amboseli study are significantly correlated (r=0.784, p=0.00161). Black outlined points are family pairs that overlapped between the Amboseli baboon and DIABIMMUNE infant/toddler data sets; gray outlined points are family pairs that overlapped between the Amboseli and Johnson et al. data sets. Color represents the taxonomic identities of the family pairs.
Additional files
-
Supplementary file 1
Supplementary tables.
- https://cdn.elifesciences.org/articles/83152/elife-83152-supp1-v2.xlsx
-
MDAR checklist
- https://cdn.elifesciences.org/articles/83152/elife-83152-mdarchecklist1-v2.pdf
Download links
A two-part list of links to download the article, or parts of the article, in various formats.
Downloads (link to download the article as PDF)
Open citations (links to open the citations from this article in various online reference manager services)
Cite this article (links to download the citations from this article in formats compatible with various reference manager tools)
Universal gut microbial relationships in the gut microbiome of wild baboons
eLife 12:e83152.
https://doi.org/10.7554/eLife.83152


