Asymmetric inheritance of centrosomes maintains stem cell properties in human neural progenitor cells
- Laboratory of Neural Plasticity, Faculties of Medicine and Science, Brain Research Institute, University of Zurich, Switzerland
- University Research Priority Program (URPP), Adaptive Brain Circuits in Development and Learning (AdaBD), University of Zurich, Switzerland
Figures
Figure 1 with 1 supplement
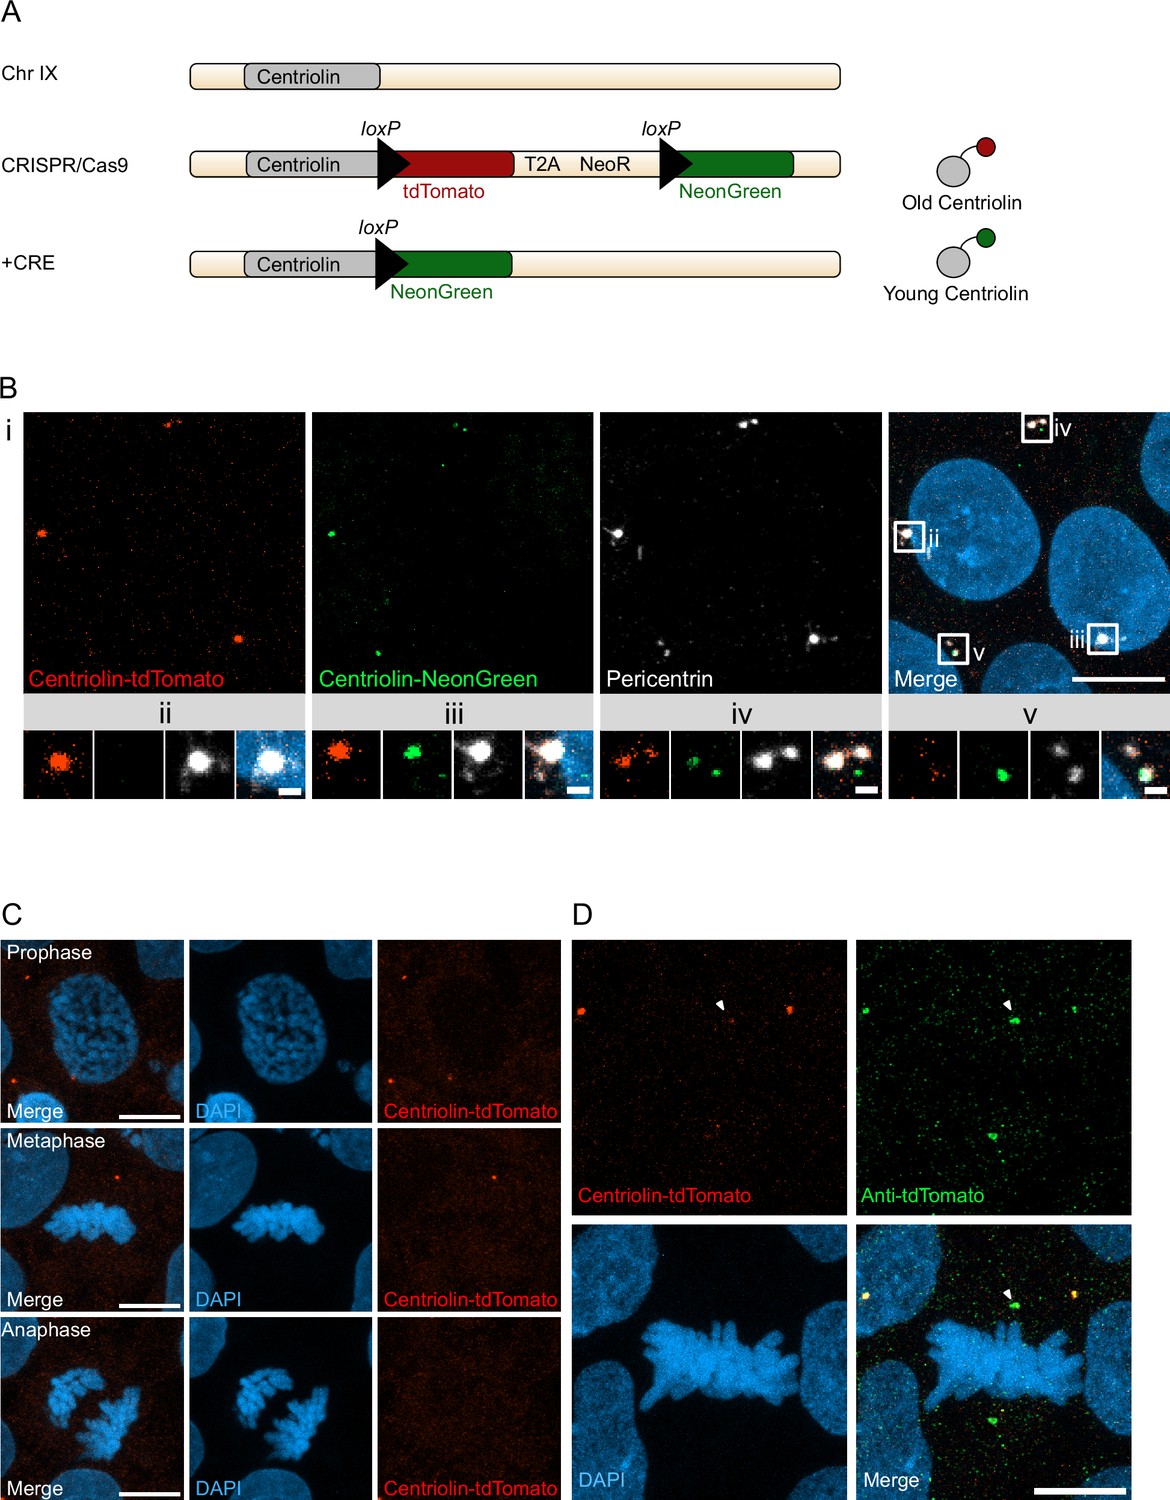
Recombination-induced tag exchange (RITE)-based birthdating of centrosomes.
(A) Centriolin is tagged with the RITE system in human embryonic stem cells (hESCs) so that all Centriolin protein made is tdTomato-tagged. Upon recombination with Cre recombinase, the tdTomato fluorophore is replaced with NeonGreen, making all new Centriolin protein tagged with NeonGreen. Identifying a proteins tag will indicate the proteins age with tdTomato being the oldest, then NeonGreen. (B) Image of hESCs expressing Centriolin-RITE 24 hr post Cre induction. Magnified images show a centrosome that has not recombined (ii), has recombined and contains red and green Centriolin (iii and iv), or only green Centriolin (v). Scale bars, 10 μm (upper panel), 1 μm (magnifications). (C) Signal of Centriolin through mitosis. In prophase centriolin signal is present, however the signal disappears in metaphase and anaphase. Scale bars, 10 μm. (D) Staining for tdTomato protein shows that Centriolin-tdTomato is present at the centrosome during metaphase but that the signal is subsequently quenched. Scale bars, 10 μm.
Figure 1—figure supplement 1
Centrosome analyses in human embryonic stem cells (hESCs).
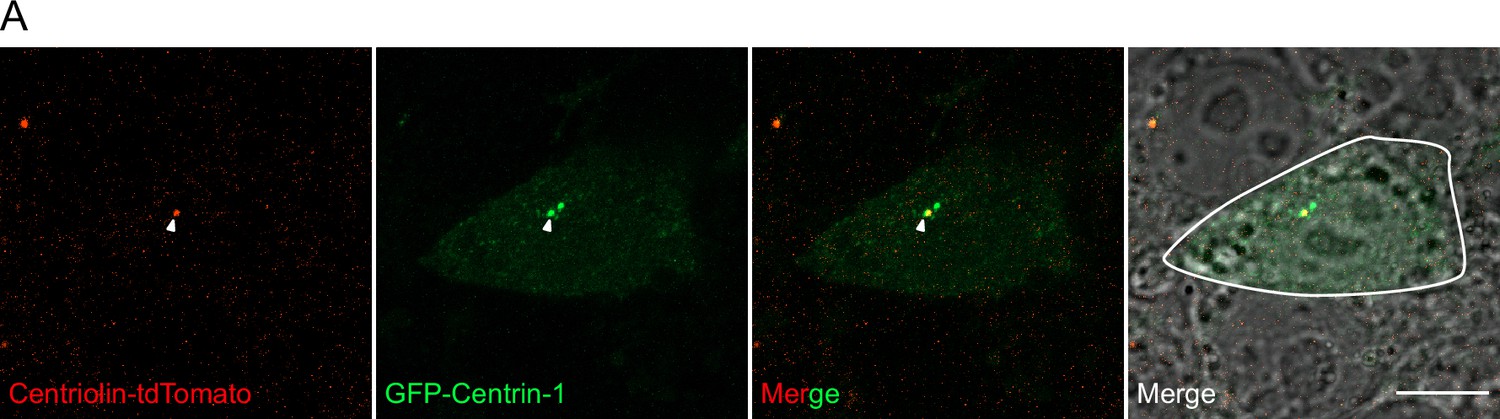
(A) hESC electroporated with GFP-Centrin-1 is outlined in white. Centriolin localises to only one of the two centrioles marked by GFP-Centrin-1. Scale bars, 10 μm.
Figure 2 with 1 supplement
Asymmetric inheritance of centrosomes in human forebrain organoids.
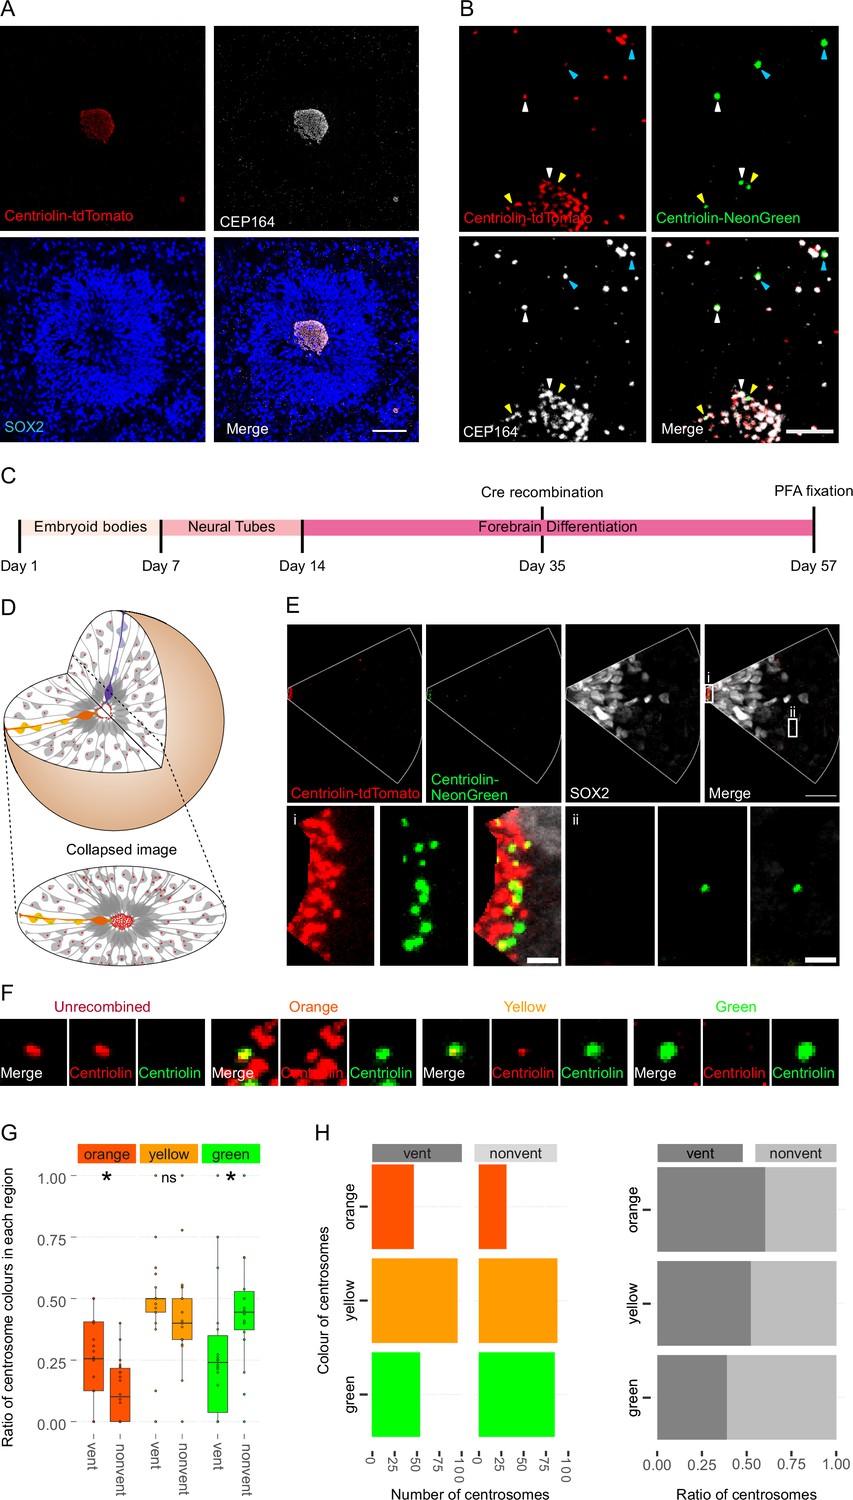
(A) Cortical unit of a day 35 forebrain organoid. The ventricular zone is easily identified by densly packed SOX2-positive neural progenitor cells (NPCs) that form a rosette-like structure around the ventricular centrosomes, shown by Centriolin-tdTomato and the mother centriole marker CEP164. Scale bar, 50 μm. (B) Recombined centrosomes exhibiting variable quantities of the older, Centriolin-tdTomato protein. Arrowheads indicate recombined centrosomes identifiable by the presence of Centriolin-NeonGreen. White arrowheads show centrosomes that have a large quantity of Centriolin-tdTomato present, thus are the oldest. Blue arrowhead indicated centrosomes have visibly less Centriolin-tdTomato, and the yellow arrowhead-depicted have no visible tdTomato signal, suggesting these are the most recently formed centrosomes. Scale bar, 5 μm. (C) Scheme showing the timing of Cre recombination in the context of the organoid protocol. (D) Schematic showing how imaging organoid sections causes the loss of progeny of some NPCs. In this example, two NPCs have recombined (orange and purple) and have produced progeny of a similar colour that migrate away along their radial processes. When imaging sections that include a ventricle, both the orange and purple NPCs’ centrosomes are included in the image. The orange progeny are also included because they migrate away along the x/y-axis of the image. However, as the purple NPCs’ progeny will migrate away along the z-axis, they are not imaged. (E) Example of an analysed image. The ventricular centrosomes are shown in large in (i) and an example of non-ventricular centrosome is shown in (ii). Scale bars, upper panel 20 μm, (i, ii) 2 μm. (F) Representative images that display the criteria of manual colour allocation. Recombined centrosomes signal was compared to unrecombined centrosomes. Centrosomes whose tdTomato signal was indistinguishable from unrecombined were allocated orange, those that had less tdTomato than unrecombined were yellow and those that had no tdTomato signal were green. Due to the presence of tdTomato signal, orange centrosomes would be the oldest, yellow the second oldest and green the youngest. (G, H) Analysis of the manual colour calling shows a significant enrichment of orange centrosomes in ventricle and a significant enrichment of green centrosomes outside of the ventricle (n = 22, cortical units). Cortical units defined as an entity within the organoid consisting of a ventricle-like structure surrounded by an inner ring of densly clustered NPCs and an outher ring of neurons. ns, non-significant, *p < 0.05.
-
Figure 2—source data 1
Raw data related to Figure 2G, H.
- https://cdn.elifesciences.org/articles/83157/elife-83157-fig2-data1-v2.xlsx
-
Figure 2—source data 2
Raw data related to Figure 2—figure supplement 1C.
- https://cdn.elifesciences.org/articles/83157/elife-83157-fig2-data2-v2.xlsx
-
Figure 2—source data 3
Raw data related to Figure 2—figure supplement 1D, E.
- https://cdn.elifesciences.org/articles/83157/elife-83157-fig2-data3-v2.xlsx
Figure 2—figure supplement 1
Centrosome analyses in organoids.
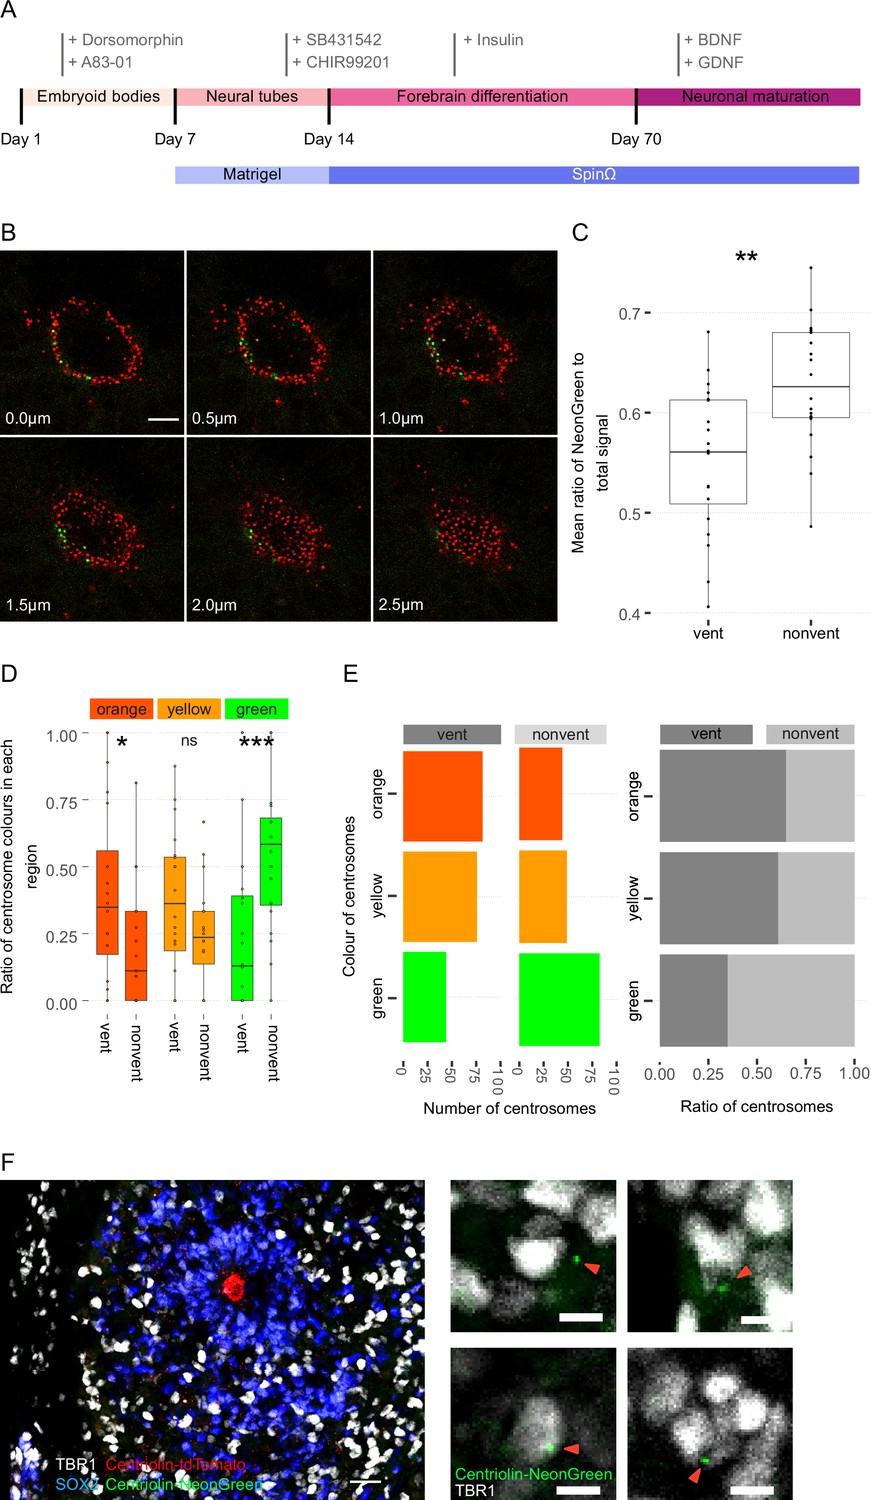
(A) Scheme showing a timeline of forebrain organoid protocol, with the small molecules used during each part of the protocol. (B) Cross-sections of a ventricle show its three-dimensional, tubular/spherical structure. Centrosomes are identified by their endogenous Centriolin-tdTomato/Centriolin-NeonGreen signal. (C) Box plot of mean ratio of NeonGreen to total signal for each region shows non-ventricular centrosomes are significantly greener than the ventricular centrosomes (n = 20, cortical units). (D, E) Automated colour calling from the ratio of NeonGreen to total signal, this supports the manual data showing a significant enrichment of old centrosomes in the ventricle (n = 20, cortical units). (F) Cortical unit of a day 35 forebrain organoid. The neuronal progeny (TBR1+ cells) localise away from the densely packed sub-ventricular structure containing neural progenitor cells (NPCs) (SOX2+ cells). Zoom-in images show young, green centrosomes (red arrows) co-localising with TBR1+ cells. Scale bar, 20 μm (left image) and 5 μm (zoom-in). ns, non-significant, *p < 0.05, **p < 0.01, ***p < 0.001.
Figure 3 with 1 supplement
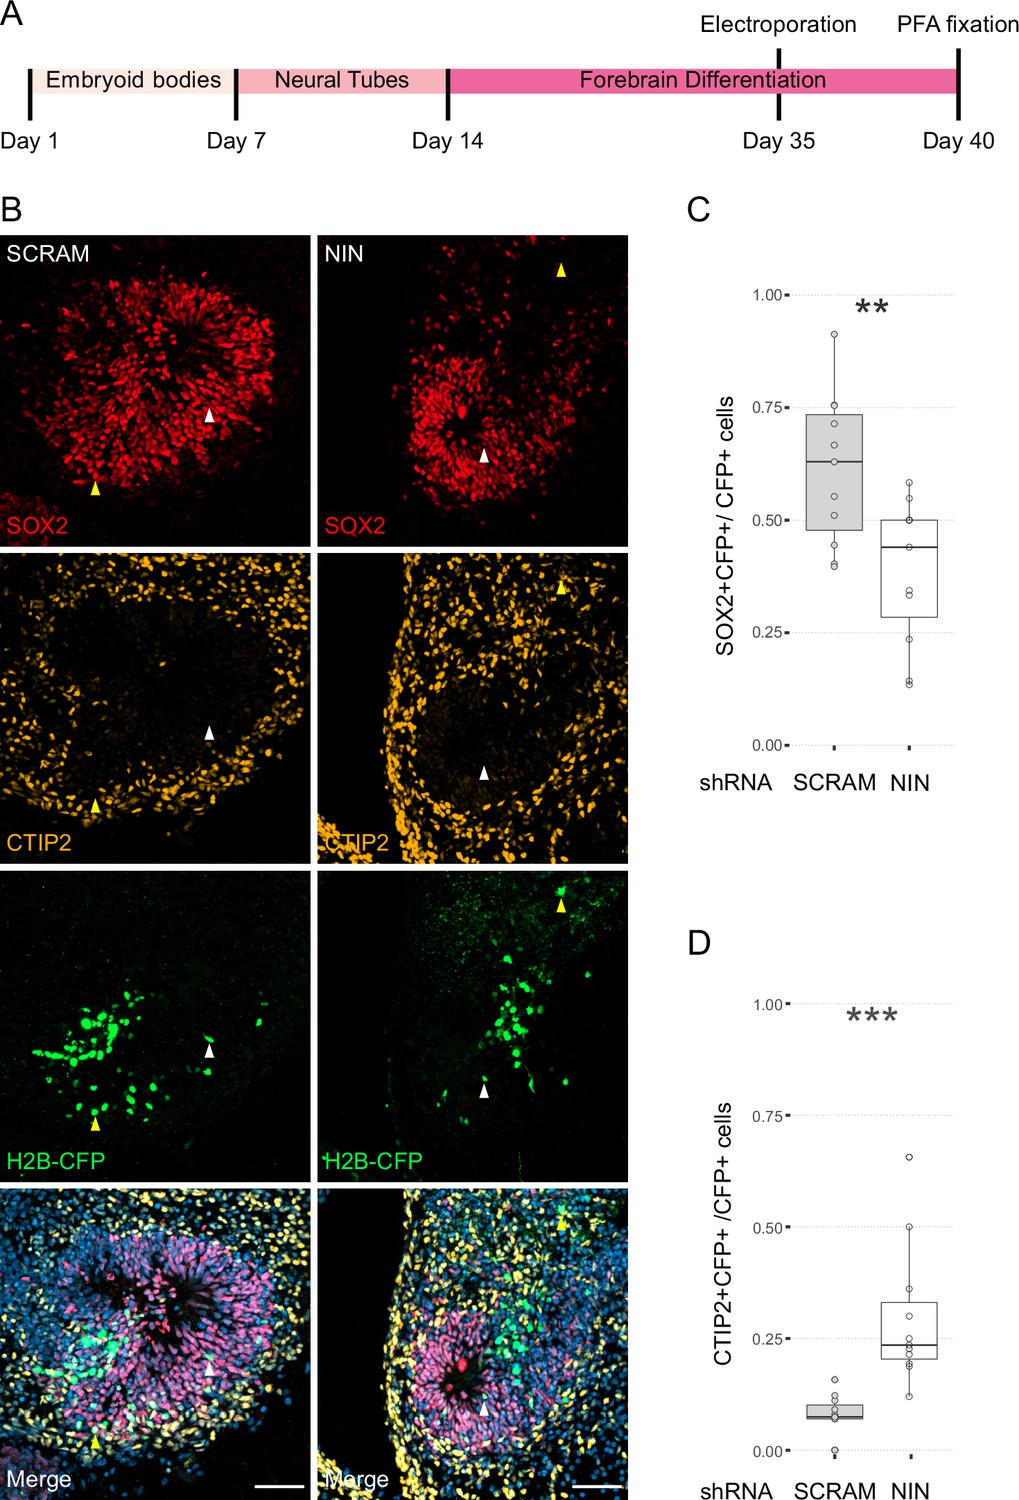
Randomisation of centrosome inheritance affects neural progenitor cell (NPC) fate.
(A) Scheme showing the timing of electroporation of the shRNA construct in the context of the organoid protocol. (B) Day 40 WT organoids, 5 days post electroporation with either scrambled shRNA or NIN-targeting shRNA, and a H2B-CFP marker. Arrowheads depict H2B-CFP-positive cells that are either SOX2-positive (white) or CTIP2-positive (yellow). Scale bars, 50 μm. (C) Graph of the percentage of H2B-CFP-positive nuclei being SOX2-positive (n = 11, cortical units). (D) Graph of the percentage of H2B-CFP-positive nuclei being CTIP2-positive (n = 11, cortical units). **p < 0.01, ***p < 0.001.
-
Figure 3—source data 1
Raw data related to Figure 3—figure supplement 1D.
- https://cdn.elifesciences.org/articles/83157/elife-83157-fig3-data1-v2.xlsx
-
Figure 3—source data 2
Raw data related to Figure 3—figure supplement 1E, F.
- https://cdn.elifesciences.org/articles/83157/elife-83157-fig3-data2-v2.xlsx
-
Figure 3—source data 3
Raw data related to Figure 3B–D.
- https://cdn.elifesciences.org/articles/83157/elife-83157-fig3-data3-v2.xlsx
Figure 3—figure supplement 1
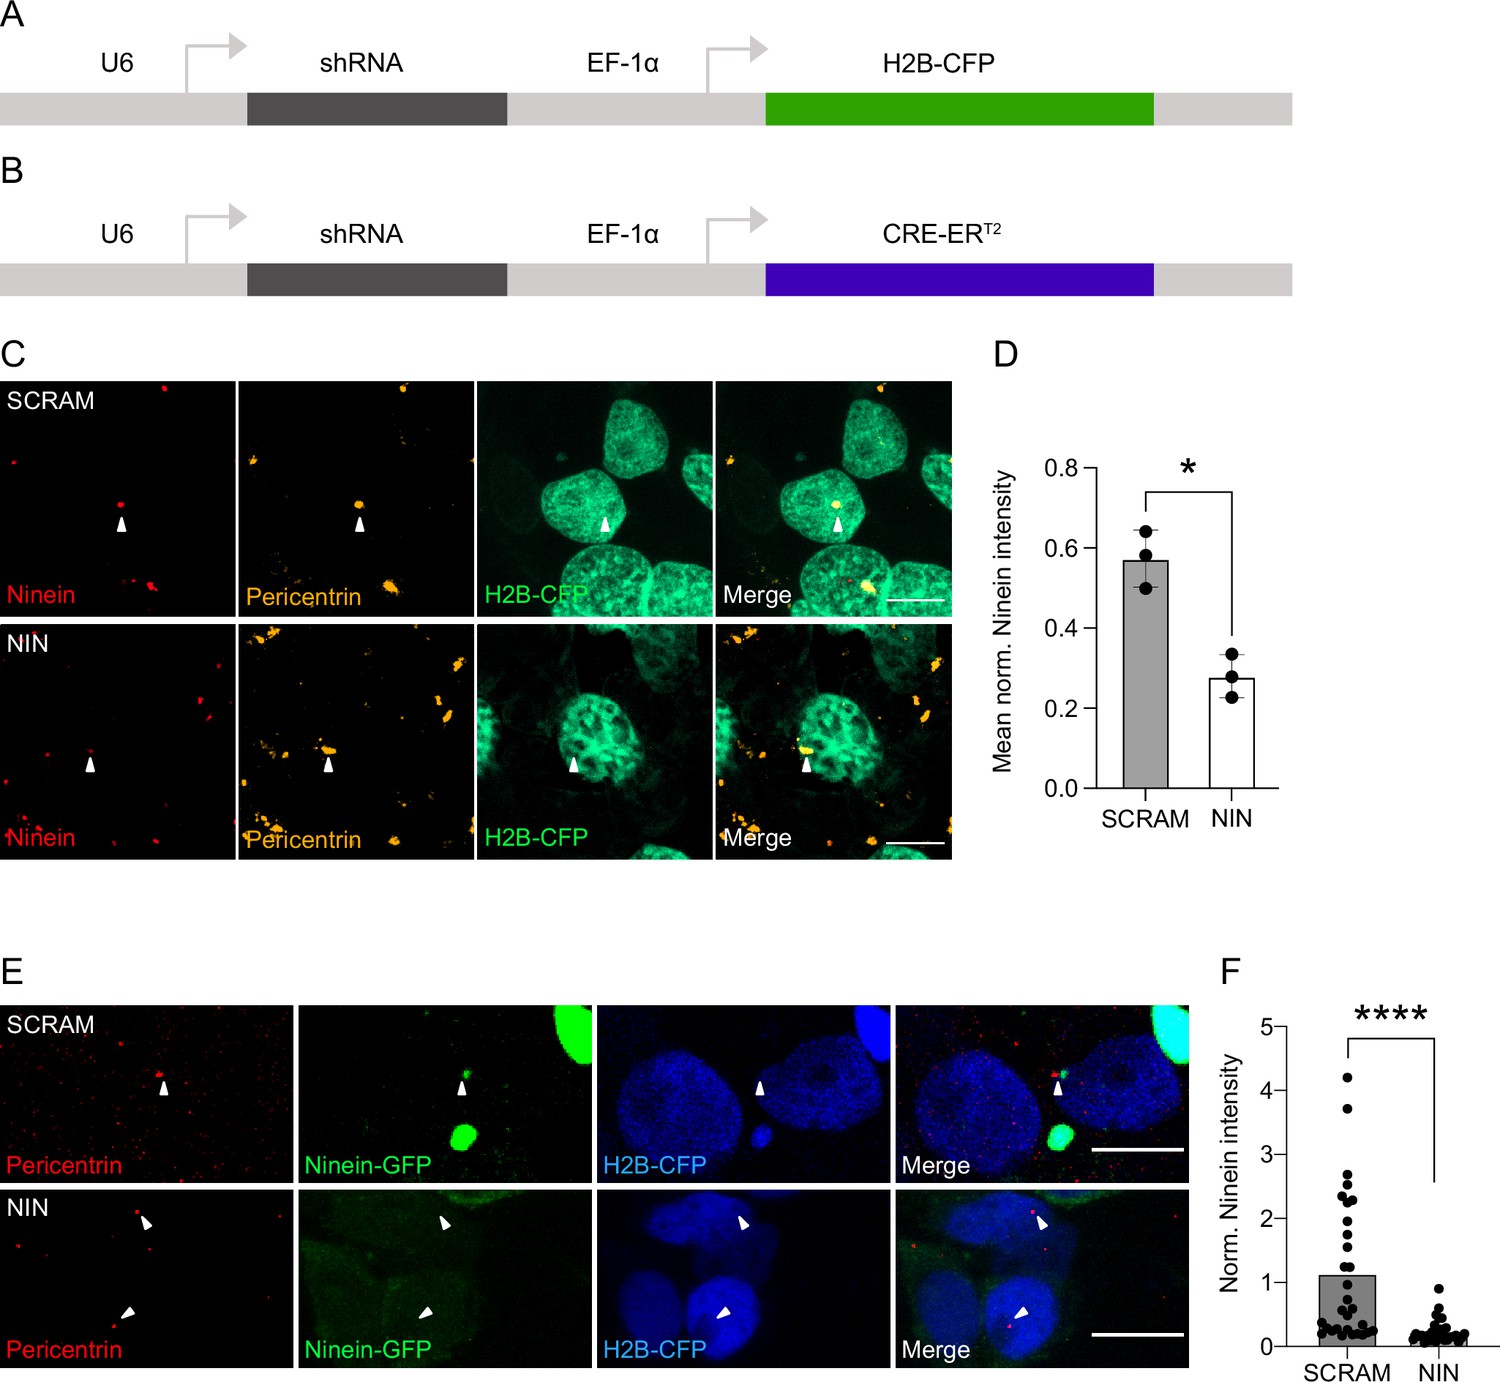
Ninein knockdown in human cells.
(A) Genetic map of the constructs used for the electroporation experiments. shRNA is expressed through the U6 promoter and the H2B-CFP is expressed via the EF-1α promoter. (B) Genetic map of the construct used for the generation of retroviruses. shRNA is expressed through the U6 promoter and the CRE-ERT2 is expressed via the EF-1α promoter. (C) Example images of the effect of transfection of the shRNAs targeting Ninein (NIN KD) and control shRNA (SCRAM) on Ninein expression in HEK cells. Scale bars, 10 μm. (D) Graph of the mean Ninein signal of each replicate, corrected for background and normalised to the maximum centrosome signal within each replicate (n = 3, replicates; each replicate consisting of five images). (E) Images of HEK cells transfected with plasmids expressing GFP-Ninein and shRNAs (either targeting Ninein or scrambled) and stained for Pericentrin (white arrows). (F) Quantifications of GFP-Ninein signal normalised by Pericentrin signal within H2B-CFP cells expressing either scrambled shRNA or shRNA-targeting Ninein (n = 30 cells from each condition). *p < 0.05, ****p < 0.0001.
Figure 4
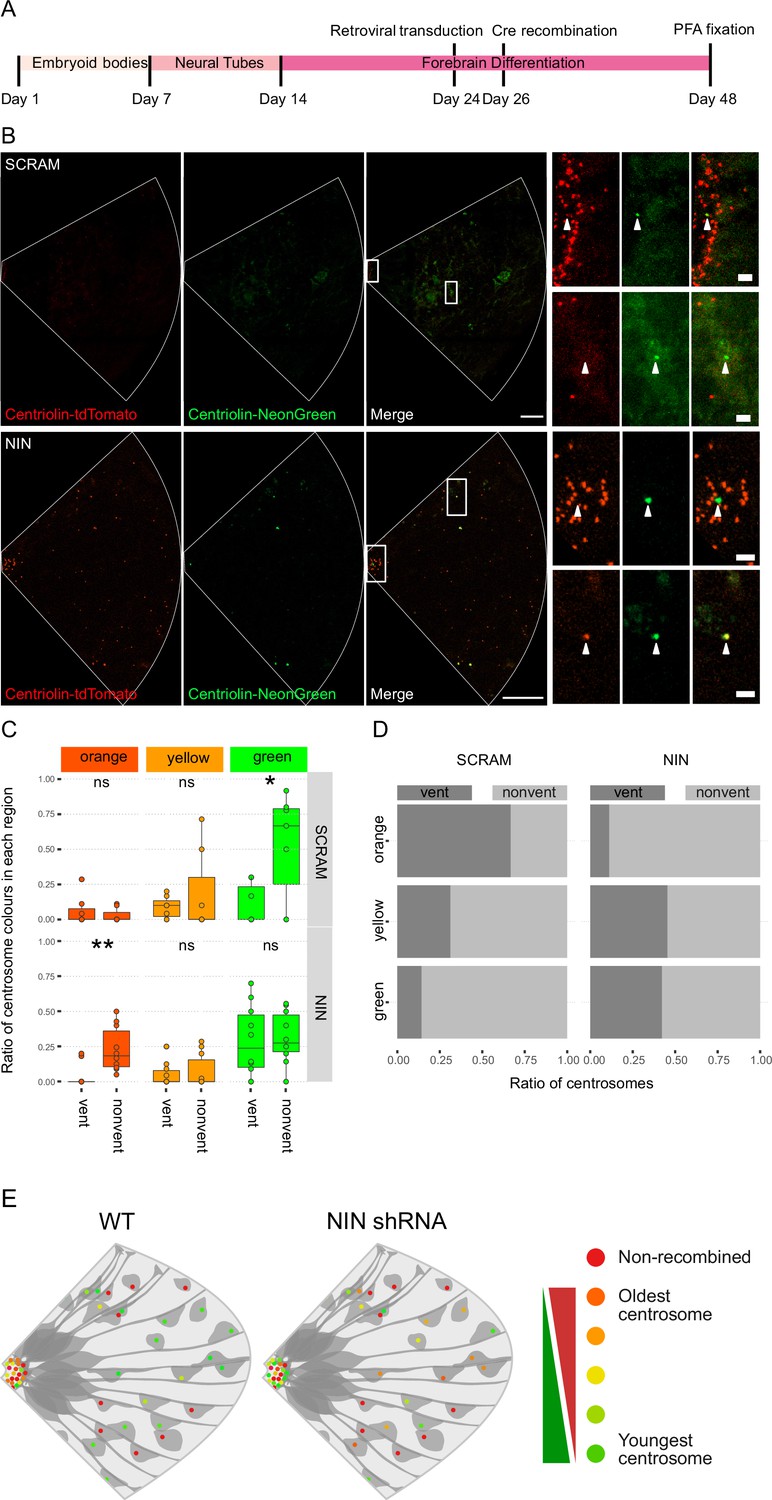
Ninein-shRNA alters retention of the older centrosome in the ventricular zone.
(A) Timing of the retroviral transduction and subsequent recombination in the context of the organoid protocol. (B) Day 24 Centriolin-RITE organoids were infected with retroviral expression of scrambled or NIN-targeting shRNA, and Cre-ERT2. Organoids were fixed 22 days after recombination was induced with tamoxifen. Scale bars, 25 μm (left column), 2 μm (right column). (C) Comparison of the colour of centrosomes in each region by shRNA treatment using manual colour calling (scram n = 7 cortical units, nin = 10, cortical units; note that single unit data overlay for ‘vent’ data points). (D) Analysis of the colour composition of each region shows a shift in localisation of the older centrosomes to the nonvent region for the NIN shRNA-treated organoids (n = 8, cortical units). ns, non-significant, *p < 0.05, **p < 0.01. (E) Scheme of asymmetric centrosome segregation in WT and how it is perturbed upon Ninein knockdown.
-
Figure 4—source data 1
Raw data related to Figure 4C, D.
- https://cdn.elifesciences.org/articles/83157/elife-83157-fig4-data1-v2.xlsx
Additional files
Download links
A two-part list of links to download the article, or parts of the article, in various formats.
Downloads (link to download the article as PDF)
Open citations (links to open the citations from this article in various online reference manager services)
Cite this article (links to download the citations from this article in formats compatible with various reference manager tools)
Asymmetric inheritance of centrosomes maintains stem cell properties in human neural progenitor cells
eLife 12:e83157.
https://doi.org/10.7554/eLife.83157


