HUWE1 controls tristetraprolin proteasomal degradation by regulating its phosphorylation
- Department of Microbiology, Immunobiology and Genetics, Max Perutz Labs, University of Vienna, Vienna BioCenter (VBC), Austria
- Vienna BioCenter PhD Program, Doctoral School of the University of Vienna and Medical University of Vienna, Vienna BioCenter (VBC), Austria
- Research Institute of Molecular Pathology (IMP), Vienna BioCenter (VBC), Austria
- Medical University of Vienna, Vienna BioCenter (VBC), Austria
Figures
Figure 1 with 1 supplement
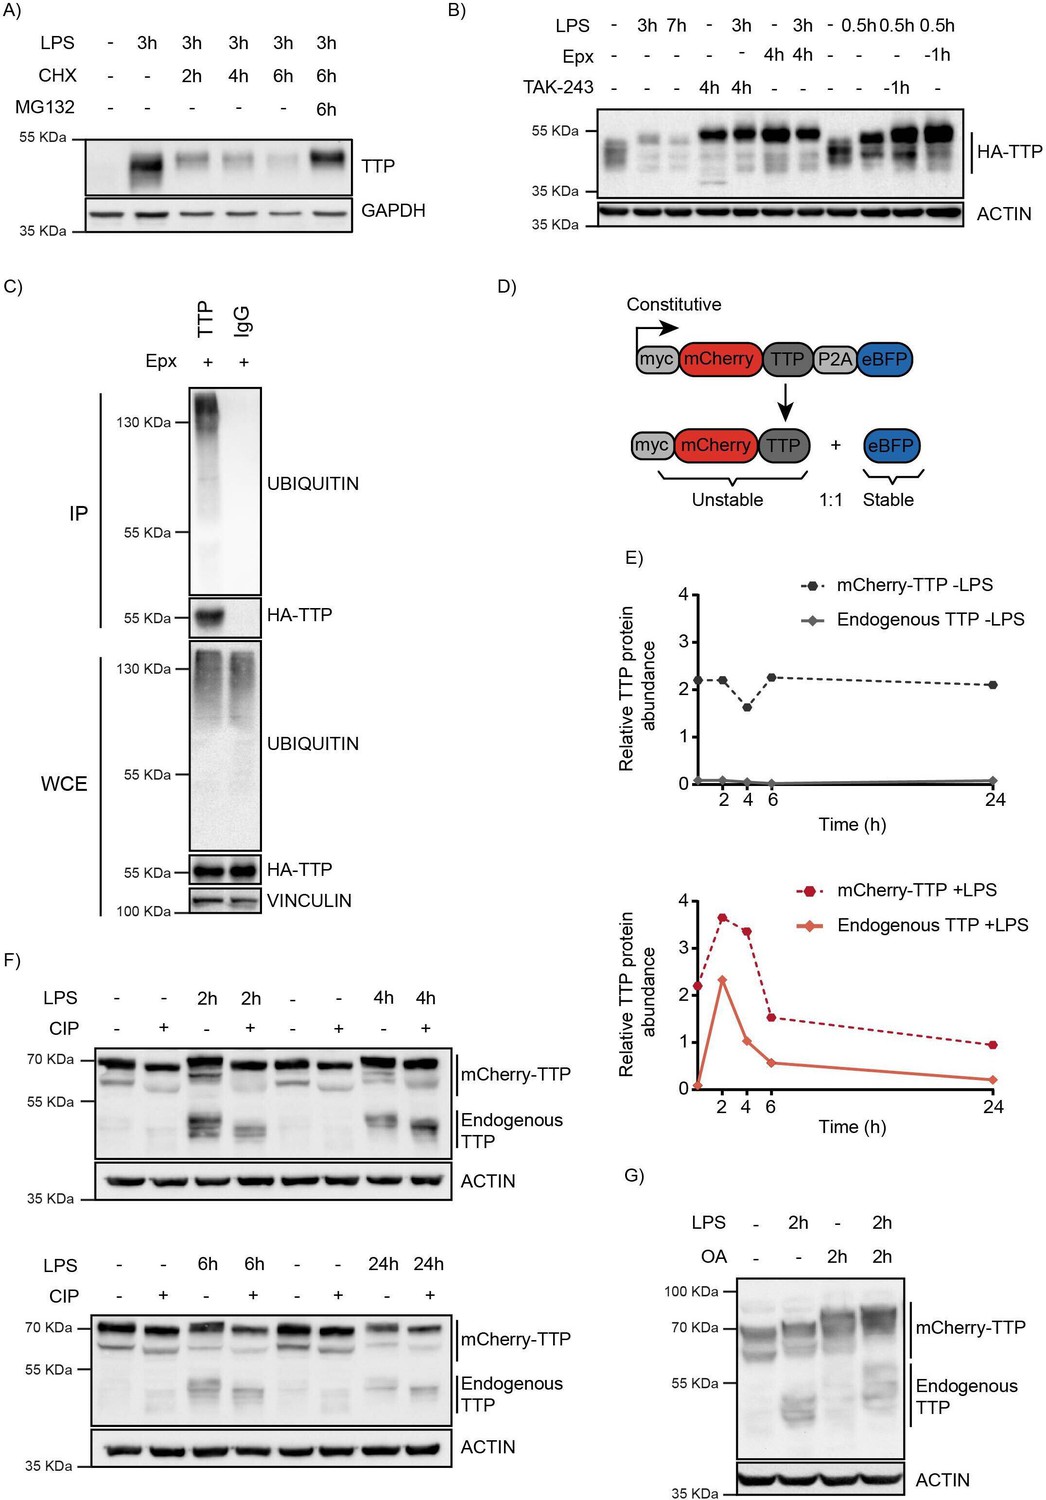
TTP is degraded by the proteasome in a ubiquitin-dependent manner.
(A) RAW264.7 murine macrophages were stimulated with LPS and incubated with the translation inhibitor cycloheximide (CHX) and the proteasome inhibitor MG132 for the indicated times (h), after which TTP levels were analyzed by western blot. (B) 3xHA-TTP-expressing RAW264.7 cells were incubated with LPS or left unstimulated. Cells were then treated with E1 enzyme inhibitor (TAK-234) or the proteasome inhibitor Epoxomicin (Epx). Protein levels were assessed by western blot. (C) RAW264.7 cells stably expressing 3xHA-tagged TTP protein were treated with Epx for 5 hr, after which TTP was immunoprecipitated, and its ubiquination analyzed by western blot. (D) Schematic representation of the TTP stability reporter construct. Constitutively expressed myc-tagged mCherry-TTP fusion protein and enhanced blue fluorescent protein (eBFP2) are translated at equimolar levels through a P2A site. (E–F) RAW264.7-Dox-Cas9-mCherry-TTP cells were stimulated with LPS for the indicated times. Subsequently, cell lysates were treated with Calf Intestinal Phosphatase (CIP) for 2 hr at 37 °C, and TTP levels analyzed by western blot. Non-saturated western blot signals for mCherry-TTP and endogenous TTP protein were quantified, normalized to ACTIN levels, and plotted. (G) RAW264.7-Dox-Cas9-mCherry-TTP cells were treated with LPS for 2 hr, after which PP1/2 inhibitor okadaic acid (OA) was added to the culture medium for 2 hr. TTP electrophoretic mobility was assessed by western blot.
-
Figure 1—source data 1
Blots corresponding to Figure 1A.
- https://cdn.elifesciences.org/articles/83159/elife-83159-fig1-data1-v1.zip
-
Figure 1—source data 2
Blots corresponding to Figure 1B and Figure 1—figure supplement 1A.
- https://cdn.elifesciences.org/articles/83159/elife-83159-fig1-data2-v1.zip
-
Figure 1—source data 3
Blots corresponding to Figure 1C.
- https://cdn.elifesciences.org/articles/83159/elife-83159-fig1-data3-v1.zip
-
Figure 1—source data 4
Blots corresponding to Figure 1F.
- https://cdn.elifesciences.org/articles/83159/elife-83159-fig1-data4-v1.zip
-
Figure 1—source data 5
Blots corresponding to Figure 1G.
- https://cdn.elifesciences.org/articles/83159/elife-83159-fig1-data5-v1.zip
Figure 1—figure supplement 1
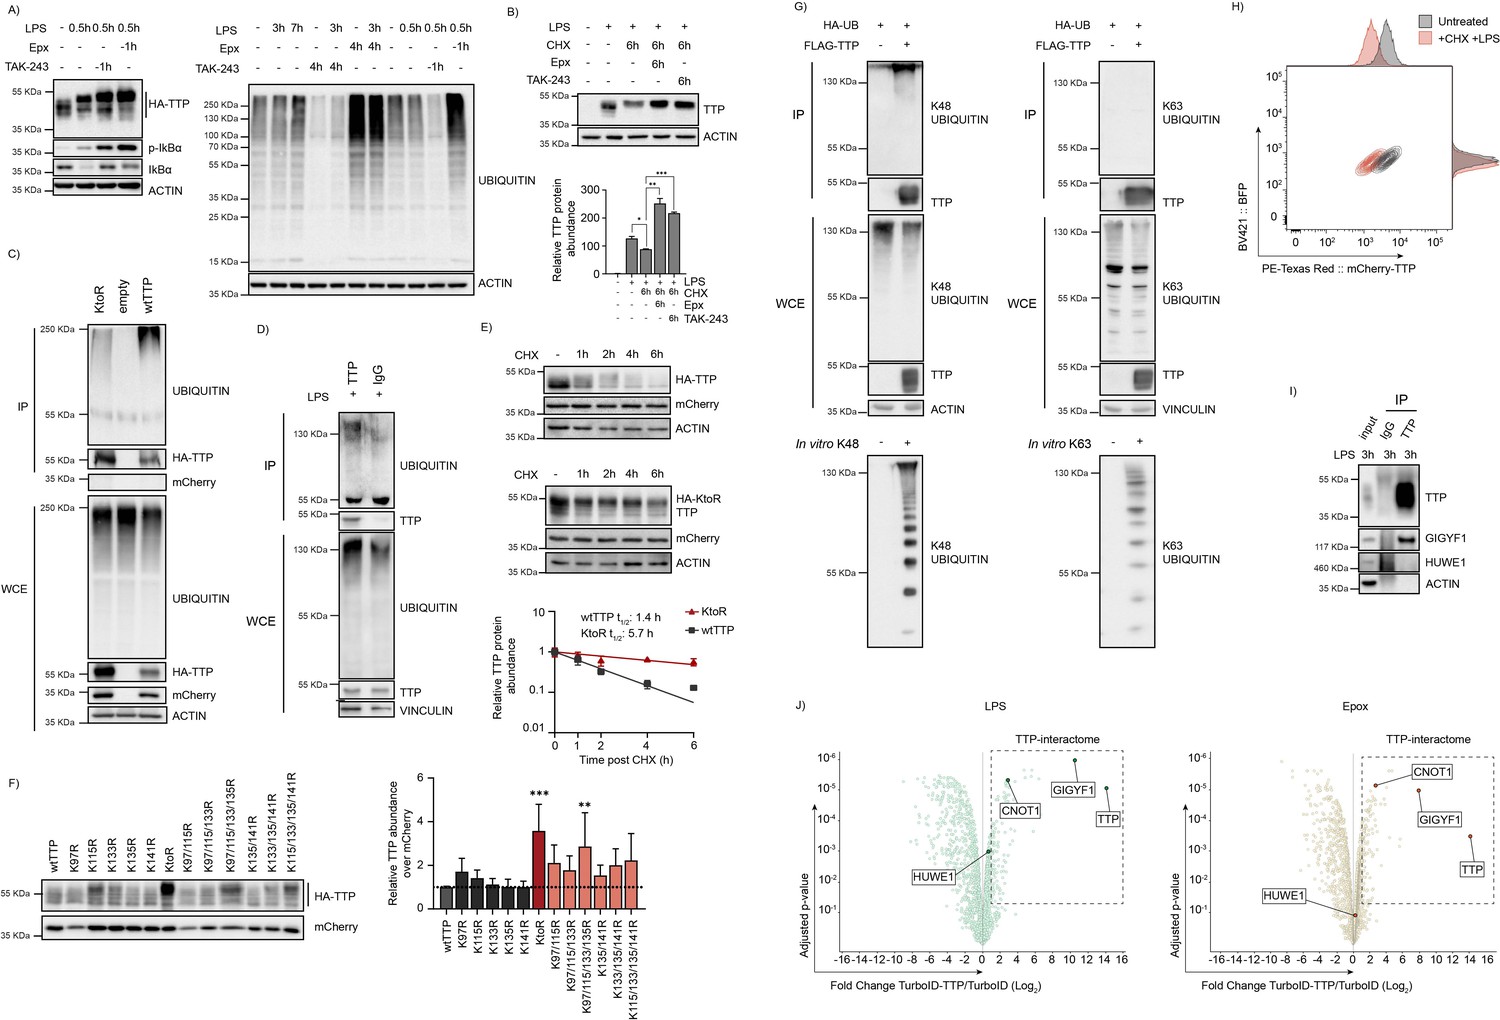
TTP is degraded by the proteasome in a ubiquitin-dependent manner.
(A) 3xHA-TTP-expressing RAW264.7 cells were incubated with LPS or left unstimulated. Cells were then treated with E1 enzyme inhibitor (TAK-234) or the proteasome inhibitor Epoxomicin (Epx). Ubiquitin levels were assessed by western blot. (B) RAW264.7 cells were incubated with LPS for 2 hr, subsequently treated with the indicated inhibitors for 6 hr, and endogenous TTP quantified by Western blot. Bar graphs represent mean and s.d.; n=2 biological replicates analyzed by unpaired t-test. (C) HEK-293T cells were transiently transfected with plasmids encoding 3xHA-tagged wild-type TTP, a TTP KtoR mutant, or an empty vector. Cells were incubated with the translation inhibitor cycloheximide (CHX) and Epx for 5 hr. Immunoprecipitation was carried out using HA antibody, and TTP ubiquination was analyzed by western blot. (D) RAW264.7 cells were treated with LPS for 2 hr, subsequently incubated with CHX and Epx for 5 hr, and analyzed by IP of endogenous TTP, and subsequent WB for ubiquitin. (E) HEK-293T cells were transiently transfected with plasmids encoding 3xHA-tagged wild-type TTP, or a TTP KtoR mutant, incubated with CHX for the indicated times, and quantified by WB. Single-phase decay curves represent means and s.d. from n=3 biological replicates. (F) HEK-293T cells were transiently transfected with plasmids encoding 3xHA-tagged HA-TTP KtoR mutants, and quantified by WB. Bar graphs represent means and s.d. of n=3 biological replicates, analyzed by one-way ANOVA. (G) HEK-293T cells expressing FLAG-TTP and HA-ubiquitin were incubated for 5 hr with Epx, followed by IP for FLAG-TTP, and WB analysis using K48- or K63-specific ubiquitin antibodies. In vitro produced K48- and K63-linked ubiquitin chains were included as positive controls. (H) RAW264.7-Dox-Cas9-mCherry-TTP cells were either left unstimulated or treated with LPS for 5 hr. Subsequently, cells were incubated with CHX for 10 hr. and analyzed for mCherry-TTP protein levels by flow cytometry. (I) RAW264.7-Dox-Cas9 cells were stimulated with LPS for the indicated time. Immunoprecipitation was carried out using antibodies for TTP or an IgG control. Immunoprecipitated complexes were analysed by western blot. (J) Volcano plots representing TTP-interactome in RAW264.7 cells. RAW264.7 cells stably expressing a Dox-inducible TurboID-TTP fusion protein were treated with LPS or Epx for 4 hr., followed by 15 min. of biotin labeling in the cell medium. TurboID without fusion was used as a control. Biotinylated proteins were immunoprecipitated and submitted for nLC-MS/MS. TTP interactome is highlighted and known TTP interactors are shown adjusted p-value ≤0.05 and Fold Change (Log2) ≥1; with n=3 biological replicates.
-
Figure 1—figure supplement 1—source data 1
Blots corresponding to Figure 1—figure supplement 1B.
- https://cdn.elifesciences.org/articles/83159/elife-83159-fig1-figsupp1-data1-v1.zip
-
Figure 1—figure supplement 1—source data 2
Blots corresponding to Figure 1—figure supplement 1C.
- https://cdn.elifesciences.org/articles/83159/elife-83159-fig1-figsupp1-data2-v1.zip
-
Figure 1—figure supplement 1—source data 3
Blots corresponding to Figure 1—figure supplement 1D.
- https://cdn.elifesciences.org/articles/83159/elife-83159-fig1-figsupp1-data3-v1.zip
-
Figure 1—figure supplement 1—source data 4
Blots corresponding to Figure 1—figure supplement 1E.
- https://cdn.elifesciences.org/articles/83159/elife-83159-fig1-figsupp1-data4-v1.zip
-
Figure 1—figure supplement 1—source data 5
Blots corresponding to Figure 1—figure supplement 1F.
- https://cdn.elifesciences.org/articles/83159/elife-83159-fig1-figsupp1-data5-v1.zip
-
Figure 1—figure supplement 1—source data 6
Blots corresponding to Figure 1—figure supplement 1G.
- https://cdn.elifesciences.org/articles/83159/elife-83159-fig1-figsupp1-data6-v1.zip
-
Figure 1—figure supplement 1—source data 7
Blots corresponding to Figure 1—figure supplement 1I.
- https://cdn.elifesciences.org/articles/83159/elife-83159-fig1-figsupp1-data7-v1.zip
-
Figure 1—figure supplement 1—source data 8
TurboID-TTP proximity labelling in RAW264.7 cells.
- https://cdn.elifesciences.org/articles/83159/elife-83159-fig1-figsupp1-data8-v1.zip
Figure 2 with 1 supplement
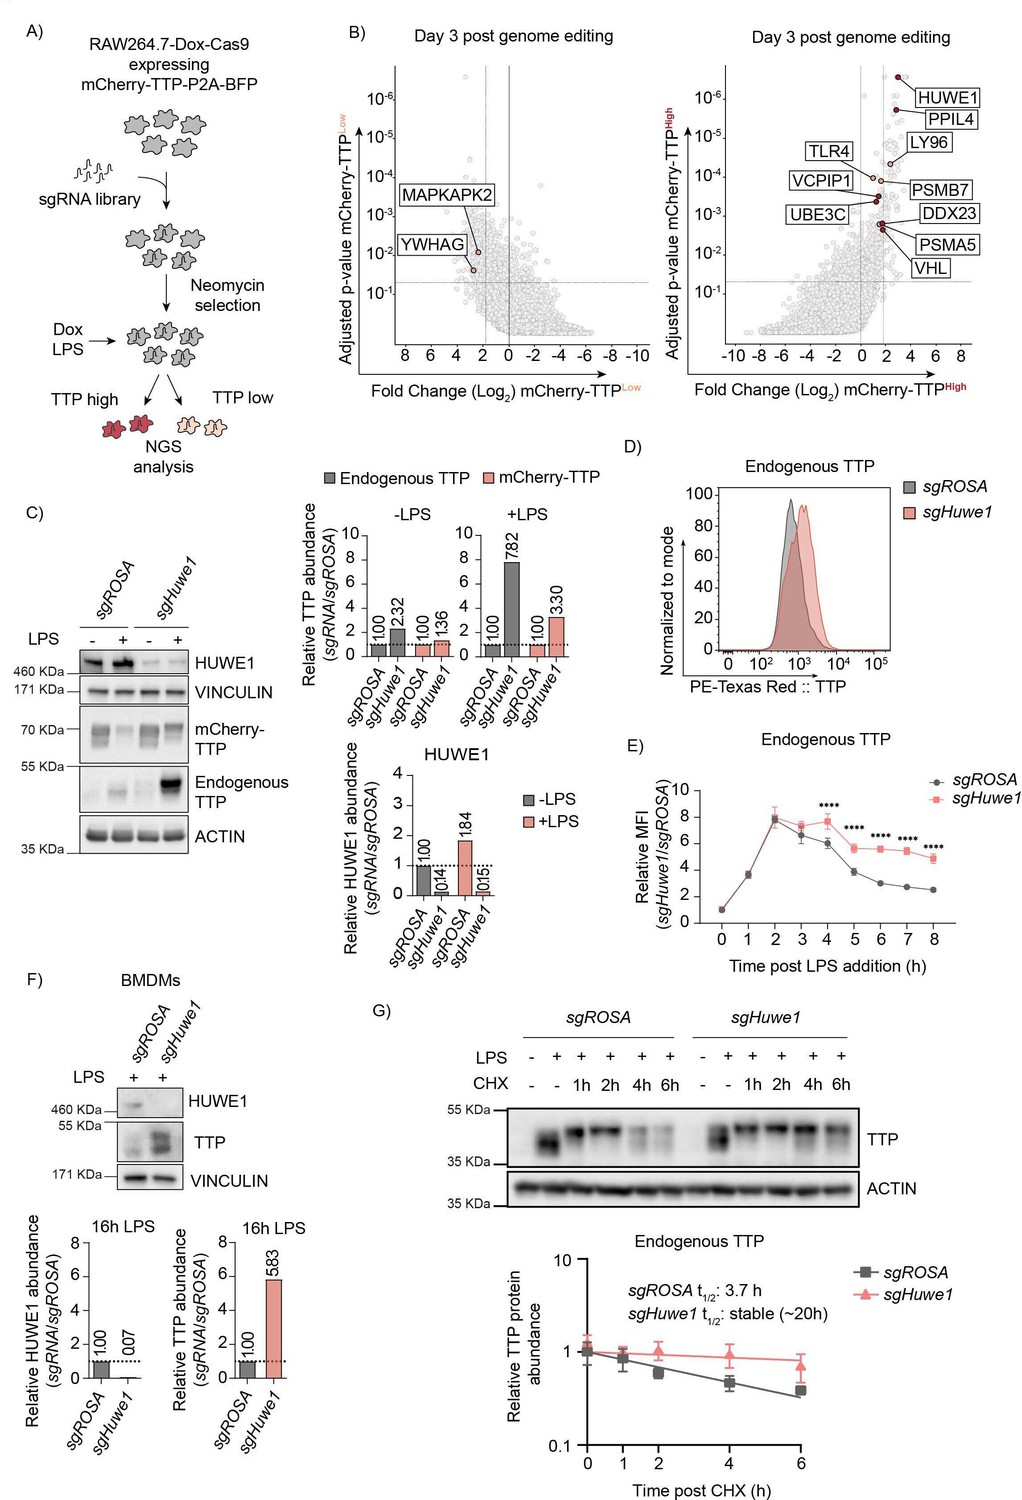
Genome-wide CRISPR-Cas9 knockout screen identified the E3 ligase HUWE1 as a regulator of TTP stability.
(A) Overview of FACS-based CRISPR-Cas9 knockout screening procedure using the RAW264.7-Dox-Cas9-mCherry-TTP cell line. Cells expressing high and low levels of mCherry-TTP protein were sorted, and their integrated sgRNA coding sequences determined by next generation sequencing. (B) Read counts per million in the mCherry-TTPhigh cells at 3 days after Cas9 induction were compared to those in unsorted cells from the same day, sgRNA enrichment calculated by MAGeCK analysis, and log2-fold change and adjusted p-value plotted. Genes enriched in the sorted populations that met the following criteria are indicated in red: a log2 fold-change of <1.8 (mCherry-TTPlow) or >1.8 (mCherry-TTPhigh), adjusted p-value <0.05, not enriched in the matching eBFP2low or eBFP2high sorted cells. (C) Cas9 was induced with Dox for 5 days in RAW264.7-Dox-Cas9-mCherry-TTP cells expressing either sgROSA or sgHuwe1. Subsequently, cells were treated with LPS for 16 hr, and TTP protein levels were assessed by western blot. HUWE1, mCherry-TTP and endogenous TTP abundance was quantified and plotted. The TTP and ACTIN panels are the left four lanes from the blot presented in Figure 2—figure supplement 1B. (D) RAW264.7-Dox-Cas9 cells expressing sgROSA or sgHuwe1 were treated with Dox for 5 days to induce Cas9. Then, cells were incubated with LPS for 16 hr or left unstimulated, and endogenous TTP protein levels analyzed by intracellular staining, followed by flow cytometry. (E) sgROSA- or sgHuwe1-targeted RAW264.7-Dox-Cas9 cells were treated with LPS for the indicated times (h), and TTP levels were analyzed by flow cytometry. Normalized mean fluorescence intensity (MFI) was plotted. Data represent the mean and s.d.; n=3 biological replicates. ****p ≤0.0001. (F) Bone marrow-derived macrophages (BMDMs) isolated from Cas9-expressing knock-in mice were stably transduced with sgROSA or sgHuwe1. Cells were incubated with LPS for 16 hr or left unstimulated. Endogenous TTP protein levels were determined by western blot. Quantified TTP levels normalized to VINCULIN are plotted. (G) sgROSA- or sgHuwe1-RAW264.7-Dox-Cas9 cells were treated for 2 hr with LPS, followed by CHX chase in the continued presence of LPS. Protein lysates were harvested at the indicated time points (h). Endogenous TTP levels were measured by WB, quantified, plotted, and TTP half-life calculated. Data represent means and s.d.; n=3 biological replicates.
-
Figure 2—source data 1
Blots corresponding to Figure 2C and to Figure 2—figure supplement 1B.
- https://cdn.elifesciences.org/articles/83159/elife-83159-fig2-data1-v1.zip
-
Figure 2—source data 2
Blots corresponding to Figure 2F.
- https://cdn.elifesciences.org/articles/83159/elife-83159-fig2-data2-v1.zip
-
Figure 2—source data 3
Blots corresponding to Figure 2G.
- https://cdn.elifesciences.org/articles/83159/elife-83159-fig2-data3-v1.zip
-
Figure 2—source data 4
Cas9 functionality and leakiness evaluation.
RAW264.7-Dox-Cas9 cells expressing an sgRNA targeting the cell-essential gene Rrm1 or the ROSA safe-harbor locus. sgRNA-positive cells were monitored by flow cytometry in the presence or absence of Dox over the indicated time period. Relative cell viability of sgRrm1-transduced cells was compared to untransduced cells, normalized to sgROSA relative cell viability and plotted.
- https://cdn.elifesciences.org/articles/83159/elife-83159-fig2-data4-v1.zip
-
Figure 2—source data 5
Adopted gating strategy of FACS-based mCherry-TTP stability regulator screen.
Representative scatter plots are shown in hierarchical order. First debris, doublets, dead (APC-Cy7 positive), Cas9-negative (GFP), mCherry- and BFP-negative cells were excluded. 5% of cells with the lowest and 1% of cells with the highest mCherry and BFP signal were sorted.
- https://cdn.elifesciences.org/articles/83159/elife-83159-fig2-data5-v1.zip
-
Figure 2—source data 6
MAGeCK analysis of D3 and D6 CRISPR screen in RAW-Dox-Cas9.
- https://cdn.elifesciences.org/articles/83159/elife-83159-fig2-data6-v1.zip
Figure 2—figure supplement 1
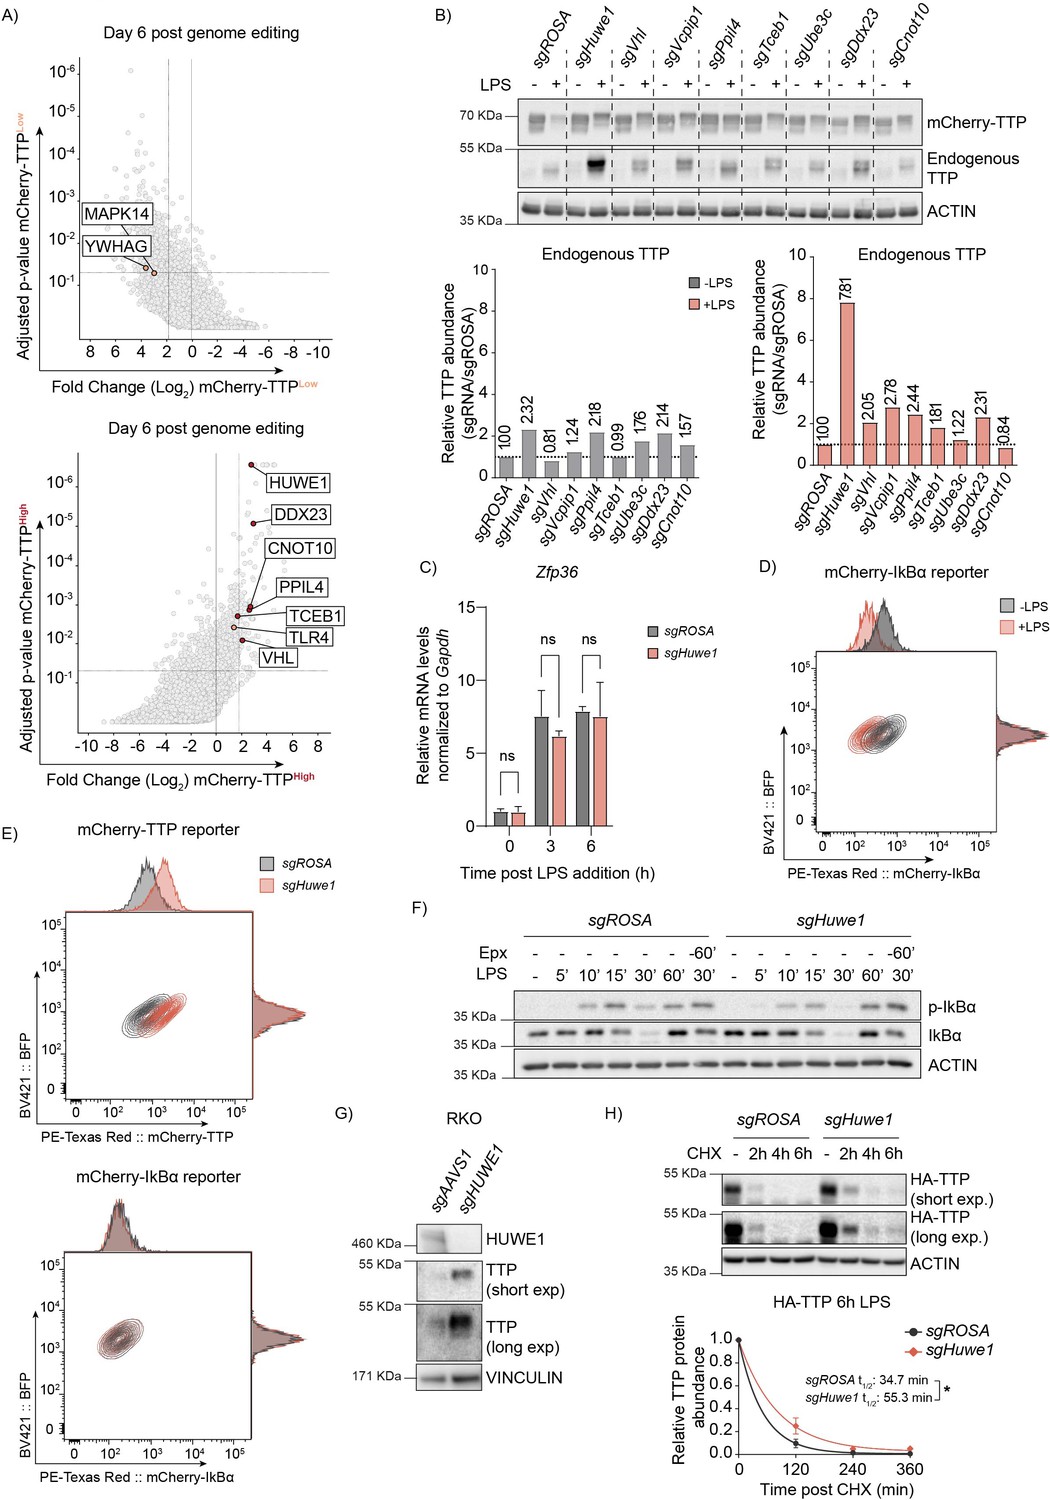
Genome-wide CRISPR-Cas9 knockout screen identified the E3 ligase HUWE1 as a regulator of TTP stability.
(A) Read counts per million in the mCherry-TTPhigh cells at 6 days after Cas9 induction were compared to those in unsorted cells from the same day, sgRNA enrichment calculated by MAGeCK analysis, and log2-fold change and adjusted p-value plotted. Genes enriched in the sorted populations that met the following criteria are indicated in red: a log2 fold-change of <1.8 (mCherry-TTPlow) or >1.8 (mCherry-TTPhigh), adjusted P-value <0.05, not enriched in the matching eBFP2low or eBFP2high sorted cells. (B) RAW264.7-Dox-Cas9 cells were transduced with lentiviral vectors encoding the indicated sgRNAs. Cas9 was induced for 5 days with Dox. Subsequently, cells were treated with LPS for 16 hr, and TTP protein levels were analyzed by western blot. (C) RAW264.7-Dox-Cas9 cells expressing sgROSA or sgHuwe1 were treated with Dox for 5 days to induce Cas9. Cells were incubated with LPS for the indicated time points (h). Zfp36 mRNA levels were measured by RT-qPCR and normalized to Gapdh. Data represent the mean and s.d.; n=3 biological replicates. Two-way ANOVA was performed. (D) RAW264.7-Dox-Cas9 cells expressing mCherry-IκBα were either left unstimulated or treated with LPS for 2 hr, and mCherry- IκBα protein levels analyzed by flow cytometry. (E) RAW264.7-Dox-Cas9 cells stably expressing mCherry-TTP or mCherry-IκBα fusion proteins were transduced with lentiviral expression constructs encoding sgROSA or sgHuwe1. Knock-out was induced for 3 days by the addition of Dox. Cells were stimulated with LPS for 2 hr. (mCherry-IκBα) or 16 hr. (mCherry-TTP), after which mCherry and eBFP levels were determined by flow cytometry. (F) RAW264.7-Dox-Cas9 expressing sgROSA or sgHuwe1 were treated with Dox for 5 days to induce Cas9. Cells were pre-treated with Epx for 60 min. or left unstimulated. Subsequently, cells were incubated with LPS for the indicated times and endogenous IκBα phosphorylation and degradation was analyzed by western blot. (G) RKO-Dox-Cas9 cells expressing sgAAVS1 or sgHUWE1 were stimulated with Dox for 6 days, after which TTP protein levels were determined by western blot. (H) sgROSA- or sgHuwe1-RAW264.7-Dox-Cas9 cells stably expressing 3xHA-TTP were treated for 6 hr. with LPS, followed by CHX. Protein lysates were harvested at the indicated time points (h). TTP levels were measured by western blot, quantified, plotted, and TTP half-life calculated. n=2 biological replicates, *p≤0.05.
-
Figure 2—figure supplement 1—source data 1
Blots corresponding to Figure 2—figure supplement 1F.
- https://cdn.elifesciences.org/articles/83159/elife-83159-fig2-figsupp1-data1-v1.zip
-
Figure 2—figure supplement 1—source data 2
Blots corresponding to Figure 2—figure supplement 1G.
- https://cdn.elifesciences.org/articles/83159/elife-83159-fig2-figsupp1-data2-v1.zip
-
Figure 2—figure supplement 1—source data 3
Blots corresponding to Figure 2—figure supplement 1H.
- https://cdn.elifesciences.org/articles/83159/elife-83159-fig2-figsupp1-data3-v1.zip
Figure 3 with 1 supplement
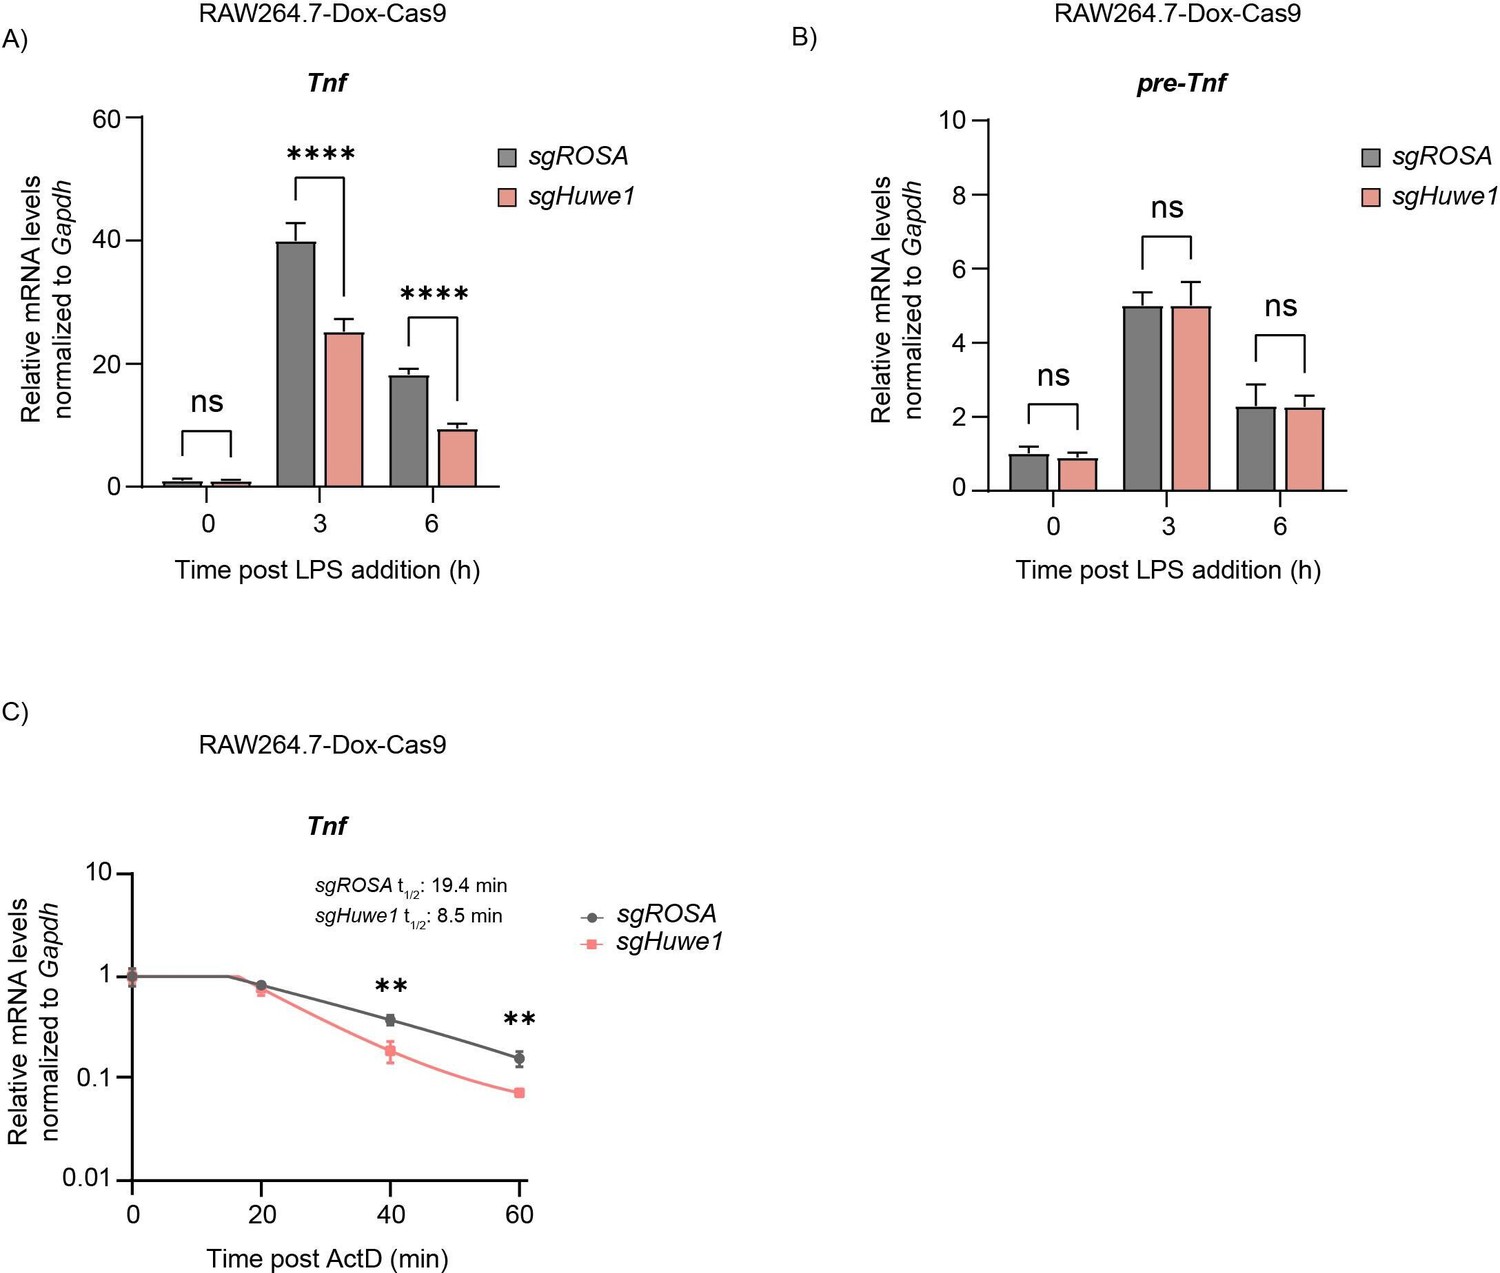
TTP mRNA targets are dysregulated upon Huwe1 depletion.
RAW264.7-Dox-Cas9 cells expressing sgROSA or sgHuwe1 were treated with Dox for 5 days to induce Cas9. Cells were incubated with LPS for the indicated time points (h). (A) Mature Tnf mRNA levels, and (B) Tnf pre-mRNA levels were measured by RT-qPCR and normalized to Gapdh. Data represent the mean and s.d.; n=3 biological replicates. ****p ≤0.0001. Two-way ANOVA was performed. (C) RAW264.7-Dox-Cas9 cells expressing sgROSA or sgHuwe1 were treated with Dox for 5 days to induce Cas9. Cells were incubated with LPS for 3 hr, after which Actinomycin D (ActD) was added for the indicated times (min), and Tnf mRNA levels were determined by RT-qPCR. Data represent the mean and s.d.; n=3 biological replicates. **p ≤ 0.01. Unpaired t-tests were performed for the 40 min and 60 min time points.
Figure 3—figure supplement 1
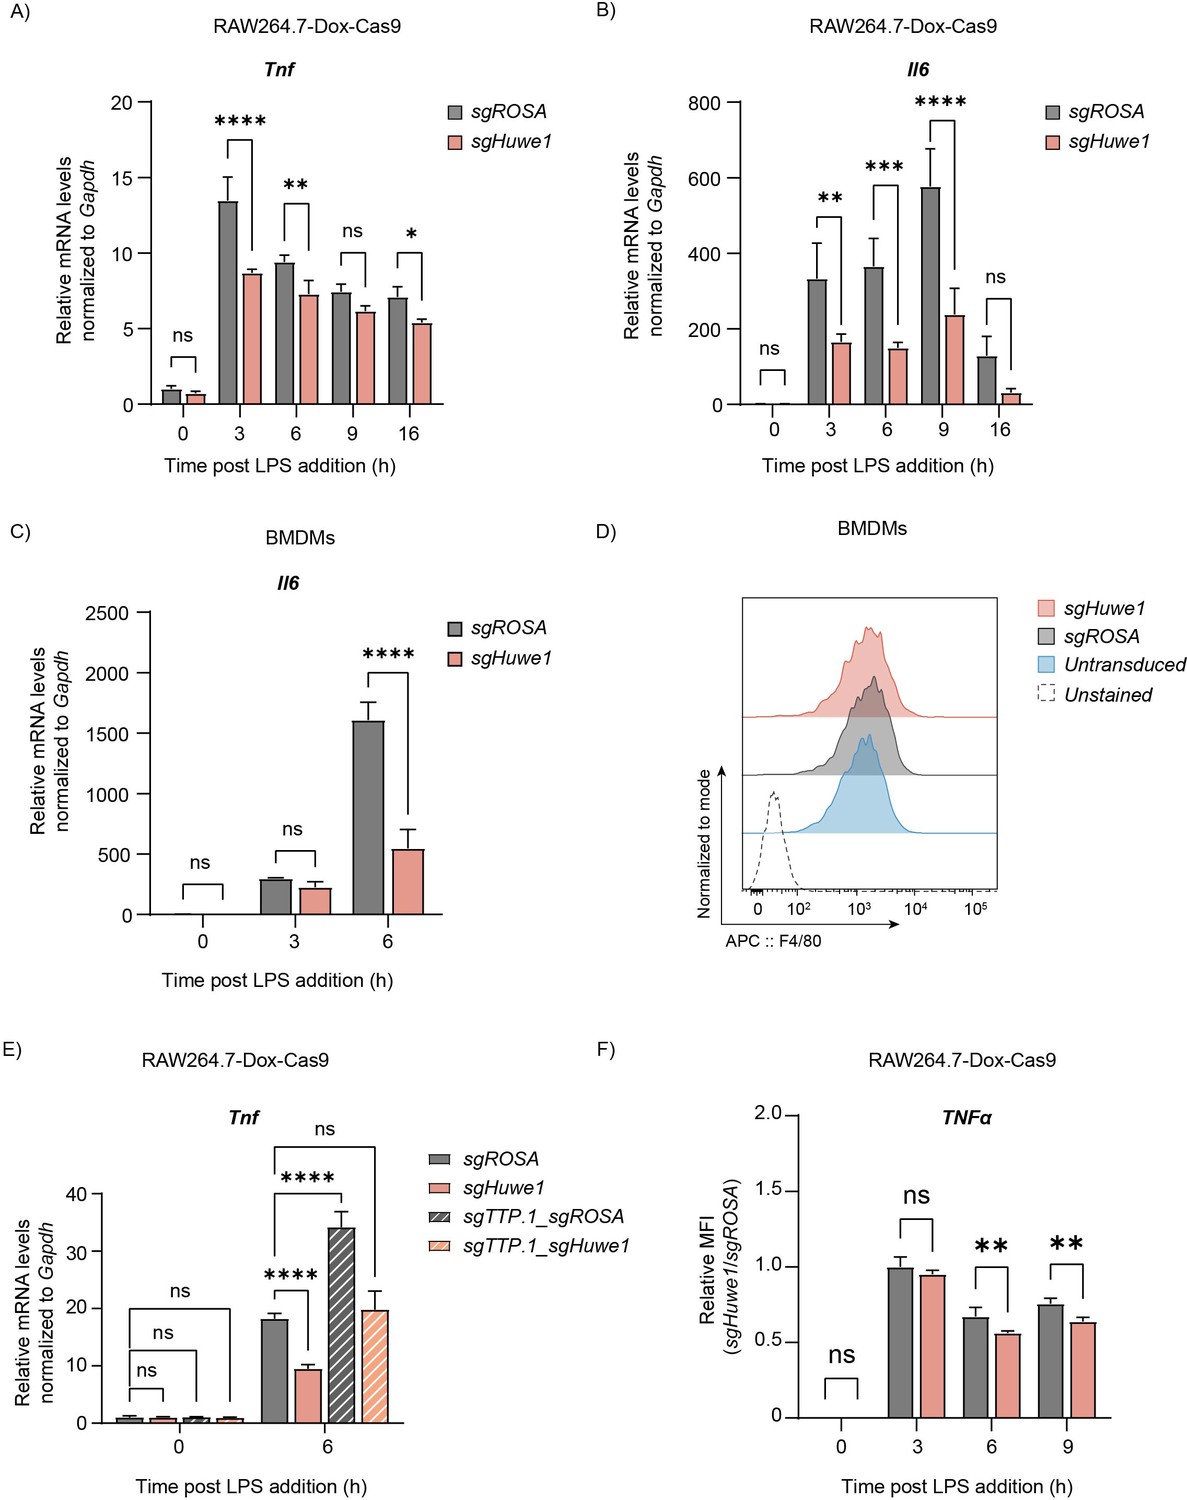
TTP mRNA targets are dysregulated upon Huwe1 depletion.
RAW264.7-Dox-Cas9 cells expressing sgROSA or sgHuwe1 were treated with Dox for 5 days to induce Cas9. Cells were incubated with LPS for the indicated time points (h). (A) Tnf or (B) Il6 mRNA levels were measured by RT-qPCR and normalized to Gapdh. Data represent the mean and s.d.; n=3 biological replicates. *p ≤ 0.05; **p ≤ 0.01; ***p≤0.001; ****p ≤0.0001. Two-way ANOVA was performed. (C) sgROSA- or sgHuwe1-expressing BMDMs were treated with LPS as indicated. Gapdh-normalized Il6 mRNA levels were measured by RT-qPCR. Data represent the mean and s.d.; with n=2 biological replicates. ****p ≤0.0001. Two-way ANOVA was performed. (D) Differentiation of sgROSA- or sgHuwe1-expressing BMDMs after 7 days of M-CSF treatment was analyzed by F4/80 staining and analysis by flow cytometry. (E) RAW264.7-Dox-Cas9 cells expressing sgROSA or sgHuwe1 single sgRNA vectors, or sgROSA-sgTTP or sgHuwe1-sgTTP double sgRNA vectors were incubated with LPS for the indicated times. Tnf mRNA expression was determined by RT-qPCR. Data represent the mean and s.d.; n=3 biological replicates. ****p ≤0.0001. Two-way ANOVA was performed. (F) RAW264.7-Dox-Cas9 cells expressing sgROSA or sgHuwe1 were treated with LPS for the indicated times. During the last 2 hr, Brefeldin A was added to block cytokine secretion. Intracellular TNF protein levels were analyzed by flow-cytometry. Data represent the mean and s.d.; n=3 biological replicates. **p ≤ 0.01. Two-way ANOVA was performed.
Figure 4 with 1 supplement
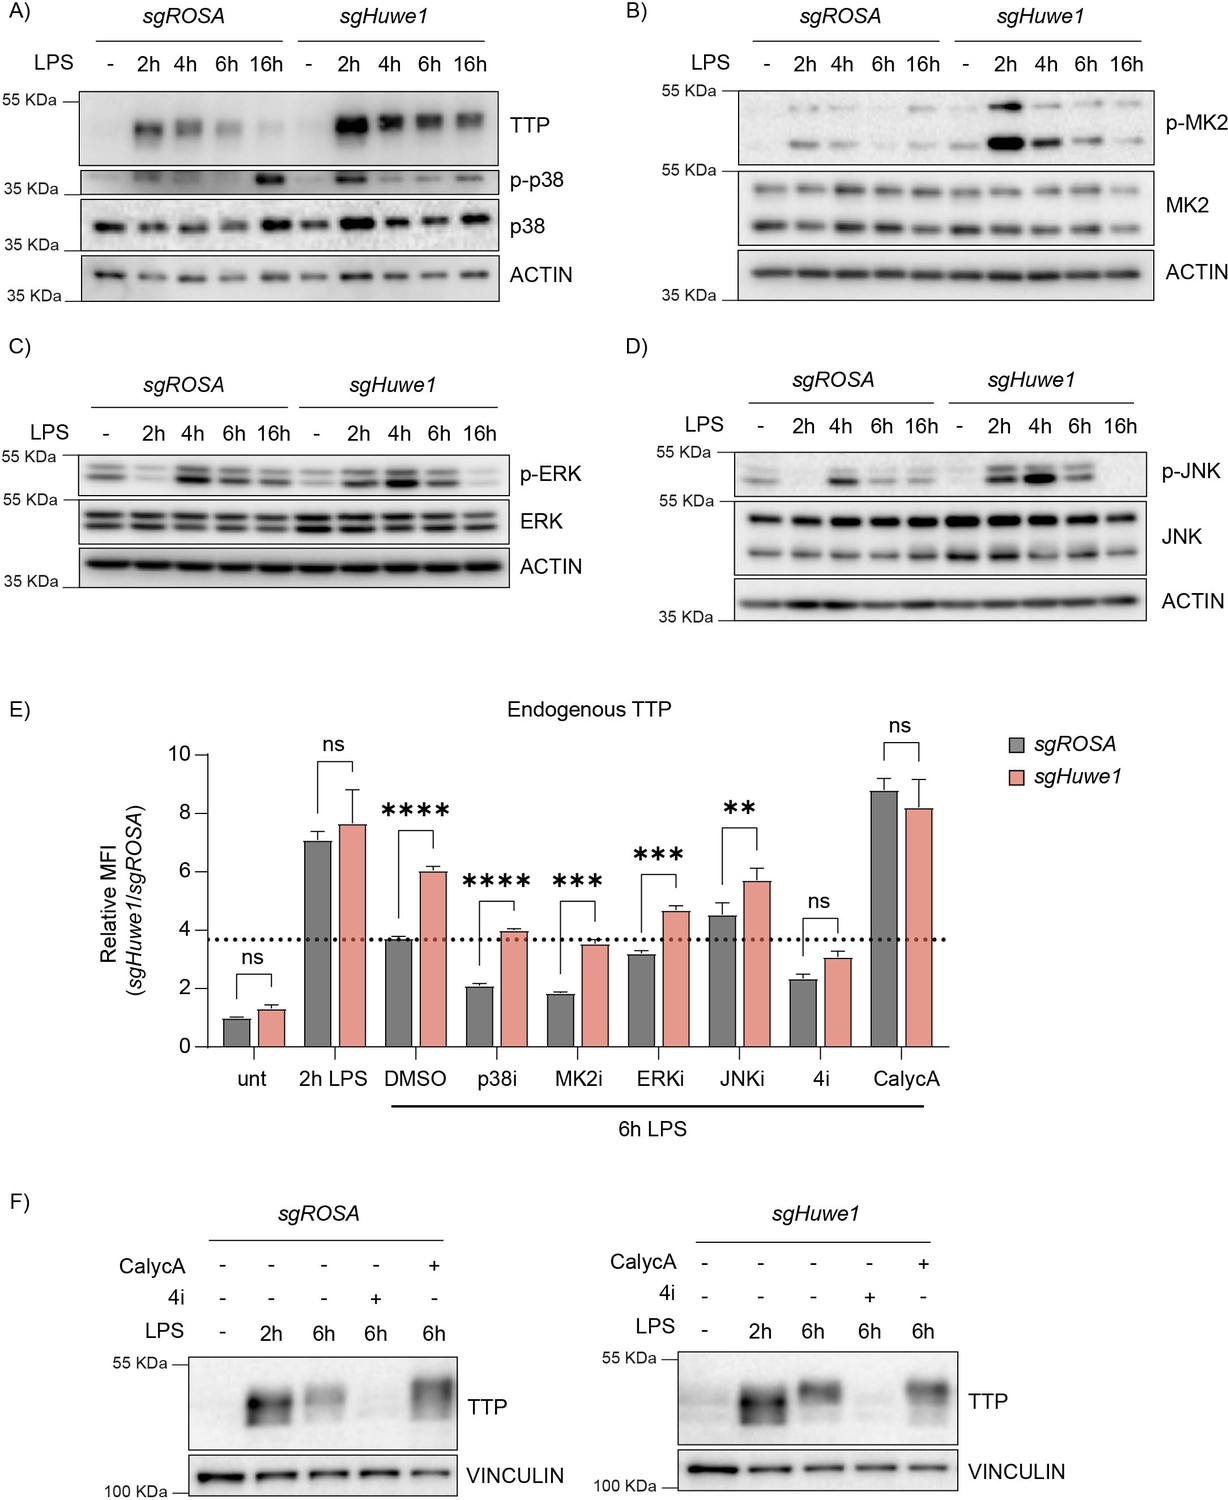
HUWE1 regulates TTP phosphorylation status, and thereby TTP stability.
(A–D) RAW264.7-Dox-Cas9 cells expressing sgROSA or sgHuwe1 were treated with Dox for 5 days to induce Cas9. Cells were incubated with LPS for the indicated time points (h). Phosphorylation of (A) p38, (B) MK2, (C) ERK, and (D) JNK was determined by western blot. (E) sgROSA- or sgHuwe1-RAW264.7-Dox-Cas9 cells were treated with LPS or left untreated. After 2 h of LPS treatment, cells were incubated with p38i, MK2i, ERKi, JNKi, or PP1/2 inhibitor Calyculin A (CalycA). TTP levels were analyzed by flow cytometry and normalized MFI plotted. Data represent the mean and s.d.; n=3 biological replicates. **p ≤ 0.01; ***p≤ 0.001; ****p ≤0.0001. Two-way ANOVA was performed. Dotted horizontal line indicates TTP abundance in the DMSO control at 6 hr post-LPS treatment. (F) sgROSA- or sgHuwe1-RAW264.7-Dox-Cas9 cells were treated with LPS for the indicated times. During the last 4 hr of LPS stimulation, the indicated inhibitors were added, after which endogenous TTP levels were analyzed by WB.
-
Figure 4—source data 1
Blots corresponding to Figure 4A.
- https://cdn.elifesciences.org/articles/83159/elife-83159-fig4-data1-v1.zip
-
Figure 4—source data 2
Blots corresponding to Figure 4B.
- https://cdn.elifesciences.org/articles/83159/elife-83159-fig4-data2-v1.zip
-
Figure 4—source data 3
Blots corresponding to Figure 4C.
- https://cdn.elifesciences.org/articles/83159/elife-83159-fig4-data3-v1.zip
-
Figure 4—source data 4
Blots corresponding to Figure 4D.
- https://cdn.elifesciences.org/articles/83159/elife-83159-fig4-data4-v1.zip
-
Figure 4—source data 5
Blots corresponding to Figure 4F.
- https://cdn.elifesciences.org/articles/83159/elife-83159-fig4-data5-v1.zip
Figure 4—figure supplement 1
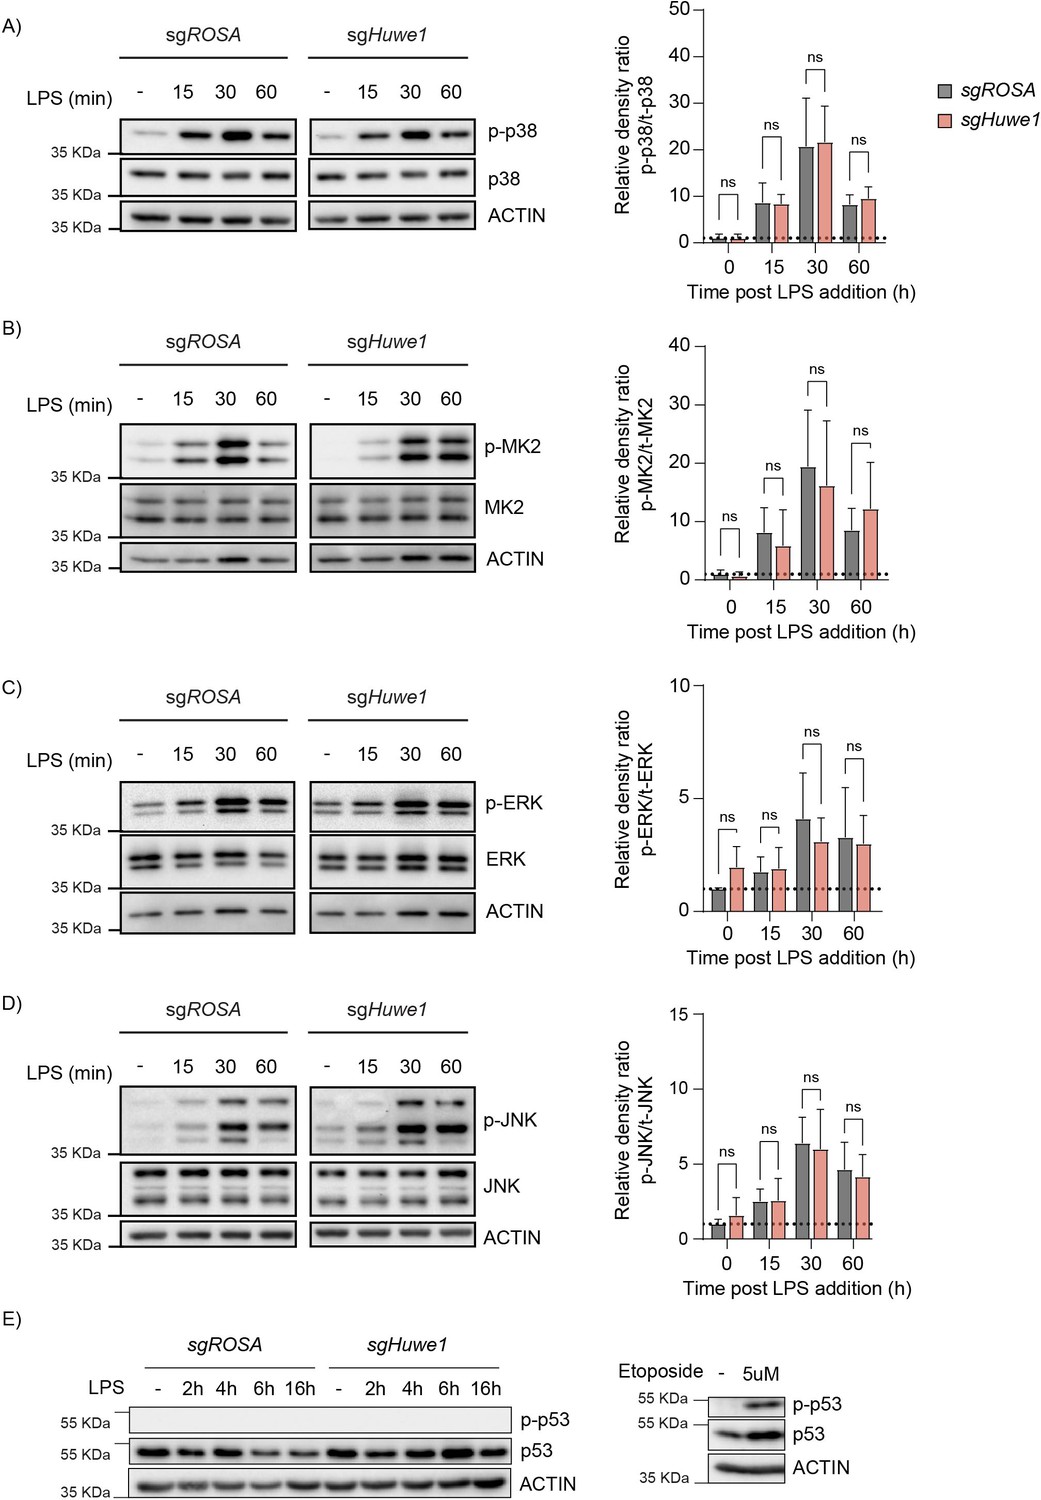
HUWE1 regulates TTP phosphorylation status, and thereby its TTP stability.
(A–D) RAW264.7-Dox-Cas9 cells expressing sgROSA or sgHuwe1 were treated with Dox for 5 days to induce Cas9. Cells were incubated with LPS for the indicated time points (min). Phosphorylation of (A) p38, (B) MK2, (C) ERK, and (D) JNK was determined by western blot. Total and phosphorylated kinase levels were quantified from non-saturated western blot signals and normalized to ACTIN. The ratio of the phosphorylated protein signals to their respective total protein signals was plotted. Data represent the mean and s.d.; n=3 biological replicates. Two-way ANOVA was performed. (E) RAW264.7-Dox-Cas9 cells expressing sgROSA or sgHuwe1 were treated with Dox for 5 days to induce Cas9. Cells were incubated with LPS for the indicated time points (h). Phosphorylation of p53 was assessed by western blot. As a control for the induction of p-p53, RAW264.7-Dox-Cas9 were treated with DNA damage inducer Etoposide for 6 hr.
-
Figure 4—figure supplement 1—source data 1
Blots corresponding to Figure 4—figure supplement 1A.
- https://cdn.elifesciences.org/articles/83159/elife-83159-fig4-figsupp1-data1-v1.zip
-
Figure 4—figure supplement 1—source data 2
Blots corresponding to Figure 4—figure supplement 1B.
- https://cdn.elifesciences.org/articles/83159/elife-83159-fig4-figsupp1-data2-v1.zip
-
Figure 4—figure supplement 1—source data 3
Blots corresponding to Figure 4—figure supplement 1C.
- https://cdn.elifesciences.org/articles/83159/elife-83159-fig4-figsupp1-data3-v1.zip
-
Figure 4—figure supplement 1—source data 4
Blots corresponding to Figure 4—figure supplement 1D.
- https://cdn.elifesciences.org/articles/83159/elife-83159-fig4-figsupp1-data4-v1.zip
-
Figure 4—figure supplement 1—source data 5
Blots corresponding to Figure 4—figure supplement 1E.
- https://cdn.elifesciences.org/articles/83159/elife-83159-fig4-figsupp1-data5-v1.zip
Figure 5 with 1 supplement
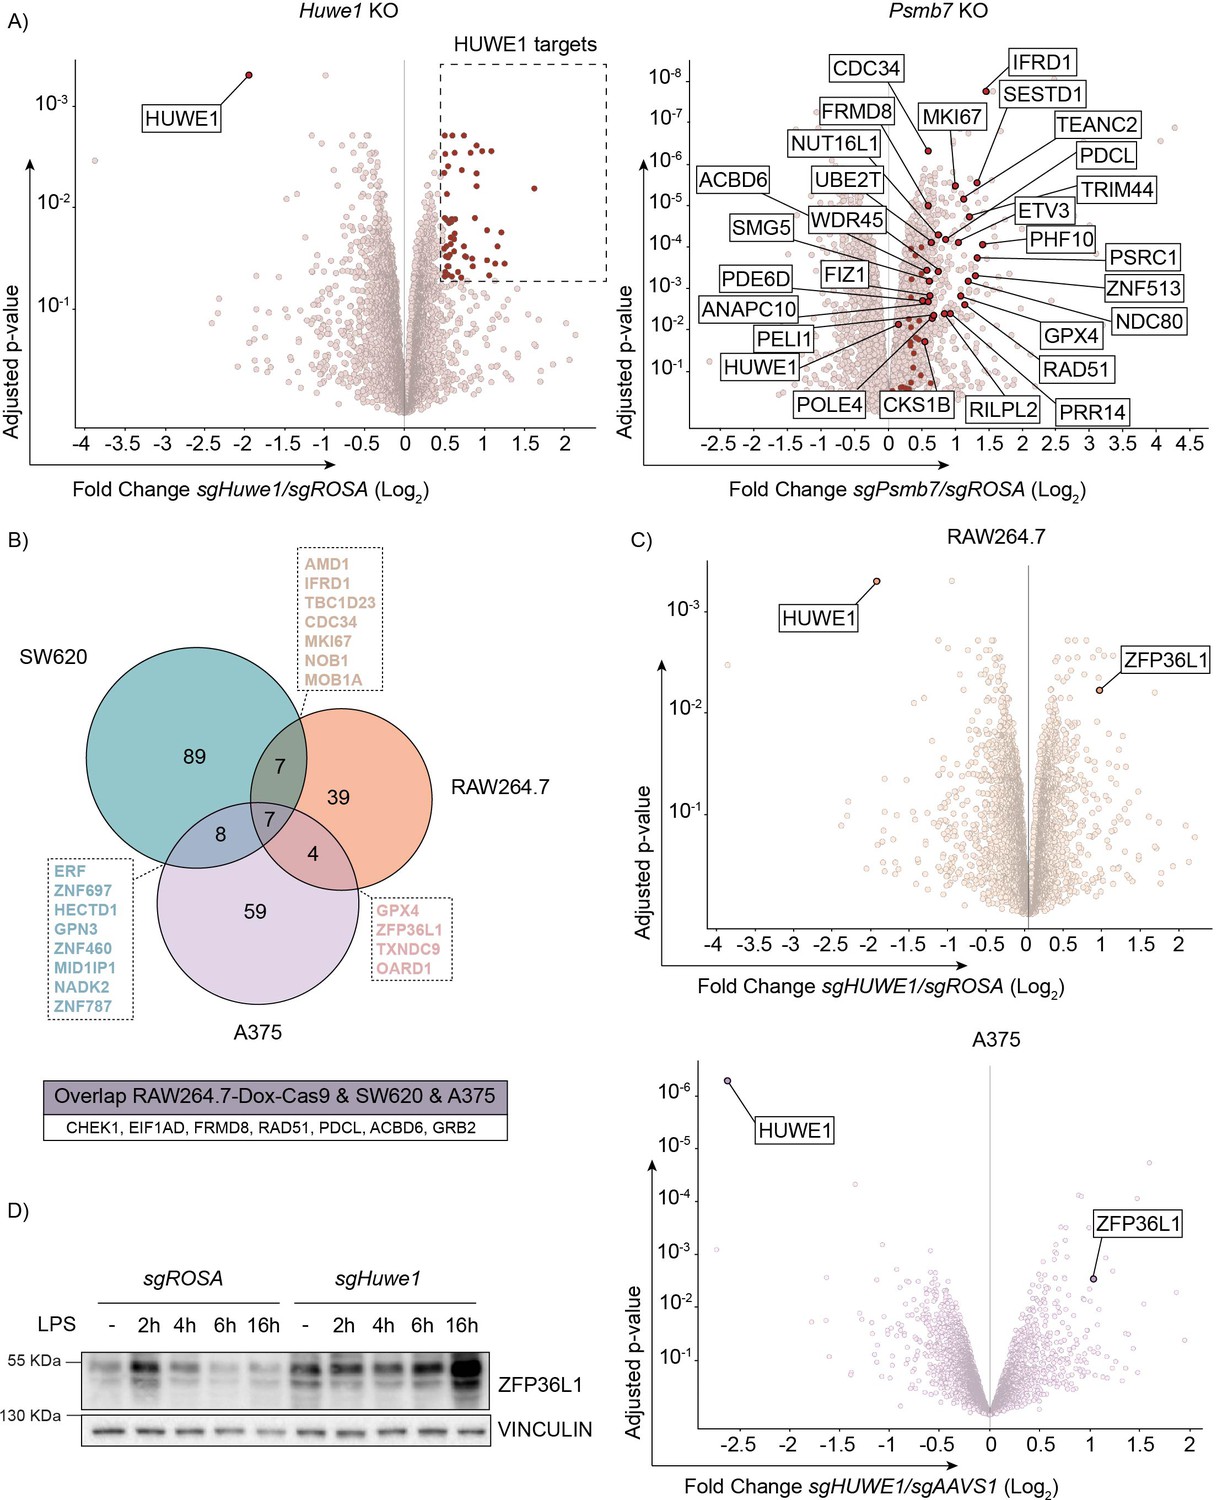
TTP family member ZFP36L1 abundance is increased upon HUWE1 knockout in human and mouse cells.
(A) RAW264.7-Dox-Cas9 expressing sgROSA, sgHuwe1 or sgPsmb7 were treated with Dox for 3 days to induce Cas9. Proteome changes were assessed by quantitative mass spectrometry. Proteins classified as HUWE1 targets are highlighted in red. Shared HUWE1 and proteasome targets are labelled in the Psmb7 knock-out volcano plot. (adjusted p-value ≤0.05 and Fold Change (Log2) ≥0.5; n=3 biological replicates). (B) Venn diagram showing the overlap between proteome changes of Huwe1-targeted RAW264.7, A375, and SW620 cell lines. Shared targets are listed (adjusted p-value ≤0.05 and Fold Change (Log2) ≥0.5; n=3 biological replicates). (C) Volcano plots representing proteome changes of Huwe1- and AAVS1/ROSA-targeted A375 human melanoma cells and RAW264.7-Dox-Cas9 cells (adjusted p-value ≤0.05 and Fold Change (Log2) ≥0.5; n=3 biological replicates). The shared HUWE1 target ZFP36L1 is highlighted. (D) sgROSA or sgHuwe1 knockout RAW264.7-Dox-Cas9 cells were treated with Dox for 5 days to induce Cas9, followed by LPS treatment for the indicated times (h). Endogenous ZFP36L1 protein levels were determined by western blot.
-
Figure 5—source data 1
Blots corresponding to Figure 5D.
- https://cdn.elifesciences.org/articles/83159/elife-83159-fig5-data1-v1.zip
-
Figure 5—source data 2
Quantitative proteomics to systematically assess protein changes after HUWE1 knockout, in RAW264.7-Dox-Cas9, A375, and SW620 cell lines.
- https://cdn.elifesciences.org/articles/83159/elife-83159-fig5-data2-v1.zip
Figure 5—figure supplement 1
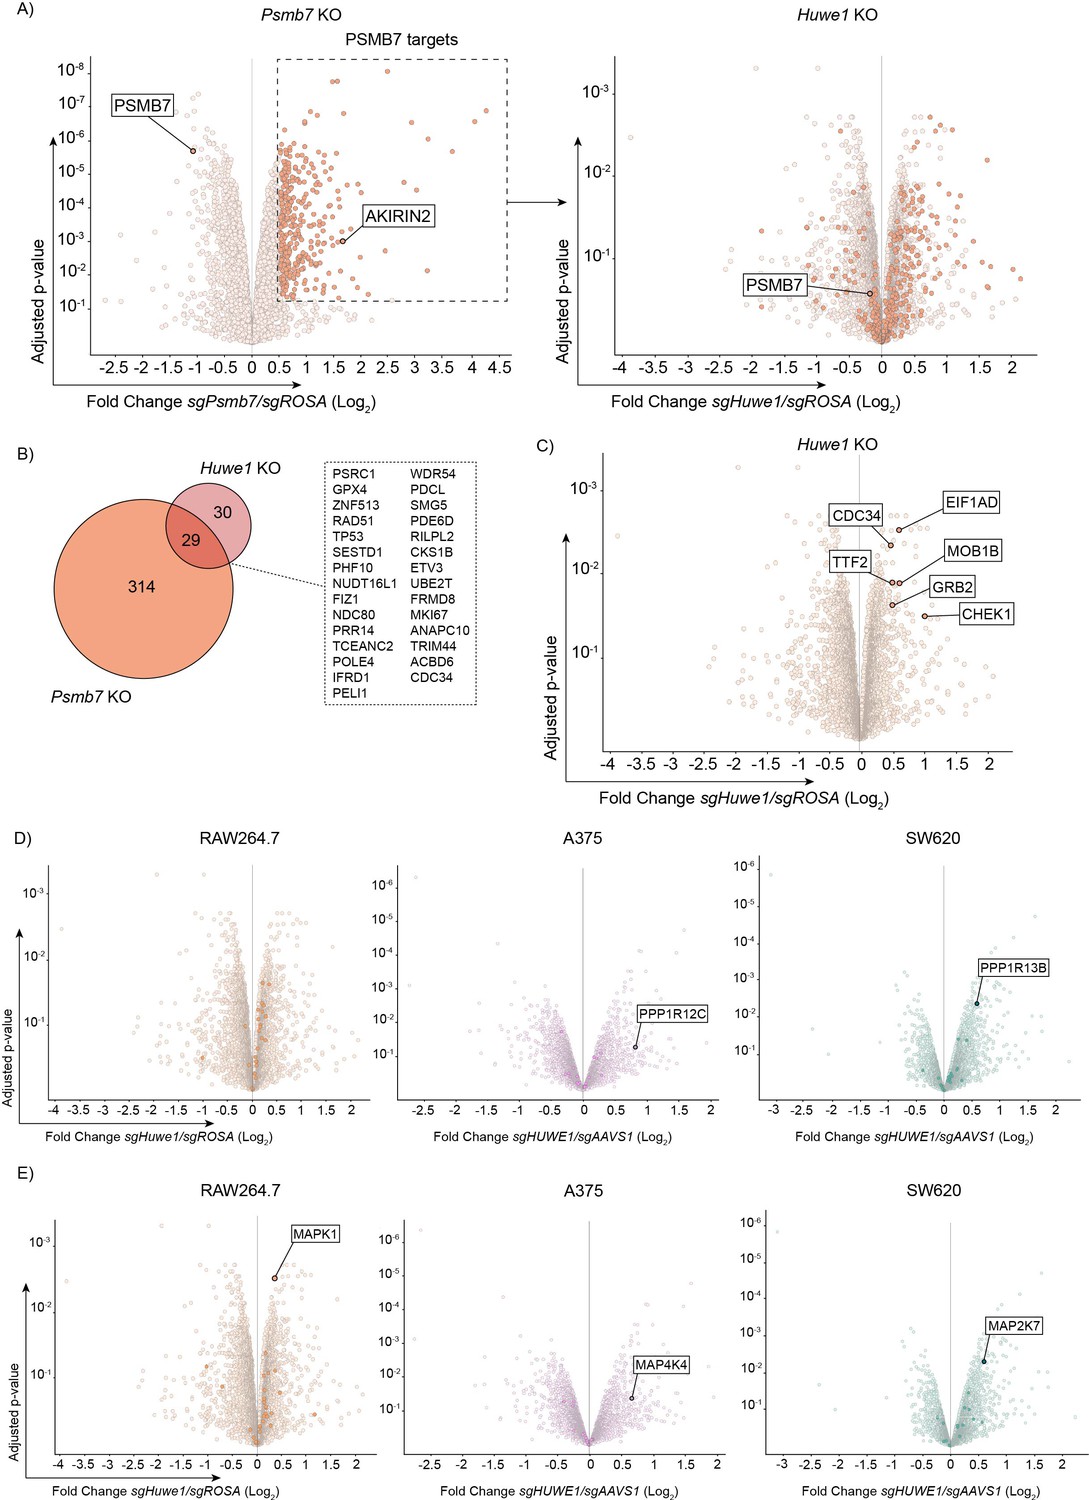
Abundance of the TTP family member ZFP36L1 is increased upon HUWE1 knockout in human and mouse.
(A) Proteome changes in RAW264.7-Dox-Cas9 cells expressing sgPsmb7 by quantitative mass-spectrometry. Proteins classified as PSMB7 targets are highlighted in orange and displayed in the Huwe1 knock-out volcano plot. (adjusted p-value ≤0.05 and Fold Change (Log2) ≥0.5; n=3 biological replicates) (B) Venn diagram showing the overlap in proteome changes of Psmb7- and Huwe1-targeted RAW264.7-Dox-Cas9 cells. Shared targets are listed. Twenty-nine proteins were identified as common targets (adjusted p-value ≤0.05 and Fold Change (Log2) ≥0.5; n=3 biological replicates). (C) Volcano plot representing proteome changes of Huwe1- and ROSA- targeted RAW264.7-Dox-Cas9 cells. Known HUWE1 targets are highlighted in orange (adjusted p-value ≤0.05 and Fold Change (Log2) ≥0.5; n=3 biological replicates). (D–E) Proteome changes of Huwe1-targeted RAW264.7, A375, and SW620 cell lines are plotted. PP1/2 protein components in (D), and MAPK proteins in (E), are highlighted as solid dots. Only significantly enriched proteins are labelled (adjusted p-value ≤0.05 and Fold Change (Log2) ≥0.5; n=3 biological replicates).
Figure 6 with 1 supplement
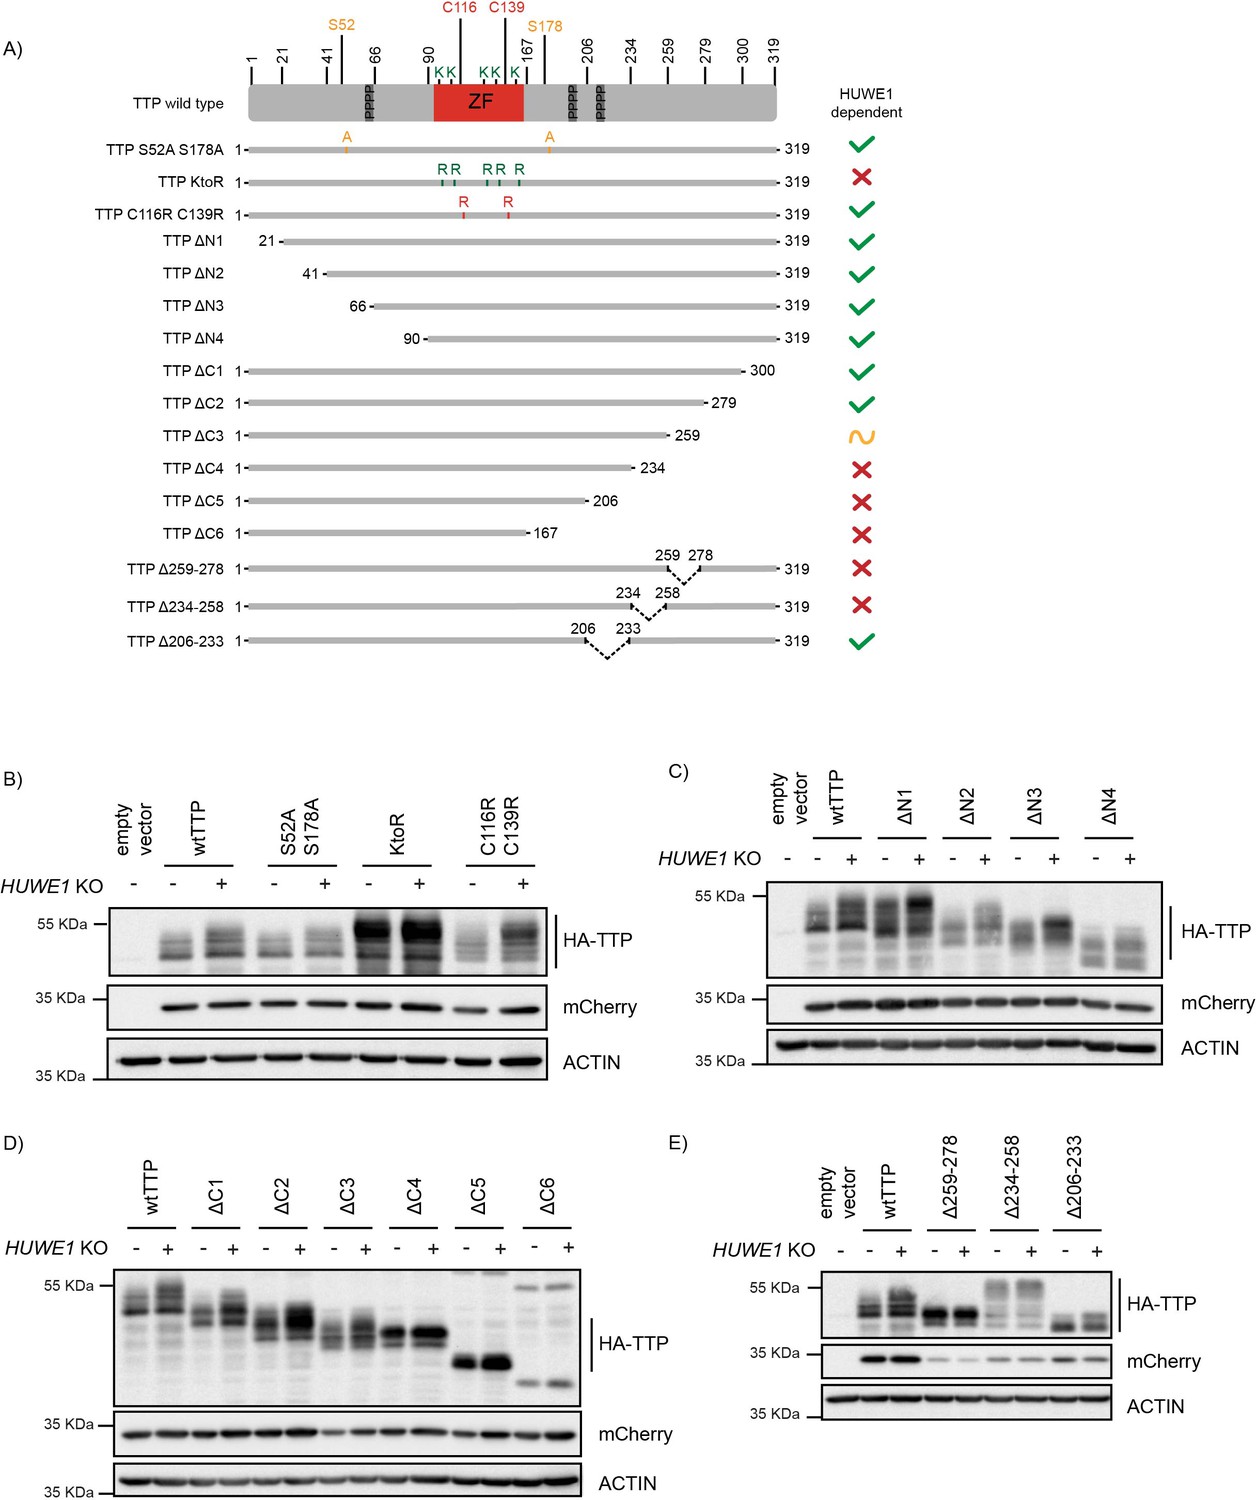
Residues in the TTP 234–278 region are important for its stability.
(A) Schematic representation of 3xHA-TTP mutants. Colors denote amino acid substitutions. ZF indicates the zinc finger domain, and the three tetraprolin motifs are presented as dark grey boxes. (B–E) sgAAVS1- and sgHUWE1-depleted HEK-293T-Cas9 cells were transfected with the indicated mutants, and 3xHA-TTP stability was determined by western blot. mCherry is expressed as a stable internal control through a P2A site.
-
Figure 6—source data 1
Blots corresponding to Figure 6B.
- https://cdn.elifesciences.org/articles/83159/elife-83159-fig6-data1-v1.zip
-
Figure 6—source data 2
Blots corresponding to Figure 6C.
- https://cdn.elifesciences.org/articles/83159/elife-83159-fig6-data2-v1.zip
-
Figure 6—source data 3
Blots corresponding to Figure 6D.
- https://cdn.elifesciences.org/articles/83159/elife-83159-fig6-data3-v1.zip
-
Figure 6—source data 4
Blots corresponding to Figure 6E.
- https://cdn.elifesciences.org/articles/83159/elife-83159-fig6-data4-v1.zip
Figure 6—figure supplement 1
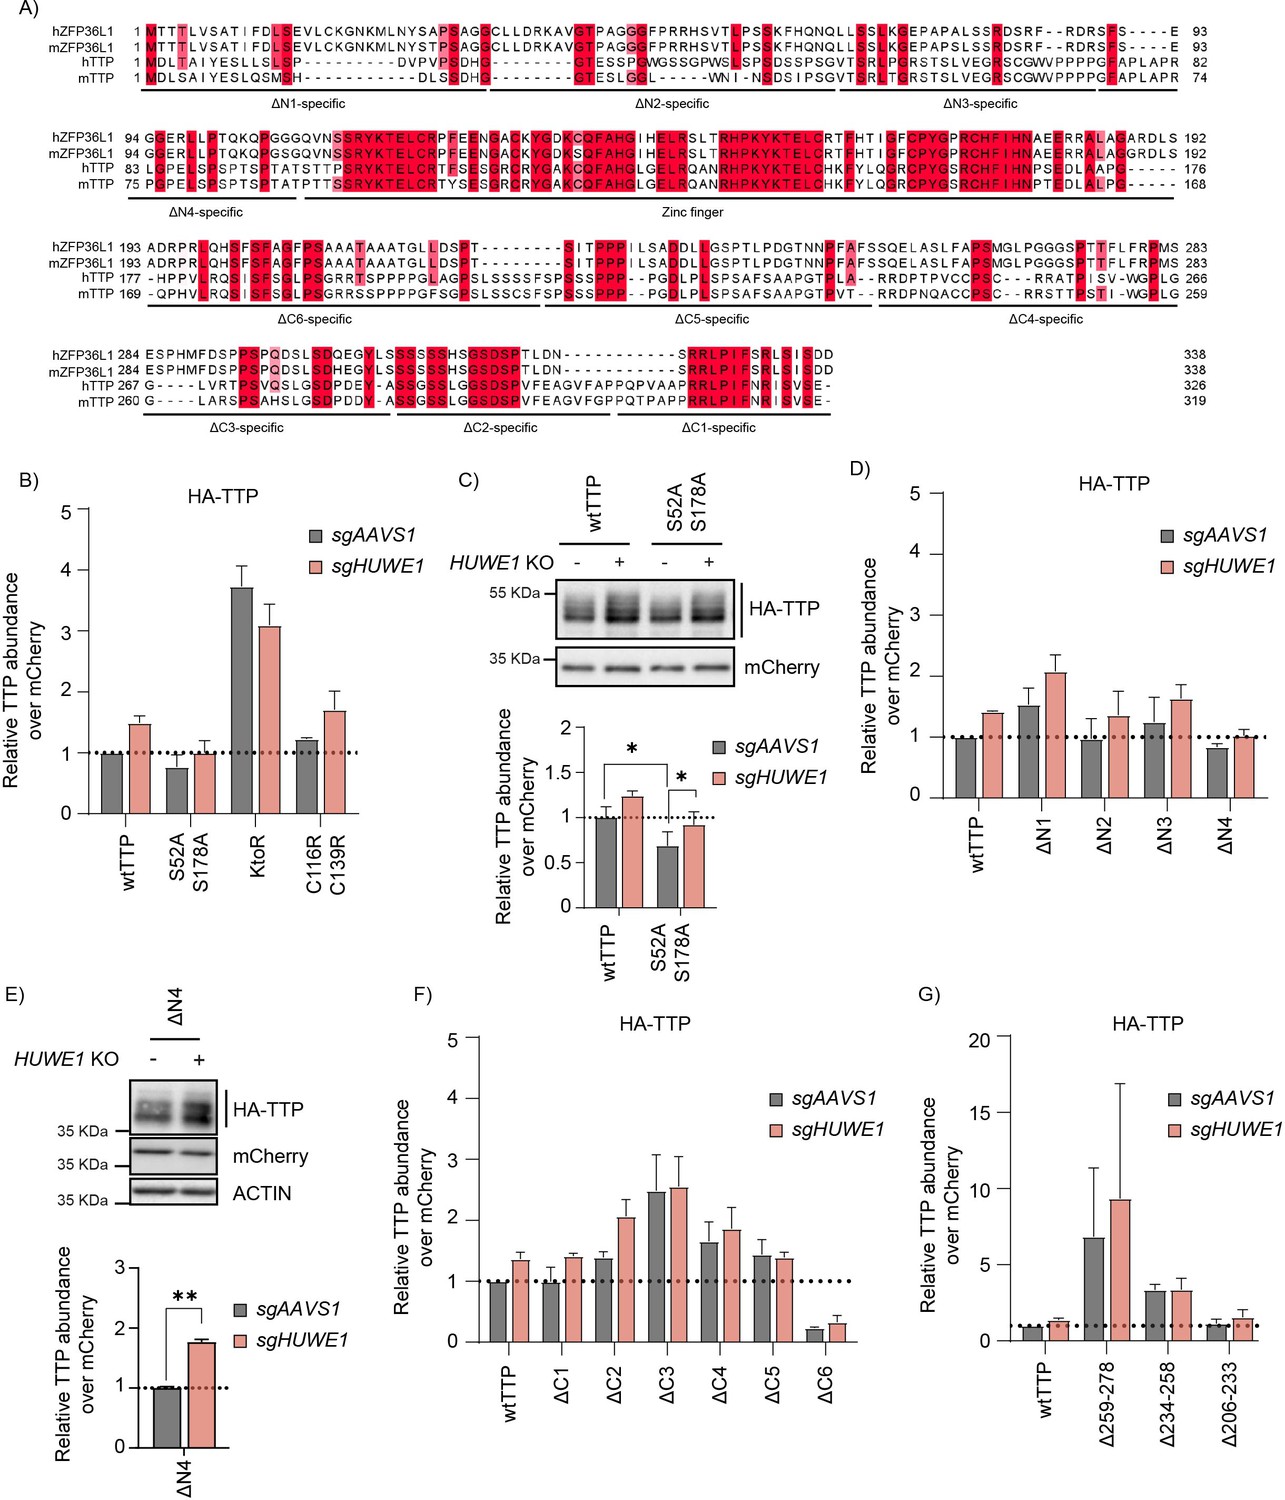
Residues in the TTP 234–278 region are important for its stability.
(A) Alignment of mouse and human TTP and ZFP36L1 orthologs. (B) TTP protein levels from Figure 6B were quantified from non-saturated western blot signals, normalized to the internal control mCherry, and plotted. Data represent the mean and s.d.; n=2 biological replicates. (C) HEK-293T-Cas9 cells expressing sgAAVS1 or sgHUWE1 were transfected with plasmids encoding HA-tagged wtTTP or its S52/178 A mutant. HA-TTP protein levels were analyzed by WB. n=6 biological replicates, analyzed by unpaired t-test. (D) TTP protein levels from Figure 6C were quantified from non-saturated western blot signals, normalized to the internal control mCherry, and plotted. Data represent the mean and s.d.; n=2 biological replicates. (E) HEK-293T-Cas9 cells expressing sgAAVS1 or sgHUWE1 were transfected with plasmids encoding the HA-tagged TTP-Δ4 mutant. HA-TTP protein levels were quantified by WB. n=2 biological replicates, analyzed by unpaired t-test. (F–G) TTP protein levels from Figure 6D–E were quantified from non-saturated western blot signals, normalized to the internal control mCherry, and plotted. Data represent the mean and s.d.; n=2 biological replicates.
-
Figure 6—figure supplement 1—source data 1
Blots corresponding to Figure 6—figure supplement 1C.
- https://cdn.elifesciences.org/articles/83159/elife-83159-fig6-figsupp1-data1-v1.zip
-
Figure 6—figure supplement 1—source data 2
Blots corresponding to Figure 6—figure supplement 1E.
- https://cdn.elifesciences.org/articles/83159/elife-83159-fig6-figsupp1-data2-v1.zip
Figure 7
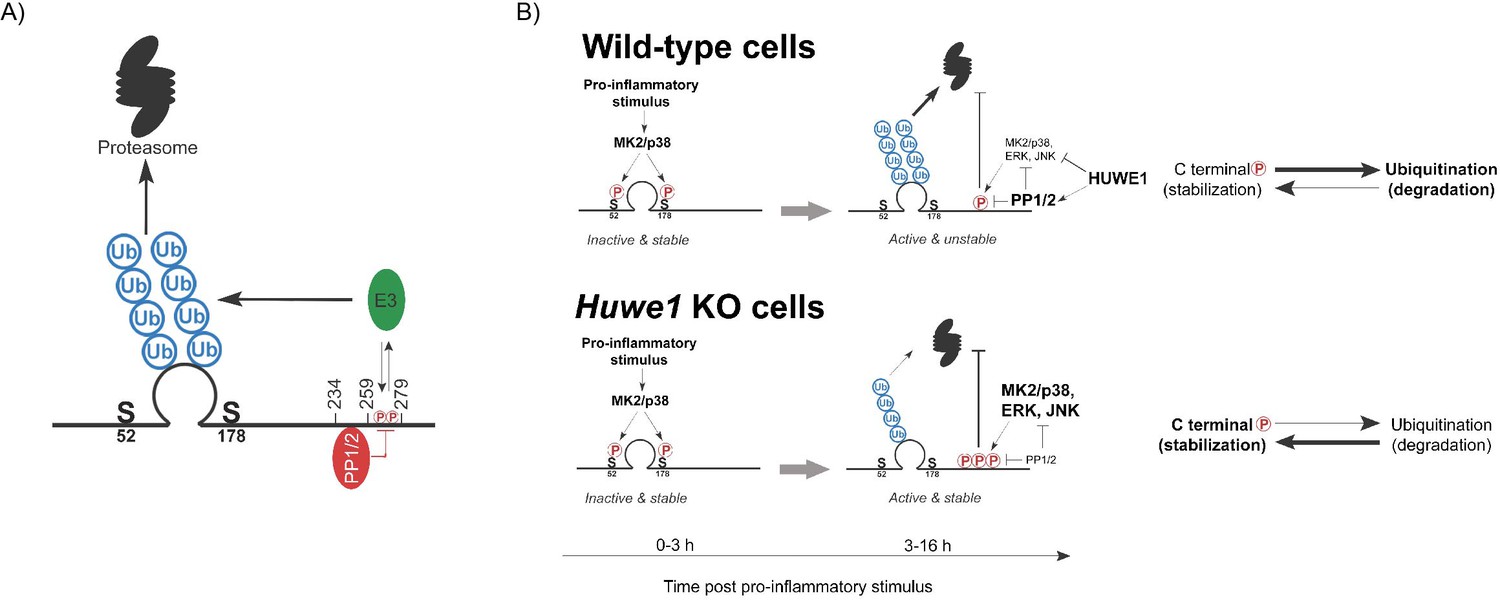
Model of HUWE1-dependent TTP regulation.
(A) Model indicating the TTP regions in its C-terminus speculated to recruit PP1/2 and an unknown E3 ligase that ubiquitinates the zinc finger domain. (B) Model of TTP stability regulation through phosphorylation in wild-type cells and Huwe1-deficient cells.
Tables
Table 1
Vectors.
| Plasmid | Purpose | Reference or source |
|---|---|---|
| pRRL-TRE3G-Cas9-P2A-GFP-PGK-IRES-rtTA3 | Dox inducible Cas9 | Johannes Zuber, IMP |
| pLX303-mCherry.TTP-P2A-BFP | TTP reporter | This study |
| pLX303-MYC-mCherry-P2A-3xHA.TTP | TTP reporter | This study |
| pLX303-MYC-mCherry-P2A-3xHA.TTP ΔC1 | TTP reporter | This study |
| pLX303-MYC-mCherry-P2A-3xHA.TTP ΔC2 | TTP reporter | This study |
| pLX303-MYC-mCherry-P2A-3xHA.TTP ΔC3 | TTP reporter | This study |
| pLX303-MYC-mCherry-P2A-3xHA.TTP ΔC4 | TTP reporter | This study |
| pLX303-MYC-mCherry-P2A-3xHA.TTP ΔC5 | TTP reporter | This study |
| pLX303-MYC-mCherry-P2A-3xHA.TTP ΔC6 | TTP reporter | This study |
| pLX303-MYC-mCherry-P2A-3xHA.TTP ΔN1 | TTP reporter | This study |
| pLX303-MYC-mCherry-P2A-3xHA.TTP ΔN2 | TTP reporter | This study |
| pLX303-MYC-mCherry-P2A-3xHA.TTP ΔN3 | TTP reporter | This study |
| pLX303-MYC-mCherry-P2A-3xHA.TTP ΔN4 | TTP reporter | This study |
| pLX303-MYC-mCherry-P2A-3xHA.TTP Δ259–278 | TTP reporter | This study |
| pLX303-MYC-mCherry-P2A-3xHA.TTP ΔC234-258 | TTP reporter | This study |
| pLX303-MYC-mCherry-P2A-3xHA.TTP Δ206–233 | TTP reporter | This study |
| pLX303-MYC-mCherry-P2A-3xHA.TTP KtoR | TTP reporter | This study |
| pLX303-MYC-mCherry-P2A-3xHA.TTP S52A S178A | TTP reporter | This study |
| pLX303-MYC-mCherry-P2A-3xHA.TTP ZNF C116R C139R | TTP reporter | This study |
| pLX303-MYC-mCherry-P2A-3xHA.TTP K97R | TTP reporter | This study |
| pLX303-MYC-mCherry-P2A-3xHA.TTP K115R | TTP reporter | This study |
| pLX303-MYC-mCherry-P2A-3xHA.TTP K133R | TTP reporter | This study |
| pLX303-MYC-mCherry-P2A-3xHA.TTP K135R | TTP reporter | This study |
| pLX303-MYC-mCherry-P2A-3xHA.TTP K141R | TTP reporter | This study |
| pLX303-MYC-mCherry-P2A-3xHA.TTP K97R/K115R | TTP reporter | This study |
| pLX303-MYC-mCherry-P2A-3xHA.TTP K97R/K115R/K133R | TTP reporter | This study |
| pLX303-MYC-mCherry-P2A-3xHA.TTP K97R/K115R/K133R/K135R | TTP reporter | This study |
| pLX303-MYC-mCherry-P2A-3xHA.TTP K135R/K141R | TTP reporter | This study |
| pLX303-MYC-mCherry-P2A-3xHA.TTP K133R/K135R/K141R | TTP reporter | This study |
| pLX303-MYC-mCherry-P2A-3xHA.TTP K115R/K133R/K135R/K141R | TTP reporter | This study |
| CMV-Flag-TTP | TTP reporter | Pavel Kovarik, Max Perutz Labs |
| DualCRISPR-hU6-sgRNA-mU6-sgRNA-EF1as-BFP | Dual sgRNA | de Almeida M, Hinterndorfer M et al, 2021 |
| pLentiv2-U6-PGK-iRFP670-P2A-Neo | Single sgRNA | de Almeida M, Hinterndorfer M et al, 2022 |
| pLentiv2-U6-PGK-BFP-P2A-Neo | Single sgRNA | de Almeida M, Hinterndorfer M et al, 2023 |
| PRRL-PBS-U6-sgRNA-EF1as-Thy1-P2A-NeoR (sgETN) | Library sgRNA | Johannes Zuber, IMP |
Table 2
sgRNA coding sequences.
| Gene | Species | Sequence (5' to 3') |
|---|---|---|
| ROSA_1 (RAW264.7 & BMDMs) | mouse | AGATGGGCGGGAGTCTTC |
| ROSA_2 (RAW264.7 & BMDMs) | mouse | TTTAGATGGGCGGGAGTCTTCGTTTA |
| Huwe1_1 (RAW264.7 & BMDMs) | mouse | GATTTGCTGCAGTTCCAAG |
| Huwe1_2 (RAW264.7 & BMDMs) | mouse | ATAAAATTCAAAGTGTAGTG |
| Psmb7_1 (RAW264.7 & BMDMs) | mouse | GCTGTAACAACTCTCGGG |
| Psmb7_2 (RAW264.7 & BMDMs) | mouse | GAAAACTGGCACTACCATCG |
| Vcpip1 (RAW264.7 & BMDMs) | mouse | GACGTGCTCTGGTTCGATG |
| Ppil4 (RAW264.7 & BMDMs) | mouse | GTGTTTGGTGAAGTGACAGA |
| Tceb1 (RAW264.7 & BMDMs) | mouse | GCTGAGAATGAAACCAACG |
| Ube3c (RAW264.7 & BMDMs) | mouse | GAGAGTCAAAGTTCAAAA |
| Ddx23 (RAW264.7 & BMDMs) | mouse | GGATGGAGCGGGAGACCAA |
| Cnot10 (RAW264.7 & BMDMs) | mouse | GATTTCACAGGGTAGCGG |
| Ttp (RAW264.7 & BMDMs) | mouse | GAAGCGGGCGTTGTCGCTACG |
| AAVS1_1 (RKO & HEK-293T) | human | CTGTGCCCCGATGCACAC |
| AAVS1_2 (RKO & HEK-293T) | human | GCTGTGCCCCGATGCACAC |
| HUWE1_1 (RKO & HEK-293T) | human | GTGCGAGTTATATCACTGGG |
| HUWE1_2 (RKO & HEK-293T) | human | GTGCGAGTTATATCACTGGGTGG |
| AAVS1_3 (A375 & SW620) | human | GCTGTGCCCCGATGCACAC |
| AAVS1_4 (A375 & SW620) | human | GCTTGGCAAACTCACTCTT |
| HUWE1_3 (A375 & SW620) | human | GTGCGAGTTATATCACTGGG |
| HUWE1_4 (A375 & SW620) | human | GACAGTGGAGAATATGTCA |
Table 3
Cells and culture conditions.
| Cell lines and primary cells | Type | Reference or source | Purpose | Media | Supplements |
|---|---|---|---|---|---|
| RAW264.7 | Murine macrophages | ATCC TIB-71 | parental cell line | Dulbecco’s modified Eagle’s medium (DMEM; Sigma-Aldrich, D6429) | 10% FBS (Sigma-Aldrich, F7524) and 1% penicillin/streptomycin (Sigma-Aldrich, P4333) |
| RAW264.7-Dox-Cas9 | Murine macrophages | This study | Dox-inducible Cas9 | Dulbecco’s modified Eagle’s medium (DMEM; Sigma-Aldrich, D6429) | 10% FBS (Sigma-Aldrich, F7524) and 1% penicillin/streptomycin (Sigma-Aldrich, P4333) |
| RAW264.7-Dox-Cas9 mCherry-TTP-P2A-BFP | Murine macrophages | This study | mCherry-TTP reporter | Dulbecco’s modified Eagle’s medium (DMEM; Sigma-Aldrich, D6429) | 10% FBS (Sigma-Aldrich, F7524) and 1% penicillin/streptomycin (Sigma-Aldrich, P4333) |
| RAW264.7-Dox-Cas9 mCherry-IkBα-P2A-BFP | Murine macrophages | This study | mCherry-IkBα reporter | Dulbecco’s modified Eagle’s medium (DMEM; Sigma-Aldrich, D6429) | 10% FBS (Sigma-Aldrich, F7524) and 1% penicillin/streptomycin (Sigma-Aldrich, P4333) |
| RAW264.7-Dox-Cas9 3xHA-TTP | Murine macrophages | This study | 3xHA-TTP reporter | Dulbecco’s modified Eagle’s medium (DMEM; Sigma-Aldrich, D6429) | 10% FBS (Sigma-Aldrich, F7524) and 1% penicillin/streptomycin (Sigma-Aldrich, P4333) |
| Bone Marrow Derived Macrophages, BMDMs | Murine macrophages | This study | constitutive Cas9 expression | Dulbecco’s modified Eagle’s medium (DMEM; Sigma-Aldrich, D6429) | 10% FBS (Sigma-Aldrich, F7524) and 1% penicillin/streptomycin (Sigma-Aldrich, P4333) |
| HEK293T | Human kidney neural tissue | CRL-3216 | 3xHA-TTP mutants | Dulbecco’s modified Eagle’s medium (DMEM; Sigma-Aldrich, D6429) | 10% FBS (Sigma-Aldrich, F7524) and 1% penicillin/streptomycin (Sigma-Aldrich, P4333) |
| Lenti-X 293T | Human kidney neural tissue | Takara, Cat# 632180 | VLP production | Dulbecco’s modified Eagle’s medium (DMEM; Sigma-Aldrich, D6429) | 10% FBS (Sigma-Aldrich, F7524) and 1% penicillin/streptomycin (Sigma-Aldrich, P4333) |
| RKO | human colon carcinoma | de Almeida M, Hinterndorfer M et al, 2021 | Dox-inducible Cas9 | RPMI 1640 (Thermo Fisher Scientific, 21875) | 10% FBS (Sigma-Aldrich, F7524), L-glutamine (4 mM, Gibco), sodium pyruvate (1 mM, Sigma-Aldrich), and 1% penicillin/streptomycin (Sigma-Aldrich, P4333) |
| A375 | human melanoma | This study | Dox-inducible Cas9 | Dulbecco’s modified Eagle’s medium (DMEM; Sigma-Aldrich, D6429) | 10% FBS (Sigma-Aldrich, F7524), L-glutamine (4 mM, Gibco) and 1% penicillin/streptomycin (Sigma-Aldrich, P4333) |
| SW620 | human colon carcinoma | This study | Dox-inducible Cas9 | Dulbecco’s modified Eagle’s medium (DMEM; Sigma-Aldrich, D6429) | 10% FBS (Sigma-Aldrich, F7524), L-glutamine (4 mM, Gibco) and 1% penicillin/streptomycin (Sigma-Aldrich, P4333) |
Table 4
reagents.
| Description | Abbreviation | Application | Dilution/concentration | Manufacturer | Catalogue number |
|---|---|---|---|---|---|
| Lipopolysaccharides from Escherichia coli O55:B5 | LPS | Cell culture | 10 ng/ml | Sigma-Aldrich | L2637 |
| Cycloheximide | CHX | Cell culture | 40 μg/m | Sigma-Aldrich | C1988 |
| MG132 | MG132 | Cell culture | 10 μM | Sigma-Aldrich | M7449 |
| Epoxomicin | EPX | Cell culture | 10 μM | Gentaur Molecular Products | 607-A2606 |
| TAK-243 | Cell culture | 0.5 μM | ChemScence | CS-0019384 | |
| Doxycycline hyclate | DOX | Cell culture | 500 ng/ml | Sigma-Aldrich | D9891 |
| G418 disulfate salt | G418 | Cell culture | 0.5–1 mg/ml | Sigma-Aldrich | A1720 |
| PH-797804, p38 inhibitor | p38i | Cell culture | 1 μM | Selleckchem | S2726 |
| JNK Inhibitor II, JNK inhibitor | JNKi | Cell culture | 20 μM | Sigma-Aldrich | 420119 |
| PF-3644022, MK2 inhibitor | MK2i | Cell culture | 10 μM | Sigma-Aldrich | PZ0188 |
| U0126, MEKi inhibitor | ERKi | Cell culture | 250 nM | Cell Signaling Technology | 9903 |
| Okadaic Acid | OA | Cell culture | 1 μM | Cell Signaling Technology | 5934 |
| Calyculin A | CalycA | Cell culture | 50 nM | Cell Signaling Technology | 9902 |
| Etoposide | Cell culture | 5 μM | Sigma-Aldrich | E1383 | |
| Brefeldin A | Cell culture | 10 ug/ml | Sigma-Aldrich | B7651 |
Table 5
antibodies.
| Target | Application | Dilution | Conjugate | Manufacturer | Catalogue number | Name | Type |
|---|---|---|---|---|---|---|---|
| TTP | Western blot | 1:1000 | Cell Signaling Technology | 71632 | D1I3T | Primary | |
| Myc Tag | Western blot | 1:5000 | Sigma-Aldrich | 05–724 | 4A6 | Primary | |
| HA tag | Western blot | 1:1000 | Cell Signaling Technology | 3724 | C29F4 | Primary | |
| HECTH9 | Western blot | 1:1000 | Cell Signaling Technology | 5695 | AX8D1 | Primary | |
| Lasu1/Ureb1 | Western blot | 1:1000 | Bethyl | A300-486A | Primary | ||
| Vinculin | Western blot | 1:1000 | Sigma-Aldrich | V9131 | V9131 | Primary | |
| phospho-p38 MAPK, Thr180/Tyr182 | Western blot | 1:1000 | Cell Signaling Technology | 9211 | Primary | ||
| p38 MAPK | Western blot | 1:1000 | Cell Signaling Technology | 9212 | Primary | ||
| phospho-SAPK/JNK, Thr183/Tyr185 | Western blot | 1:1000 | Cell Signaling Technology | 9251 | Primary | ||
| SAPK/JNK | Western blot | 1:1000 | Cell Signaling Technology | 9252 | Primary | ||
| phospho-p44/42 MAPK (Erk1/2), Thr202/Tyr204 | Western blot | 1:1000 | Cell Signaling Technology | 9101 | Primary | ||
| p44/42 MAPK (Erk1/2) | Western blot | 1:1000 | Cell Signaling Technology | 4695 | 137F5 | Primary | |
| p-MK2 (Thr334) | Western blot | 1:1000 | Cell Signaling Technology | 3007 | 27B7 | Primary | |
| MK2 | Western blot | 1:1000 | Cell Signaling Technology | 3042 | Primary | ||
| p-p53, Ser15 | Western blot | 1:1000 | Cell Signaling Technology | 9284 | Primary | ||
| p-p53 | Western blot | 1:1000 | Cell Signaling Technology | 2524 | 1C12 | Primary | |
| ZFP36L1/2 | Western blot | 1:1000 | Proteintech | 12306–1-AP | 12306–1-AP | Primary | |
| Ubiquitin | Western blot | 1:1000 | Santa Cruz Biotechnology | sc-8017 | P4D1 | Primary | |
| HRP-β-actin | Western blot | 1:20000 | HRP | Abcam | ab49900 | AC-15 | Primary |
| HRP anti-rabbit IgG | Western blot | 1:3500 | HRP | Cell Signaling Technology | 7074 | Secondary | |
| HRP anti-mouse IgG | Western blot | 1:3500 | HRP | Cell Signaling Technology | 7076 | Secondary | |
| TTP | FACS | 1:100 | Cell Signaling Technology | 71632 | D1I3T | Primary | |
| HECTH9 | FACS | 1:100 | Cell Signaling Technology | 5695 | AX8D1 | Primary | |
| TNF alpha | FACS | 1:100 | APC | eBioscience | 17-7321-82 | MP6-XT22 | Primary |
| Rat IgG1 kappa Isotype Control | FACS | 1:500 | APC | eBioscience | 17-4301-82 | eBRG1 | Primary |
| APC anti-CD90.1/Thy1.1 | FACS | 1:500 | APC | BioLegend | 202526 | Secondary | |
| Alexa Fluor Plus 594 anti-Mouse IgG | FACS | 1:500 | Alexa Fluor 594 | Thermo Fisher Scientific | A-21201 | Secondary | |
| Alexa Fluor Plus 680 anti-Rabbit IgG | FACS | 1:500 | Alexa Fluor 680 | Thermo Fisher Scientific | A-21076 | Secondary | |
| APC anti-F4/80 | FACS | 1:100 | APC | Thermo Fisher Scientific | 17-4801-82 | BM8 | Secondary |
| TruStain FcX mouse Fc Receptor CD16/32 | FACS | 1:100 | BioLegend | 101319 | |||
| IgG Isotype Control | IP | 1:300 | Cell Signaling Technology | 2729 | Primary | ||
| TTP | IP | 1:100 | Cell Signaling Technology | 71632 | D1I3T | Primary | |
| HA tag | IP | 1:100 | Cell Signaling Technology | 3724 | C29F4 | Primary |
Table 6
qPCR primers.
| Target | Primer | Sequence (5' to 3') |
|---|---|---|
| Il6 | FWD | CCAGAAACCGCTATGAAGTTCC |
| REV | TTGTCACCAGCATCAGTCCC | |
| Zfp36 | FWD | CTCTGCCATCTACGAGAGCC |
| REV | GATGGAGTCCGAGTTTATGTTCC | |
| Tnf | FWD | GATCGGTCCCCAAAGGGATG |
| REV | CACTTGGTGGTTTGCTACGAC | |
| pre-Tnf | FWD | GGCAAAGAGGAACTGTAAG |
| REV | CCATAGAACTGATGAGAGG | |
| Gapdh | FWD | ATGGTGAAGGTCGGTGTGA |
| REV | TGAAGGGGTCGTTGATGG |
Table 7
NGS library primers.
| PCR 1 | |||
|---|---|---|---|
| Primer_name | Direction | Sequence | Comments |
| sgDeepSeq_rev_XXXX | Rv | CTCTTTCCCTACACGACGCTCTTCCGATCT NNNNNNCTCATTCCAGCATAGCTCTTAAAC | Library preparation 1st PCR |
| sgDeepSeq_rev_XXXX | Rv | CTCTTTCCCTACACGACGCTCTTCCGATCT NNNNNNTCGATTCCAGCATAGCTCTTAAAC | Library preparation 1st PCR |
| sgDeepSeq_rev_XXXX | Rv | CTCTTTCCCTACACGACGCTCTTCCGATCT NNNNNNCCTATTCCAGCATAGCTCTTAAAC | Library preparation 1st PCR |
| sgDeepSeq_rev_XXXX | Rv | CTCTTTCCCTACACGACGCTCTTCCGATCT NNNNNNGAACTTCCAGCATAGCTCTTAAAC | Library preparation 1st PCR |
| sgDeepSeq_rev_XXXX | Rv | CTCTTTCCCTACACGACGCTCTTCCGATCT NNNNNNATCCTTCCAGCATAGCTCTTAAAC | Library preparation 1st PCR |
| sgDeepSeq_rev_XXXX | Rv | CTCTTTCCCTACACGACGCTCTTCCGATCT NNNNNNACTCTTCCAGCATAGCTCTTAAAC | Library preparation 1st PCR |
| sgDeepSeq_rev_XXXX | Rv | CTCTTTCCCTACACGACGCTCTTCCGATCT NNNNNNCTTCTTCCAGCATAGCTCTTAAAC | Library preparation 1st PCR |
| sgDeepSeq_rev_XXXX | Rv | CTCTTTCCCTACACGACGCTCTTCCGATCT NNNNNNCAAGTTCCAGCATAGCTCTTAAAC | Library preparation 1st PCR |
| sgDeepSeq_rev_XXXX | Rv | CTCTTTCCCTACACGACGCTCTTCCGATCT NNNNNNTGAGTTCCAGCATAGCTCTTAAAC | Library preparation 1st PCR |
| sgDeepSeq_rev_XXXX | Rv | CTCTTTCCCTACACGACGCTCTTCCGATCT NNNNNNTTCGTTCCAGCATAGCTCTTAAAC | Library preparation 1st PCR |
| sgDeepSeq_rev_XXXX | Rv | CTCTTTCCCTACACGACGCTCTTCCGATCT NNNNNNTAGGTTCCAGCATAGCTCTTAAAC | Library preparation 1st PCR |
| sgDeepSeq_rev_XXXX | Rv | CTCTTTCCCTACACGACGCTCTTCCGATCT NNNNNNTCTGTTCCAGCATAGCTCTTAAAC | Library preparation 1st PCR |
| Fwd1_hybrid_P7_Nras | Fwd | GCATACGAGATAGCTAGCCACC | Library preparation 1st PCR |
| PCR 2 | |||
| Primer_name | Direction | Sequence | Comments |
| Rev2_p5_sgDeepSeq | Rv | AATGATACGGCGACCACCGAGATCTACACT CTTTCCCTACACGACGCT | Library preparation 2nd PCR |
| Fwd2_p7_sgDeepSeq | Fwd | CAAGCAGAAGACGGCATACGAGATAGCTAGCCACC | Library preparation 2nd PCR |
Additional files
Download links
A two-part list of links to download the article, or parts of the article, in various formats.
Downloads (link to download the article as PDF)
Open citations (links to open the citations from this article in various online reference manager services)
Cite this article (links to download the citations from this article in formats compatible with various reference manager tools)
HUWE1 controls tristetraprolin proteasomal degradation by regulating its phosphorylation
eLife 12:e83159.
https://doi.org/10.7554/eLife.83159


