Relating pathogenic loss-of-function mutations in humans to their evolutionary fitness costs
- Department of Biological Sciences, Columbia University, United States
- Department of Statistics, University of Oxford, United Kingdom
- The Wellcome Centre for Human Genetics, University of Oxford, United Kingdom
- Department of Systems Biology, Columbia University, United States
Figures
Figure 1
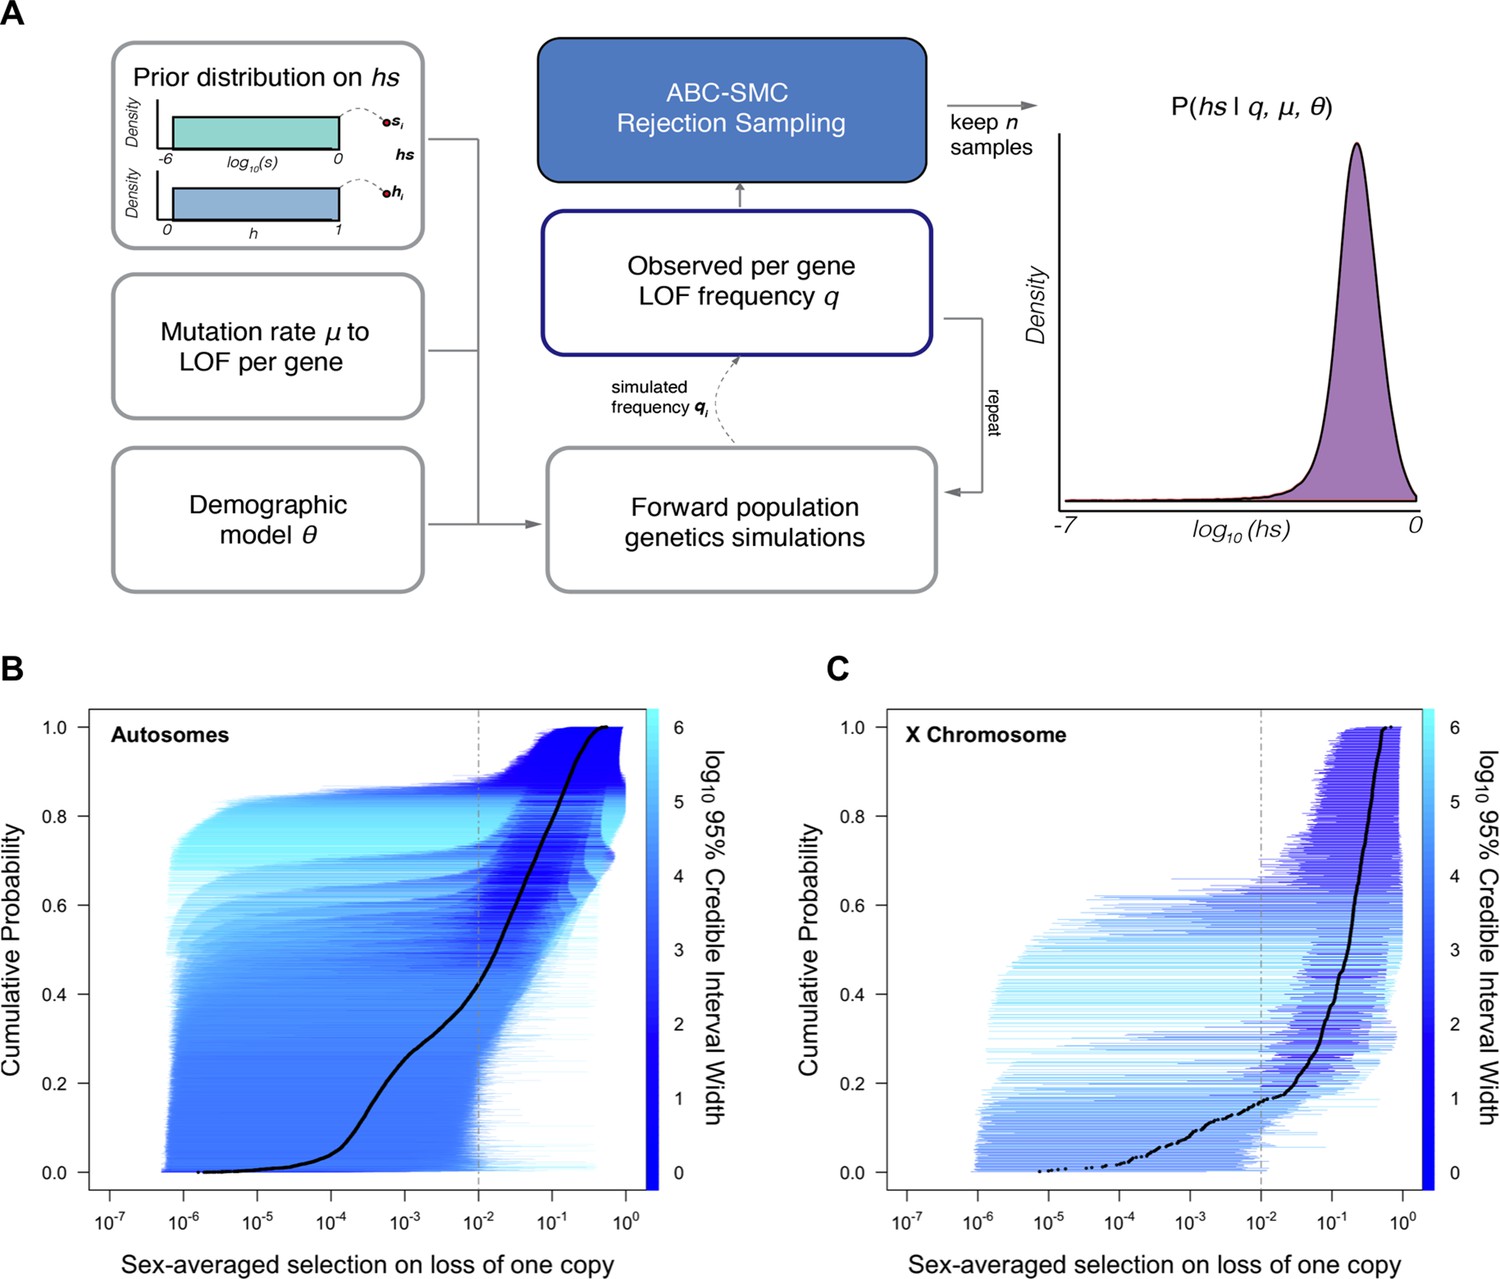
Estimating hs for loss-of-function (LOF) across human genes.
(A) Schematic of the approach to infer heterozygous selection coefficients (hs) for each gene. We assume prior distributions log10(s)~U(–6,0) and h~U(0,1). We further assume a mutation rate μ to LOF alleles per gene and a demographic model specified by parameters , which describe changes in the effective population size Ne at time points in the past. These parameters are used in forward population genetic simulations based on a Wright–Fisher model of selection (see 'Materials and methods'). For each iteration i, the simulation generates a frequency qi of LOF alleles, which is then compared to the observed LOF frequency q for a given gene. The proposed value of (hs)i is retained if within a tolerance ε, which is decreased over time, or rejected otherwise. For each ε, this procedure is repeated until there are 50,000 acceptances, providing a sample from the posterior distribution of the probability of hs given the observed frequency q of LOF variants for a gene (as well as the mutation rate and demographic model). (B) The cumulative distribution of the estimated heterozygous selection coefficient hs for each autosomal gene. Black dots represent the point estimate of hs for each gene, based on the maximum a posteriori estimate (i.e., the mode) of the posterior distribution. Horizontal lines represent the 95% credible intervals for each gene and are colored according to the width of the interval on a log10 scale. (C) A similar plot, but for non-pseudoautosomal region (PAR) X-linked genes, with sex-averaged selection on the loss of a copy on the X calculated as the average of s and hs (see 'Materials and methods').
Figure 2

The estimated distribution of fitness effects (DFE) across human loss-of-function (LOF) de novo mutations (DNMs) on autosomes, obtained by weighting the posterior distribution of hs for each gene with the fraction of potential or observed LOF variants in the gene (see 'Materials and methods').
(A) The estimated DFE of all possible de novo LOF mutations in autosomes. The weight assigned to each gene is the fraction of total genome-wide LOF mutational opportunities it contains. (B) The estimated DFE of observed de novo LOF mutations (blue curve) in Goldmann et al., 2016, obtained by weighting the posterior distribution of hs for each gene with the fraction of observed LOF variants it contains, compared to the DFE of all possible LOF mutations (black curve), and 100 bootstrapped DFEs of a set of 37 DNMs randomly sampled from the full set of LOF mutational opportunities (in gray). (C) The estimated DFE of observed de novo LOF mutations (blue curve) in the Simons Simplex controls (i.e., unaffected siblings of autism probands), compared to the DFE of all possible LOF mutations (black curve), and 100 bootstrapped DFEs of a set of 64 DNMs randomly sampled from the full set of LOF mutational opportunities (in gray). (D) The estimated DFE of new LOF mutations seen in spermatogonial stem cells (blue curve), compared to the DFE of all possible LOF mutations (black curve), and 100 bootstrapped DFEs of a set of 14 DNMs randomly sampled from the full set of LOF mutational opportunities (in gray).
Figure 3
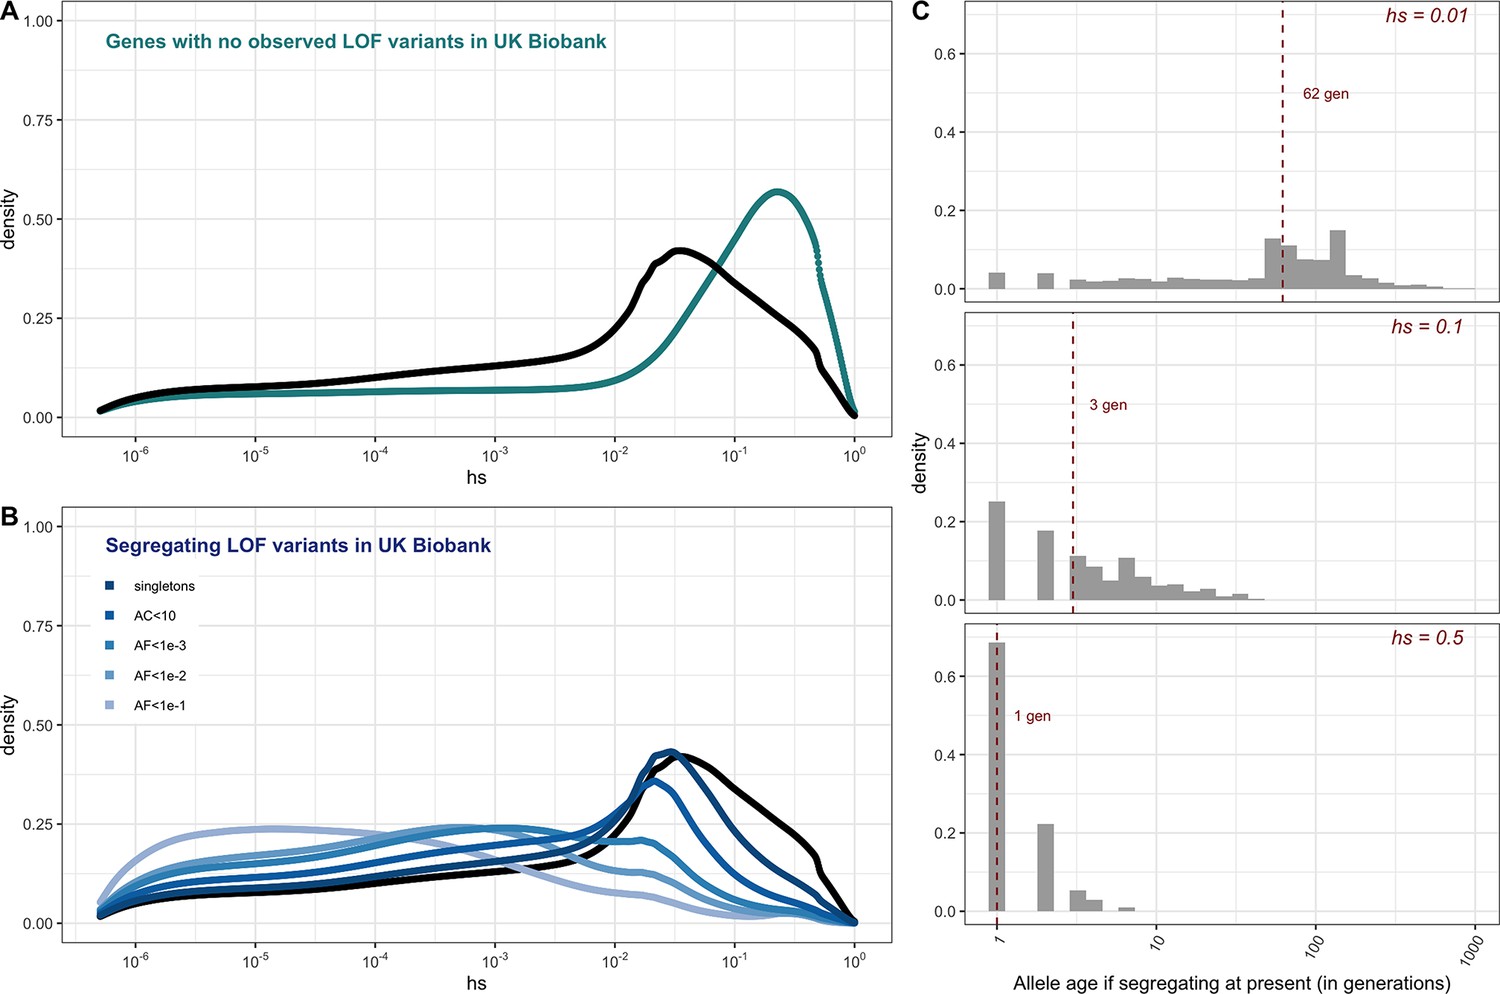
The estimated distribution of fitness effects (DFE) for autosomal loss-of-function (LOF) variants in ~160K UK Biobank individuals with sequenced exomes (see 'Materials and methods').
(A) The DFE of all possible mutational opportunities in genes that do not have a single loss-of-function (LOF) mutation in ~160K UK Biobank individuals. (B) The DFE of segregating LOF variants in ~160K UK Biobank individuals, by allele frequency threshold, compared to the DFE of all possible LOF mutations (black curve). (C) The distribution of the age (in generations) of a strongly selected LOF allele segregating in the population at present, obtained using forward simulations at an autosomal locus under a demographic model for population growth in Europe (see 'Materials and methods'), for a heterozygous selection coefficient of hs = 1%; hs = 10% or hs = 50%. The median value in each case is indicated with a red dashed line.
Figure 4
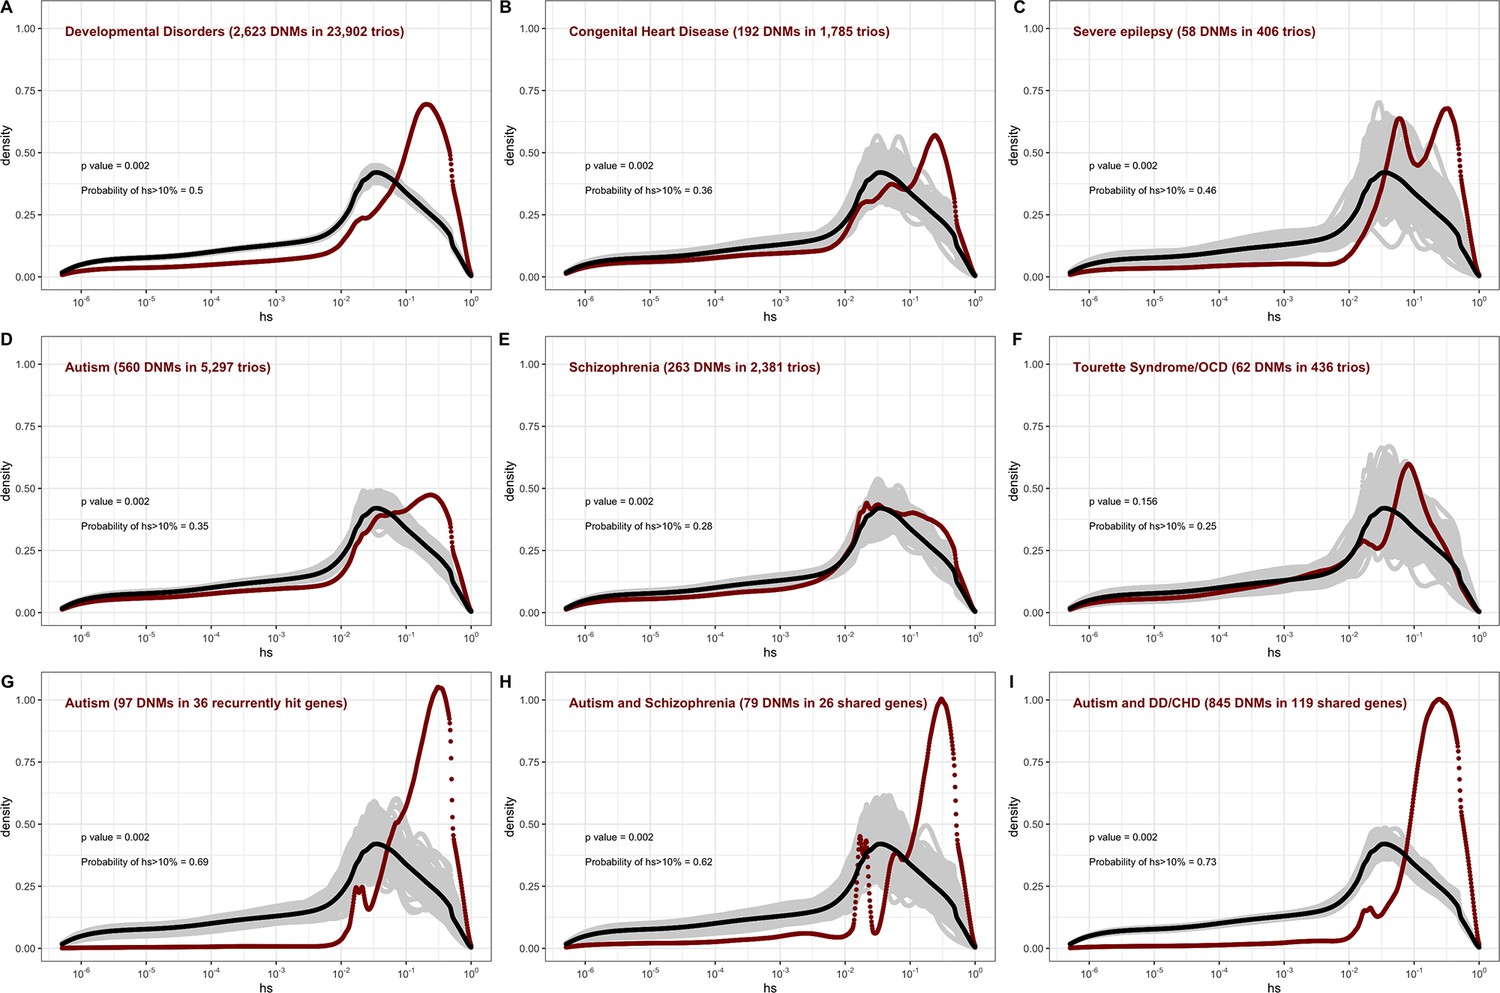
The estimated distribution of fitness effects (DFE) for de novo loss-of-function (LOF) mutations seen in individuals affected by severe diseases, from whole-exome-sequenced parent–offspring trios.
The DFE for each disease cohort is obtained by weighting the posterior density of hs for each autosomal gene with the fraction of observed LOF mutations in the gene in that cohort. In each panel, the DFE of all possible LOF mutations is denoted with a black curve. For n de novo mutations (DNMs) in a disease cohort, the gray lines denote 100 bootstrapped DFEs of a set of n DNMs randomly sampled from the full set of LOF mutational opportunities. P-values were calculated from the rank of the mean of the distribution for each disease compared to the means of 1000 bootstrapped distributions (see 'Materials and methods'). The probability of hs >10% for all possible autosomal LOF mutations is 20%. The probability of hs > 10% in each panel denotes the area under the distribution (in red) in the interval (0.1,1) for de novo LOF mutations seen in the corresponding disease cohort. The estimated DFE of observed de novo LOF mutations in individuals affected by (A) developmental disorders, from the Deciphering Developmental Disorders (DDD) cohort (Kaplanis et al., 2020), (B) congenital heart disease (Jin et al., 2017), (C) developmental and epileptic encephalopathy (EuroEPINOMICS-RES Consortium et al., 2014; Hamdan et al., 2017), (D) autism, from the Autism Sequencing Consortium (ASC) and Simons Simplex (SSC) (Satterstrom et al., 2020), (E) schizophrenia (Fromer et al., 2014; Howrigan et al., 2020; Rees et al., 2020; Xu et al., 2012), and (F) Tourette’s syndrome and/or obsessive-compulsive disorder (OCD) (Cappi et al., 2020; Willsey et al., 2017). The estimated DFE of observed de novo LOF mutations in genes (G) recurrently hit in individuals with autism, (H) shared between individuals with autism and schizophrenia, and (I) shared between autism and developmental disorders (DD) or congenital heart disease (CHD).
Figure 5
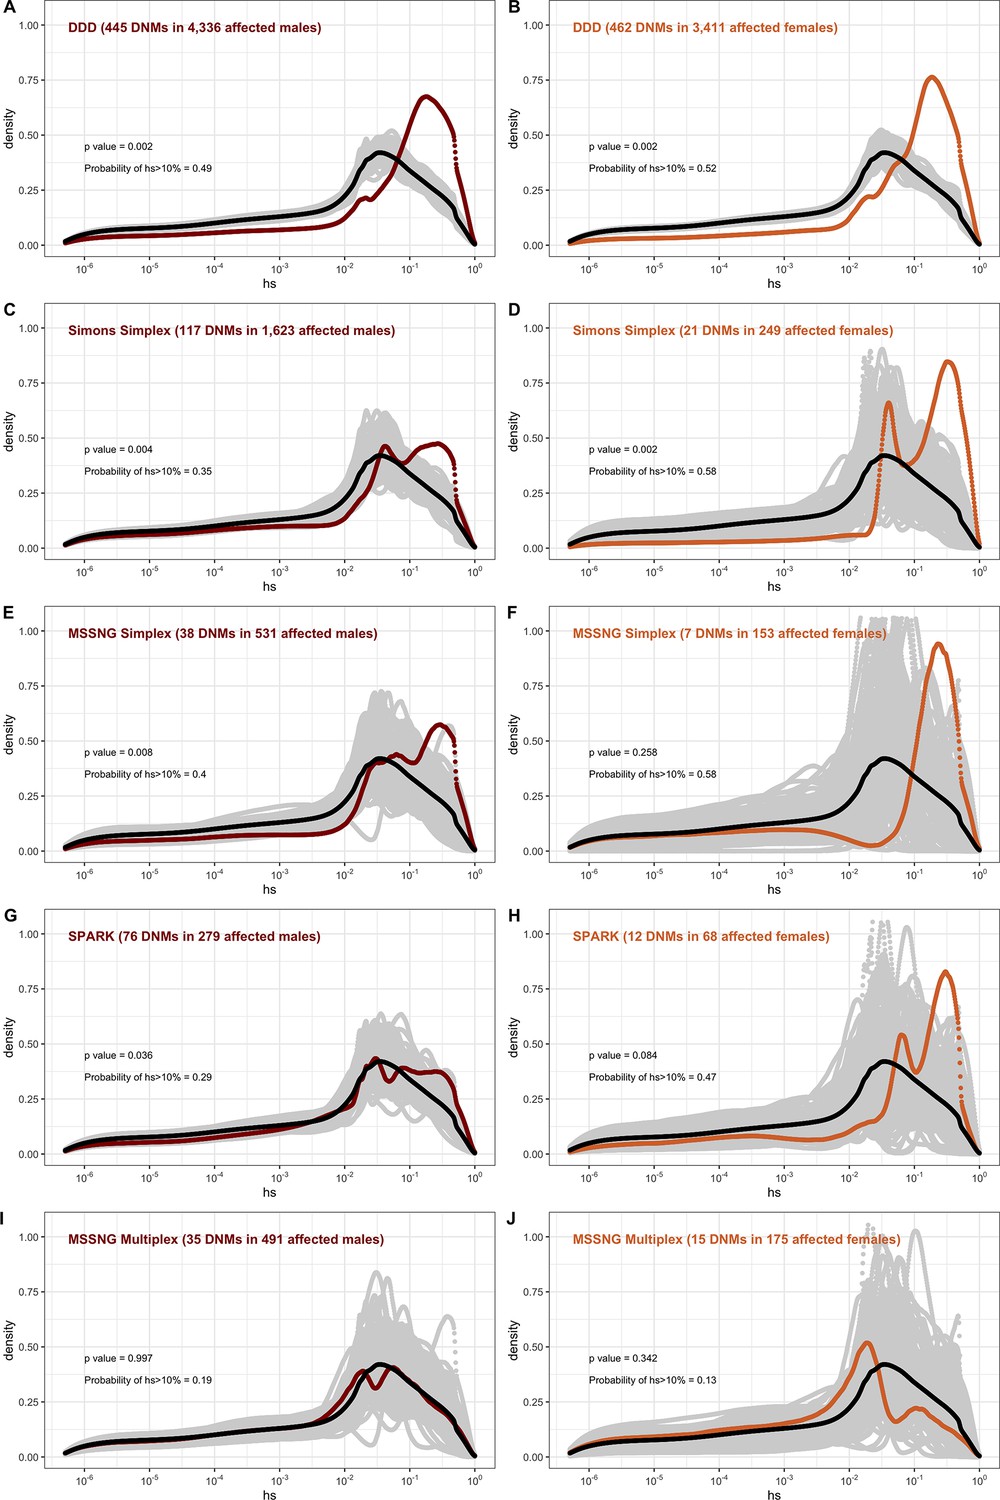
The effect of study design and composition on the fitness effects of de novo mutations (DNMs) seen in developmental disorders and autism.
In each panel, the distribution of fitness effects (DFE) of all possible loss-of-function (LOF) mutations is denoted with a black curve. For n DNMs in a disease cohort, the gray lines denote 100 bootstrapped DFEs of a set of n DNMs randomly sampled from the full set of LOF mutational opportunities. The estimated DFE of de novo LOF mutations in (A) affected males from the Deciphering Developmental Disorders (DDD) cohort, (B) affected females from the DDD cohort, (C) affected males from the Simons Simplex cohort, (D) affected females from the Simons Simplex cohort, (E) affected males from the MSSNG cohort, excluding multiplex families, (F) affected females from the MSSNG cohort, excluding multiplex families, (G) affected males from the SPARK cohort, (H) affected females from the SPARK cohort, (I) affected males in multiplex families from the MSSNG cohort, and (J) affected females in multiplex families from the MSSNG cohort.
Appendix 1—figure 1
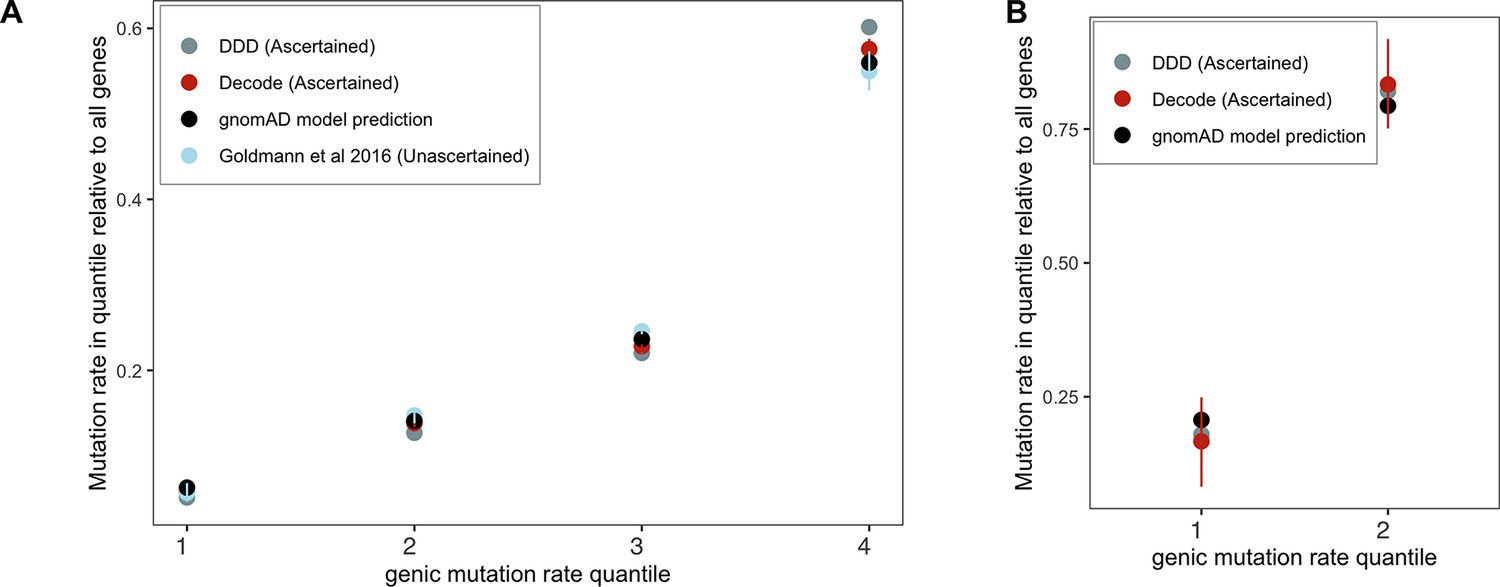
Checking the gnomAD mutation model using de novo mutations (DNMs) in aggregate.
Genes were grouped by quartiles of the gnomAD (Karczewski et al., 2020) mutation rate estimates μtotal (over synonymous, missense, and LOF sites in a gene), separately for (A) autosomes and (B) the X chromosome (only two groups were used for the X because of the very limited about of DNM data available for comparison). The per-quartile haploid mutation rate for the gnomAD mutation model was obtained by summing μtotal over all genes within each quartile and divided by μtotal over all genes in the exome. Exonic DNMs were obtained from DDD (Kaplanis et al., 2020), Decode (Halldorsson et al., 2019; Jónsson et al., 2017), and for autosomes only (since no data for the X were available) from Goldmann et al., 2016. We obtained 95% Poisson confidence intervals for the DNM counts in each quartile.
Appendix 1—figure 2
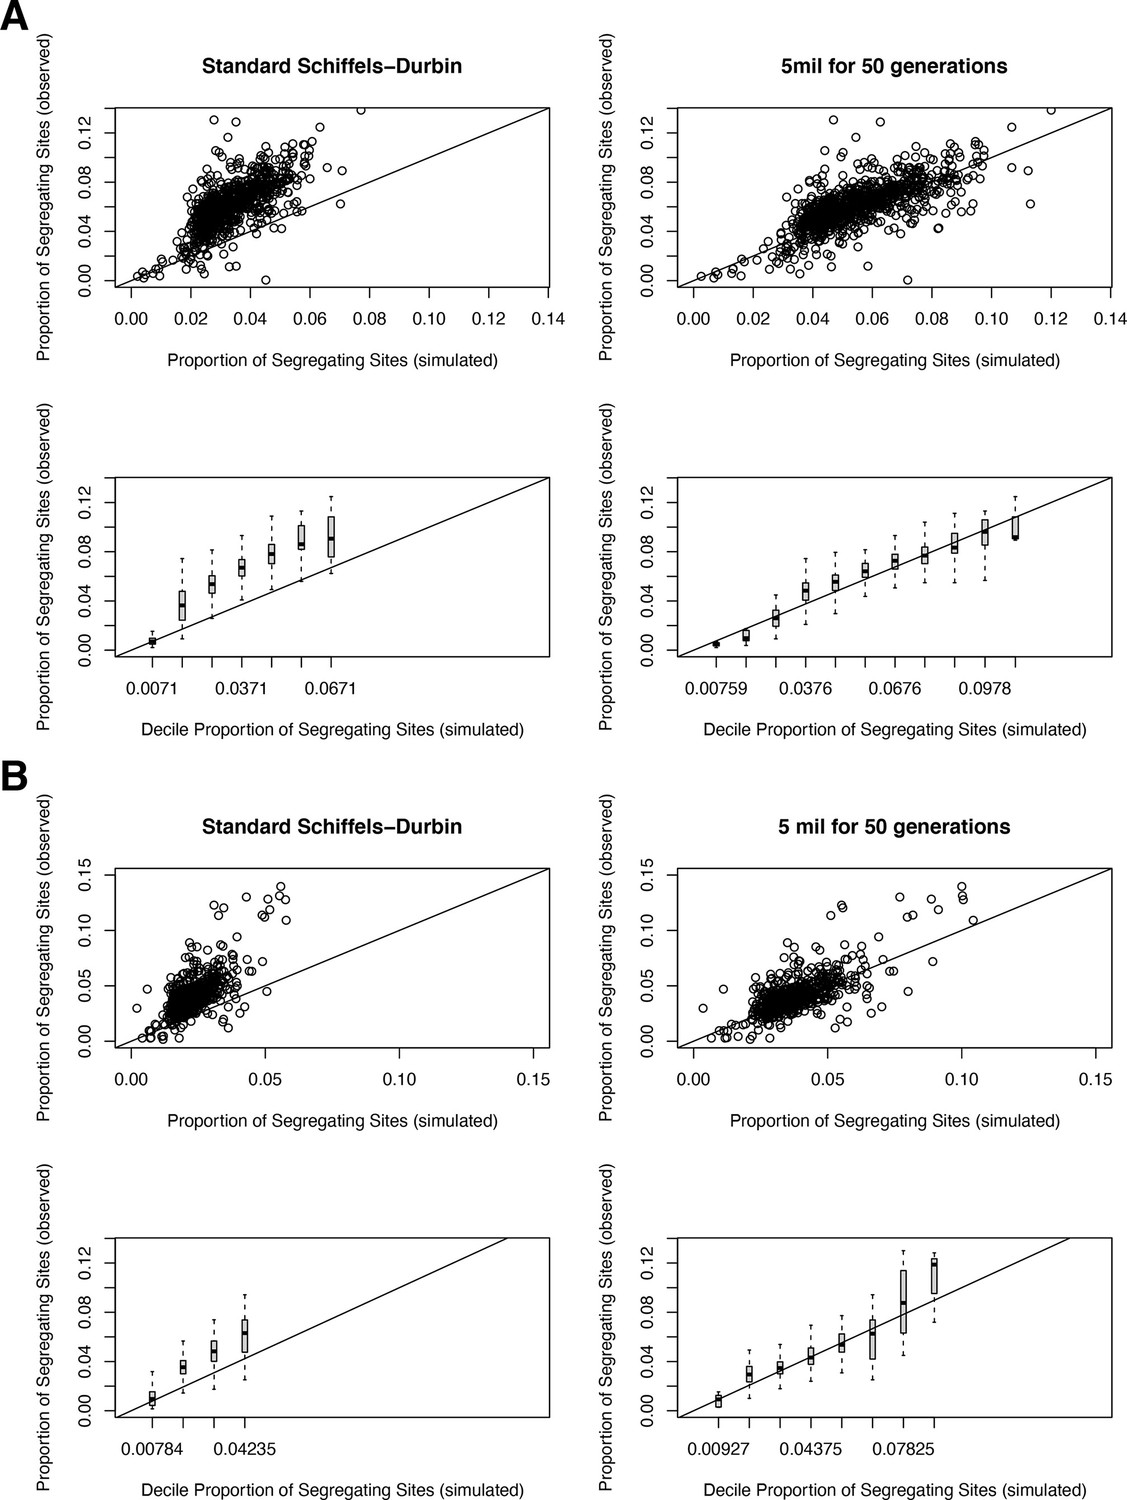
The proportion of segregating synonymous sites in genes for observed and simulated data.
(A) For autosomal genes, the proportion of segregating synonymous sites in the gnomAD Non-Finnish European (NFE) sample on the y-axis compared to the proportion of segregating synonymous sites simulated under a neutral (hs = 0) model and per-gene synonymous mutation rates on the x-axis. Each point in the top row represents each gene, while the bottom row shows boxplots summarizing genes in increments of 0.01 segregating sites in simulations. On the left, genes are simulated under the widely used Schiffels–Durbin demographic model for population growth in Europe (Schiffels and Durbin, 2014). On the right, genes are simulated under a slightly modified version of this model, in which we set the effective population size Ne equal to 5 million for the past 50 generations. (B) The same plots, but for genes on the X chromosome.
Appendix 1—figure 3
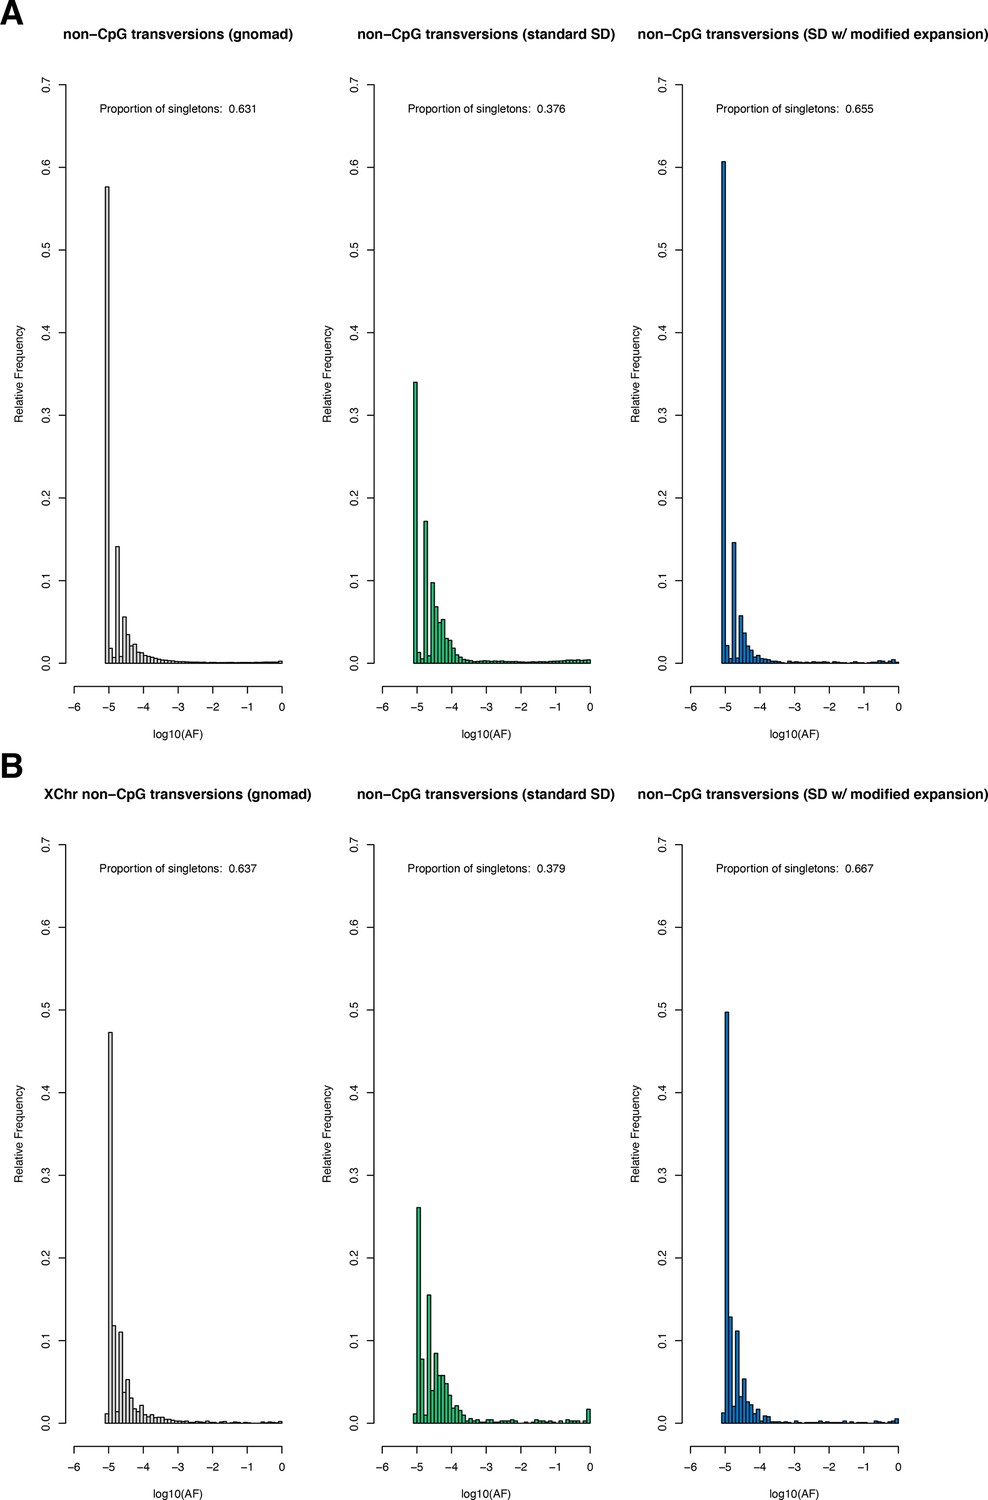
The site frequency spectrum for non-CpG transversions in observed and simulated data.
(A) The frequency spectrum of synonymous non-CpG transversions for all autosomal sites in the Non-Finnish European (NFE) sample in gnomAD (left), simulated under the Schiffels–Durbin (Schiffels and Durbin, 2014) demographic model for population growth in Europe ('standard SD'; middle), and simulated under a slightly modified version of this model in which we set the effective population size Ne equal to 5 million for the past 50 generations ('SD w/ modified expansion'; right). (B) The frequency spectrum of synonymous non-CpG transversions for all X chromosome sites. Columns are ordered the same as in (A).
Appendix 1—figure 4
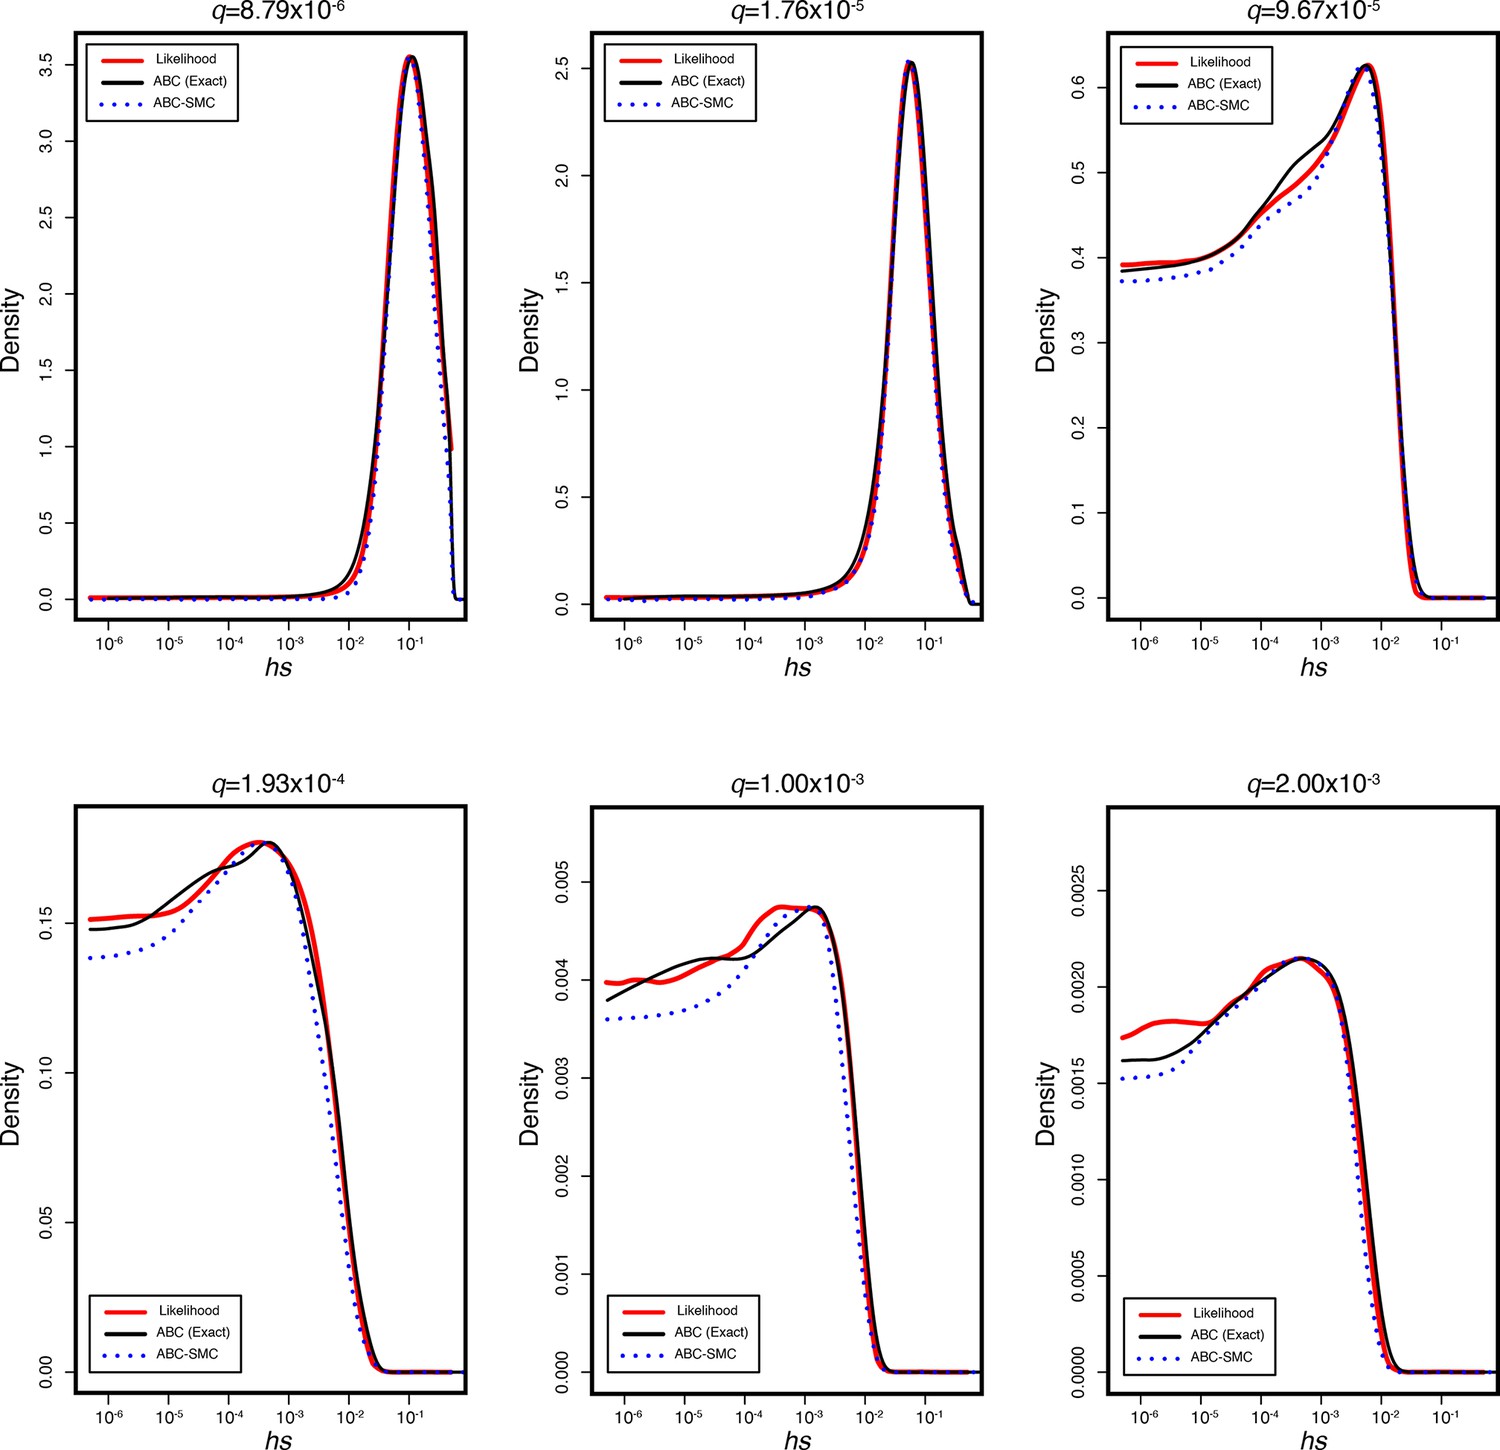
The true posterior and inferred posterior distributions of hs in simulated genes for six different observed loss-of-function frequencies q.
In each, the red line represents the true posterior distribution of hs obtained from running 1 × 10⁶ simulations for a gene with a mutation rate u to loss-of-function alleles of 1 × 10⁻⁶ across a logarithmically spaced grid of 1000 hs values from 5 × 10⁻⁶ to 1 under the modified Schiffels–Durbin demographic model described in the paper. The black curve represents the inferred posterior distribution using standard ABC rejection sampling with ε = 0. The dashed blue line indicates the inferred posterior distribution using the ABC-SMC approach described in the main text.
Appendix 1—figure 5
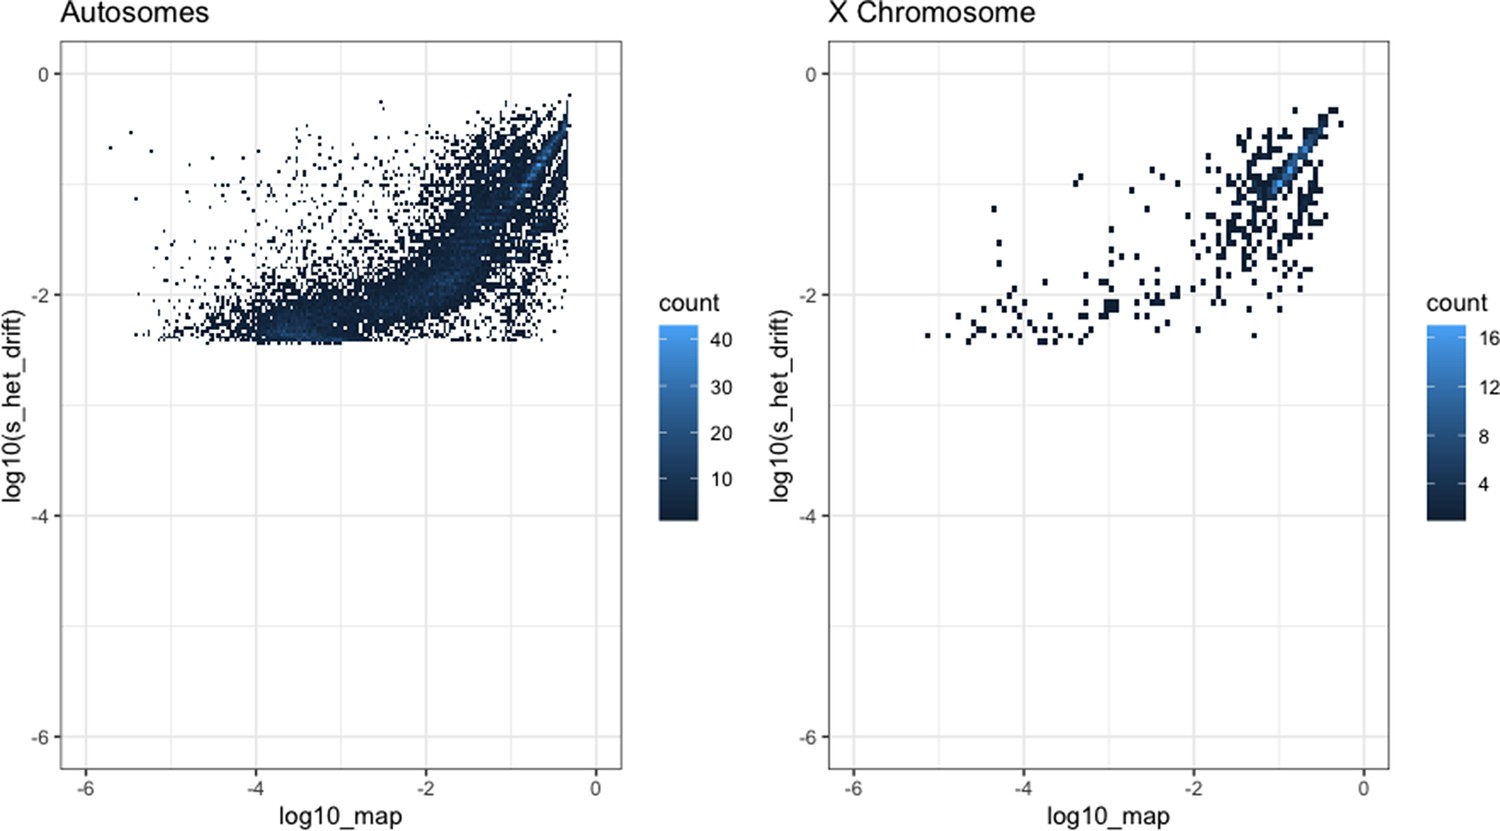
Comparison of our maximum a posteriori (MAP) estimates of hs (x-axis) and the shet measure from Weghorn et al., 2019 (y-axis) for the autosomes (left) and X chromosome (right).
Only the 15,275 genes for the autosomes and 583 genes for the X chromosome for which both estimates were available are included. For visualization, the color of each point reflects the number of overlapping genes on the plot.
Appendix 1—figure 6
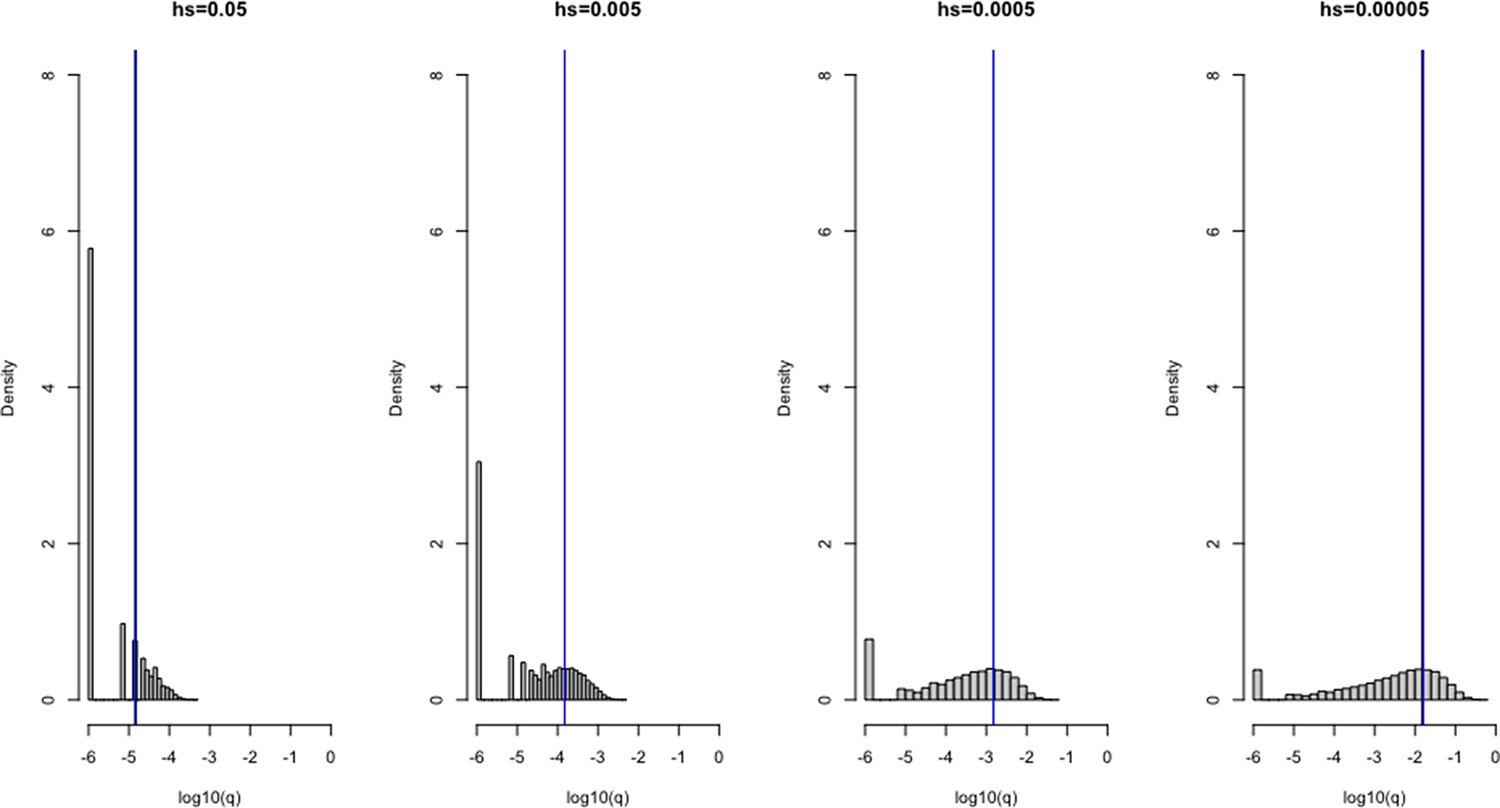
Verifying the model of selection on the X chromosome under a constant population size (N = 100,000).
1 × 10⁶ simulations were run under four different heterozygous selection coefficients (hs), labeled above each plot. A mutation rate u of 1 × 10⁻⁶ was set for all scenarios. The frequency q of variants for each scenario are shown on the x-axis on a log10 scale, and the density of the distribution is depicted on the y-axis. The blue line represents the mean allele frequency of the simulated distribution, and the black curve represents the expectation under mutation-selection-drift balance (calculated as 3 u/(2hs + s)). The two are often visually indistinguishable.
Appendix 1—figure 7
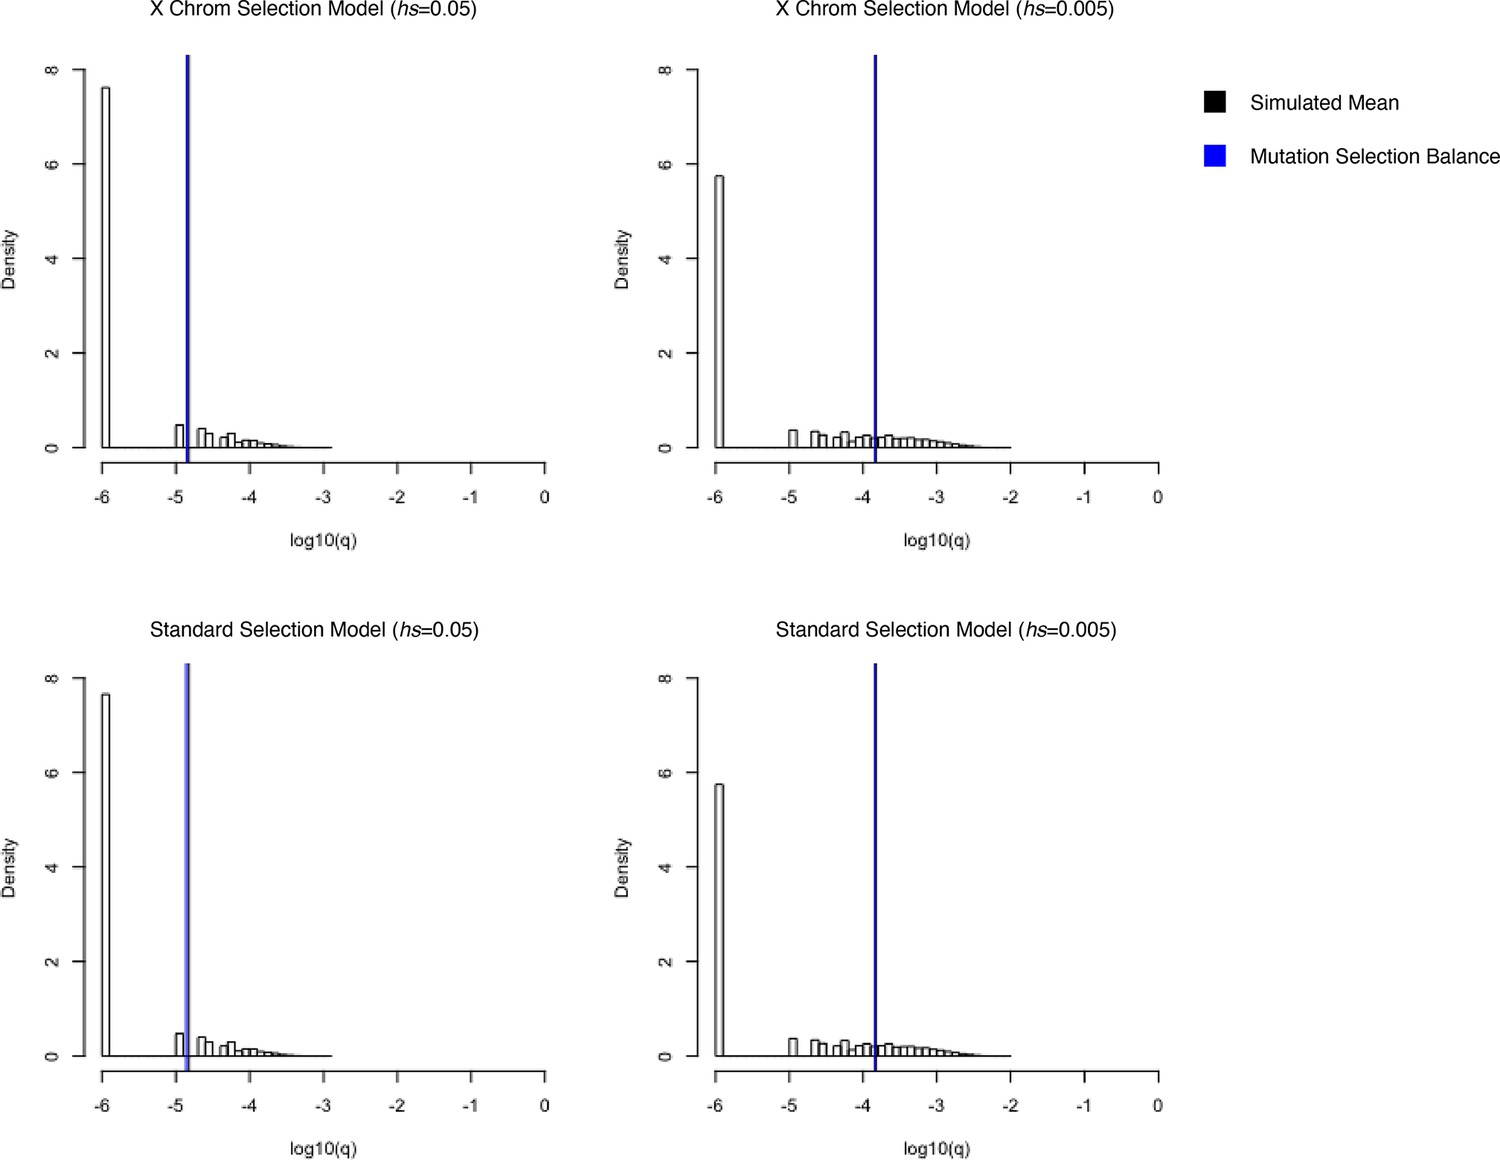
Simulated allele frequencies under hs = 0.05 (left) and hs = 0.005 (right) on the X chromosome for different models of selection.
On the top row, simulations were performed using a model where mutations arising on the X in the male germline undergo selection in the heterozygous state and mutations arising on the X in the female germline undergo hemizygous selection. On the bottom row, simulations were performed using the standard model of viability selection, analogous to the one implemented on the autosomes. The vertical black curves represent the mean of 50,000 simulations, and vertical blue lines represent the expectation under mutation selection balance. The two are often visually indistinguishable.
Appendix 1—figure 8
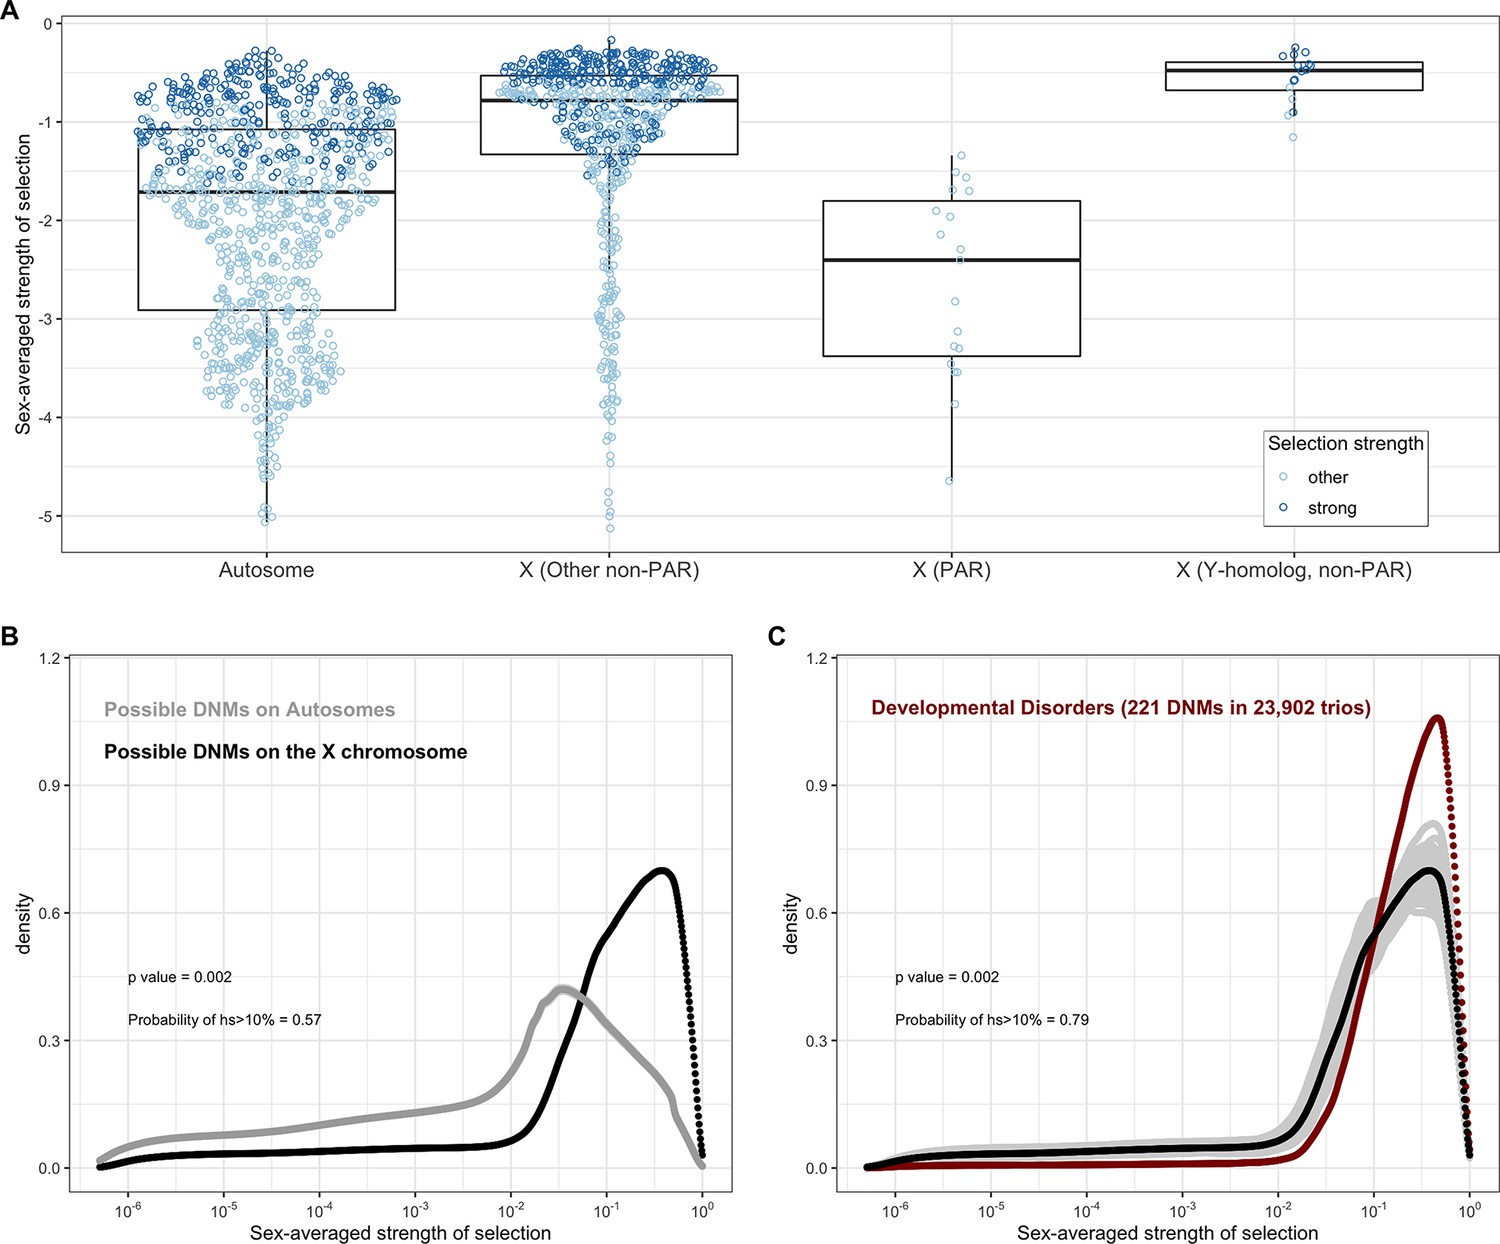
Estimated sex-averaged strength of selection on the loss of one gene copy on the autosomes and X.
(A) The distributions of point estimates for the sex-averaged strength of selection on the loss of one gene copy on the autosomes and for three X chromosome compartments: the PAR (n = 19 genes), the non-PAR X without Y-homologs (n = 644), and the non-PAR X with Y homologs (n = 16). The PAR estimates are obtained using the autosomal model for inheritance, and the non-PAR X compartments under the X chromosome model. We also checked the estimates for the non-PAR X with Y homologs under an autosomal model (see 'Materials and methods'). For purposes of visualization, the dots for the autosomes represent a random sampling of 1000 genes. Lines represent the median values within each gene category. Each dot represents the point estimate for a single gene and is colored darker blue if 95% of the probability mass of the posterior distribution is greater than hs > 10–2 (strong selection) and if not, lighter blue (other). (B) The estimated distribution of fitness effects (DFE) of all possible de novo loss-of-function (LOF) mutations on autosomes (in gray) compared to all possible de novo LOF mutations on the non-PAR X chromosome. 57% of the area under the DFE for X chromosome mutational opportunities corresponds to a selection strength of 10% or greater compared to 20% for autosomes. (C) The estimated DFE of de novo LOF mutations on the X chromosome in the Deciphering Developmental Disorders (DDD) cohort compared to the DFE of all mutational opportunities on the X (black curve), and 100 bootstrapped DFEs of a set of 221 de novo mutations (DNMs) randomly sampled from the full set of X chromosome LOF mutational opportunities (in gray). 79% of the area under the DFE for LOF mutations in the DDD cohort corresponds to a selection strength of 10% or greater compared to 57% of all LOF mutational opportunities on the X. We did not have sufficient data for the X for other disease cohorts.
Appendix 1—figure 9
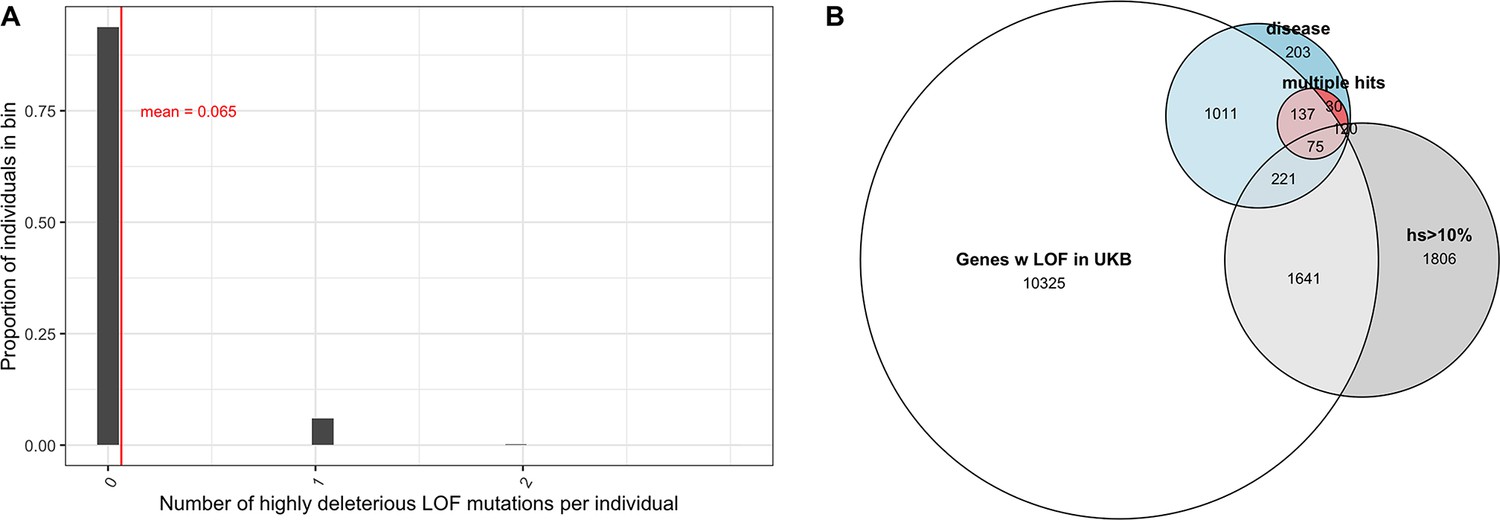
Variable penetrance of highly deleterious mutations.
(A) The distribution of the number of segregating variants carried by individuals in the UK Biobank in genes with estimated hs >10% for loss-of-function (LOF). 93% of individuals carry no such LOF mutations, 6% of individuals carry one mutation, and 0.2% of individuals carry two. (B) Overlap of genes that have at least one LOF mutation segregating in the UK Biobank (among ~110K individuals who self-report no long-standing illness, disability, or infirmity; see 'Materials and methods') with (in gray) genes with estimated hs > 10% for LOF (in blue) genes with de novo mutations in individuals ascertained on severe disease (developmental disorders, congenital heart disease, autism, and epilepsy) and (in red) genes with DNMs mapped in at least two affected individuals, with at least one disease.
Appendix 1—figure 10

The distribution of the ages (in generations) and allele frequencies of a strongly selected loss-of-function (LOF) allele segregating in the population at present.
Allele ages and allele frequencies in the population at present were obtained from 10,000 forward simulations at an autosomal locus under the modified Schiffels–Durbin demographic model described in the paper (see 'Materials and methods') and hs of 1%, 10%, and 50%. The size of a dot reflects the number of overlapping points.
Appendix 1—figure 11
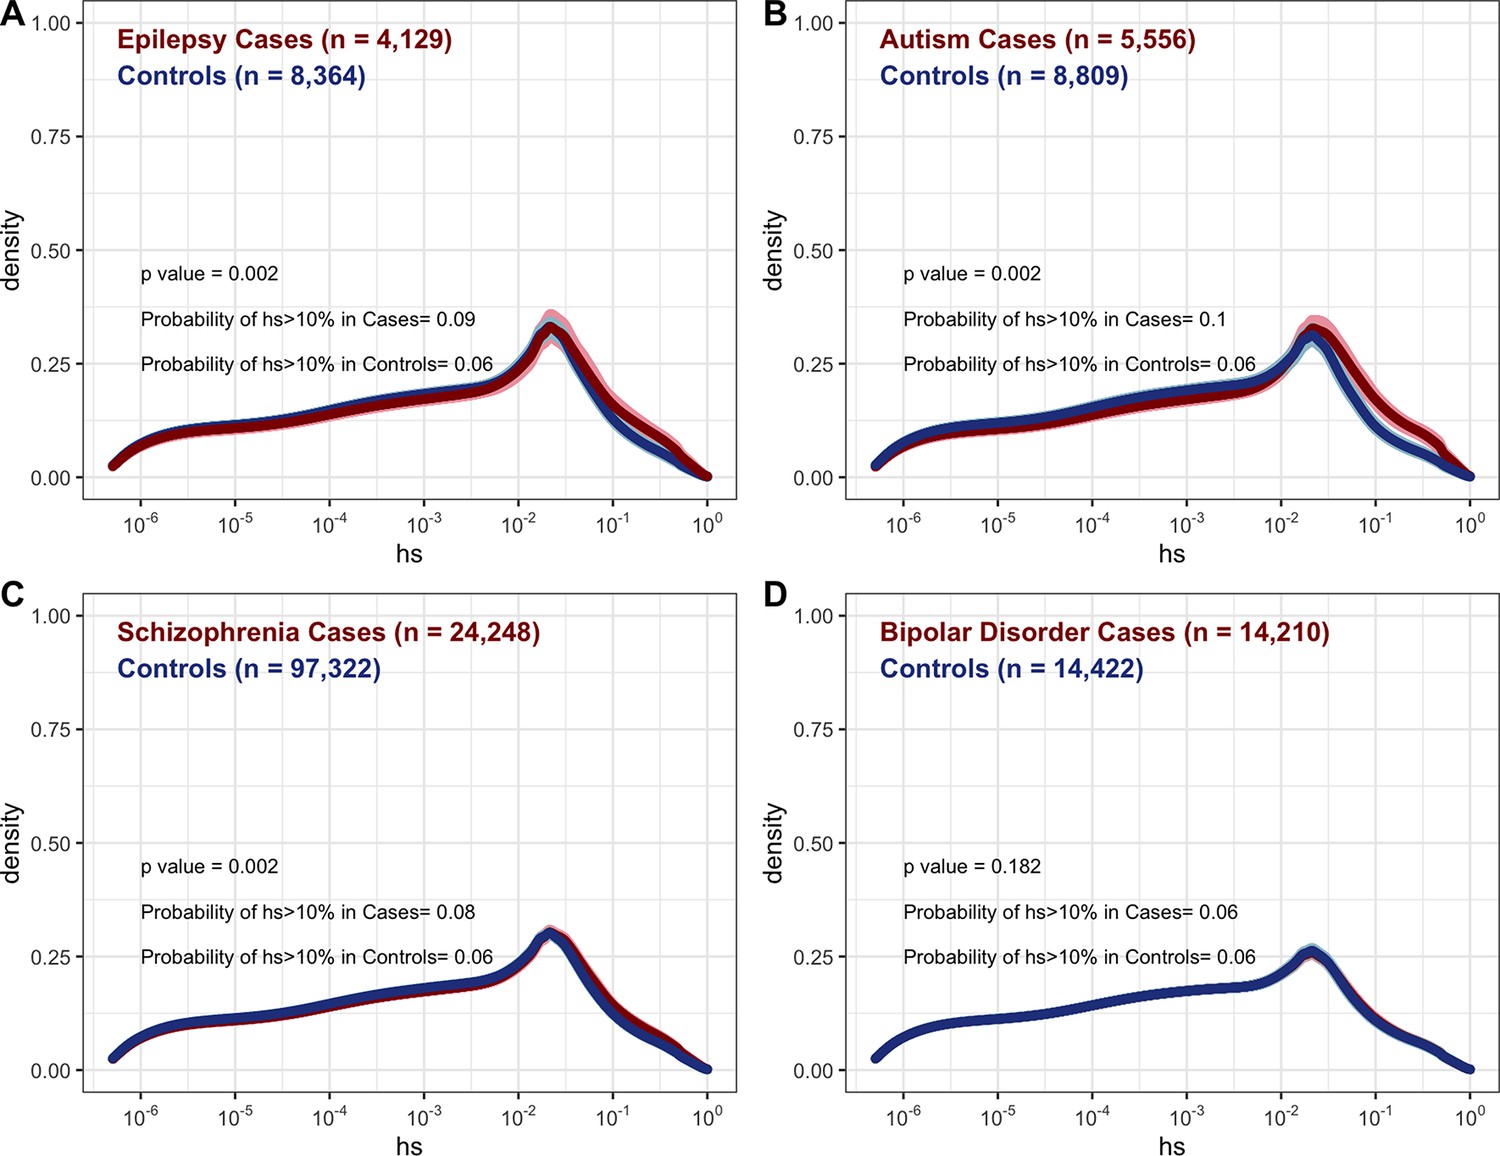
Distribution of fitness effects (DFE) for autosomal loss-of-function mutations seen segregating in cases (red curves) versus controls (blue curves) for (A) epilepsy (Feng et al., 2019), (B) autism (Satterstrom et al., 2020), (C) schizophrenia (Singh et al., 2022), and (D) bipolar disorder (Palmer et al., 2022).
Counts were only available for rare variants in each cohort, where rare was defined by the original study.
Appendix 1—figure 12
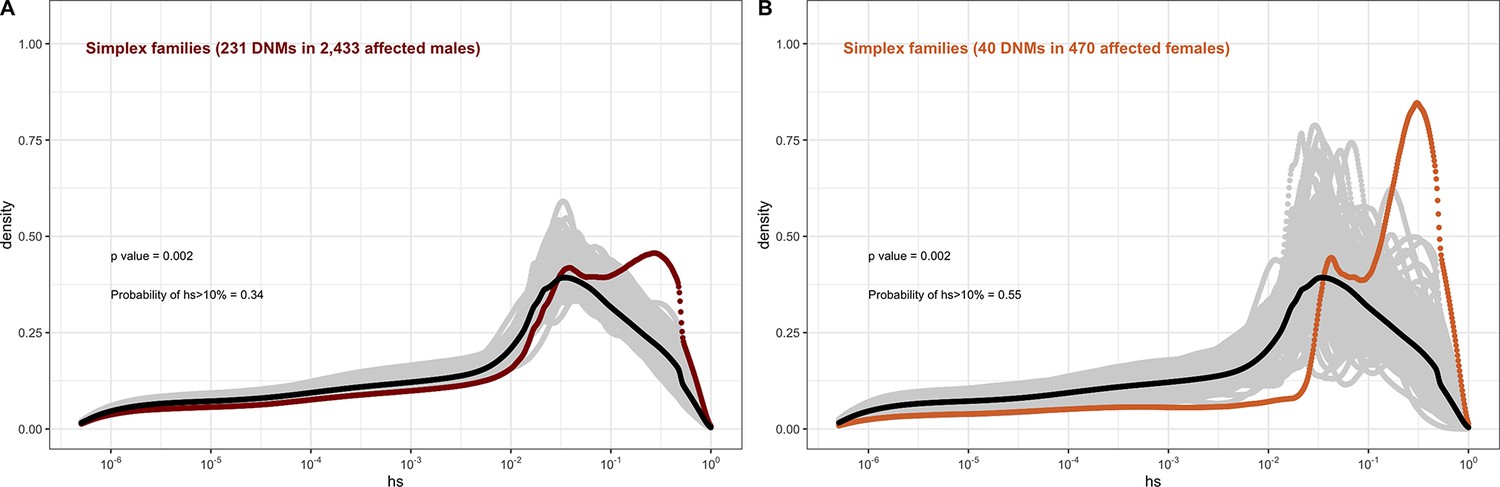
The effect of sex of the proband on the fitness effects of de novo mutations (DNMs) seen in simplex families in autism, combining the trios from the Simons Simplex dataset with the simplex families in MSSNG, and with trios in the SPARK study, of which only a small proportion are known to be from multiplex families.
In each panel, the distribution of fitness effects (DFE) of all possible loss-of-function (LOF) mutations is denoted with a black curve. For n DNMs in a disease cohort, the gray lines denote 100 bootstrapped DFEs of a set of n DNMs randomly sampled from the full set of LOF mutational opportunities. The estimated DFE of de novo LOF mutations in (A) affected males and (B) affected females.
Appendix 1—figure 13
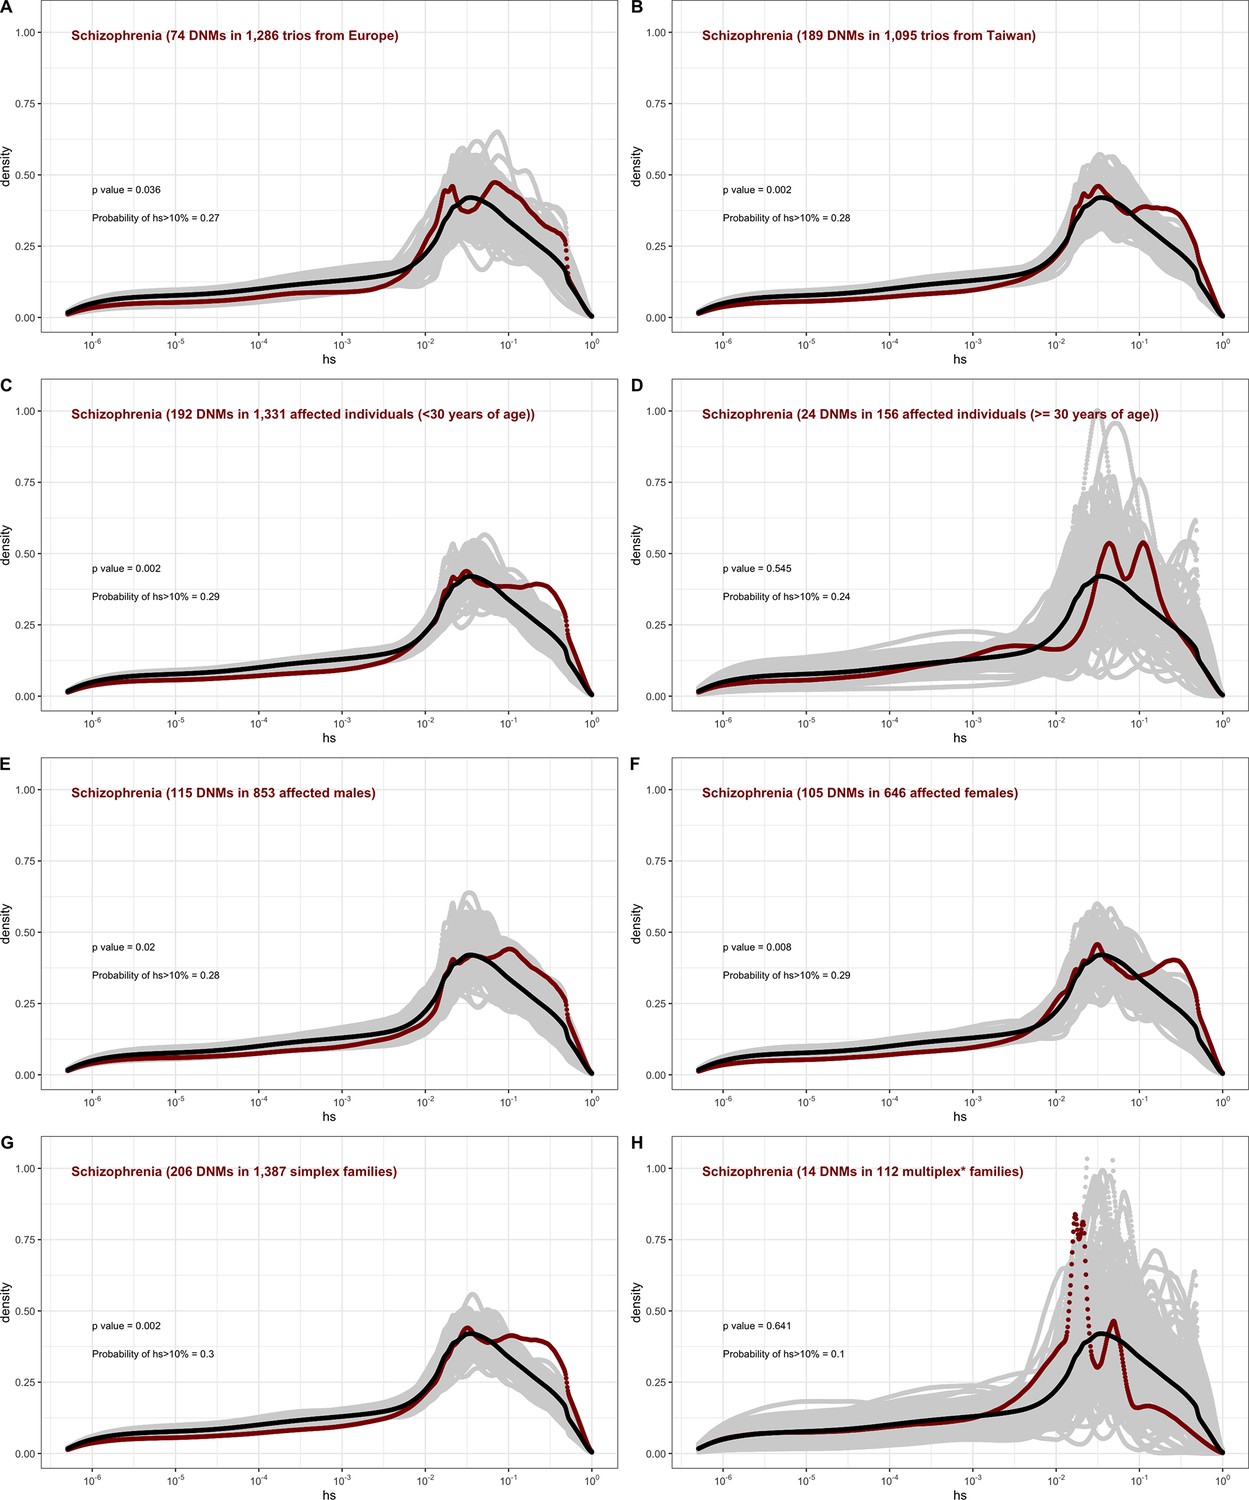
The effect of study design and composition on the fitness effects of de novo mutations (DNMs) seen in schizophrenia.
In each panel, the distribution of fitness effects (DFE) of all possible loss-of-function (LOF) mutations is denoted with a black curve. For n DNMs in a disease cohort, the gray lines denote 100 bootstrapped DFEs of a set of n DNMs randomly sampled from the full set of LOF mutational opportunities. The estimated DFE of de novo LOF mutations in (A) affected individuals in a European sample, (B) affected individuals sampled in Taiwan, (C) affected individuals with age of onset reported as less than 30 years of age, (D) affected individuals with age of onset reported as at least 30 years of age, (E) affected males, (F) affected females, (G) affected individuals with no reported family history of schizophrenia or other mental illness, and (I) affected individuals with a family history of schizophrenia or other mental illness reported.
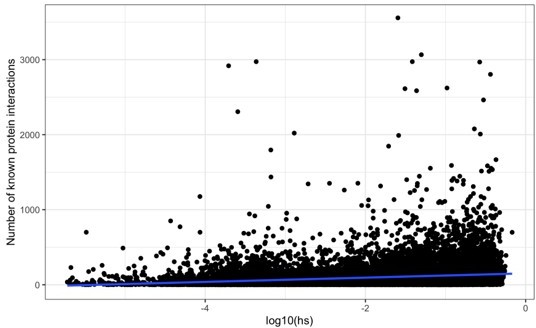
Author response image 1
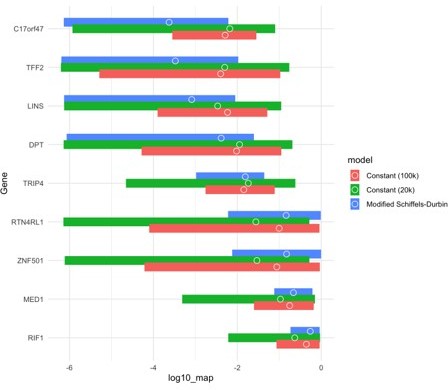
Author response image 2
Tables
Appendix 1—table 1
Summary counts for LOF and synonymous mutations by pedigree study or subsample.
Studies can differ in the amount of the genome queried for LOF mutations. The number of probands is obtained as the number of unique Proband IDs with at least one reported de novo mutation (of any kind). For two studies where this information was not available, the number of probands was obtained from the text. The probability that an LOF mutation is under hs > 10% is calculated using the area under the DFE for hs > 10%. The probability that an LOF mutation under hs > 10% is causal is calculated as 1 – the ratio of the probability that an LOF mutation is under hs > 10% in a sample ascertained for a disease and the probability that an LOF mutation is under hs > 10% in the population (19.8%), and set to zero if negative.
| Sample | # Affected Individuals | Average number of Synonymous DNMs in an individual | Average number of LOF DNMsin an individual | Probability LOF has hs > 10% | Probability LOF causal if hs > 10% |
|---|---|---|---|---|---|
| Developmental disorders (2623 DNMs in 23,902 trios) | 23,902 | 0.38 | 0.11 | 0.50 | 0.60 |
| Congenital heart disease (192 DNMs in 1785 trios) | 1785 | 0.39 | 0.11 | 0.36 | 0.45 |
| Severe epilepsy (58 DNMs in 406 trios) | 406 | 0.35 | 0.14 | 0.46 | 0.57 |
| Autism (560 DNMs in 5297 trios) | 5297 | 0.35 | 0.11 | 0.35 | 0.43 |
| Schizophrenia (263 DNMs in 2381 trios) | 2381 | 0.24 | 0.11 | 0.28 | 0.28 |
| Tourette syndrome/OCD (62 DNMs in 436 trios) | 436 | 0.39 | 0.14 | 0.25 | 0.19 |
| DDD (445 DNMs in 4336 affected males) | 4336 | 0.41 | 0.10 | 0.49 | 0.59 |
| DDD (462 DNMs in 3411 affected females) | 3411 | 0.39 | 0.14 | 0.52 | 0.62 |
| Simons Simplex (117 DNMs in 1623 affected males) | 1623 | 0.25 | 0.07 | 0.35 | 0.43 |
| Simons Simplex (21 DNMs in 249 affected females) | 249 | 0.24 | 0.08 | 0.58 | 0.66 |
| MSSNG Simplex (38 DNMs in 531 affected males) | 531 | 0.32 | 0.07 | 0.40 | 0.51 |
| MSSNG Simplex (7 DNMs in 153 affected females) | 153 | 0.27 | 0.05 | 0.58 | 0.66 |
| SPARK (76 DNMs in 279 affected males) | 279 | 0.47 | 0.27 | 0.29 | 0.32 |
| SPARK (12 DNMs in 68 affected females) | 68 | 0.44 | 0.18 | 0.47 | 0.58 |
| MSSNG multiplex (35 DNMs in 491 affected males) | 491 | 0.36 | 0.07 | 0.19 | 0.00 |
| MSSNG multiplex (15 DNMs in 175 affected females) | 175 | 0.38 | 0.09 | 0.13 | 0.00 |
Appendix 1—table 2
Data sources by ascertainment.
Additional files
-
MDAR checklist
- https://cdn.elifesciences.org/articles/83172/elife-83172-mdarchecklist1-v2.pdf
-
Supplementary file 1
List of 285 putatively “neutral” genes.
- https://cdn.elifesciences.org/articles/83172/elife-83172-supp1-v2.txt
-
Supplementary file 2
Point estimates and confidence intervals for hs for 17,318 autosomal and 679 X chromosome genes.
- https://cdn.elifesciences.org/articles/83172/elife-83172-supp2-v2.txt
Download links
A two-part list of links to download the article, or parts of the article, in various formats.
Downloads (link to download the article as PDF)
Open citations (links to open the citations from this article in various online reference manager services)
Cite this article (links to download the citations from this article in formats compatible with various reference manager tools)
Relating pathogenic loss-of-function mutations in humans to their evolutionary fitness costs
eLife 12:e83172.
https://doi.org/10.7554/eLife.83172


