Microglial motility is modulated by neuronal activity and correlates with dendritic spine plasticity in the hippocampus of awake mice
- Neuroimmunology and Imaging Group, German Center for Neurodegenerative Diseases, Germany
- Light Microscopy Facility, German Center for Neurodegenerative Diseases, Germany
Figures
Figure 1 with 6 supplements

Increased microglial motility in the hippocampus of awake mice.
Experimental paradigm of repetitive microglia imaging in dorsal CA1 (stratum radiatum [SR]) in the same mice under varying conditions. (b) Schematic of the accessible hippocampal layers in CA1 through a chronic hippocampal cranial window. CX3CR1-GFP::thy-1-YFP-H transgenic mice allowed for simultaneous visualization of microglia (green) and neurons (magenta). (c) Representative image of a microglia cell and its processes in an awake mouse imaged in CA1, SR. Subsequent time points (0, 5 min) were superimposed (Δt=5 min) to measure gained (green arrow), lost (red arrow), and stable (yellow area) processes. (d) Turnover rate of microglia fine processes (i.e. motility) at varying conditions (n=6 mice ‘anesthesia’, ‘awake’; n=4 ‘awake+tetrodotoxin [TTX]’); one-way ANOVA with Bonferroni’s multiple comparison test, F(2,13) = 10.22; p=0.0291 (anesthesia vs. awake), p=0.0014 (awake vs. awake+TTX). Error bars: SEM. Scale bars: (b) 100 μm, (c) 10 μm, 2 μm; *p<0.05, **p<0.01.
Figure 1—figure supplement 1
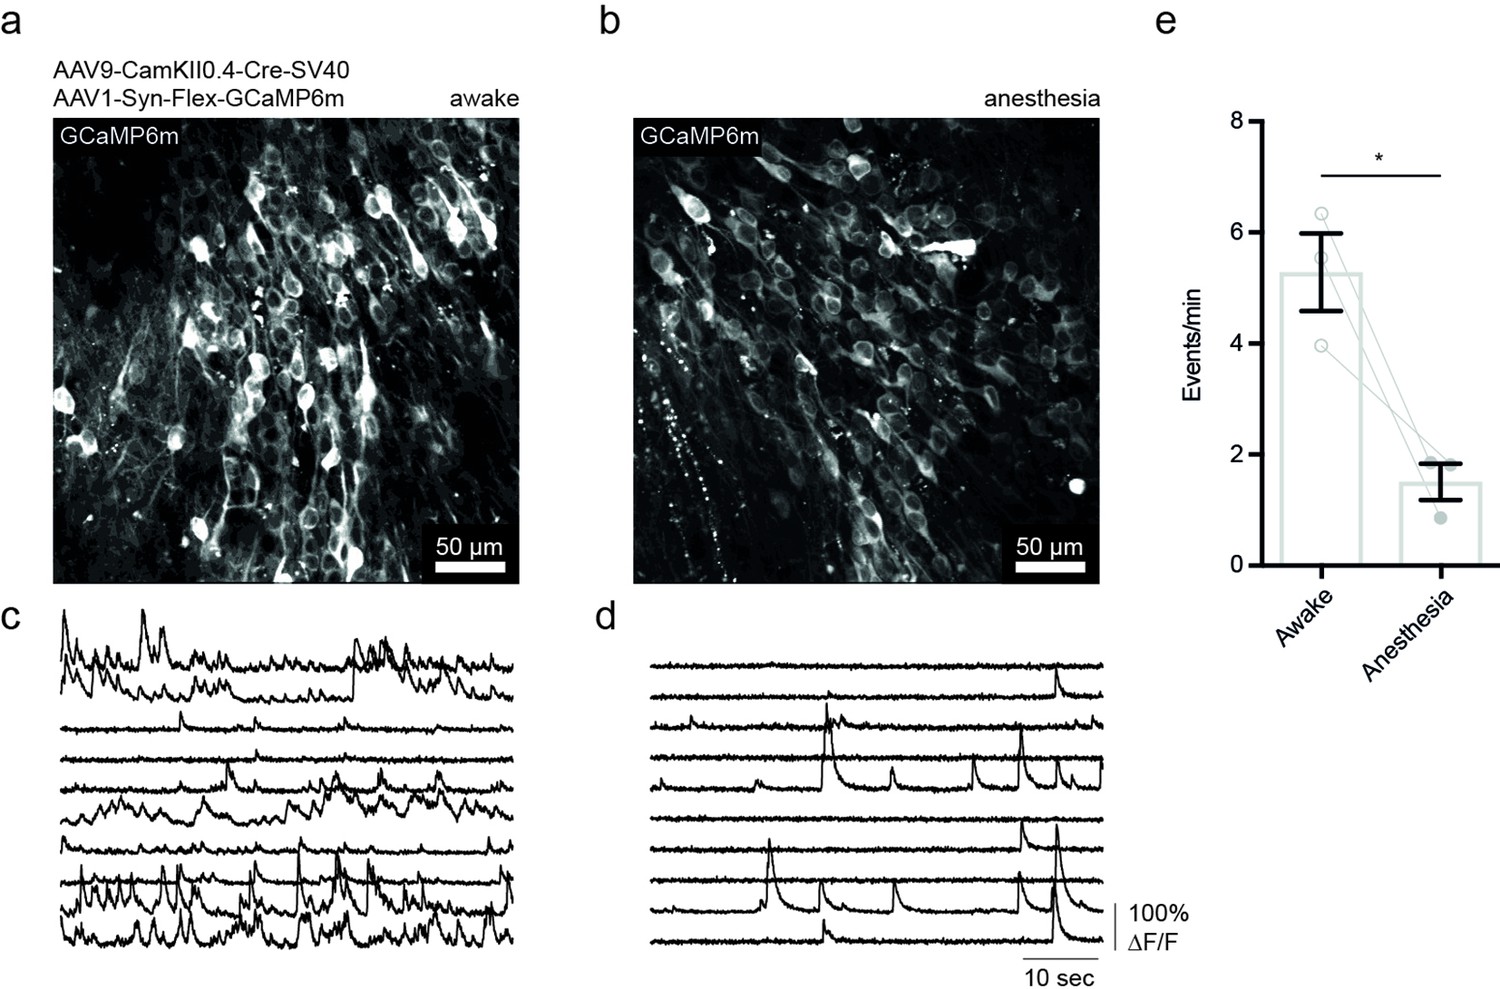
Isoflurane anesthesia decreases neuronal activity in the hippocampus.
(a) Exemplary image of Ca2+ imaging (GCaMP6m) in CamKII+ cells of the CA1 region in the dorsal CA1 of the hippocampus in an awake mouse averaged over 60 s at 30 Hz sampling rate. (b) Ca2+ imaging under isoflurane anesthesia (1% in O2). (c) Exemplary traces of changes in somatic GCaMP6m fluorescence in 10 cells over 60 s in an awake mouse. (d) Fluorescence changes under anesthesia. (e) Comparison of average Ca2+ responses in both conditions. Data shown for three mice and 50–100 cells per recording in two different fields of views, respectively. Paired t-test, p=0.0435; *p<0.05. Error bars: SEM.
Figure 1—figure supplement 2
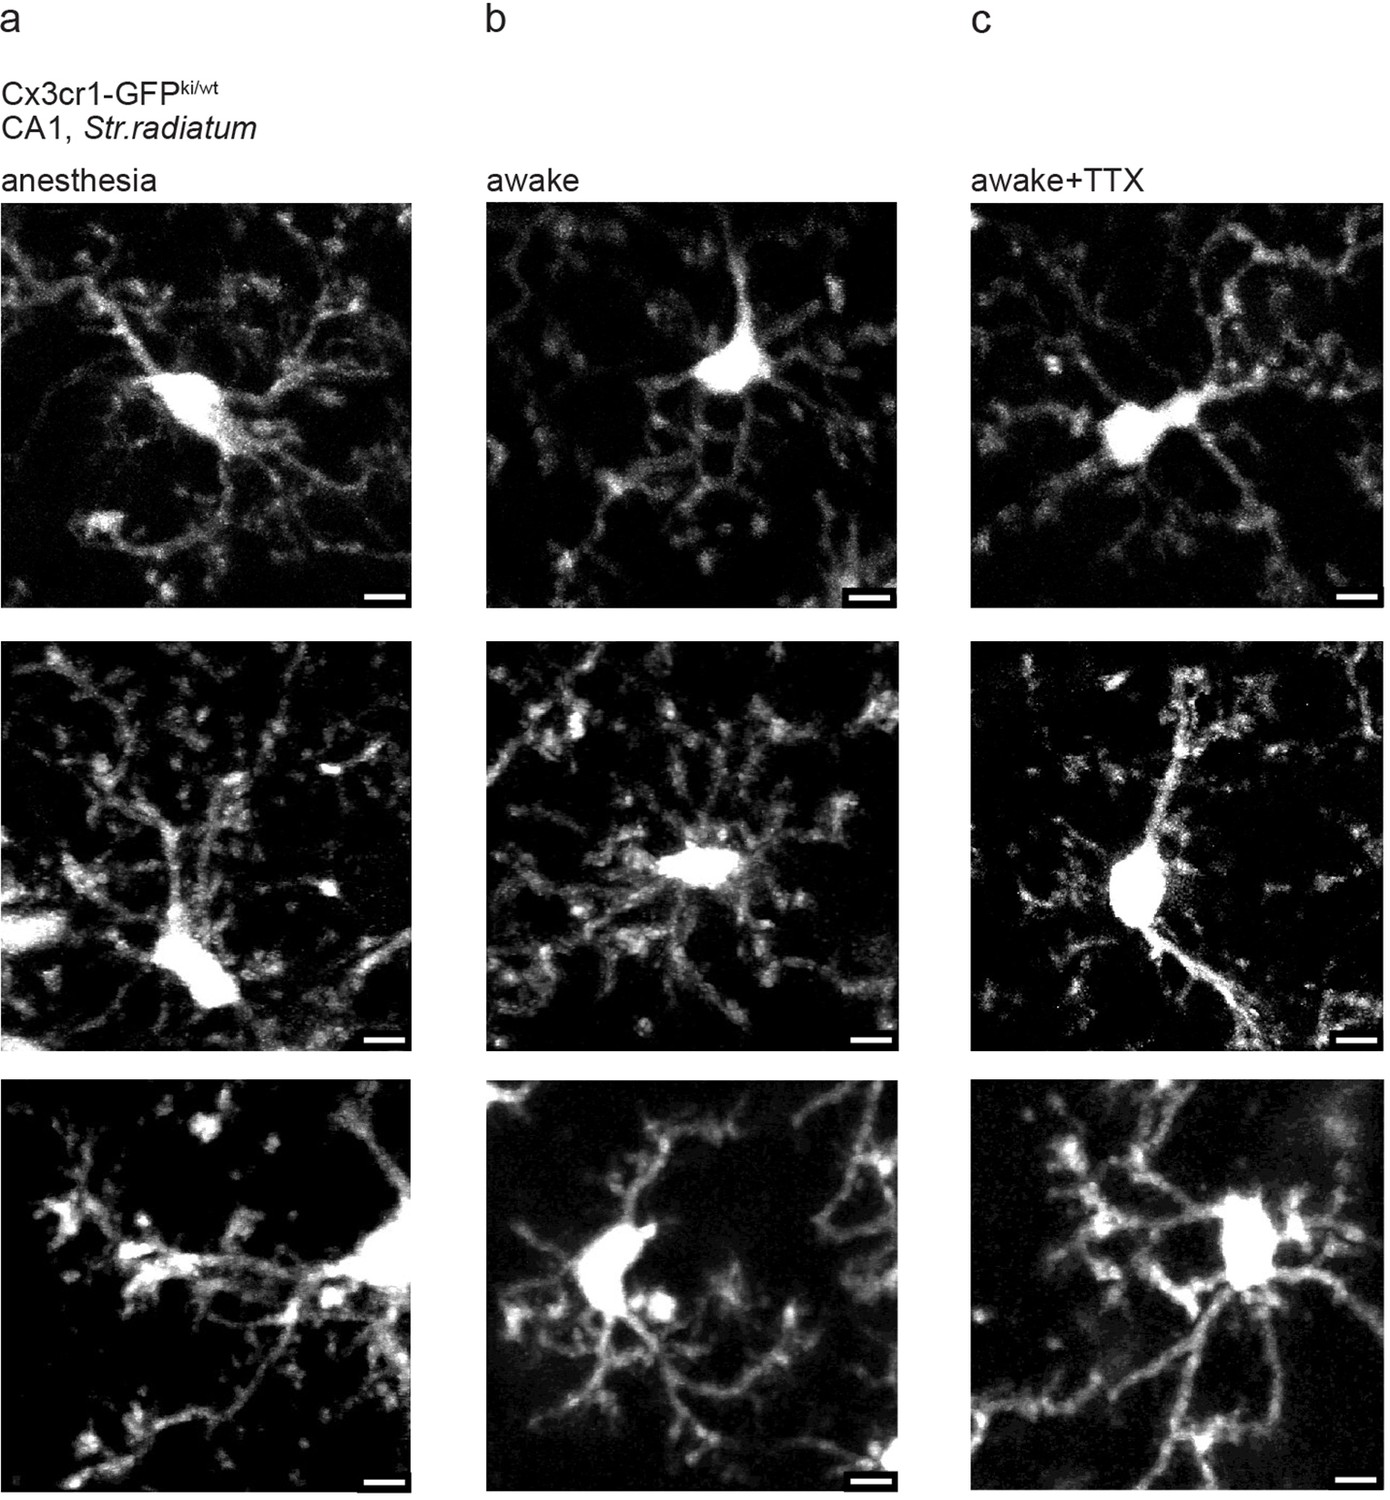
Examples of microglia in CA1 under anesthesia, awake, and tetrodotoxin (TTX)-treated conditions.
(a–c) Exemplary in vivo images of microglia from stratum radiatum (SR) of dorsal CA1 under (a) isoflurane anesthesia, (b) awake, and (c) awake but after topical TTX treatment. We did not observe deramification under conditions (b) and (c). Scale bar: 5 µm.
Figure 1—video 1
Microglial motility in an anesthetized mouse.
Microglia fine process motility recorded in the hippocampus of a mouse under isoflurane anesthesia (1% in O2) using two-photon microscopy over 45 min. Z-stacks were acquired 5 min apart each spanning 100 µm starting under the CA1 cell layer. For analysis, a maximum intensity projection of 25 µm was created for each time point. Scale bar: 10 μm.
Figure 1—video 2
Microglial motility in an awake mouse.
Microglia fine process motility recorded in the hippocampus of an awake mouse head-fixed on a circular treadmill using two-photon microscopy. Z-stacks were taken 5 min apart each spanning 100 µm starting under the CA1 cell layer. For analysis a maximum intensity projection of 25 µm was created for each time point. Scale bar: 10 μm.
Figure 1—video 3
Calcium imaging of CA1 pyramidal neurons under isoflurane anesthesia.
Exemplary video of Ca2+ imaging (GCaMP6m) in CamKII+ cells in the CA1 region of the hippocampus in an anesthetized mouse (isoflurane, 1% in O2) over 60 s. Scale bar: 50 µm.
Figure 1—video 4
Calcium imaging of CA1 pyramidal cells in an awake mouse.
Exemplary video of Ca2+ imaging (GCaMP6m) in CamKII+ cells in the CA1 region of the hippocampus of an awake mouse over 60 s. Scale bar: 50 µm.
Figure 2 with 4 supplements
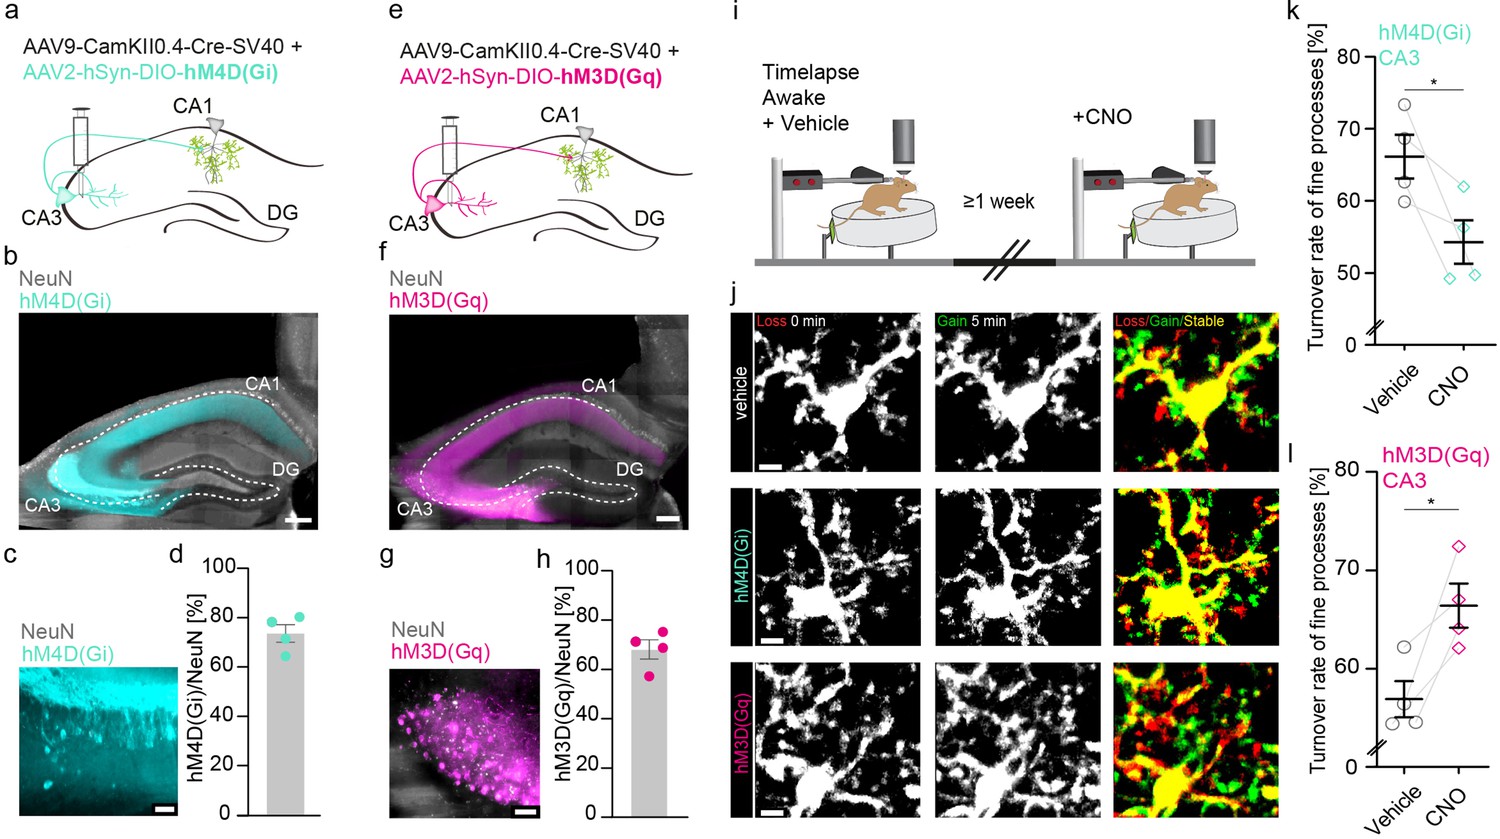
Increasing or decreasing CA3 input to CA1 reciprocally changes microglial motility.
(a, e) Adeno-associated virus (AAV) injections into the CA3 region of the hippocampus with CamKII-driven Cre-recombinase expression in neurons. This allows for the expression of loxP-flanked hM4D(Gi) (a) or hM3D(Gq) (e) under human synapsin1 promoter in CA3 neurons. (b, c) Representative images of hM4D(Gi) expression in the hippocampus (b), zoom on CA3 (c). (d) Quantification of hM4D(Gi)-DREADD (designer receptor exclusively activated by designer drug) transfected cells, on average 74% of cells in CA3 were co-expressing NeuN and mCherry/hM4D(Gi) (n=4 mice, 2410 cells were counted in total). (f, g) Representative images of hM3D(Gq) expression in the hippocampus (f), zoom on CA3 (g). (h) Quantification of hM3D(Gq)-DREADD transfected cells, on average 68% of cells in CA3 were co-expressing NeuN and mCherry/hM3D(Gq) (n=4 mice, 1749 cells were counted in total). (i) The dorsal CA1 region (stratum radiatum [SR]) of the same mice was imaged awake twice with a 1-week interval. Imaging started 40 min after i.p. injection of either vehicle (dimethyl sulfoxide [DMSO]) or clozapine N-oxide (CNO). (j) Exemplary images of microglia fine process turnover after vehicle and CNO injections under both hM4D(Gi) and hM3D(Gq) conditions in CA1, SR. (k) Microglia fine process turnover rate of DMSO- and CNO-treated mice that were injected with an inhibitory DREADD, hM4D(Gi) (n=4 mice, unpaired t-test, two-tailed, p=0.0326). (l) Microglia fine process turnover rate of DMSO- and CNO-treated mice that were injected with an excitatory DREADD, hM3D(Gq) (n=4 mice, unpaired t-test, two-tailed, p=0.0167). Error bars: SEM. Scale bars: (j) 5 μm, (c,g) 50 µm, (b,f) 500 μm, 2 μm; *p<0.05, ***p<0.001.
Figure 2—figure supplement 1
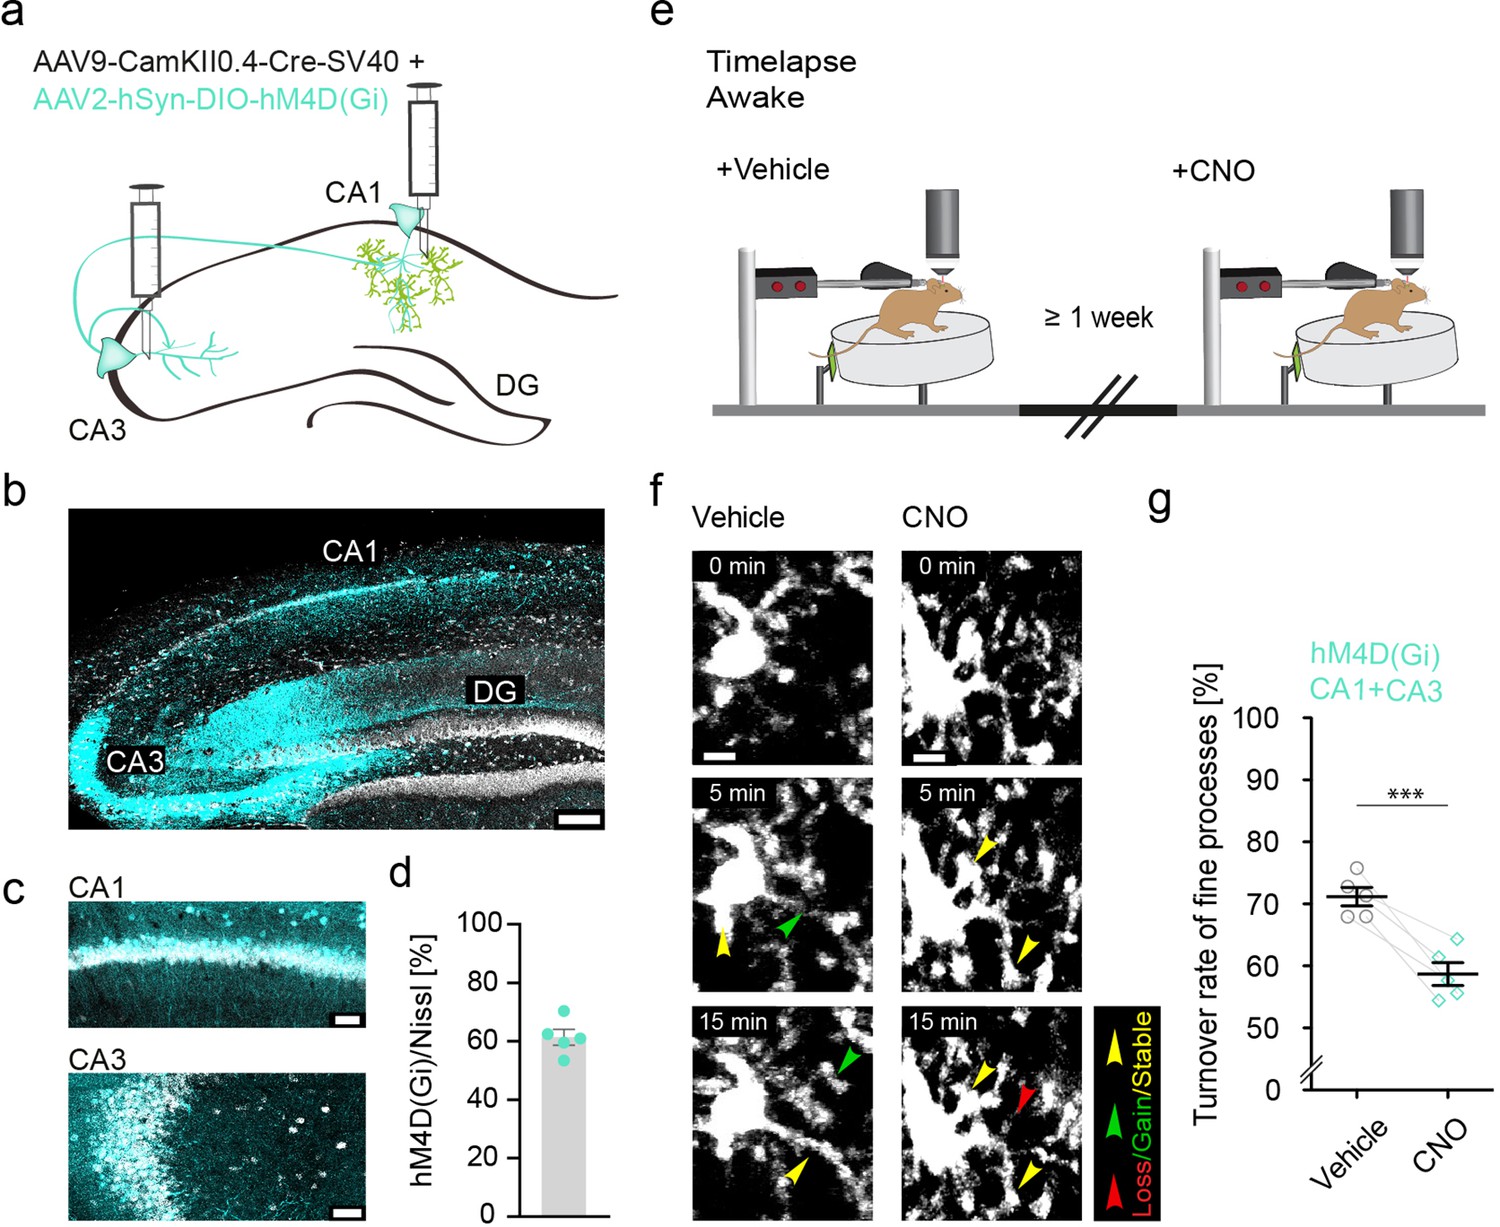
Microglial motility in awake mice depends on neuronal activity.
(a) Injection of two adeno-associated viruses (AVVs) into the CA1 and CA3 region of the hippocampus with CamKII-driven Cre-recombinase expression in neurons (first AAV). This allows for the recombination of loxP-flanked hM4D(Gi) and expression of the DREADD (designer receptor exclusively activated by designer drug) under human synapsin1 promoter (hSyn) in these neurons (second AAV). (b,c) Representative images of hM4D(Gi) expression in the hippocampus (b), zoom on CA1+CA3 (c). (d) Quantification of hM4D(Gi)-DREADD transfected cells in CA1 and CA3, on average 61% of cells were co-expressing Nissl and mCherry/hM4D(Gi) (n=5 mice, 970 cells were counted in total). (e) The same mice were imaged awake twice with a time interval of at least 1 week between imaging sessions. Imaging started 40 min after i.p. injection of either vehicle or clozapine N-oxide (CNO). (f) Example images in stratum radiatum of dorsal CA1 of microglia fine process turnover after vehicle and CNO injections under hM4D(Gi) conditions (CA1 and CA3 transfected). (g) Turnover rate of microglia fine processes in vehicle- and CNO-treated mice; n=5 mice, paired t-test, two-tailed, p=0.0048. Error bars: SEM. ***p<0.001. Scale bars: (f) 5 μm, (c) 50 µm, (b) 500 μm,.
Figure 2—figure supplement 2
Elevated Ca2+ event frequency in Schaffer collaterals following DREADD (designer receptor exclusively activated by designer drug) activation.
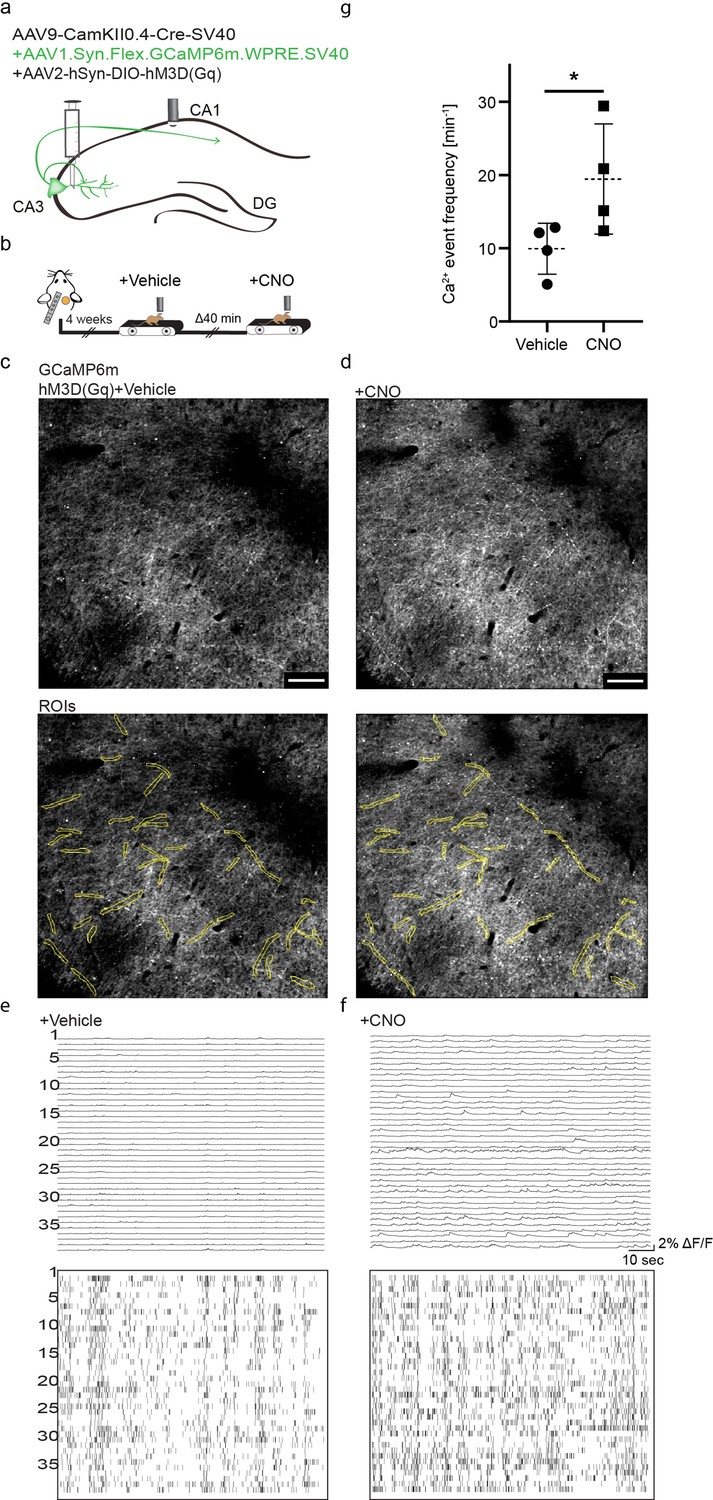
(a) Schematic illustrating stereotactic injections into the CA3 region of the hippocampus with a combined injection of AAV9-CamKII0.4-Cre-SC40 together with AAV1-Syn-Flex-GCaMP6m and a AAV2-hSyn-DIO-hM3D(Gq)-DREADD. (b) Mice were implanted with a chronic hippocampal window and then imaged under awake conditions on a linear treadmill after vehicle and clozapine N-oxide (CNO) injections. (c, d) Exemplary image of GCaMP6m labeled axonal fibers in stratum radiatum (SR) of CA1 deriving from CA3 neurons with application of vehicle (c) or CNO (d). regions of interest (ROIs) (yellow) for analysis are depicted in the two pictures in the lower panel of (c, d). (e, f) ΔF/F Ca2+ traces of axonal ROIs from (c, d) recorded over 120 s from GCaMP6m-expressing CA3 axons. (g) Comparison of average Ca2+ event frequency between vehicle and CNO treatment. Data shown as average over four mice with a total of n=1641 axonal ROIs included and five to eight fields of views per mouse and condition. Mann-Whitney test; p=0.043; *p<0.05. Error bars: SEM. Scale bar: 50 µm (b).
Figure 2—video 1
Ca2+ imaging of Schaffer collaterals in CA1 of vehicle-treated hM3D(Gq)-expressing CA3 neurons in awake mice.
Imaging of axonal fibers in stratum radiatum (SR) after a co-injection of AAV9-CamKII0.4-Cre-SC40 together with AAV1-Syn-Flex-GCaMP6m and a AAV2-hSyn-DIO-hM3D(Gq)-DREADD into the CA3 cell layer. Video shown for about 100 s of acquisition time in the control (vehicle condition, 40 min after injection). Scale bar: 50 µm.
Figure 2—video 2
Ca2+ imaging of Schaffer collaterals in CA1 of clozapine N-oxide (CNO)-treated hM3D(Gq)-expressing CA3 neurons in awake mice.
Imaging of axonal fibers in stratum radiatum (SR) after a co-injection of AAV9-CamKII0.4-Cre-SC40 together with AAV1-Syn-Flex-GCaMP6m and AAV2-hSyn-DIO-hM3D(Gq)-DREADD into the CA3 cell layer. Video shown for about 100 s of acquisition time in the control (CNO condition, 40 min after injection). Scale bar: 50 µm.
Figure 3 with 2 supplements
Increased structural plasticity of dendritic spines in the hippocampus of awake mice.
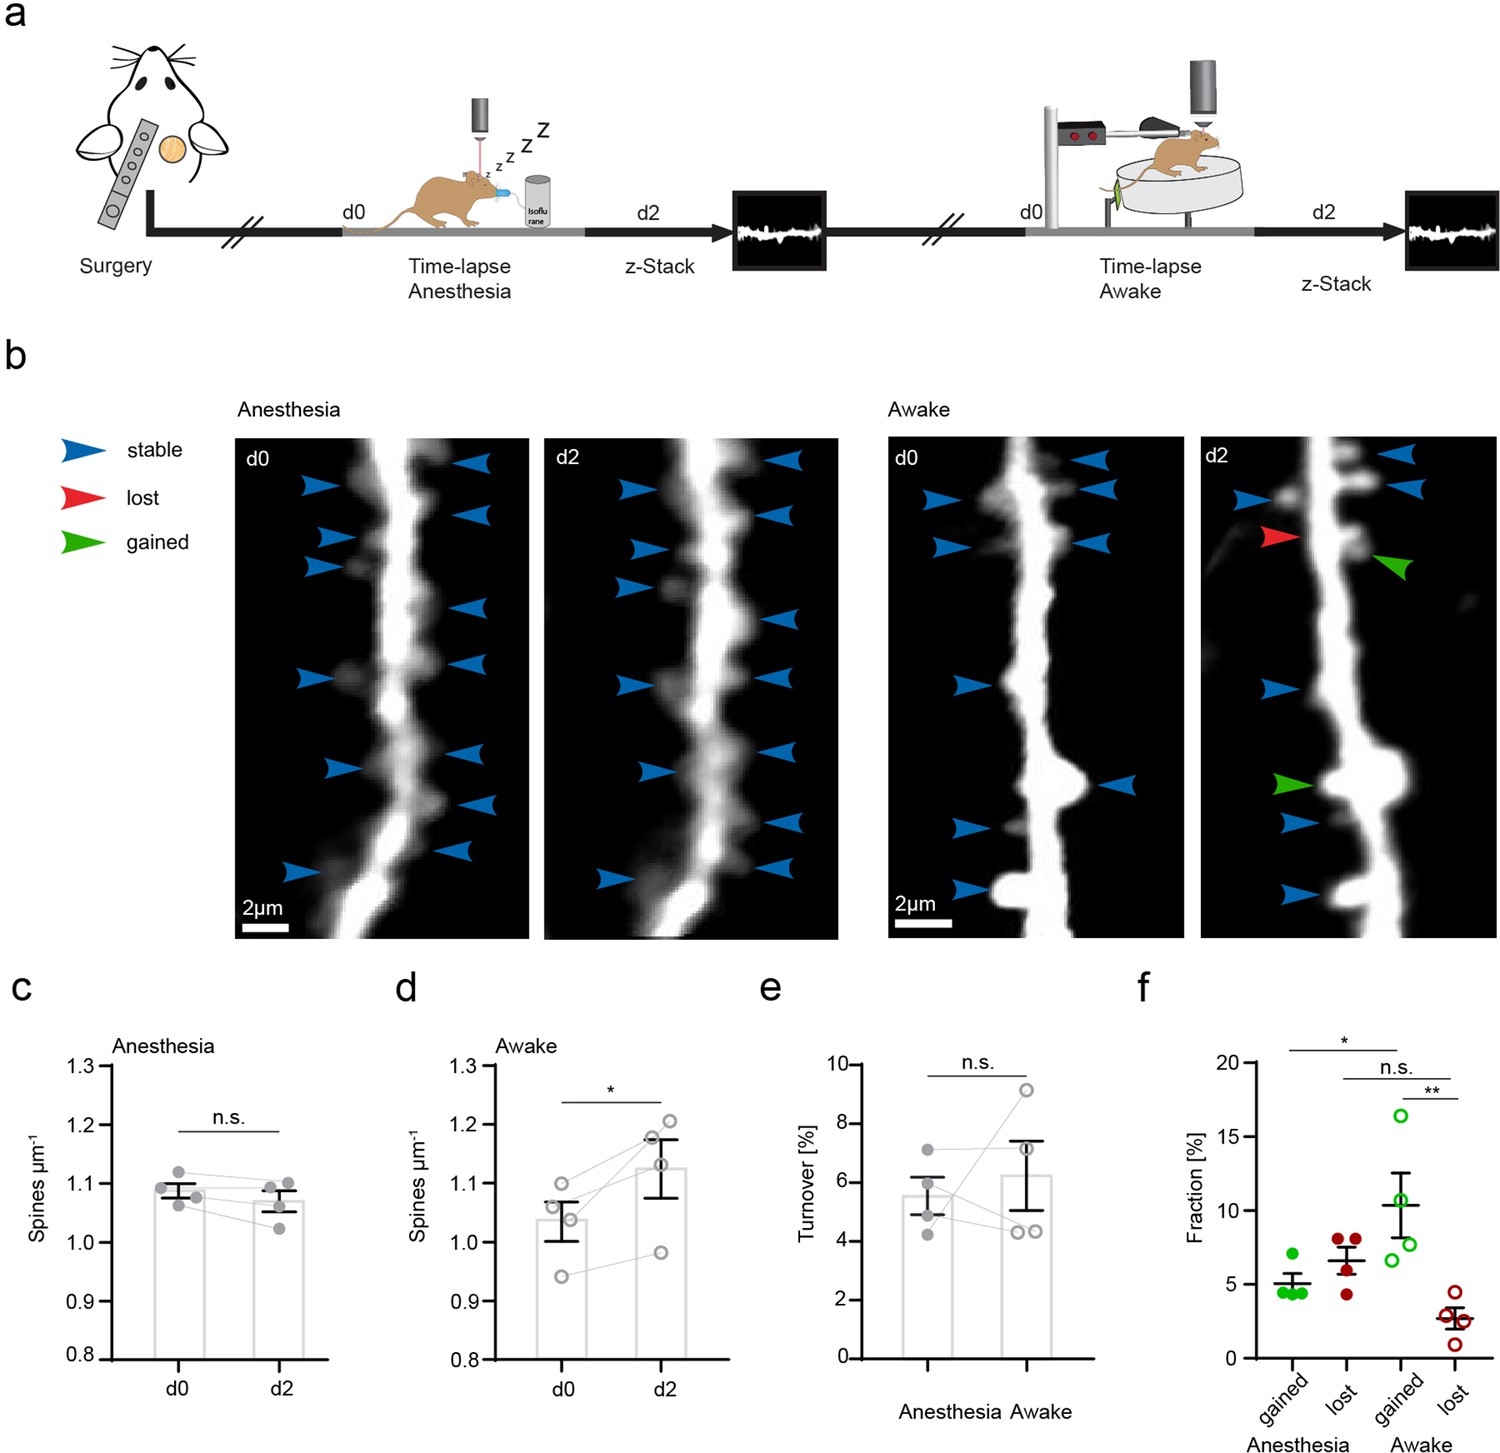
(a) Mice were imaged twice with a 2-day interval, first in anesthesia and subsequently awake on a spinning disk. (b) We acquired z-stacks containing radial oblique dendrites in stratum radiatum of dorsal CA1 in the hippocampus. Exemplary images of two dendrites acquired with a 2-day interval in anesthesia (left panel) or awake (right panel). Blue arrows indicate stable, red arrows lost, and green arrows gained spines. (c) No changes of spine density after imaging in anesthesia (1.09 ± 0.01 μm–1 at d0 vs. 1.07 ± 0.02 μm–1 at d2; paired t-test, p=0.1235). (d) Elevated spine density after awake imaging (1.04 ± 0.03 μm–1 to 1.12±0.05 μm–1; paired t-test, p=0.0462). (e) Similar turnover of dendritic spines was detectable between anesthetized and awake mice (5.55 ± 0.64% anesthesia vs. 6.23 ± 1.17% awake; paired t-test, p=0.6692). (f) Turnover of dendritic spines differentiated into fractions of lost and gained spines under both conditions. In awake mice, the fraction of gained spines was elevated (10.35 ± 2.19% in awake mice and 5.06 ± 0.68% in anesthetized mice; p=0.039). The fractions of gained and lost spines were comparable under anesthetized conditions (gained: 5.06 ± 0.68% vs. lost: 6.61 ± 0.92%; p=0.4095). The fraction of lost spines was similar in awake compared to anesthetized mice (f; 2.7 ± 0.73% awake vs. 6.61 ± 0.92% anesthesia; p=0.1496), under awake conditions we found more gained compared to lost spines (gained: 10.35 ± 2.19% and lost 2.7 ± 0.73%; p=0.0037), ordinary one-way ANOVA followed by Tukey’s multiple comparisons test, F(3,12) = 6.23. Data from four mice; n.s. not significant, *pP<0.05, **p<0.01. Error bars: SEM.
Figure 3—figure supplement 1
Clustered structural plasticity of spines associated with microglia contact frequency.
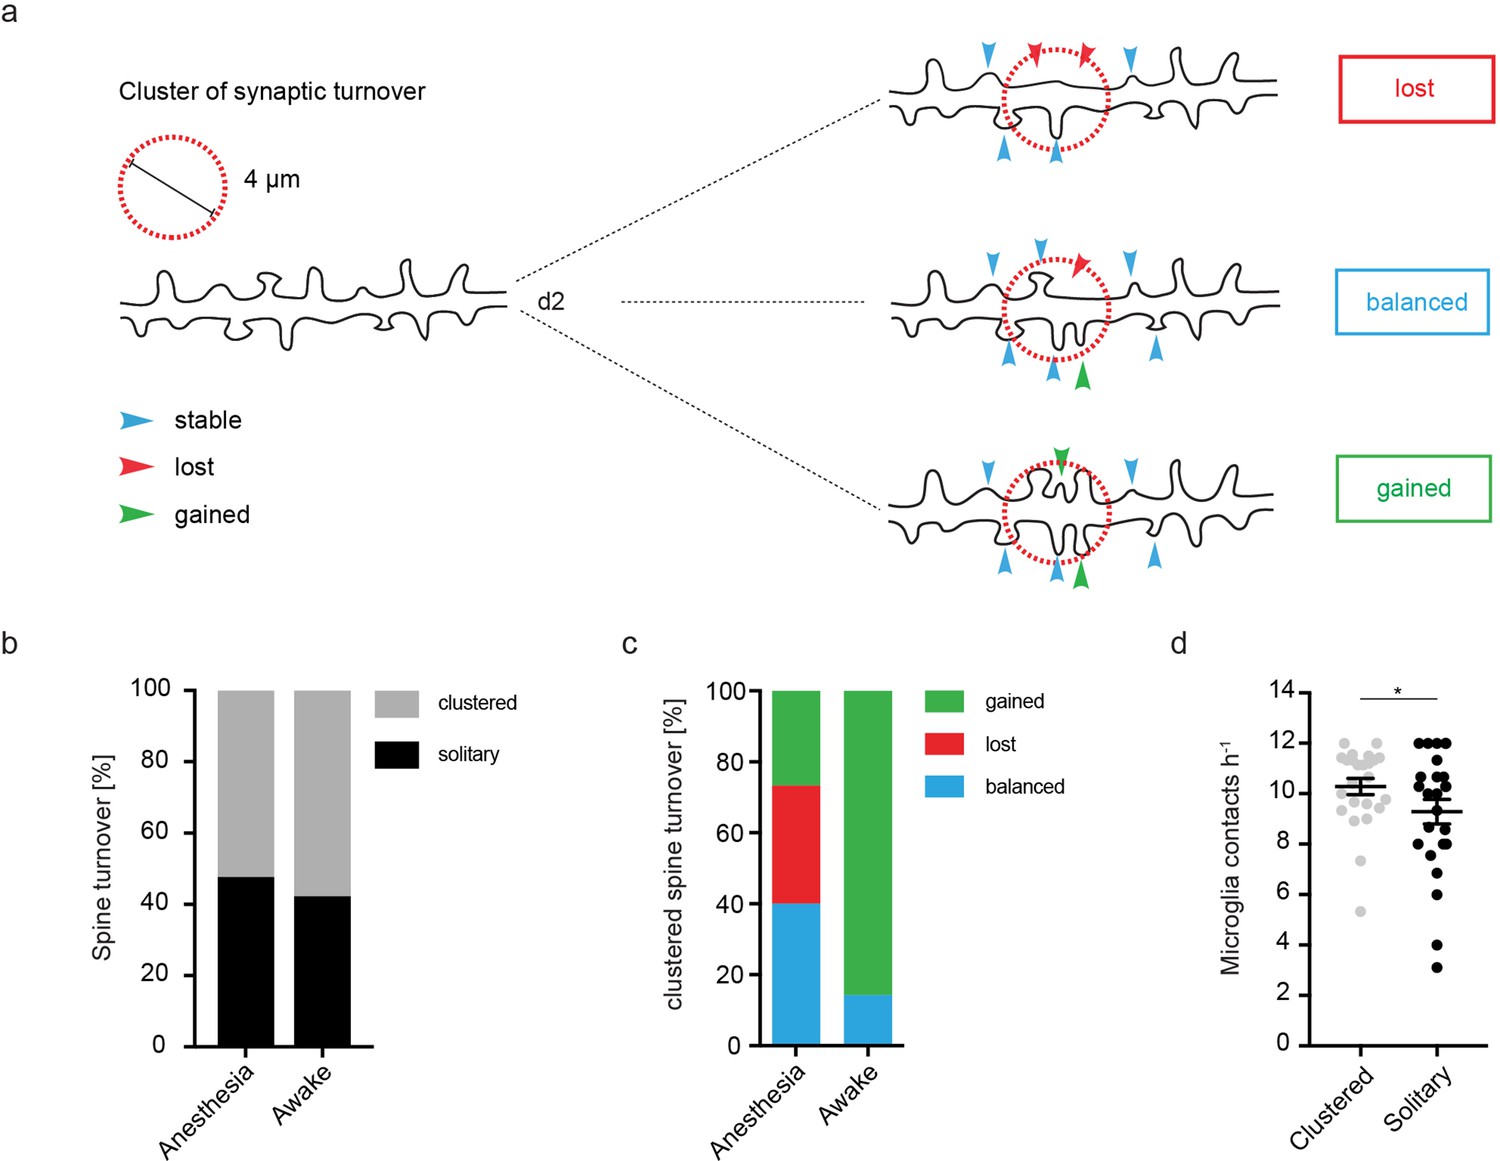
(a) Schematic illustrating clustered spine turnover quantification. Three different classes of clustered events (within a distance of 4 µm) were defined. Lost: If two neighboring spines were lost; balanced: if one spine is lost and another one gained; gained: if two spines were gained. (b) Approximately 55% of all observed events of structural plasticity in CA1 (stratum radiatum [SR]) were clustered both in anesthesia (52.26%) and awake (57.74%) conditions. (c) Analysis of clustered events with respect to their class (see (a): lost, balanced, gained). In awake mice, the fraction of clustered gained spines (85.71%) is larger than in anesthetized mice (26.67%). (d) Microglia contact rates as calculated in Figure 3a preceding a clustered or a solitary event (unpaired t-test, p=0.0365; *p<0.05). Error bars: SEM.
Figure 3—figure supplement 2
Increased structural plasticity of dendritic spines in the hippocampus of awake mice, statistics over dendrites.
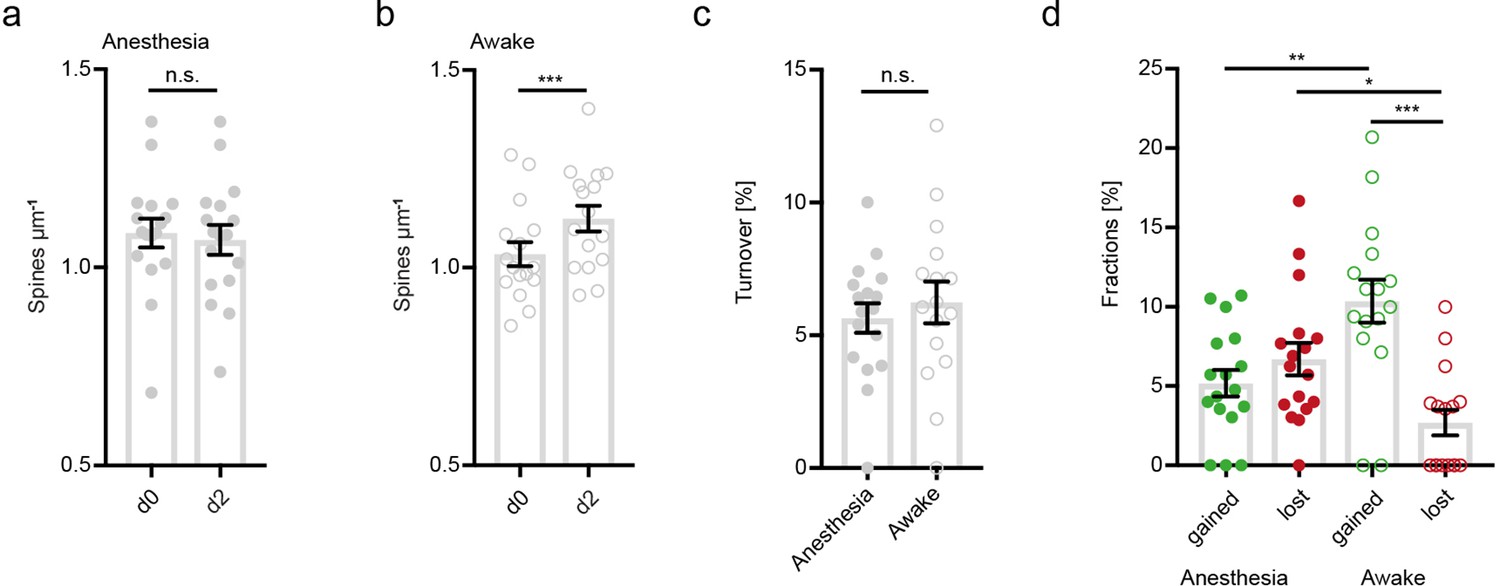
No changes of spine density after imaging in anesthesia (1.09 ± 0.04 μm–1 at d0 vs. 1.07 ± 0.04 μm–1 at d2; Wilcoxon matched-pairs signed rank test, p=0.2759). (b) Elevated spine density after awake imaging (1.04 ± 0.03 μm–1 to 1.12 ± 0.03 μm–1; paired t-test, p<0.0001). (c) Similar turnover of dendritic spines was detectable between anesthetized and awake mice (5.64 ± 0.55% anesthesia vs. 6.23 ± 0.79% awake; unpaired t-test, p=0.5377). (d) Turnover of dendritic spines differentiated into fractions of lost and gained spines under both conditions. In awake mice the fraction of gained spines was elevated (10.35 ± 1.35% in awake mice and 5.18 ± 0.84% in anesthetized mice; p=0.0036). These fractions were comparable under anesthetized conditions (gained: 5.18 ± 0.84% vs. lost: 6.7 ± 1.02%; p=0.7079). The fraction of lost spines was decreased in awake compared to anesthetized mice (Figure 3f; 2.7 ± 0.81% awake vs. 6.7 ± 1.02% anesthesia; p=0.0359), ordinary one-way ANOVA followed by Tukey’s multiple comparisons test, F(3,62) = 9.58. Data from four mice with spine turnover averaged over dendrites; n=17 loss+17 gain in anesthesia and n=16 loss+16 gain in awake mice respectively (a–d); n.s. not significant, *p<0.05, **p<0.01, ***p<0.001. Error bars: SEM.
Figure 4 with 2 supplements
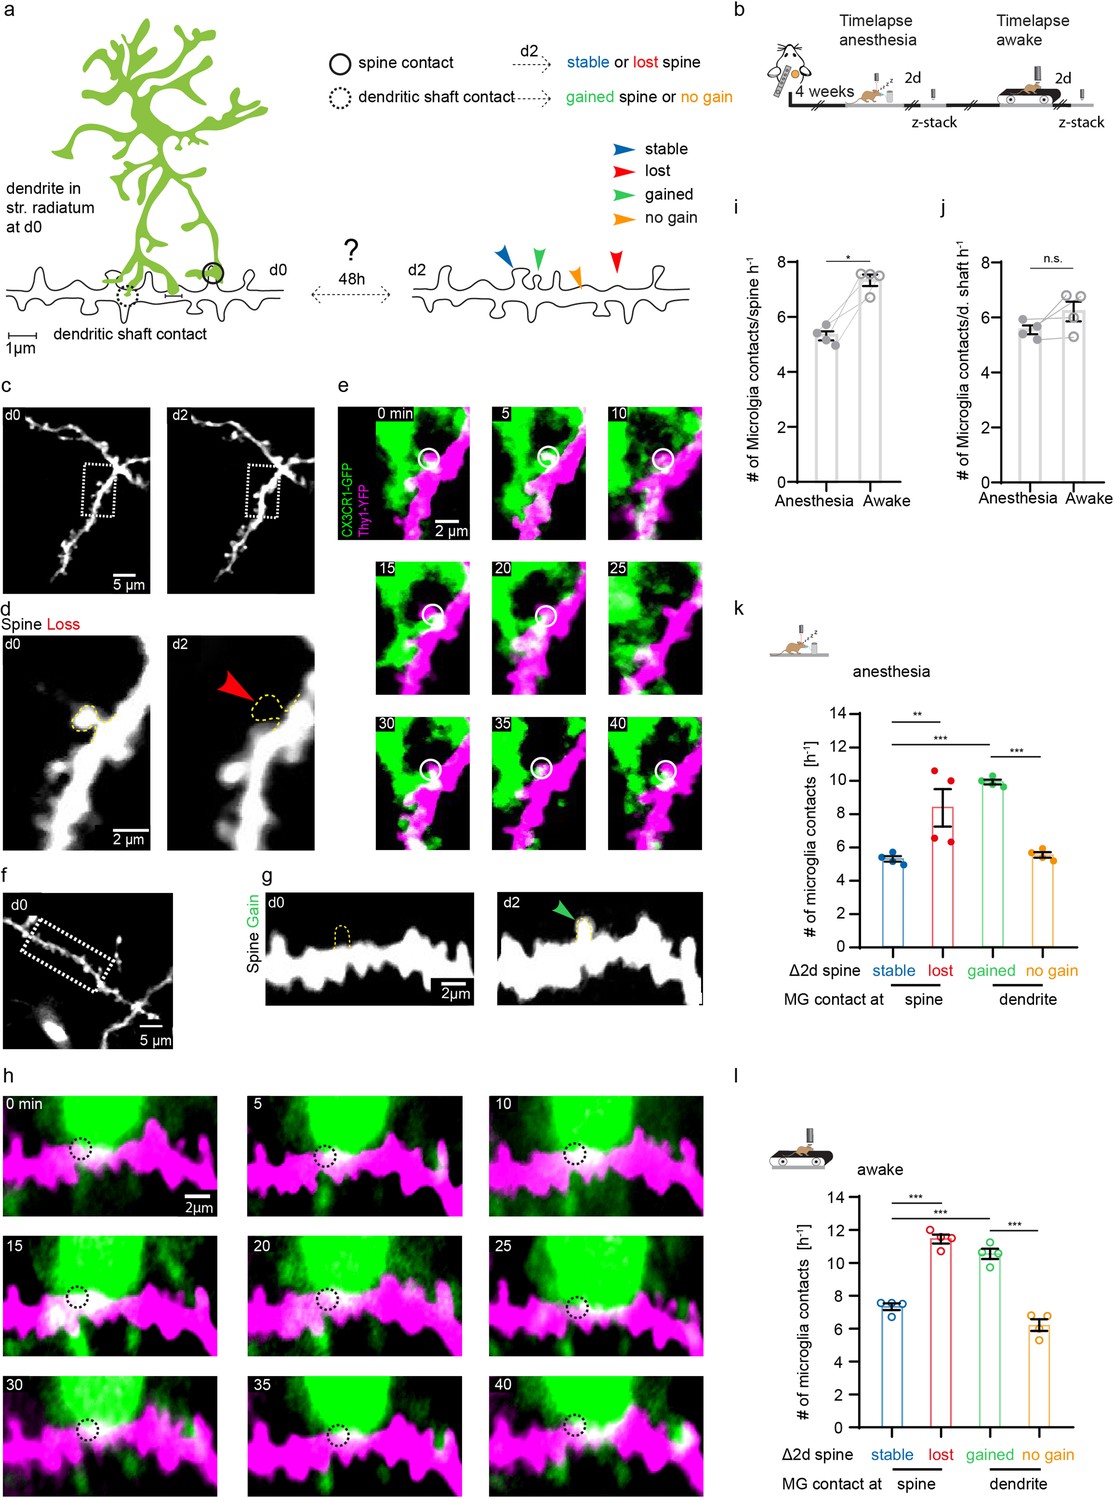
Microglia contact frequency is associated with spine stability in the hippocampus.
(a) Schematic illustrating the analysis between microglia contacts and spine stability in stratum radiatum of dorsal CA1: direct spine contacts (circle) can lead to a stable (blue arrow) or lost spine (red arrow) as analyzed 2 days later, whereas contacts of the dendritic shaft (dashed circle) can lead to a gained spine (green arrow) or no change/no spine gain (orange). (b) The same mice were imaged four times after implantation of the hippocampal window. First in anesthesia and 48 hr later two visualize potential changes of dendritc spines and then again under awake conditions, followed by relocalization 48 hr later. (c) Overview image of a dendrite in stratum radiatum (SR) at two consecutive time points 48 hr apart. (d) Zoom image from (c) illustrating a dendritic segment with distinctive dendritic spines. Note the lost spine after 2 days (red arrow). (e) Time-lapse of microglia processes (green) interacting with the dendrite and spines (magenta) in the hippocampus of an awake CX3CR1-GFP::thy-1-YFP-H mouse; the circle mark individual microglia contacts of spines. (f–h) Analog illustration as depicted in c–e for a gained spine example (green arrow in g). (i, j) Direct microglia contacts (h) and contacts along the dendritic shaft (i) in anesthetized vs. awake mice paired t-test (h, i); p=0.0105 (h), p=0.1452 (i). (k, l) Contact rate in anesthesia (j) and awake (k) at dendritic spines that are either stable (blue) or lost (red) and contacts at the dendritic shaft where either a spine was gained (green) after 48 hr or at random locations along the dendrite where no spine gain was detectable (orange). One-way ANOVA with Sidak’s multiple comparison test (j, k); F(3,12)=80.8 (j) and F(3,12)=73.91 (k); spine contacts averaged over n=4 mice (h–k); *p<0.05, **p<0.01, ***p<0.001. Error bars: SEM.
Figure 4—figure supplement 1
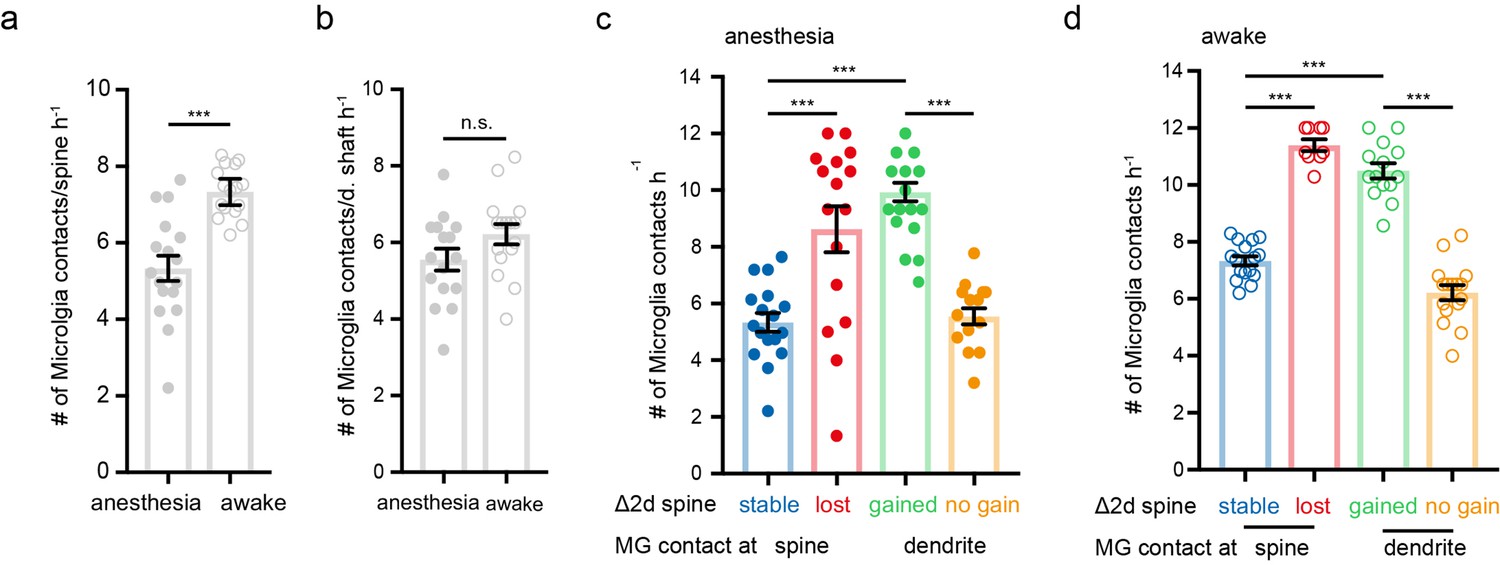
Microglia contact frequency associated with spine stability in the hippocampus, statistics over dendrites.
(a, b) Direct microglia contacts (a) and contacts along the dendritic shaft (b) in anesthetized vs. awake mice unpaired t-test (a,b); p<0.0001 (a), p=0.0964 (b). (c, d) Contact rate in anesthesia (c) and awake (d) at dendritic spines that are either stable (blue) or lost (red) and contacts at the dendritic shaft where either a spine was gained (green) after 48 hr or at random locations along the dendrite where no spine gain was detectable (orange). One-way ANOVA with Sidak’s multiple comparison test (c,d); F(3,59)=20.88 (c) and F(3,51)=103.7 (d); Spine contacts averaged over dendrites with n=17 stable, 16 loss, 14 gain, 16 d. Shaft in anesthesia and n=16 stable, 9 loss, 14 gain, and 16 d. Shaft awake in n=4 mice (a–d); n.s. not significant, ***p<0.0001. Error bars: SEM.
Figure 4—video 1
Microglia interacting with dendrites and spines in the hippocampus of an awake mouse.
Microglia (green) engage in contact with the dendritic shaft and individual dendritic spines (magenta). Regions of colocalization of microglia and neuronal structures appear white. Z-stacks were taken 5 min apart each. Scale bar: 5 μm.
Tables
Table 1
Mouse number and gender used in the experiments.
| Mouse number Figure 4 | #Spines analyzed for contacts, anesthesia | #Spines analyzed for contacts, awake |
|---|---|---|
| 1. | 157 | 152 |
| 2. | 133 | 110 |
| 3. | 125 | 125 |
| 4. | 130 | 145 |
Table 2
Number of spines analyzed for contacts.
| Figure | Condition | Total number of mice | Number of male mice | Number of female mice |
|---|---|---|---|---|
| Figure 1d | Anesthesia | 6 | 4 | 2 |
| Figure 1d | Awake | 6 | 4 | 2 |
| Figure 1d | TTX | 4 | 3 | 1 |
| Figure 1, Figure 1—figure supplement 1e | Ca2+, CA1, An vs. Aw | 3 | 3 | 0 |
| Figure 2k | CA3, hM4D(Gi) | 4 | 2 | 2 |
| Figure 2l | CA3, hM3D(Gq) | 4 | 1 | 3 |
| Figure 2, Figure 2—figure supplement 1g | CA1 + CA3, hM4D(Gi) | 5 | 2 | 3 |
| Figure 2, Figure 2—figure supplement 2g | CA3, Ca2+, hM3D(Gq) | 3 | 0 | 3 |
| Figure 3c–f | Structural plasticity, An vs. Aw | 4 | 2 | 2 |
| Figure 3, Figure 3—figure supplement 1 | Cluster | 4 | 2 | 2 |
| Figure 4i–l | Microglial contact rates | 4 | 2 | 2 |
Additional files
Download links
A two-part list of links to download the article, or parts of the article, in various formats.
Downloads (link to download the article as PDF)
Open citations (links to open the citations from this article in various online reference manager services)
Cite this article (links to download the citations from this article in formats compatible with various reference manager tools)
Microglial motility is modulated by neuronal activity and correlates with dendritic spine plasticity in the hippocampus of awake mice
eLife 12:e83176.
https://doi.org/10.7554/eLife.83176


