Working strokes produced by curling protofilaments at disassembling microtubule tips can be biochemically tuned and vary with species
- Department of Physiology and Biophysics, University of Washington, United States
- Department of Biophysics, UT Southwestern Medical Center, United States
- Department of Biochemistry, UT Southwestern Medical Center, United States
- Department of Biochemistry, University of Washington, United States
Figures
Figure 1 with 2 supplements
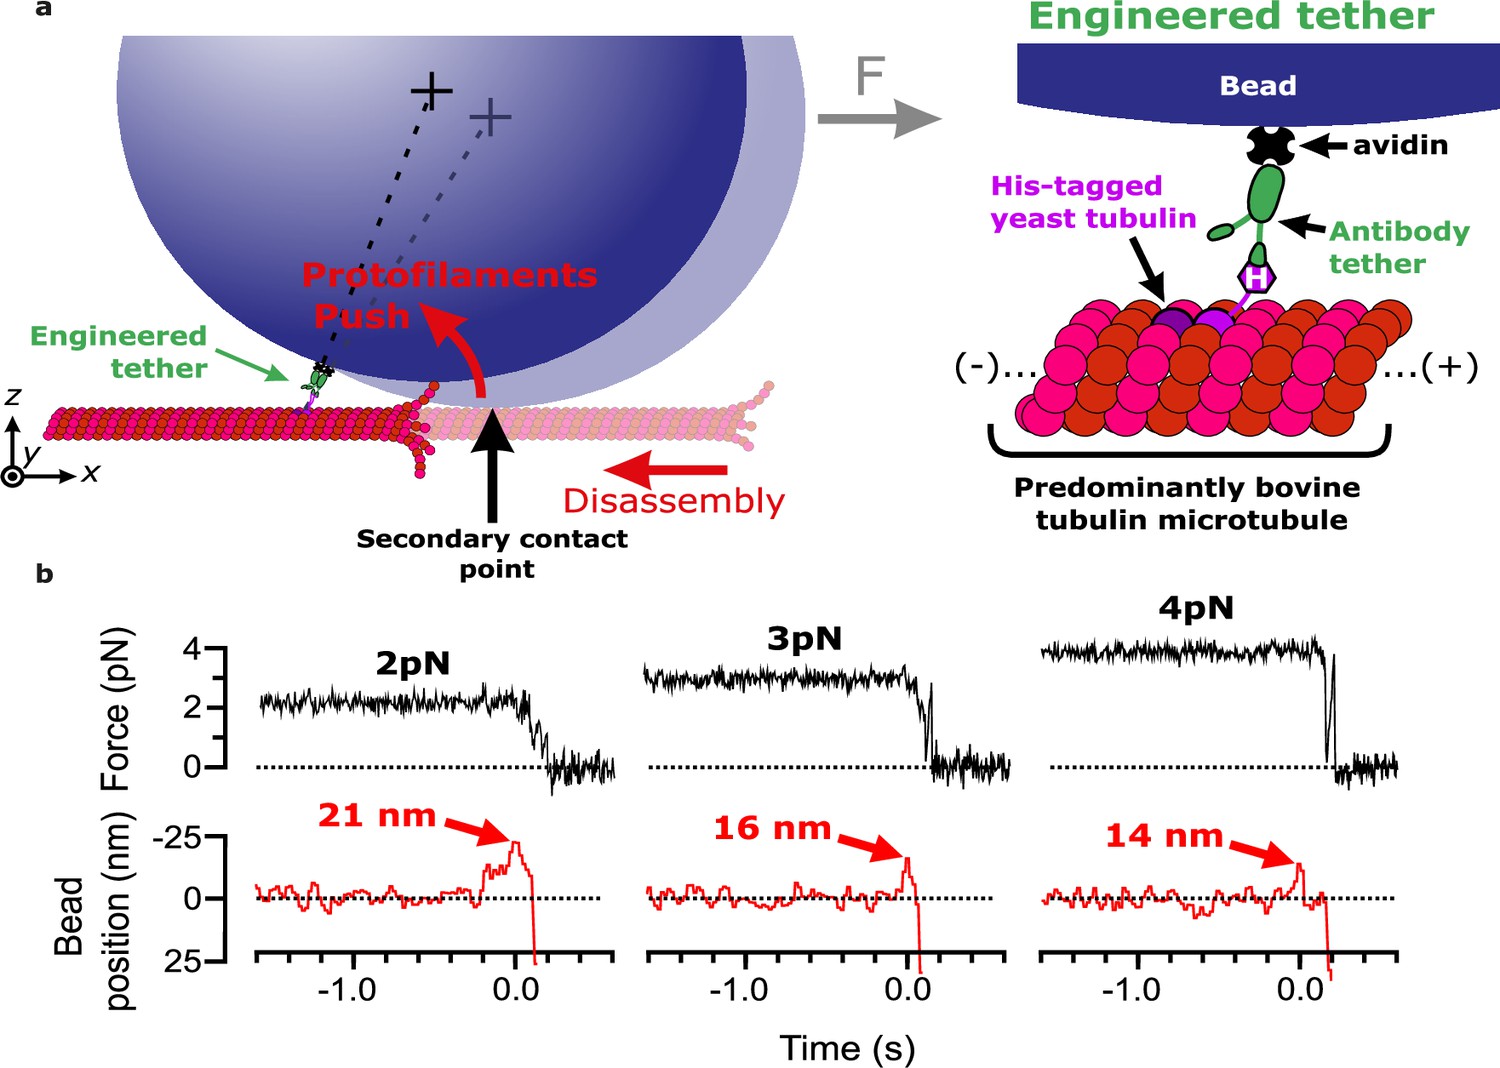
Measuring pulses of movement generated by protofilaments curling outward from the tips of disassembling bovine microtubules.
(a) Schematic of the wave assay: a bead is tethered to the microtubule lattice via an engineered tether composed of recombinant His6-tagged yeast tubulin, a biotinylated anti-penta-His antibody, and streptavidin. Tethering by a single anti-penta-His antibody is ensured by keeping the density of antibodies on the beads very low. Using a laser trap, the bead is tensioned toward the (+)-end, pressing it against the microtubule lattice at a secondary contact point. The stabilizing GTP cap is trimmed off the microtubule with laser scissors to initiate disassembly. Curling protofilaments at the disassembling microtubule tip form a conformational wave that pushes laterally on the bead, causing it to rock back about its tether. This rocking action produces a pulse of bead movement against the force of the laser trap. (b) Records of force (black) and bead position (red) versus time for three different bead-microtubule pairs. As the trapping force on the bead was increased, pulse heights decreased, consistent with spring-like behavior of the protofilament curls.
Figure 1—figure supplement 1

Features of the pulses of bead motion generated by curling protofilaments.
Example record of bead position and trapping force versus time, measured during disassembly of a bovine brain tubulin microtubule in 1 mM magnesium. The bead position trace (red, top graph) prior to the pulse is characterized by a baseline noise. The pulse is parameterized by a risetime, the duration over which the signal increases from the baseline to the pulse peak. The height of the pulse from the baseline is defined as the pulse amplitude. After the pulse, the bead detaches from the microtubule, and the trap pulls the bead rapidly in the direction of applied force. Corresponding force trace (black, bottom graph) shows that the force is clamped (maintained at a steady level) until bead detachment.
Figure 1—figure supplement 2
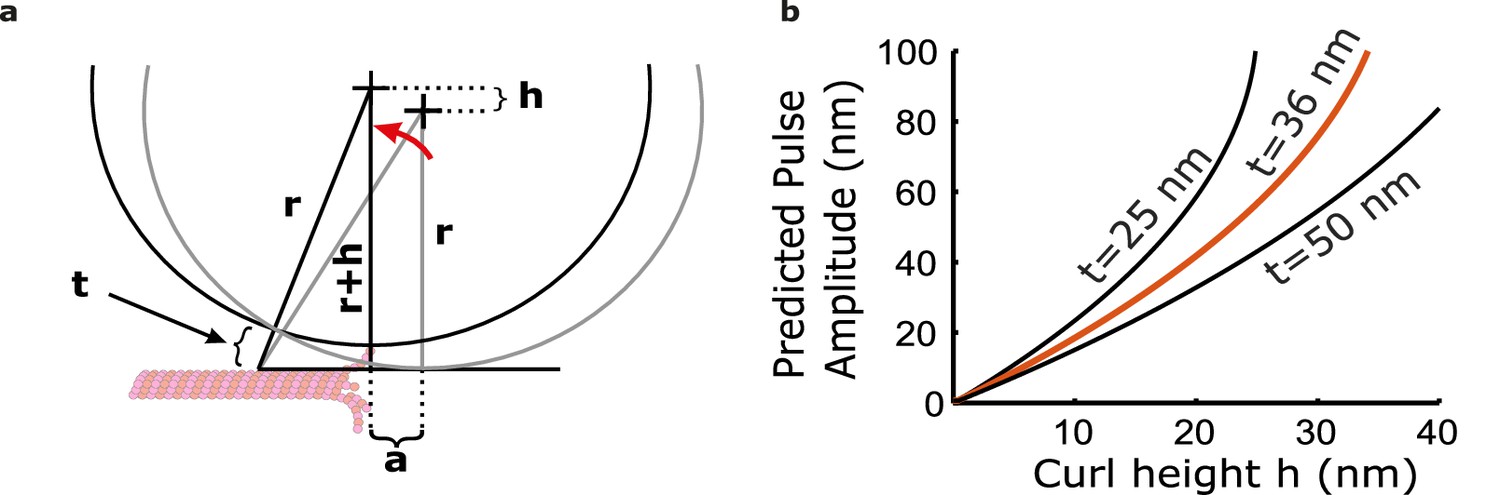
The bead and tether form a leverage system that amplifies protofilament curling motion.
(a) Leverage given geometric constraints of bead and tether. Protofilament curl height, h, is amplified to a larger horizontal distance, a. (b) Relationship between pulse amplitude and curl height from the lattice given three different tether lengths (t=25, 36, and 50 nm). Based on the composition of the tether, we estimate a length of t=36 nm.
Figure 2
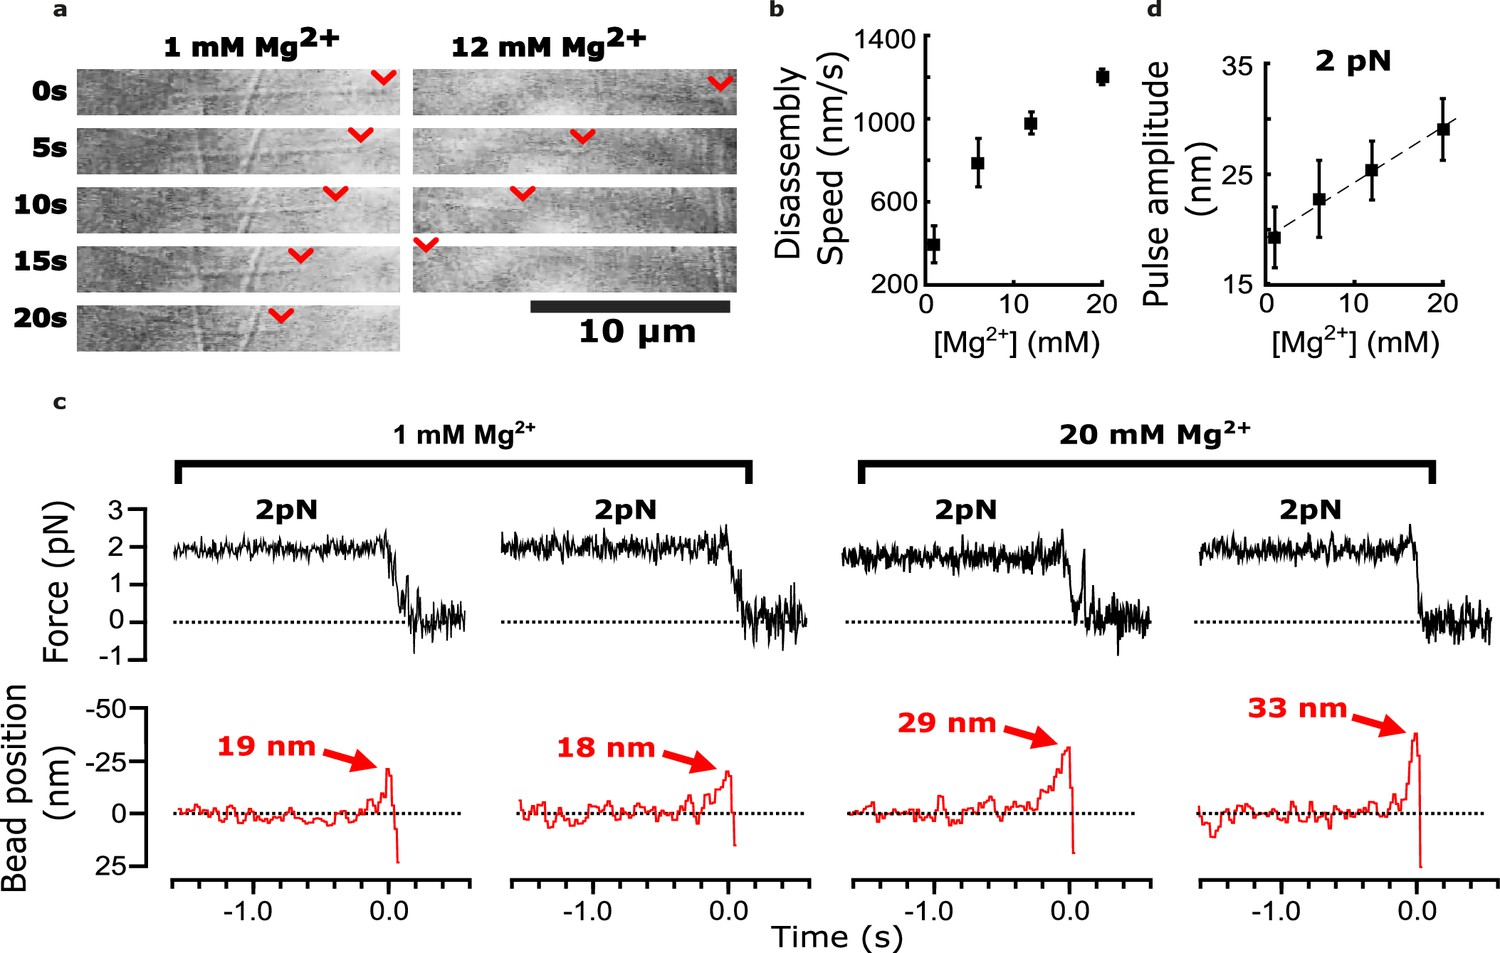
Added magnesium increases disassembly speed and pulse amplitude.
(a) Time-lapse differential interference contrast images of individual microtubules disassembling in the presence of 1 or 12 mM magnesium. Arrowheads (red) indicate locations of disassembling tips. (b) Mean disassembly speed plotted against magnesium concentration. Error bars represent 95% confidence intervals, defined as ± (t∙SEM), where t is drawn from Student’s t-distribution (with ν=N – 1 degrees of freedom and N=34–51 samples per mean). (c) Records of force (black) and bead position (red) versus time for four bead-microtubule pairs, at two different magnesium concentrations. Pulse amplitudes were larger at the higher magnesium level. (d) Mean pulse amplitudes across four different magnesium concentrations, 1, 6, 12, and 20 mM. Error bars represent 95% confidence intervals (defined as in (b), with ν=N – 1 degrees of freedom and N=25–40 samples per mean). Data in (c) and (d) were collected at 2 pN trap force.
-
Figure 2—source data 1
Individual pulse amplitudes and disassembly speeds measured using bovine microtubules across different magnesium levels.
These source data are provided in an excel spreadsheet.
- https://cdn.elifesciences.org/articles/83225/elife-83225-fig2-data1-v1.xlsx
Figure 3 with 2 supplements
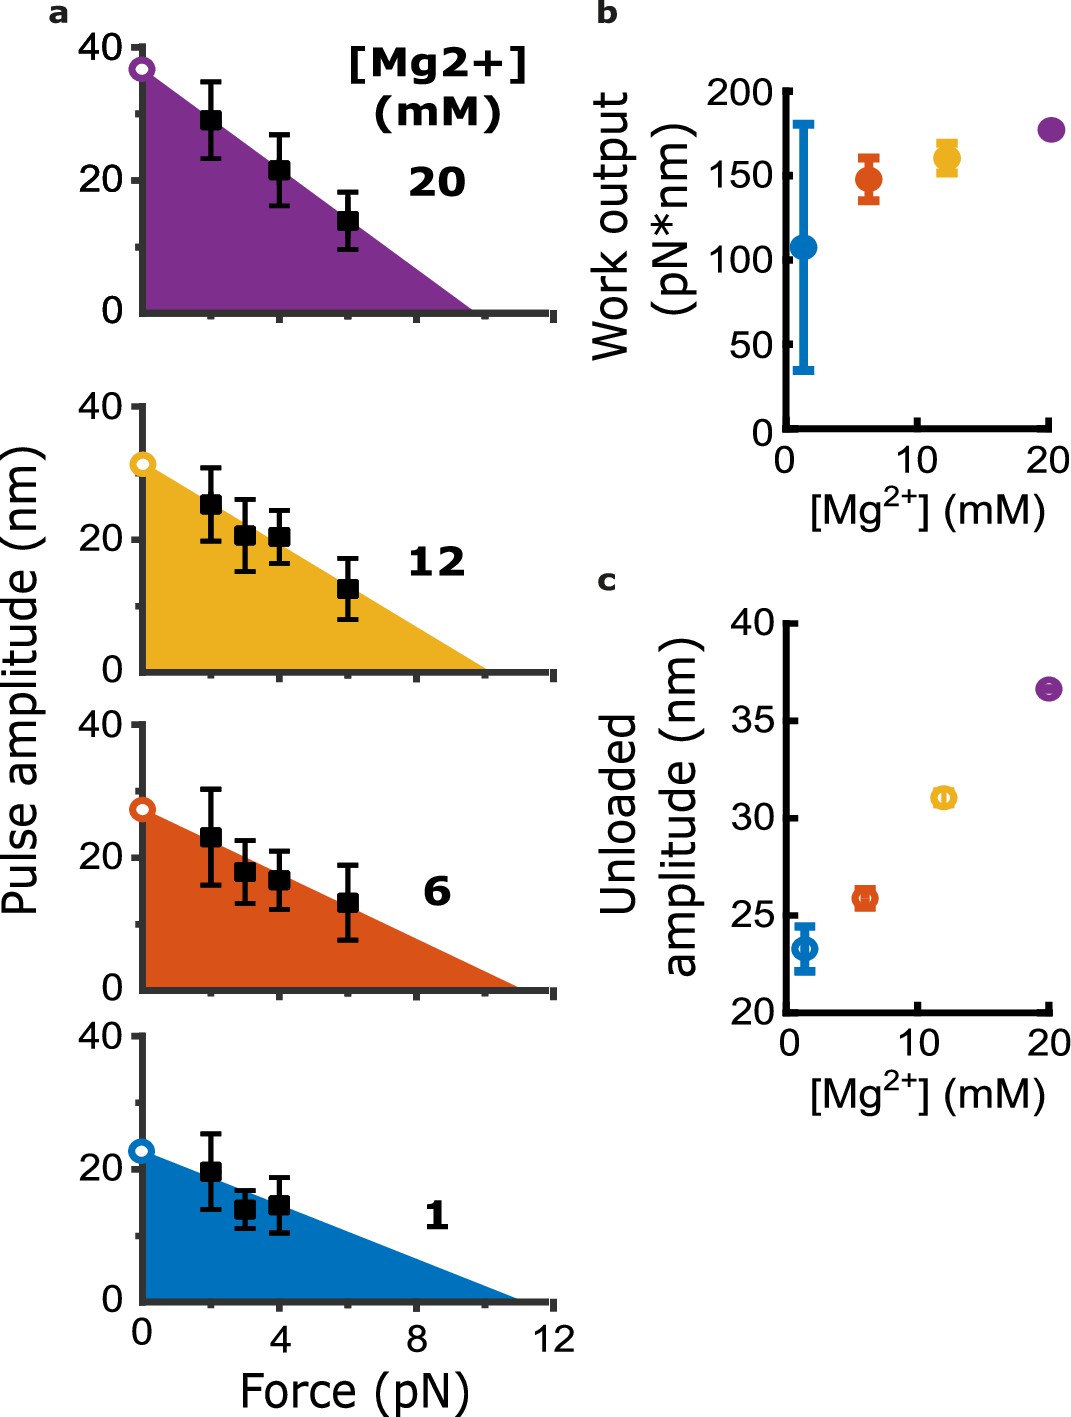
Magnesium increases the mechanical work output harnessed from curling protofilaments.
(a) Mean pulse amplitudes (black squares) plotted against trapping force at the four indicated magnesium concentrations. Error bars represent 95% confidence intervals, defined as ± (t∙SEM), where t is drawn from Student’s t-distribution (with ν=N – 1 degrees of freedom and N=9–43 samples per mean). The capacity of protofilament curls to perform mechanical work in the assay was estimated at each magnesium concentration by fitting the amplitude versus force data with a line and then calculating the area under the line (colored triangular areas). To estimate unloaded pulse amplitudes, the line-fits were extrapolated to the y-intercept (open circles). (b) Mechanical work output, based on the colored areas shown in (a), plotted against magnesium concentration. Error bars represent 95% confidence intervals (estimated from the best-fit parameters, as explained in Materials and methods). (c) Unloaded amplitudes, based on extrapolation of the line-fits in (a), plotted versus magnesium concentration. Error bars represent 95% confidence intervals (estimated as explained in Materials and methods).
-
Figure 3—source data 1
Individual pulse amplitudes measured using bovine microtubules across different trapping forces and magnesium levels.
These source data are provided in an excel spreadsheet.
- https://cdn.elifesciences.org/articles/83225/elife-83225-fig3-data1-v1.xlsx
Figure 3—figure supplement 1

Cumulative distributions of pulse amplitude measured with bovine tubulin at different trapping forces and magnesium levels.
(a) Cumulative distributions of pulse amplitude grouped together according to the trapping forces at which they were measured. Magnesium concentrations are denoted by color as indicated. (b) Cumulative distributions of pulse amplitude grouped together according to the magnesium concentrations at which they were measured. Trapping forces are denoted by color as indicated.
Figure 3—figure supplement 2

Statistical comparisons of estimated work outputs across different magnesium concentrations.
The table provides p-values for all possible comparisons of the work outputs estimated at 1, 6, 12, and 20 mM magnesium (i.e. the four work outputs plotted in Figure 3b), calculated based on Student’s t-distribution.
Figure 4 with 5 supplements
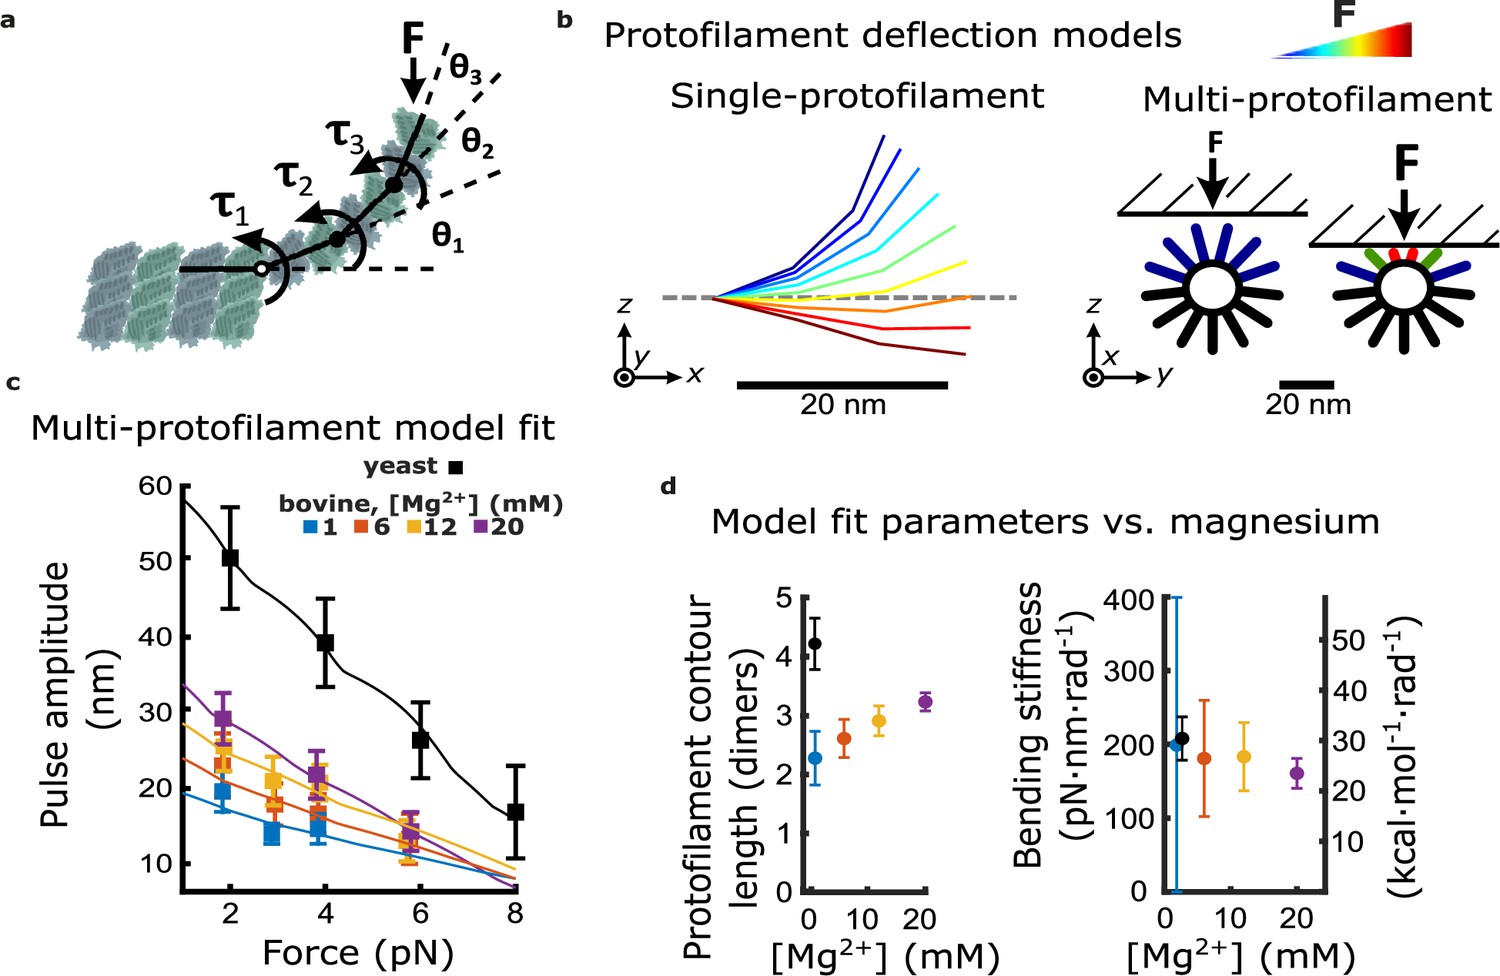
Magnesium- and species-dependent increases in work output can be explained solely by a lengthening of protofilament curls.
(a) Model for bending of a single protofilament. Tubulin dimers are represented as rigid rods linked by Hookean torsion springs with relaxed angles of 23°. An external force, F, perpendicular to the microtubule long-axis, is applied at the protofilament tip. The balance between F and the torsion at each bending node, τn, is used to calculate the contour shape of the protofilament (i.e. the angles θn). (b) Calculated shapes for a single protofilament at different levels of external force (indicated by the color legend). Model for deflection of multiple protofilaments at a microtubule tip, seen end-on. Single protofilaments, modeled as in (a), are arranged radially according to the geometry of a 13-protofilament microtubule. The bead is modeled as a flat rigid surface, pushed downward onto the protofilaments to predict a force-deflection relationship. Cartoon at right shows distribution of protofilament deflections for an arbitrary bead height. (c) Amplitude versus force curves predicted by the multi-protofilament model, after fitting to measured pulse data (symbols) at indicated magnesium concentrations. Bovine data are recopied from Figure 3a. Yeast data combine new measurements with data previously published in Driver et al., 2017. (d) Two fitted parameters, the mean contour length and bending stiffness (flexural rigidity) of protofilament curls, plotted versus magnesium concentration. The fitted contour length increases with added magnesium and is larger for yeast microtubules, while the apparent flexural rigidity remains unchanged.
-
Figure 4—source data 1
Individual pulse amplitudes measured using yeast and bovine microtubules across different trapping forces and magnesium levels.
These source data are provided in an excel spreadsheet.
- https://cdn.elifesciences.org/articles/83225/elife-83225-fig4-data1-v1.xlsx
-
Figure 4—source data 2
Table of estimates of protofilament curvature reported in the literature.
Each row is colored to reflect the method used to estimate protofilament curvature.
- https://cdn.elifesciences.org/articles/83225/elife-83225-fig4-data2-v1.docx
Figure 4—figure supplement 1
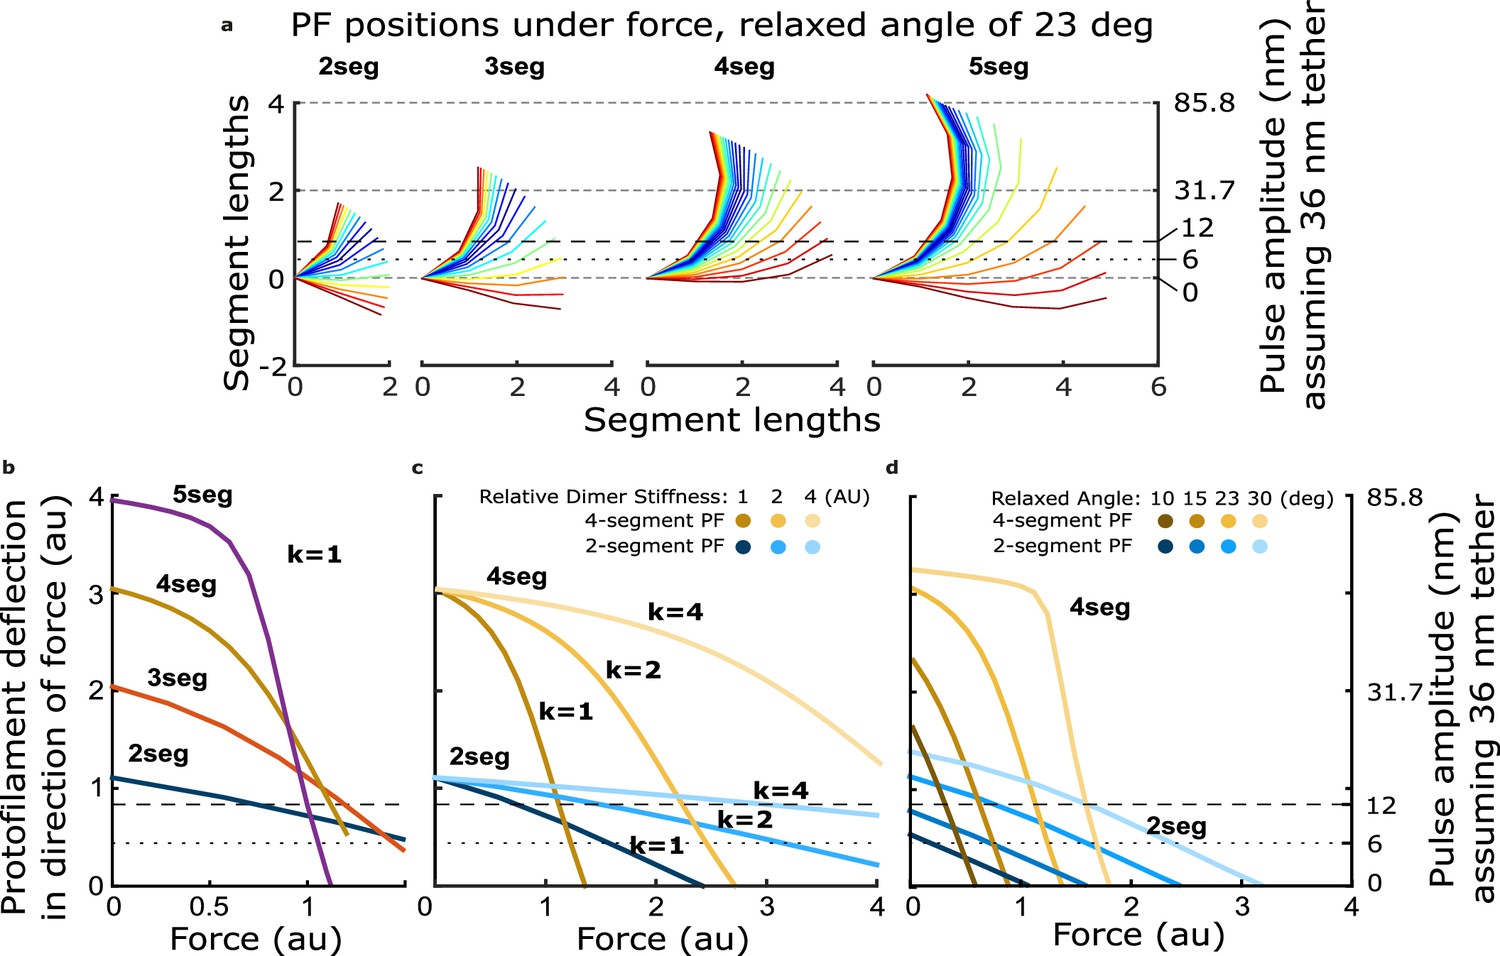
How force-deflection behavior of the single protofilament model changes with variation in the number of segments (dimers), the intrinsic bending stiffness, and the relaxed angle per tubulin dimer.
(a) Model solutions for protofilament contour lengths of 2–5 segments, under a range of forces. Color indicates magnitude of force. (b) Deflection of the protofilament tip as a function of force for protofilaments of 2–5 segments. (c) Deflection of the tip for protofilaments 2 and 4 segments in length, with the stiffness per dimer varied twofold and fourfold above that used in Figure 4. (d) Deflection of the tip for protofilaments 2 and 4 segments in length, with the relaxed dimer angle varied across 10, 15, 23, and 30°.
Figure 4—figure supplement 2

Estimates of protofilament curvature from micrographs of disassembling microtubule tips presented in Mandelkow et al., 1991.
(a) Cropped two-dimensional cryo-electron microscopy micrographs from Mandelkow et al., 1991, showing curling protofilaments used to estimate curvature for various levels of magnesium. (b) Plot relating quantifications of curvatures from images shown in (a), estimated by measuring the diameter of the curl. Curvature per dimer is plotted for two different magnesium concentrations.
Figure 4—figure supplement 3
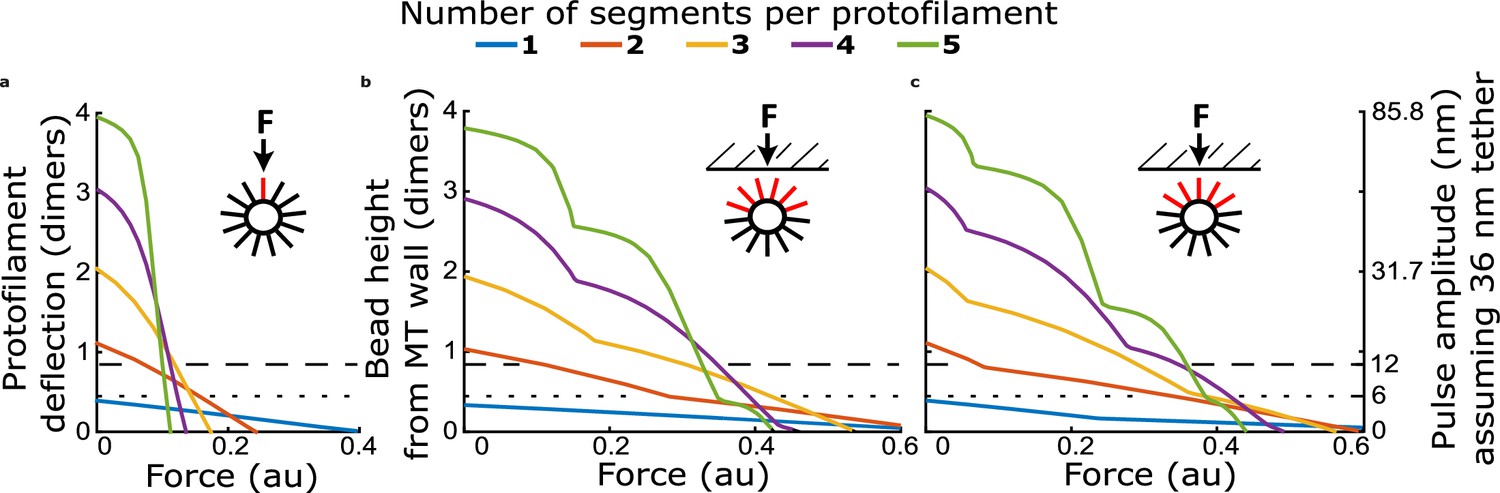
Comparison of force-deflection relationship for a single protofilament, and multiple protofilaments arranged to reflect geometry at a microtubule tip.
(a) Protofilament tip deflection versus force for a single protofilament, with 1–5 segments. (b) Bead height versus force for a multi-protofilament model with protofilaments arranged in a 13-protofilament configuration, oriented such that two protofilaments initially contact the bead simultaneously. (c) Bead height versus force for a multi-protofilament model with the same arrangement of protofilaments as in (b) but rotated such that a single protofilament establishes bead contact first.
Figure 4—figure supplement 4

Comparison of disassembly speeds for bovine versus yeast microtubules.
Yeast tubulin disassembles fourfold faster than bovine tubulin in the presence of 1 mM magnesium. Points are means. Error bars represent 95% confidence interval for the mean (based on Student’s t-distribution).
Figure 4—figure supplement 5

Statistical comparisons of estimated contour lengths and bending stiffnesses across different magnesium concentrations.
(a) Table of p-values for all possible comparisons of protofilament curl contour lengths estimated for bovine microtubules at 1, 6, 12, and 20 mM magnesium and for yeast microtubules at 1 mM magnesium (i.e. the five contour lengths plotted in the left graph of Figure 4d). (b) Table of p-values for all possible comparisons of protofilament bending stiffness estimated for bovine microtubules at 1, 6, 12, and 20 mM magnesium and for yeast microtubules at 1 mM magnesium (i.e. the five bending stiffnesses plotted in the right graph of Figure 4d). All p-values were calculated based on Student’s t-distribution.
Figure 5
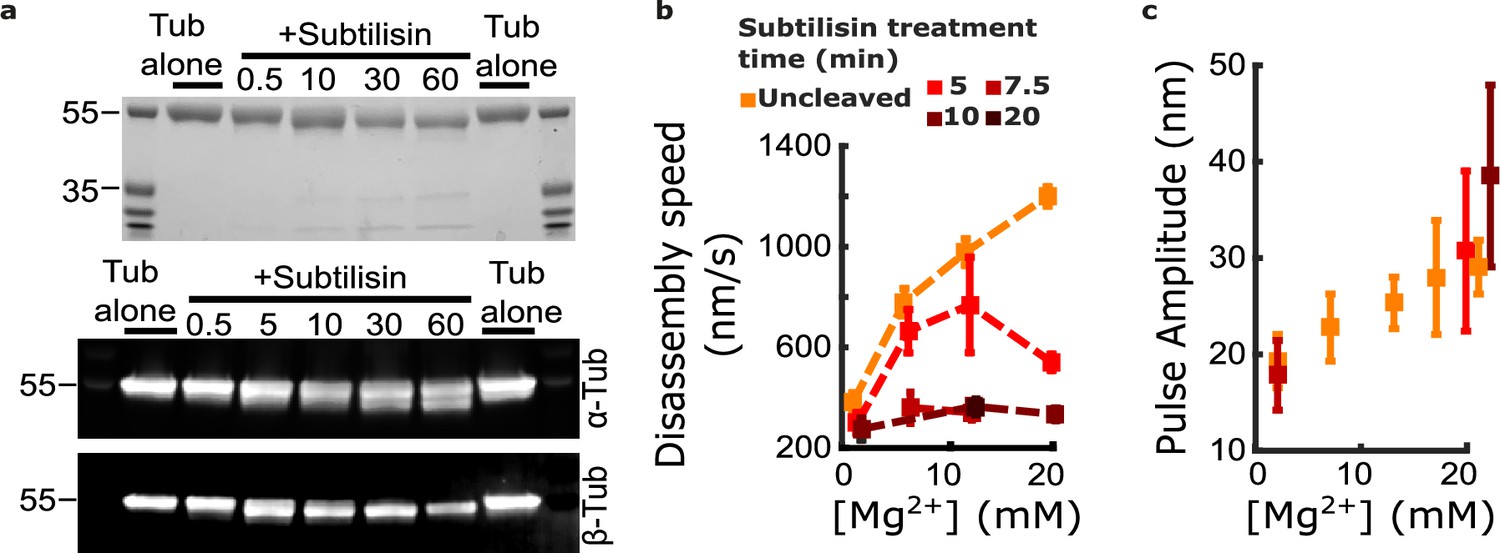
Removing the β-tubulin C-terminal tail suppresses magnesium’s acceleration of disassembly speed but not its enhancement of pulse amplitude.
(a) Proteolytic products of tubulin treated with subtilisin for the indicated times (in minutes), before quenching with 1 mM phenylmethylsulfonyl fluoride, visualized by Coomassie staining (top image) or Western blotting (bottom image). αTub DM1A:FITC mouse conjugate 1:1000 and βTub CST 9F3 rabbit 1:1000 were used for primary antibody staining. (b) Mean disassembly speeds, measured after treatment of tubulin with subtilisin for the indicated durations and plotted versus magnesium concentration. The large magnesium-dependent acceleration of disassembly seen with untreated tubulin (orange symbols) was suppressed after 10–20 min subtilisin treatment (dark red symbols). Error bars represent 95% confidence intervals, defined as ± (t∙SEM), where t is drawn from Student’s t-distribution (with ν=N – 1 degrees of freedom and N=5–51 samples per mean). Data for untreated tubulin are recopied from Figure 2b. (c) Pulse amplitudes, measured in the wave assay at 2 pN trapping force after treatment of tubulin with subtilisin, plotted versus magnesium concentration. Symbol colors indicate subtilisin treatment times according to the legend of (a). Treatment with subtilisin did not suppress the effect of magnesium on pulse amplitude. Error bars represent 95% confidence intervals, defined as ± (t∙SEM), where t is drawn from Student’s t-distribution (with ν=N – 1 degrees of freedom and N=28–44 samples per mean).
-
Figure 5—source data 1
Uncropped image of Coomassie-stained gel showing subtilisin-treated bovine tubulin.
This image is provided as a JPG file with relevant lanes labeled.
- https://cdn.elifesciences.org/articles/83225/elife-83225-fig5-data1-v1.zip
-
Figure 5—source data 2
Uncropped image of anti-alpha-tubulin Western blot of subtilisin-treated bovine tubulin.
This image is provided as a JPG file with relevant lanes labeled.
- https://cdn.elifesciences.org/articles/83225/elife-83225-fig5-data2-v1.zip
-
Figure 5—source data 3
Uncropped image of anti-beta-tubulin Western blot of subtilisin-treated bovine tubulin.
This image is provided as a JPG file with relevant lanes labeled.
- https://cdn.elifesciences.org/articles/83225/elife-83225-fig5-data3-v1.zip
-
Figure 5—source data 4
Individual pulse amplitudes and disassembly speeds measured using microtubules assembled with subtilisin-treated bovine tubulin.
These source data are provided in an excel spreadsheet.
- https://cdn.elifesciences.org/articles/83225/elife-83225-fig5-data4-v1.xlsx
-
Figure 5—source data 5
Full raw unedited image of Coomassie-stained gel showing subtilisin-treated bovine tubulin.
This full raw unedited image is provided as a PNG file.
- https://cdn.elifesciences.org/articles/83225/elife-83225-fig5-data5-v1.zip
-
Figure 5—source data 6
Full raw unedited image of anti-alpha-tubulin Western blot of subtilisin-treated bovine tubulin.
This full raw unedited image is provided as a TIF file.
- https://cdn.elifesciences.org/articles/83225/elife-83225-fig5-data6-v1.zip
-
Figure 5—source data 7
Full raw unedited image of anti-alpha-tubulin Western blot of subtilisin-treated bovine tubulin.
This full raw unedited image is provided as a TIF file.
- https://cdn.elifesciences.org/articles/83225/elife-83225-fig5-data7-v1.zip
Tables
Key resources table
| Reagent type (species) or resource | Designation | Source or reference | Identifiers | Additional information |
|---|---|---|---|---|
| Antibody | Biotinylated anti-penta-His mouse monoclonal IgG1 | R&D Systems Inc. clone # AD1.1.10 | BAM050 - His Tag Biotinylated Antibody | Used for preparing anti-His beads as described under Bead and slide preparation for wave assay, below. |
| Other | Streptavidin coated polystyrene particles, 0.44 µm in diameter | Spherotech Inc. | SVP-05–010 | Used for preparing anti-His beads as described under Bead and slide preparation for wave assay, below. |
| Other | Biotinylated porcine brain tubulin | Cytoskeleton Inc. | T333 - Tubulin Protein (Biotin): Porcine Brain | Used for preparing coverslip-anchored microtubule seeds as described under Bead and slide preparation for wave assay, below. |
| Peptide, recombinant protein | Avidin | Vector Laboratories | A-3100–1 | Used for preparing coverslip-anchored microtubule seeds as described under Bead and slide preparation for wave assay, below. |
| Other | Biotinylated bovine serum albumin | Vector Laboratories | B-2007–10 | Used for preparing coverslip-anchored microtubule seeds as described under Bead and slide preparation for wave assay, below. |
| Chemical compound, drug | Odyssey Blocking Buffer | LI-COR Biosciences | 927–40000 | Used as described under Western blotting, below. |
| Other | Subtilisin protease | Sigma-Aldrich | P5380 - Proteinase from Bacillus licheniformis, Subtilisin A | Used to cleave C-terminal tubulin tails as described under Digestion of tubulin with subtilisin, below. |
| Antibody | Anti-β-tubulin rabbit monoclonal | Cell Signaling Technology | Anti-β-tubulin (9F3) Rabbit mAb #2128 | Used at 1:1000 as described under Western blotting, below. (1:1000) |
| Antibody | Anti-α-tubulin mouse monoclonal | Sigma-Aldrich clone DM1A | F2168 - Anti-α-tubulin-FITC Mouse mAb | Used at 1:1000 as described under Western blotting, below. (1:1000) |
| Antibody | Goat anti-rabbit polyclonal | LI-COR Biosciences | 926–32211 IRDye 800CW secondary | Used at 1:5000 as described under Western blotting, below. (1:5000) |
| Antibody | Goat anti-mouse polyclonal | LI-COR Biosciences | 926–68070 IRDye 800CW secondary | Used at 1:5000 as described under Western blotting, below. (1:5000) |
Additional files
Download links
A two-part list of links to download the article, or parts of the article, in various formats.
Downloads (link to download the article as PDF)
Open citations (links to open the citations from this article in various online reference manager services)
Cite this article (links to download the citations from this article in formats compatible with various reference manager tools)
Working strokes produced by curling protofilaments at disassembling microtubule tips can be biochemically tuned and vary with species
eLife 11:e83225.
https://doi.org/10.7554/eLife.83225


