Conservation of oocyte development in germline cysts from Drosophila to mouse
- Carnegie Institution for Science/Howard Hughes Medical Institute, United States
Figures
Figure 1
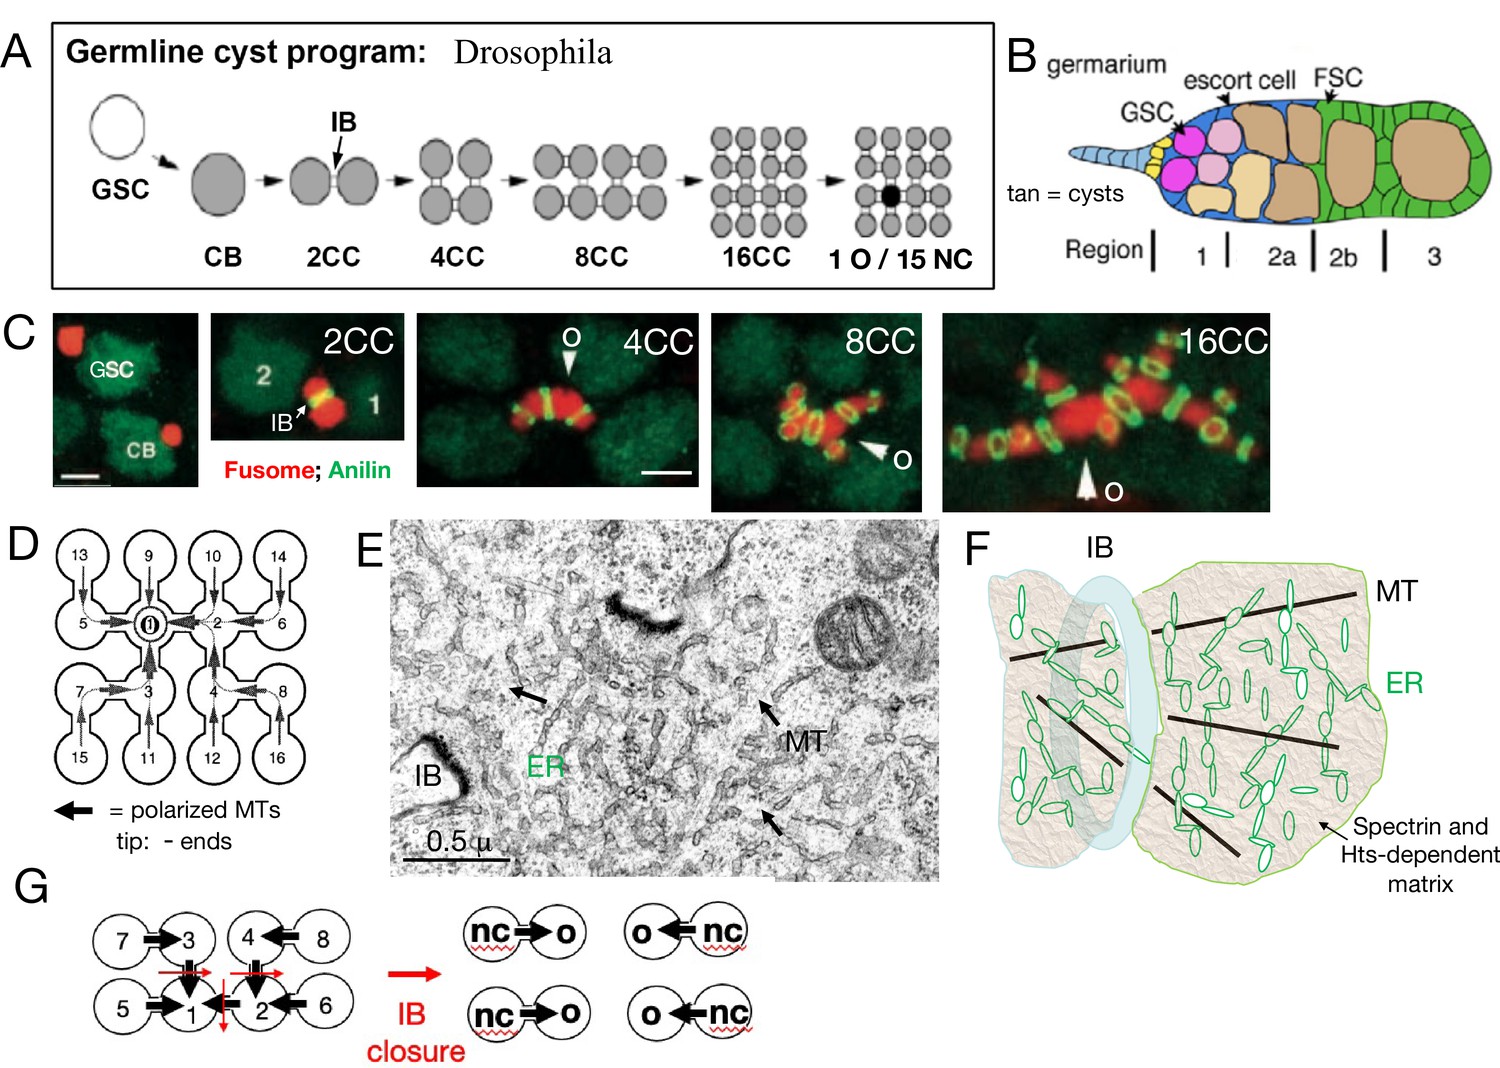
Drosophila germline cysts.
(A) The germline cyst formation program. A germline stem cell (GSC) divides asymmetrically to generate a cystoblast (CB). The CB divides with incomplete cytokinesis to generate a two-cell cyst (2CC) with an intercellular bridge (IB). Three more cycles of rapid, synchronous, incomplete cyst divisions follow to generate 4CC, 8CC, and 16CC. One cell (dark) differentiates into an oocyte (O) while the other cells (gray) become nurse cells (NCs). (B) Germarium. A simplified Drosophila germarium is depicted showing regions 1, 2a, 2b, and 3. Shown are: GSCs (purple), forming cysts (pink), and 16CC cysts (tan). The somatic squamous escort cells (blue) surround all cysts in region 1 and 2a, while the follicle cells (green) generated by two follicle stem cells (FSC) displace escort cells and surround region 2b and later cysts. Follicle formation is completed in region 3. (C). Fusome asymmetry. The cyst fusome (red) spans cyst cells divided by IBs (green rings). Fusome asymmetry is evident after each division, with the first cell, "1" or arrowhead, destined to become the O, retaining the largest amount (de Cuevas and Spradling, 1998). (D) A 16CC cyst with arrows indicating the microtubule (MT) polarity (arrowhead tip = minus ends) derived from cyst divisions (cell numbers indicate production order). (E) Electron micrograph (EM) of the fusome near an IB. Arrows indicate MTs; ER-like vesicles are evident. (F) Fusome model showing an IB (blue), MTs (black), ER vesicles (green), and the alpha-spectrin and Hts-protein dependent matrix (tan). (G) The diagram shows how an 8CC with the indicated polarity can undergo fragmentation by closing (red arrows) IBs to yield four 2CC each producing one NC and O. Scale bars in C are 3μ (same for panels 1-2; or 3–5).
Figure 2

Mouse germline cysts.
(A) A model of mouse primordial oocyte production from one initial 32cell cyst spaning the indicated ages (days, E=embryonic, and P=postnatal). Successive cohorts of unactivated nurse cells (green) beginning with outer cells, become activated (orange), begin to transfer cytoplasm and organelles causing them to shrink, and then turn over by PCD which occurs adjacent to the cyst and is not shown. From activation to Programmed cell death (PCD) requires about two days. (B) Immunostained image of a single E18.5 cyst (dashed yellow lines) showing DDX4 (germ cell marker, blue), ATP5a (mitochondrial marker, red), and Nobox protein (green). The oocyte (larger size and, mitochondria content), but not nurse cells, expresses Nobox (from Niu and Spradling, 2022). (C). Graph of mouse perinatal germ cell identity comprising nurse cells (unactivated, light green; activated, orange) and pro-oocytes (blue) as a function of developmental time. (D) Time course of mouse germ cell numbers per ovary vs time showing three phases. (1) sharp increase as primordial germ cells enter cyst formation; (2) sharp decrease due to cyst breakdown and programmed nurse cell death; and (3) very slow decline due to ovulation or atresia from the ovarian reserve (data from Lei and Spradling, 2013b; Lei and Spradling, 2013a).
Figure 3

Mouse Balbiani body formation in a germline cyst from transferred nurse cell organelles.
(A) Generic animal oocyte showing the nucleus (n), Balbiani body (Bb, red dashed border), mitochondria (m), and the cytocentrum (cc), consisting of centrioles surrounded by Golgi elements. Modified from Figure 149, Wilson, 1925. (B) Original drawing depicting a human primordial follicle showing the same structures as in (A) (see Hertig, 1968; Raven, 1961; van der Stricht, 1923). Magnification ×3000. (C) EM micrograph of a mouse P4 primordial follicle and Balbiani body showing prominent cytocentrum (cc). The mitochondria in mouse Bbs are less tightly clustered than in human Bbs. (D–E) The process of cytocentrum formation from transferred nurse cell centrosomes. (D) Diagram of an E18.5 oocyte showing four accumulated centrosomes transferred from nurse cells, each accompanied by a Golgi element. MT = microtubules. (E) The steps of cytocentrum formation. At E18.5, four centrosomes and accompanying Golgi are seen; at P1, centrosomes and Golgi have begun to coalesce; by P4, an finished cytocentrum (cc) has formed. Golgi (GM130, red) and Pericentrin (green). (F) EM of a P4 mouse cytocentrum. Scale bar = 2μ. (G) Immunofluoresence image of mouse P8 primordial follicle stained for alpha-tubulin (white), showing the massive microtubule aster nucleated by the cytocentrum (cc) that organizes the Balbiani body. n=oocyte nucleus; cc = cytocentrum. (H) Model of process depicted in D–G showing the switch from microtubule (MT) (green) nucleation by centrioles (c) to nucleation from the cytocentrum (cc) generated by centrosome coalescence and processing to yield an active Golgi-based non-centriolar MTOC (ncMTOC). (D, E, and G) are from Niu and Spradling, 2022.
© 1925, Macmillan Co. Panel A modified from Figure 149, Wilson, 1925. Reproduction is not covered by the eLife CC BY 4.0 license, but the original figure can be copied under a CC BY NC 4.0 license
Tables
Table 1
Oocyte and nurse cell (NC) gene expression.
| Gene | Avg E14.5 | E14.5 NC | E14.5 NC/Avg | Avg 16.5 | E16.5 NC | E16.5 NC/Avg | Avg 18.5 | E18.5 NC | E18.5 NC/Avg | P1 O | P1 NC | P1 NC/P1 O | P5 O |
|---|---|---|---|---|---|---|---|---|---|---|---|---|---|
| Oocyte | |||||||||||||
| Figla | 30.60 | 10.30 | 0.34 | 47.19 | 45.56 | 0.97 | 147.10 | 132.35 | 0.90 | 204.59 | 94.24 | 0.46 | 63.14 |
| Nobox | 0.21 | 0.00 | 0.00 | 3.42 | 5.03 | 1.47 | 32.27 | 26.75 | 0.83 | 74.70 | 24.97 | 0.33 | 31.92 |
| Padi6 | 0.21 | 0.00 | 0.00 | 0.00 | 0.00 | nd | 0.45 | 0.00 | 0.00 | 31.76 | 4.87 | 0.15 | 69.97 |
| Filia/Khdc3 | 0.76 | 0.00 | 0.00 | 0.22 | 0.00 | 0.00 | 0.97 | 0.00 | 0.00 | 2.50 | 0.00 | 0.00 | 16.14 |
| Floped/Ooep | 11.64 | 8.32 | 0.71 | 3.22 | 0.00 | 0.00 | 16.40 | 12.11 | 0.74 | 57.59 | 25.07 | 0.44 | 80.86 |
| Nlrp5/MATER | 0.31 | 0.00 | 0.00 | 0.41 | 2.61 | 6.37 | 1.69 | 3.46 | 2.05 | 31.72 | 17.71 | 0.56 | 30.17 |
| Tle6 | 5.16 | 4.26 | 0.83 | 6.27 | 0.00 | 0.00 | 28.24 | 18.47 | 0.65 | 75.58 | 32.94 | 0.44 | 59.98 |
| E14.5 NC | |||||||||||||
| Fst | 4.75 | 19.05 | 4.01 | 2.16 | 2.13 | 0.99 | 8.00 | 4.31 | 0.54 | 1.90 | 3.89 | 2.05 | 1.52 |
| Tex14 | 79.30 | 24.30 | 0.31 | 58.70 | 15.20 | 0.26 | 34.10 | 18.70 | 0.55 | 26.00 | 3.10 | 0.12 | 9.44 |
| Pard6b | 3.34 | 10.51 | 3.15 | 4.15 | 0.00 | 0.00 | 4.22 | 0.89 | 0.21 | 9.72 | 0.33 | 0.03 | 1.81 |
| Casp8 | 0.46 | 3.81 | 8.29 | 1.82 | 4.85 | 2.67 | 0.36 | 0.73 | 2.00 | 0.32 | 0.00 | 0.00 | 0.62 |
| Wt1 | 4.04 | 12.60 | 3.12 | 3.74 | 4.05 | 1.08 | 6.58 | 10.79 | 1.64 | 5.18 | 3.01 | 0.58 | 2.42 |
| Meis2 | 2.05 | 6.67 | 3.24 | 2.39 | 6.24 | 2.61 | 1.95 | 1.72 | 0.88 | 3.86 | 1.14 | 0.30 | 1.84 |
| Kitl | 3.49 | 14.92 | 4.27 | 6.17 | 13.98 | 2.26 | 10.05 | 5.95 | 0.59 | 5.03 | 0.00 | 0.00 | 0.09 |
| Calb1 | 0.51 | 4.69 | 9.17 | 1.38 | 3.60 | 2.60 | 0.53 | 2.31 | 4.34 | 0.38 | 0.00 | 0.00 | 0.30 |
| E16.5 NC | |||||||||||||
| Fstl1 | 6.51 | 7.71 | 1.18 | 4.00 | 12.00 | 3.00 | 3.77 | 2.07 | 0.55 | 4.69 | 3.20 | 0.00 | 1.71 |
| Cdkn1b | 4.08 | 11.85 | 2.92 | 5.96 | 13.47 | 2.26 | 2.70 | 0.00 | 0.00 | 1.94 | 0.00 | 0.00 | 7.91 |
| Stmn3 | 0.60 | 4.05 | 6.74 | 0.20 | 1.66 | 8.30 | 0.15 | 1.30 | 8.87 | 0.00 | 0.00 | nd | 0.00 |
| Jmjd8 | 1.34 | 4.84 | 3.62 | 0.81 | 2.61 | 3.23 | 3.20 | 3.46 | 1.08 | 2.61 | 1.38 | 0.53 | 1.60 |
| Igfbp5 | 3.62 | 17.54 | 4.84 | 13.83 | 35.70 | 2.58 | 10.23 | 2.86 | 0.28 | 5.83 | 1.18 | 0.20 | 4.23 |
| E18.5 NC | |||||||||||||
| Rspo1 | 2.28 | 2.13 | 0.94 | 0.49 | 2.61 | 5.29 | 1.16 | 2.65 | 2.28 | 2.56 | 1.34 | 0.45 | 0.13 |
| Serpinb6b | 0.51 | 2.25 | 4.41 | 0.57 | 1.04 | 1.82 | 0.60 | 2.18 | 3.64 | 0.55 | 0.00 | 0.00 | 0.41 |
| P1 NC | |||||||||||||
| Cgn | 3.80 | 6.17 | 1.62 | 1.59 | 2.75 | 1.73 | 2.01 | 0.00 | 0.00 | 0.99 | 3.10 | 3.13 | 1.98 |
| Tmod1 | 0.74 | 7.32 | 9.87 | 2.67 | 0.00 | 0.00 | 1.30 | 0.00 | 0.00 | 0.66 | 1.97 | 2.99 | 0.14 |
| Abhd2 | 5.13 | 9.23 | 1.80 | 1.06 | 2.23 | 2.11 | 1.72 | 0.72 | 0.42 | 0.18 | 2.37 | 12.76 | 0.58 |
| Dusp3 | 0.13 | 3.28 | 24.37 | 0.33 | 1.64 | 4.90 | 0.71 | 0.00 | 0.00 | 0.60 | 2.29 | 3.79 | 1.04 |
-
Legend. Mouse ovary gene expression of the indicated genes at the indicate times in mixed cells (unactivated NC and oocytes, indicated by ‘Avg’), activated NCs or oocytes (O) were determined by single-cell RNA sequencing (scRNAseq; data from Niu and Spradling, 2022). Genes are grouped into those thought to function in oocytes (top section) and in lower sections, those thought to function in nurse cells peaking at the indicated times (i.e. E14.5 NC). Possible function of genes in bold are discussed in the text. E14.5=embryonic day 14.5, etc.; P1=postnatal day 1, etc.; ratios (NC/Avg) from the previous two columns are shown in italics. See text for discussion of specific genes. nd = not done.
Download links
A two-part list of links to download the article, or parts of the article, in various formats.
Downloads (link to download the article as PDF)
Open citations (links to open the citations from this article in various online reference manager services)
Cite this article (links to download the citations from this article in formats compatible with various reference manager tools)
Conservation of oocyte development in germline cysts from Drosophila to mouse
eLife 11:e83230.
https://doi.org/10.7554/eLife.83230


