Myosin II regulatory light chain phosphorylation and formin availability modulate cytokinesis upon changes in carbohydrate metabolism
- Yeast Physiology Group. Department of Genetics and Microbiology. Campus de Excelencia Internacional de Ámbito Regional (CEIR) Campus Mare Nostrum, Universidad de Murcia, Spain
- The Francis Crick Institute, United Kingdom
- Instituto de Biología Funcional y Genómica (IBFG), Consejo Superior de Investigaciones Científicas, Universidad de Salamanca, Spain
Figures
Figure 1 with 2 supplements
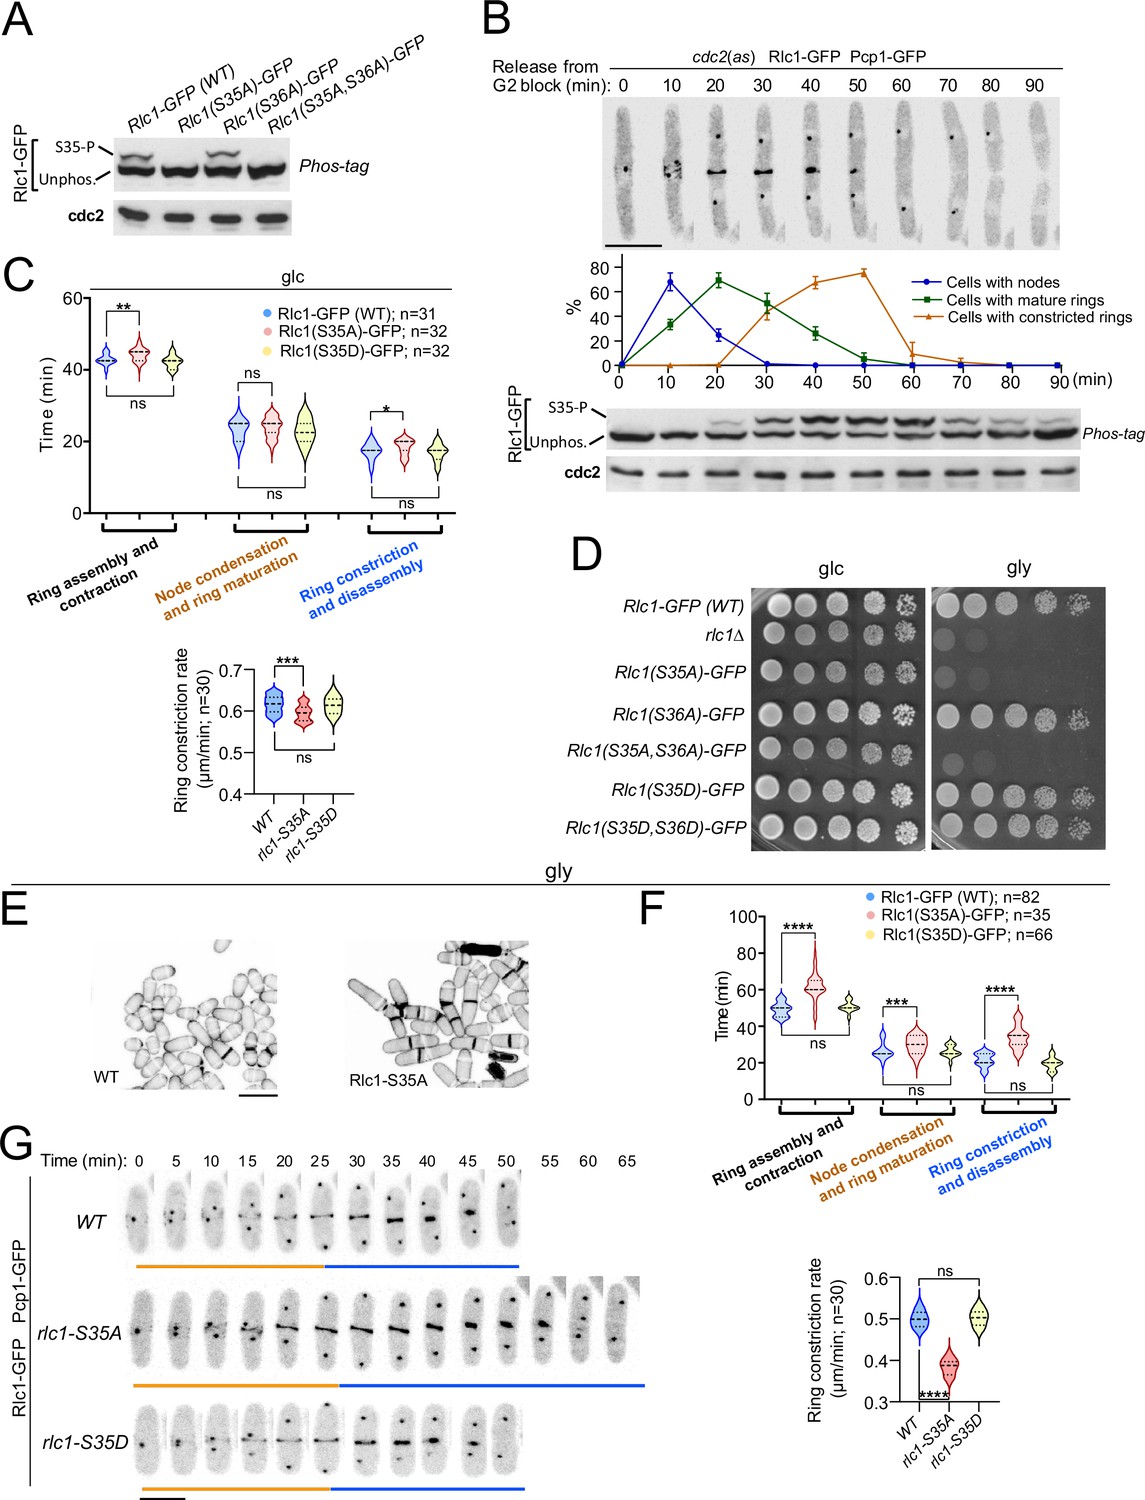
Myosin-II regulatory light chain phosphorylation is essential for S. pombe cytokinesis and growth during respiration.
(A) Total protein extracts from the indicated strains grown exponentially in YES-glucose medium were resolved by Phos-tag SDS-PAGE, and the Rlc1-GFP fusion was detected by incubation with anti-GFP antibody. Anti-Cdc2 was used as a loading control. Rlc1 isoforms, phosphorylated (S35–P), and non-phosphorylated at Ser35 (Unphos), are indicated. The blot corresponds to a representative experiment that was repeated at least three times and the trend of the mobility shift was reproducible. (B) Cells with a cdc2-asM17 analog-sensitive mutant allele expressing a Rlc1-GFP genomic fusion were arrested at G2 in YES-glucose medium supplemented with 3-NM-PP1 and incubated in the same medium without the kinase analog for the indicated times. Upper panels: time-lapse images of a representative cell showing Rlc1-GFP localization and mitotic progression monitored by Pcp1-GFP-labeled SPBs (scale bar: 10 µm). The ratios of cells with nodes, mature rings, and constricted rings over time after release from the G2 arrest (as mean ± SD from three different experiments) are shown. Lower panels: Western blot analysis of Rlc1-GFP mobility by Phos-tag SDS-PAGE after release from the G2 block. The image corresponds to a representative experiment that was repeated at least three times with similar results. (C) Upper: times for ring assembly and contraction, node condensation/ring maturation, and ring constriction and disassembly were estimated for the indicated strains growing exponentially in YES-glucose (glc) medium, by time-lapse confocal fluorescence microscopy. Mitotic progression was monitored using Pcp1-GFP-labeled SPBs. Lower: ring constriction rates (μm/min), were determined for the indicated strains. n is the total number of cells scored from three independent experiments, and data are presented as violin plots. Statistical comparison between the two groups was performed by unpaired Student’s t-test. ***, p<0.005; **, p<0.005; *, p<0.05; ns, not significant. (D) Decimal dilutions of strains of the indicated genotypes were spotted on solid plates with YES-glucose (glc), or YES-glycerol (gly), incubated at 30 °C for 3 (glc) or 5 days (gly), and photographed. The image corresponds to a representative experiment that was repeated at least three times with similar results. (E) Representative maximum projection confocal images of cells grown in YES-glycerol for 12 hr after cell-wall staining with calcofluor white. Scale bar: 10 µm (F) Upper: times for total ring assembly and contraction, node condensation/ring maturation, and ring constriction were estimated cells of the indicated strains grown exponentially in YES-glycerol medium by time-lapse fluorescence confocal microscopy. Lower: ring constriction rates (μm/min), were determined for the indicated strains. n is the total number of cells, and data are presented as violin plots. Statistical comparison between the two groups was performed by unpaired Student’s t-test. ****, p<0.0001; ***, p<0.0005; ns, not significant. (G) Representative maximum-projection time-lapse images of Rlc1 dynamics at the equatorial region of cells growing in YES-glycerol. Mitotic progression was monitored using Pcp1-GFP-labeled SPBs. Time interval is 5 min. Scale bar: 10 µm.
-
Figure 1—source data 1
Source data for Figure 1.
- https://cdn.elifesciences.org/articles/83285/elife-83285-fig1-data1-v2.zip
-
Figure 1—source data 2
Western blot images for Figure 1A and B.
- https://cdn.elifesciences.org/articles/83285/elife-83285-fig1-data2-v2.zip
Figure 1—figure supplement 1
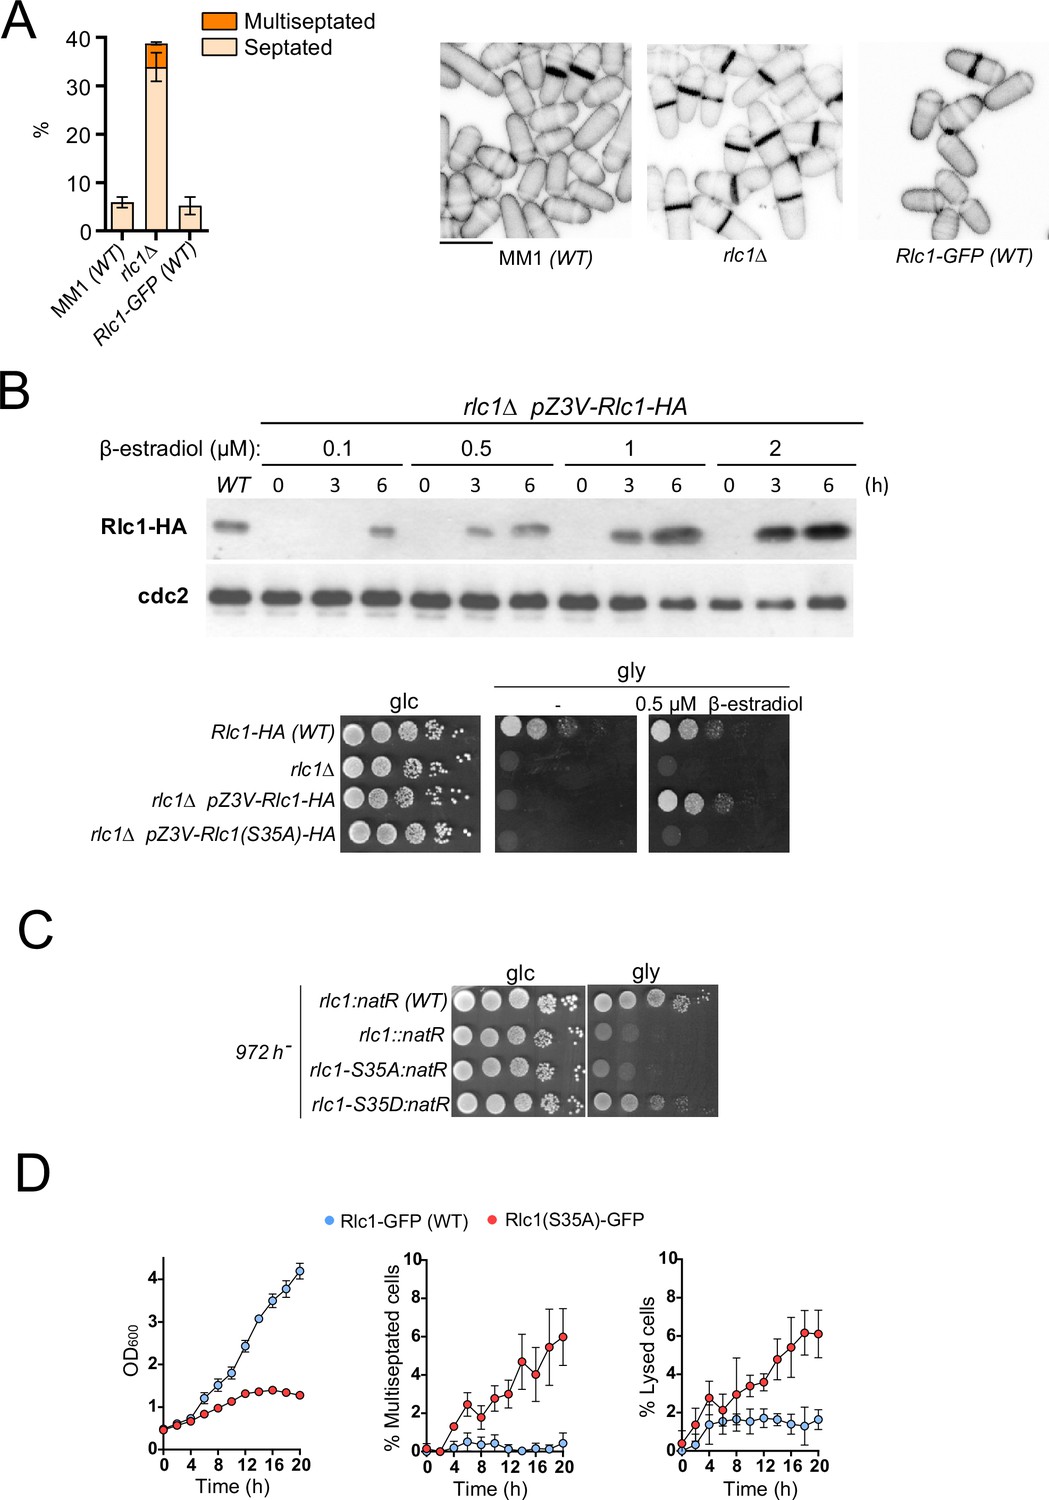
Rlc1 phosphorylation at Ser35 is essential for S. pombe respiratory growth.
(A) Left: Strains of the indicated genotypes were grown in YES-glucose liquid medium for 24 hr, and the percentage of septated and multiseptated cells were quantified. Data correspond to three independent experiments and are presented as mean ± SD. Right: representative maximum projection confocal images of cells from the indicated strains after cell-wall staining with calcofluor white. Scale bar: 10 µm. (B) Upper: the strain rlc1Δ Z3EVpr:Rlc1-HA was grown in YES-glucose medium to mid-log phase, and the culture was then treated with either 0.1, 0.5. 1, or 2 µM β-estradiol for 0, 3, and 6 hr. Total extracts were resolved by SDS-PAGE, and Rlc1 levels were detected by incubation with anti-HA antibody. Anti-Cdc2 was used as a loading control. The Western blot image corresponds to a representative experiment that was repeated at least three times with similar results. Lower: decimal dilutions of strains of the indicated genotypes were spotted on plates with YES-glucose (glc) or YES-glycerol (gly), with or without 0.5 µM β-estradiol, incubated at 30°C for three days, and photographed. (C) Decimal dilutions of strains of the indicated genotypes were spotted on plates with YES-glucose (glc) or YES-glycerol (gly), and photographed. (D) The indicated strains were grown in YES-glucose to a final OD600 = 0.2 and shifted to YES-glycerol and incubated at 28°C. The OD600 value and the percentage of multiseptated and lysed cells were determined at the indicated times. Data correspond to three independent experiments and are presented as mean ± SD.
-
Figure 1—figure supplement 1—source data 1
Source data for Figure 1—figure supplement 1.
- https://cdn.elifesciences.org/articles/83285/elife-83285-fig1-figsupp1-data1-v2.zip
-
Figure 1—figure supplement 1—source data 2
Western blot images for Figure 1B.
- https://cdn.elifesciences.org/articles/83285/elife-83285-fig1-figsupp1-data2-v2.zip
Figure 1—figure supplement 2
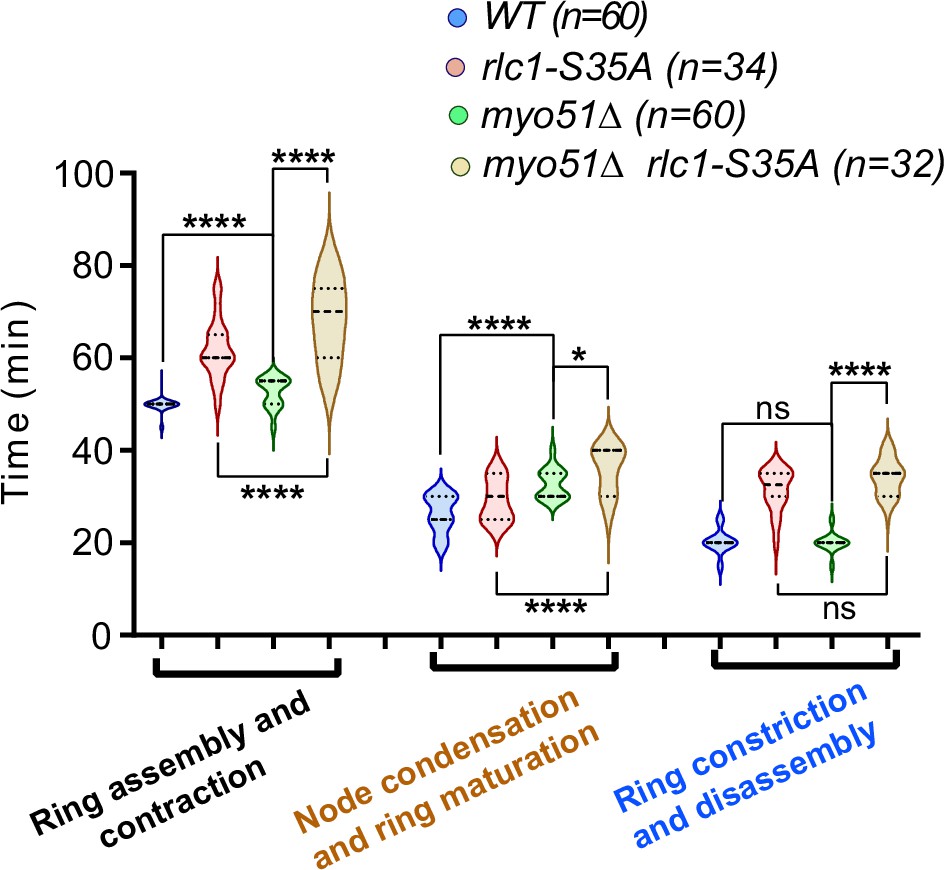
Myo51 and Ser35-phosphorylated Rlc1 collaborate for contractile actomyosin ring (CAR) assembly during respiration.
Times for ring assembly and contraction, node condensation/ring maturation, and ring constriction and disassembly were estimated for the indicated strains growing exponentially in YES-glucose medium (glc), by time-lapse confocal fluorescence microscopy. Mitotic progression was monitored using Pcp1-GFP-labeled SPBs. n is the total number of cells scored from three independent experiments, and data are presented as violin plots. Statistical comparison between the two groups was performed by unpaired Student’s t-test. ****, p<0.0001; *, p<0.05; ns, not significant.
-
Figure 1—figure supplement 2—source data 1
Source data for Figure 1—figure supplement 2.
- https://cdn.elifesciences.org/articles/83285/elife-83285-fig1-figsupp2-data1-v2.zip
Figure 2 with 1 supplement
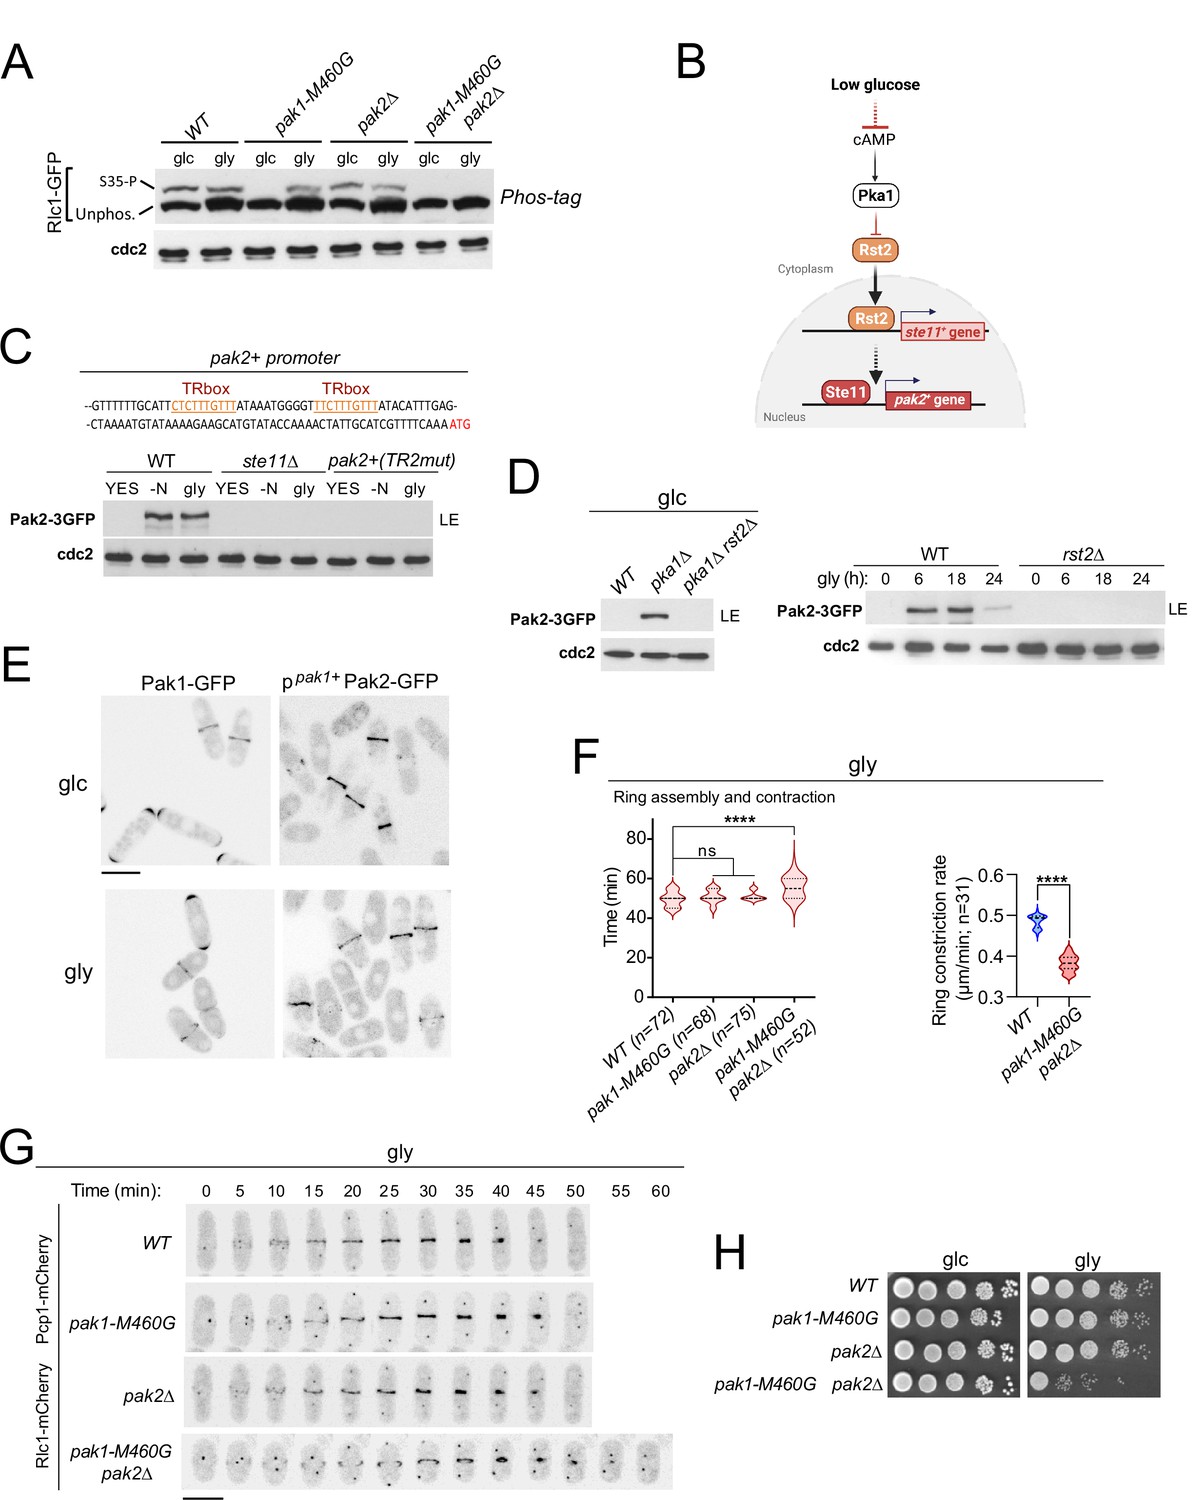
p21/Cdc42-activated kinase Pak2 phosphorylates Rlc1 at Ser35 in concert with Pak1 to positively regulate fission yeast cytokinesis during respiratory growth.
(A) Total protein extracts from strains of the indicated genotypes growing exponentially in YES-glucose (glc) or YES-glycerol (gly), were resolved by Phos-tag SDS-PAGE, and the Rlc1-GFP fusion was detected by incubation with anti-GFP antibody. Anti-Cdc2 was used as a loading control. Rlc1 isoforms, phosphorylated (S35–P) and non-phosphorylated at Ser35 (Unphos), are indicated. The blot corresponds to a representative experiment that was repeated at least three times and the trend of the mobility shift was reproducible. (B) Pak2 expression increases specifically during respiratory growth in an Rst2- and Ste11-dependent manner in the absence of cAMP-PKA signaling. See text for further details. (C) Upper: Partial nucleotide sequence of the promoter region of the pak2+ gene. The two putative Ste11-binding motifs (TR boxes) are shown in color. Lower: Western blot analysis of Pak2-3GFP levels in wild-type, ste11∆, and a mutant strain in which the conserved G in the two putative TR boxes in the pak2+ promoter was replaced by A, grown in YES-glucose, after nitrogen starvation (-N) and in YES-glycerol (gly) for 12 hr. Pak2-3GFP was detected by incubation with anti-GFP antibody, while anti-Cdc2 was used as a loading control. The image corresponds to a representative experiment, which was repeated at least three times with identical results. (D) Left: total protein extracts from strains of the indicated genotypes grown exponentially in YES-glucose (left) or in YES-glycerol for the indicated times (right) were resolved by SDS-PAGE, and the Pak2-3GFP fusion was detected by incubation with anti-GFP antibody. Anti-Cdc2 was used as a loading control. Images are representative of experiments repeated at least three times with identical results. (E) Representative maximum projection confocal images of exponentially growing cells from Pak1-GFP and ppak1+-Pak2-GFP cells in YES-glucose (glc) or YES-glycerol (gly). (F) Total assembly and contraction times (min) and ring constriction rates (μm/min) were estimated by time-lapse confocal fluorescence microscopy for the indicated strains growing exponentially in YES-glycerol (gly) medium. Mitotic progression was monitored using Pcp1-GFP-labeled SPBs. n is the total number of cells scored from three independent experiments, and data are presented as violin plots. Statistical comparison between groups was performed by one-way ANOVA. ****, p<0.0001; ns, not significant. (G) Representative maximum-projection time-lapse images of Rlc1 dynamics at the equatorial region in cells growing with YES-glycerol. Mitotic progression was monitored using Pcp1-GFP-labeled SPBs. The time interval is 5 min. Scale bar: 10 µm. (H) Decimal dilutions of strains of the indicated genotypes were spotted on plates with YES-glucose or YES-glycerol, incubated at 30 °C for four days, and photographed. The image corresponds to a representative experiment that was repeated at least three times with similar results.
-
Figure 2—source data 1
Source data for Figure 2.
- https://cdn.elifesciences.org/articles/83285/elife-83285-fig2-data1-v2.zip
-
Figure 2—source data 2
Western blot images for Figure 2A, C and D.
- https://cdn.elifesciences.org/articles/83285/elife-83285-fig2-data2-v2.zip
Figure 2—figure supplement 1
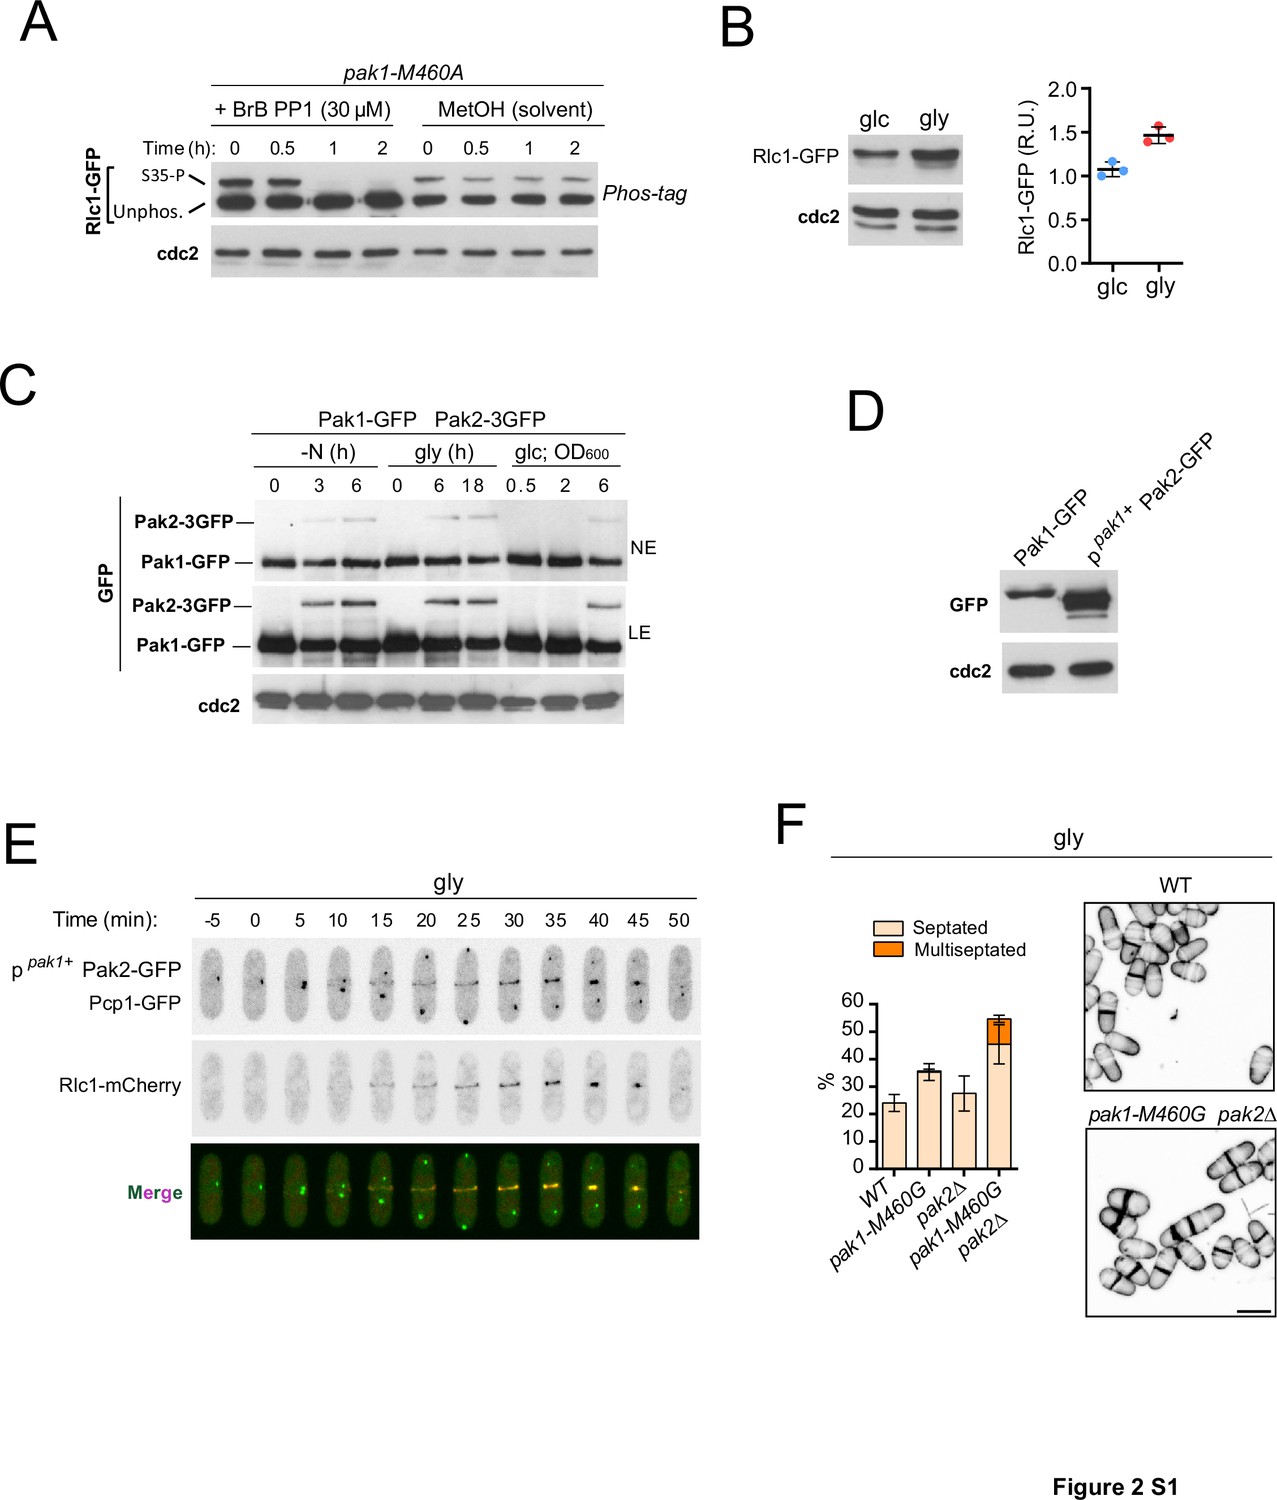
Pak2 regulates cytokinesis during respiration.
(A) Exponentially growing cells of the analog-sensitive strain pak1-M460A growing in YES-glucose were treated with 30 µM of 3-BrB-PP1 for the indicated times, or left untreated in the presence of solvent alone (MetOH). The corresponding protein extracts were resolved by Phos-tag SDS-PAGE, and Rlc1 isoforms were detected by incubation with anti-GFP antibody. Anti-Cdc2 was used as a loading control. S35-P: Rlc1 phosphorylated at Ser35 in vivo. Unphos.: Rlc1 not phosphorylated at Ser35. The blot corresponds to a representative experiment that was repeated at least three times and the trend of the mobility shift was reproducible. (B) Left: the Rlc1-GFP fusion was detected in wild-type cells grown in YES-glucose (glc) or YES-glycerol (gly) by Western blot analysis using anti-GFP antibody. Anti-Cdc2 was used as a loading control. Right: Rlc1 levels are expressed as mean relative units ± SD and correspond to experiments performed as biological triplicates. (C) Glucose-grown cells of a S. pombe strain co-expressing Pak1-GFP and Pak2-3GFP genomic fusions were starved of nitrogen (-N), incubated in YES-glycerol for the indicated times, or incubated in YES-glucose medium until the indicated OD600 values were reached. Protein extracts were resolved by SDS-PAGE, and Pak1-GFP and Pak2-3GFP fusions were detected by incubation with anti-GFP antibody. The image corresponds to a representative experiment that was repeated at least three times. NE: bands observed after 5 min film exposure. LE: immunoreactive bands observed after a prolonged exposure of 25 min. (D) Total protein extracts from strains expressing either Pak1-GFP or ppak1+-Pak2-GFP fusions and growing exponentially in YES-glucose were resolved by SDS-PAGE. Fusions were detected by incubation with an anti-GFP antibody. The image corresponds to a representative experiment, which was repeated at least three times with similar results. (E) Representative maximum-projection time-lapse images of Pak2 and Rlc1 dynamics at the CAR in cells co-expressing ppak1+-Pak2-GFP and Rlc1-mCherry genomic fusions and grown in YES-glycerol (gly). Mitotic progression was monitored using Pcp1-GFP-labeled SPBs. Time interval is 5 min. (F) Left: Strains were grown in YES-glycerol for 12 hr, and the percentage of septated and multiseptated cells was quantified. Data correspond to three independent experiments and are presented as mean ± SD. Right: representative maximum projection confocal images of cells from the indicated strains after cell-wall staining with calcofluor white.
-
Figure 2—figure supplement 1—source data 1
Source data for Figure 2—figure supplement 1.
- https://cdn.elifesciences.org/articles/83285/elife-83285-fig2-figsupp1-data1-v2.zip
-
Figure 2—figure supplement 1—source data 2
Western blot images for Figure 1A, B, C and D.
- https://cdn.elifesciences.org/articles/83285/elife-83285-fig2-figsupp1-data2-v2.zip
Figure 3 with 2 supplements
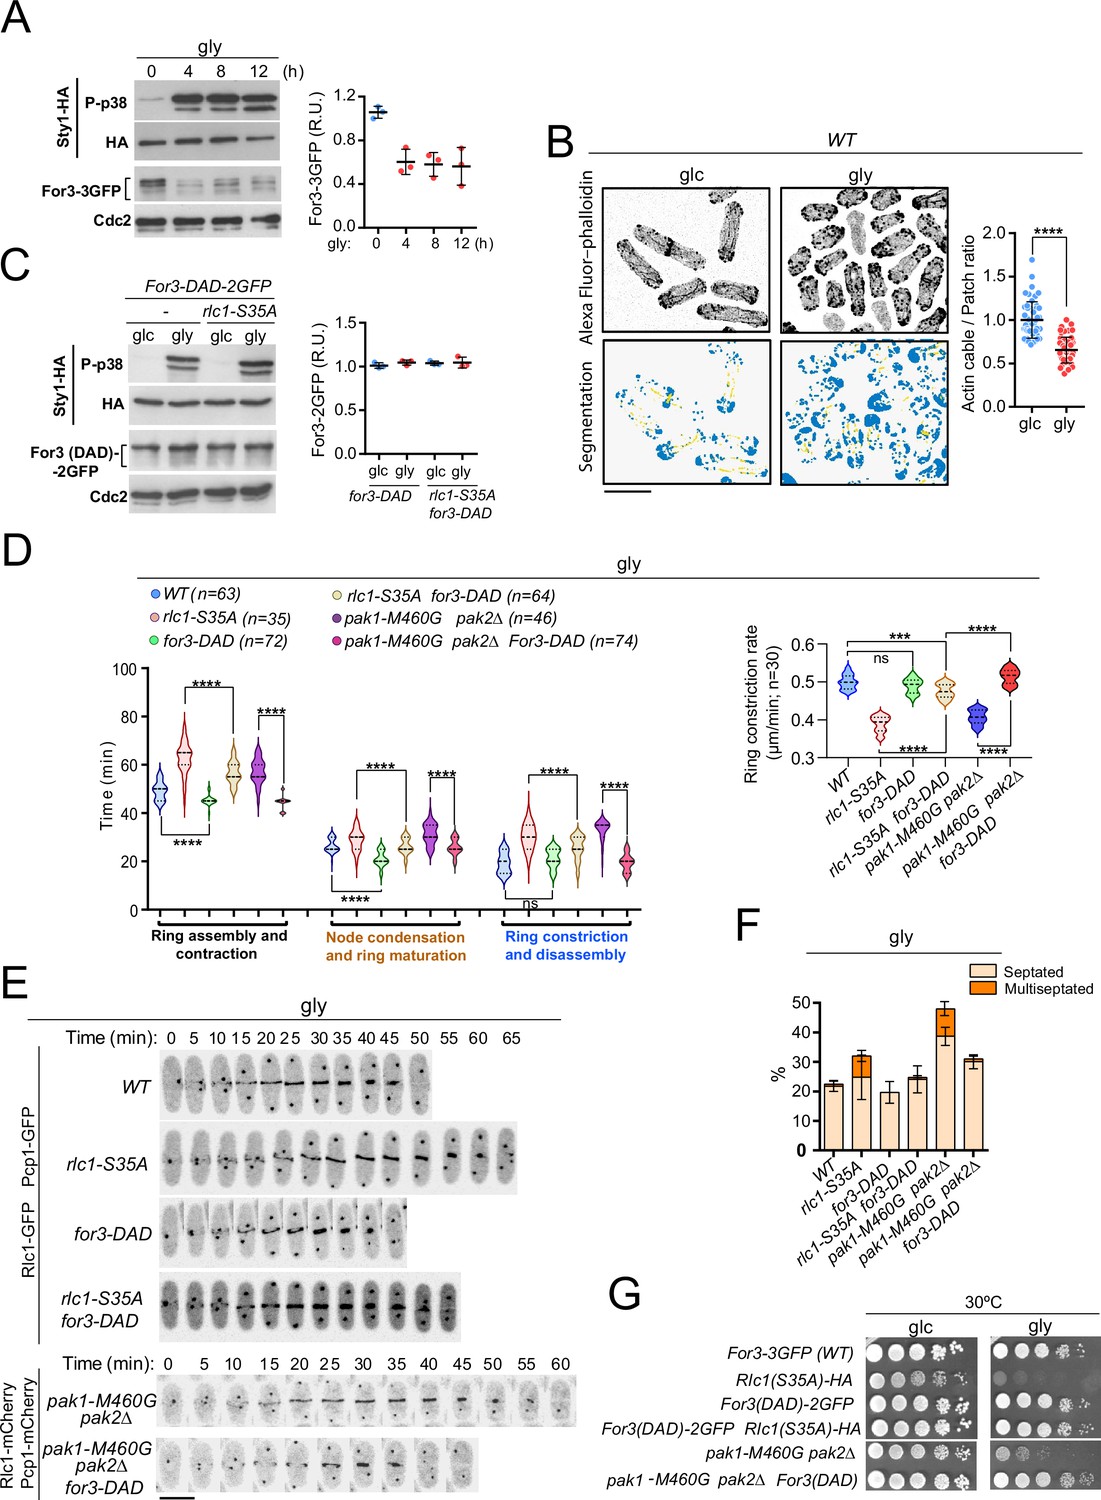
PAK phosphorylation of Rlc1 is critical for S. pombe cytokinesis during respiration due to impaired For3-dependent actin cable nucleation imposed by SAPK activation.
(A) Left: S. pombe cells expressing genomic Sty1-HA and For3-3GFP fusions were transferred to YES-glycerol medium (gly) for the indicated times. Activated/total Sty1 was detected using anti-phospho-p38 and anti-HA antibodies, respectively. Total For3 was detected with anti-GFP antibody. Anti-Cdc2 was used as a loading control. Right: For3 expression levels are expressed as mean relative units ± SD and correspond to experiments performed as biological triplicates. (B) Representative maximum projection images of Alexa Fluor phalloidin-stained S. pombe cells grown in YES-glucose medium (glc) or in YES-glycerol (gly) for 12 hr. Segmentation analysis using the Ilastik routine is shown below each image. Quantification data correspond to actin cable to patch ratio of G2 cells (n=51) and are presented as mean relative units ± SD. ****, p<0.0001, as calculated by unpaired Student’s t-test. Scale bar: 10 µm. (C) Left: S. pombe wild-type and rlc1-S35A strains expressing genomic Sty1-HA and For3 (DAD)–2GFP fusions were grown in YES-glucose (glc) until mid-log phase and transferred to YES-glycerol (gly) medium for 12 hr. Activated/total Sty1 was detected using anti-phospho-p38 and anti-HA antibodies, respectively. Total For3 was detected with anti-GFP antibody. Anti-Cdc2 was used as a loading control. Right: For3 expression levels are expressed as mean relative units ± SD and correspond to experiments performed as biological triplicates. (D) Left: times for ring assembly and contraction, node condensation/ring maturation, and ring constriction and disassembly were estimated for the indicated strains growing exponentially in YES-glycerol medium by time-lapse confocal fluorescence microscopy. Right: ring constriction rates (μm/min), were determined for the indicated strains. n is the total number of cells scored from three independent experiments, and data are presented as violin plots. ****, p<0.0001; ***, p<0.001; ns, not significant, as calculated by unpaired Student’s t-test. (E) Representative maximum-projection time-lapse images of Rlc1 dynamics at the equatorial region in cells from the indicated strains growing in YES-glycerol. Mitotic progression was monitored using Pcp1-GFP-labeled SPBs. Time interval is 5 min. (F) The indicated strains were grown in YES-glycerol liquid medium for 12 hr, and the percentage of septated and multiseptated cells was quantified. Data correspond to three independent experiments and are presented as mean ± SD. (G) Decimal dilutions of strains of the indicated genotypes were spotted on plates with YES-glucose (glc) or YES-glycerol (gly), incubated at 30 °C or five days, and photographed.
-
Figure 3—source data 1
Source data for Figure 3.
- https://cdn.elifesciences.org/articles/83285/elife-83285-fig3-data1-v2.zip
-
Figure 3—source data 2
Western blot images for Figure 3A and C.
- https://cdn.elifesciences.org/articles/83285/elife-83285-fig3-data2-v2.zip
Figure 3—figure supplement 1
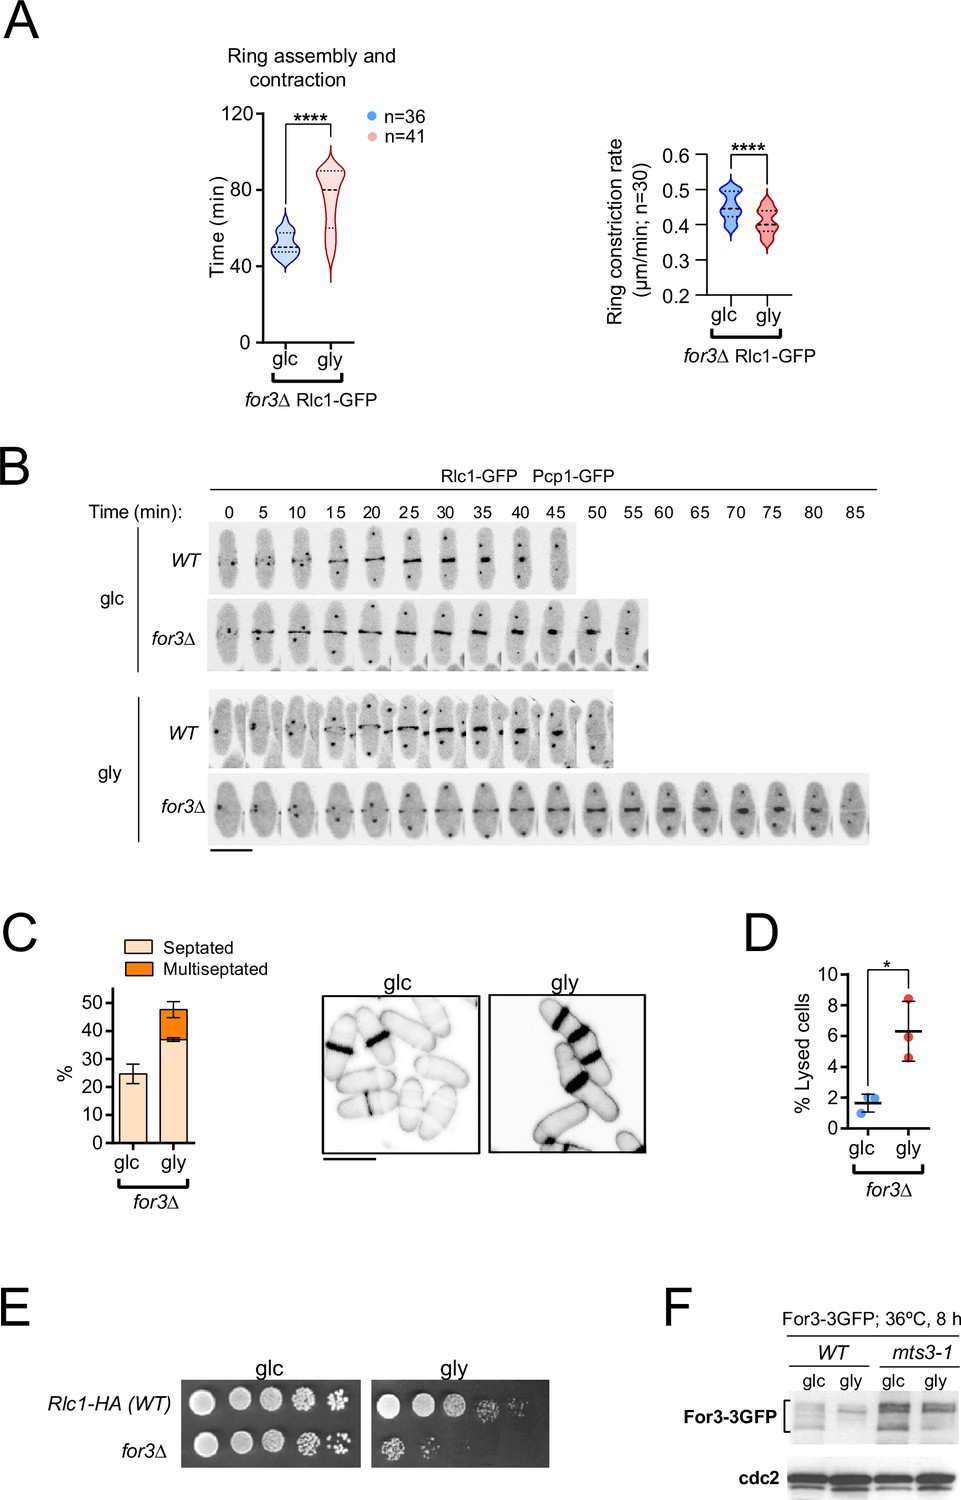
For3 formin is required for S. pombe cytokinesis during respiratory growth.
(A) Total ring assembly and contraction times (left) and ring constriction rates (right) (μm/min) were estimated for for3∆ Rlc1-GFP cells growing exponentially in either YES-glucose (glc) or YES-glycerol (gly) medium by time-lapse confocal fluorescence microscopy. n>30 cells from three independent experiments were scored in each condition, and data are presented as violin plots. ****, p<0.0001, as calculated by unpaired Student’s t-test. (B) Representative maximum projection time-lapse images of Rlc1 dynamics at the equatorial region in cells from the indicated strains growing in YES-glucose or YES-glycerol. Mitotic progression was monitored using Pcp1-GFP-labeled SPBs. Time interval is 5 min. Scale bar: 10 µm. (C) Left: the percentage of septated and multiseptated cells were quantified in for3∆ cells grown for 12 h in either YES-glucose (glc) or YES-glycerol (gly) medium. Data correspond to three independent experiments and are presented as mean ± SD. Right: representative maximum projection confocal images after cell-wall staining with calcofluor white. Scale bar: 10 µm. (D) The percentage of cell lysis was quantified in for3∆ cells grown for 12 hr in either YES-glucose (glc) or YES-glycerol (gly) medium. Data correspond to three independent experiments and are presented as mean ± SD. *, p<0.05, as calculated by unpaired Student’s t-test. (E) Decimal dilutions of strains of the indicated genotypes were spotted on plates with YES-glucose (glc) or YES-glycerol (gly), incubated at 30°C for five days, and photographed. The image corresponds to a representative experiment that was repeated at least three times with similar results. (F) For3-3GFP levels were determined by Western blot analysis with anti-GFP antibody in extracts from wild-type and the proteasome mutant mts3-1 grown in YES-glucose (glc) or YES-glycerol (gly) and incubated at 36°C for 8 hr. Anti-Cdc2 was used as a loading control. The image corresponds to a representative experiment that was repeated at least three times with similar results.
-
Figure 3—figure supplement 1—source data 1
Source data for Figure 3—figure supplement 1.
- https://cdn.elifesciences.org/articles/83285/elife-83285-fig3-figsupp1-data1-v2.zip
-
Figure 3—figure supplement 1—source data 2
Western blot images for Figure 1F.
- https://cdn.elifesciences.org/articles/83285/elife-83285-fig3-figsupp1-data2-v2.zip
Figure 3—figure supplement 2
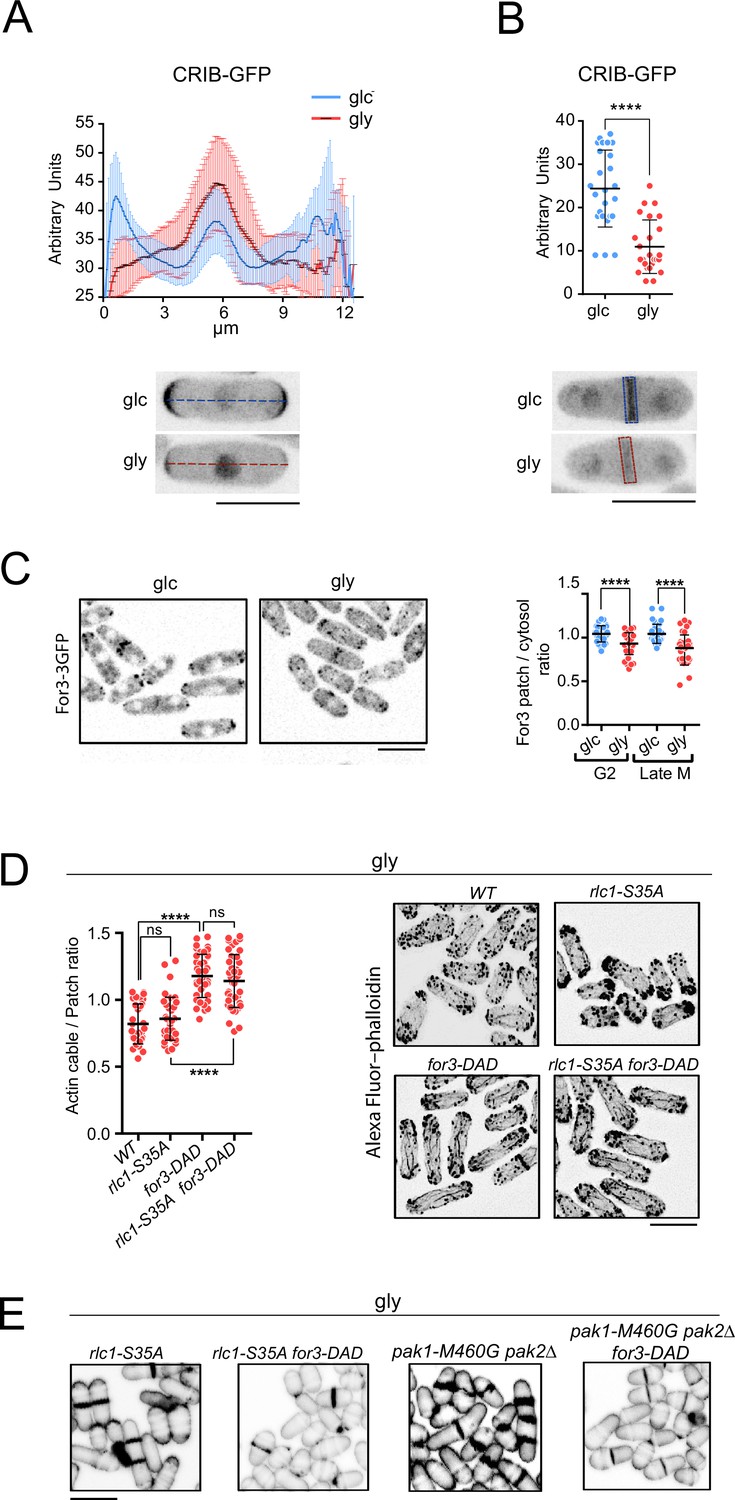
Localization at the cell poles and the contractile actomyosin ring (CAR) of Ccd42 (active) and For3 is reduced during respiratory growth.
(A) Upper: intensity plots of the CRIB-3GFP fusion (shown as arbitrary fluorescence units), were generated from line scans across the equatorial region of S. pombe G2 cells (n=30) grown in YES-glucose (glc) or YES-glycerol (gly). Data are presented as mean ± SD. Lower: representative maximum-projection images of cells grown with glucose and glycerol are shown. Scale bar: 10 µm. (B) Upper: the intensity of the CRIB-3GFP fusion at the medial region of dividing cells (n=25) in YES-glucose (glc) or YES-glycerol (gly) was measured and is shown as arbitrary fluorescence units. Data are presented as mean ± SD. ****, p<0.0001, t-test. Lower: representative maximum-projection images of dividing cells are shown. Scale bar: 10 µm. (C) Left: representative maximum projection images of S. pombe cells expressing a For3-3GFP genomic fusion grown in YES-glucose medium or in YES-glycerol for 12 hr. Right: quantification data (mean relative units ± SD) correspond to the For3 dot to cytosol ratio in G2 and late M cells (n=36), grown in glucose or glycerol. ****, p<0.0001, as calculated by unpaired Student’s t-test. (D) Actin cable to patch ratio of G2 cells from the indicated strains grown in YES-glycerol medium for 12 hr. Quantification data (n=41 cells for each strain) are presented as mean relative units ± SD. ****, p<0.0001; ns, not significant, as calculated by unpaired Student’s t-test. (E) Representative maximum projection images of Alexa Fluor–phalloidin stained S. pombe cells of the indicated strains grown in YES-glycerol medium for 12 hr. Scale bar: 10 µm. (E) Representative maximum projection confocal images of cells from the indicated strains after cell-wall staining with calcofluor white. Scale bar: 10 µm.
-
Figure 3—figure supplement 2—source data 1
Source data for Figure 3—figure supplement 2.
- https://cdn.elifesciences.org/articles/83285/elife-83285-fig3-figsupp2-data1-v2.zip
Figure 4 with 1 supplement
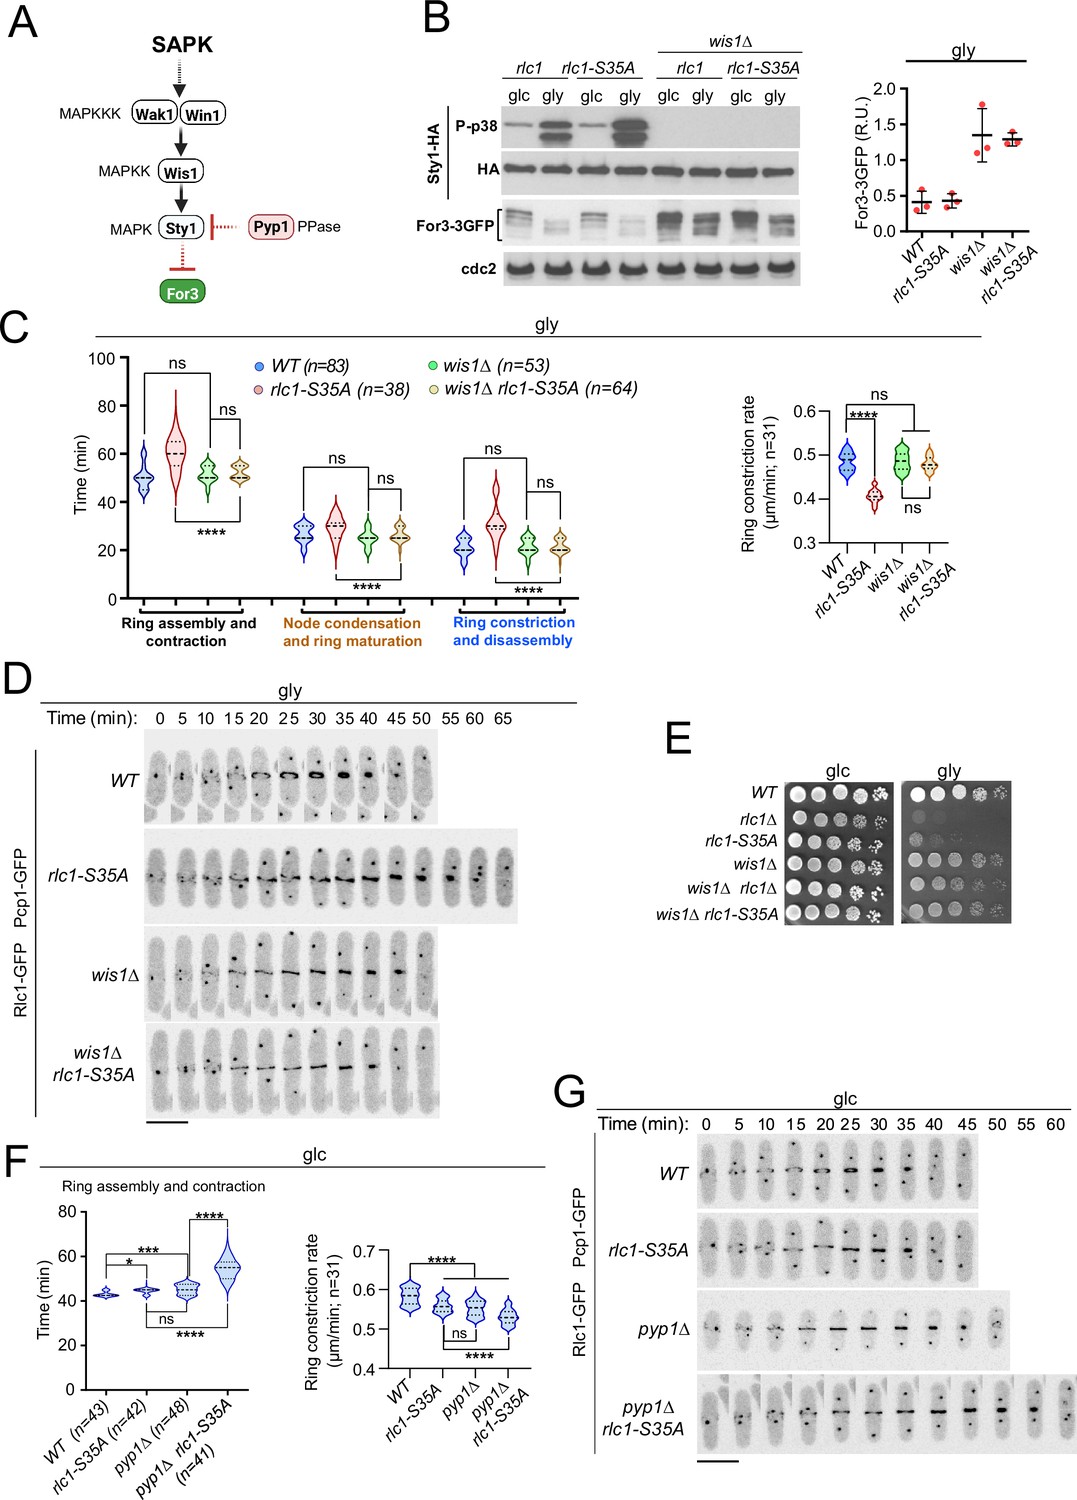
Lack of stress-activated protein kinase (SAPK) signaling restores S. pombe cytokinesis and growth during respiration in the absence of Rlc1 phosphorylation.
(A) SAPK signaling triggers For3 downregulation. Please see the text for specific details on the components of the MAPK cascade. (B) Left: S. pombe strains of the indicated genotypes expressing genomic Sty1-HA and For3-3GFP fusions were grown in either YES-glucose (glc) or YES-glycerol (gly) medium for 12 hr. Activated/total Sty1 were detected with anti-phospho-p38 and anti-HA antibodies, respectively. Total For3 levels were detected with anti-GFP antibody. Anti-Cdc2 was used as a loading control. Right: For3 expression levels in glycerol are presented as mean relative units ± SD and correspond to experiments performed as biological triplicates. (C) Left: times for ring assembly and contraction, node condensation/ring maturation, and ring constriction and disassembly were estimated for the indicated strains growing exponentially in YES-glycerol medium by time-lapse confocal fluorescence microscopy. Right: ring constriction rates (μm/min), were determined for the indicated strains. n is the total number of cells scored from three independent experiments, and data are presented as violin plots. ****, p<0.0001; ns, not significant, as calculated by unpaired Student’s t-test. (D) Representative maximum-projection time-lapse images of Rlc1 dynamics at the equatorial region in cells from the indicated strains growing in YES-glycerol. Mitotic progression was monitored using Pcp1-GFP-labeled SPBs. Time interval is 5 min. (E) Decimal dilutions of strains of the indicated genotypes were spotted on plates with YES-glucose (glc) or YES-glycerol (gly), incubated at 30 °C or five days, and photographed. The image corresponds to a representative experiment that was repeated at least three times with similar results. (F) Total ring assembly and contraction time (left) and ring constriction rates (μm/min) (right) were determined by time-lapse confocal fluorescence microscopy for the indicated strains growing exponentially in YES-glucose medium (glc). n is the total number of cells scored from three independent experiments, and data are presented as violin plots. ****, p<0.0001;***, p<0.005; *, p<0.05; ns, not significant, as calculated by unpaired Student’s t-test. (G) Representative maximum-projection time-lapse images of Rlc1 dynamics at the equatorial region in cells from the indicated strains growing in YES-glucose. Mitotic progression was monitored using Pcp1-GFP-labeled SPBs. Time interval is 5 min.
-
Figure 4—source data 1
Source data for Figure 4.
- https://cdn.elifesciences.org/articles/83285/elife-83285-fig4-data1-v2.zip
-
Figure 4—source data 2
Western blot images for Figure 4B.
- https://cdn.elifesciences.org/articles/83285/elife-83285-fig4-data2-v2.zip
Figure 4—figure supplement 1
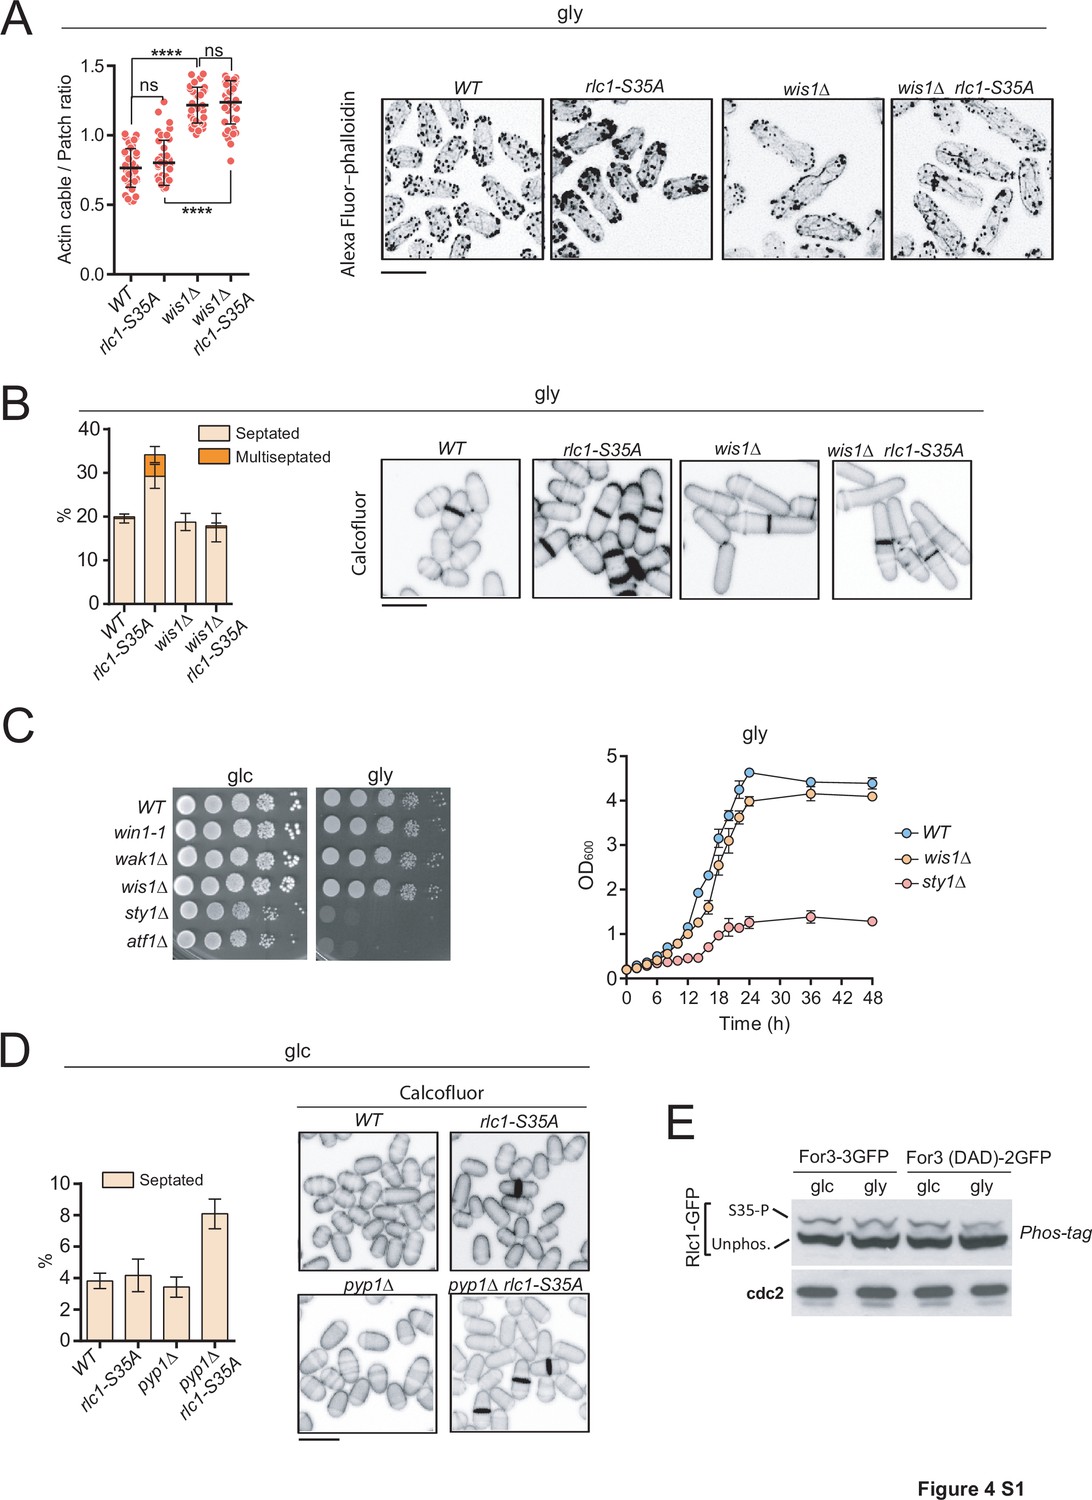
stress-activated protein kinase (SAPK) activation impairs S.pombe cytokinesis and growth during respiration in the absence of Rlc1 phosphorylation.
(A) Left: actin cable to patch ratio of G2 cells from the indicated strains grown in YES-glycerol medium for 12 hr. Quantification data (n=41 cells for each strain) are represented as mean relative units ± SD. ****, p<0.0001, t-test. Right: representative maximum projection images of Alexa Fluor–phalloidin stained S. pombe cells of the indicated strains grown in YES-glycerol medium for 12 hr. Scale bar: 10 µm. (B) Left: the indicated strains were grown in liquid YES-glycerol medium for 12 hr, and the percentage of septated and multiseptated cells was quantified. Data correspond to three independent experiments and are presented as mean ± SD. Right: representative maximum projection confocal images of cells from the indicated strains after cell-wall staining with calcofluor white. Scale bar: 10 µm. (C) Left: decimal dilutions of strains of the indicated genotypes were spotted on plates with YES-glucose (glc) or YES-glycerol (gly), and photographed. Right: strains were grown in YES-glucose to a final OD600 = 0.2, shifted to YES-glycerol, and incubated at 28 °C. The OD600 value was determined at the times indicated. Data correspond to three independent experiments and are presented as mean ± SD. (D) Left: strains were grown in YES-glucose liquid medium (glc), and the percentage of septated cells was quantified. Data correspond to three independent experiments and are presented as mean ± SD. Right: representative maximum projection confocal images of cells from the indicated strains after cell-wall staining with calcofluor white. (E) Total protein extracts from the indicated strains grown exponentially in YES-glucose (glc) or YES-glycerol (gly) were resolved by Phos-tag SDS-PAGE, and the Rlc1-GFP fusion was detected by incubation with anti-GFP antibody. Anti-Cdc2 was used as a loading control. Rlc1 isoforms, phosphorylated (S35–P) and non-phosphorylated at Ser35 (Unphos), are indicated. The blot corresponds to a representative experiment that was repeated at least three times and the trend of the mobility shift was reproducible.
-
Figure 4—figure supplement 1—source data 1
Source data for Figure 4—figure supplement 1.
- https://cdn.elifesciences.org/articles/83285/elife-83285-fig4-figsupp1-data1-v2.zip
-
Figure 4—figure supplement 1—source data 2
Western blot images for Figure 1E.
- https://cdn.elifesciences.org/articles/83285/elife-83285-fig4-figsupp1-data2-v2.zip
Figure 5 with 2 supplements
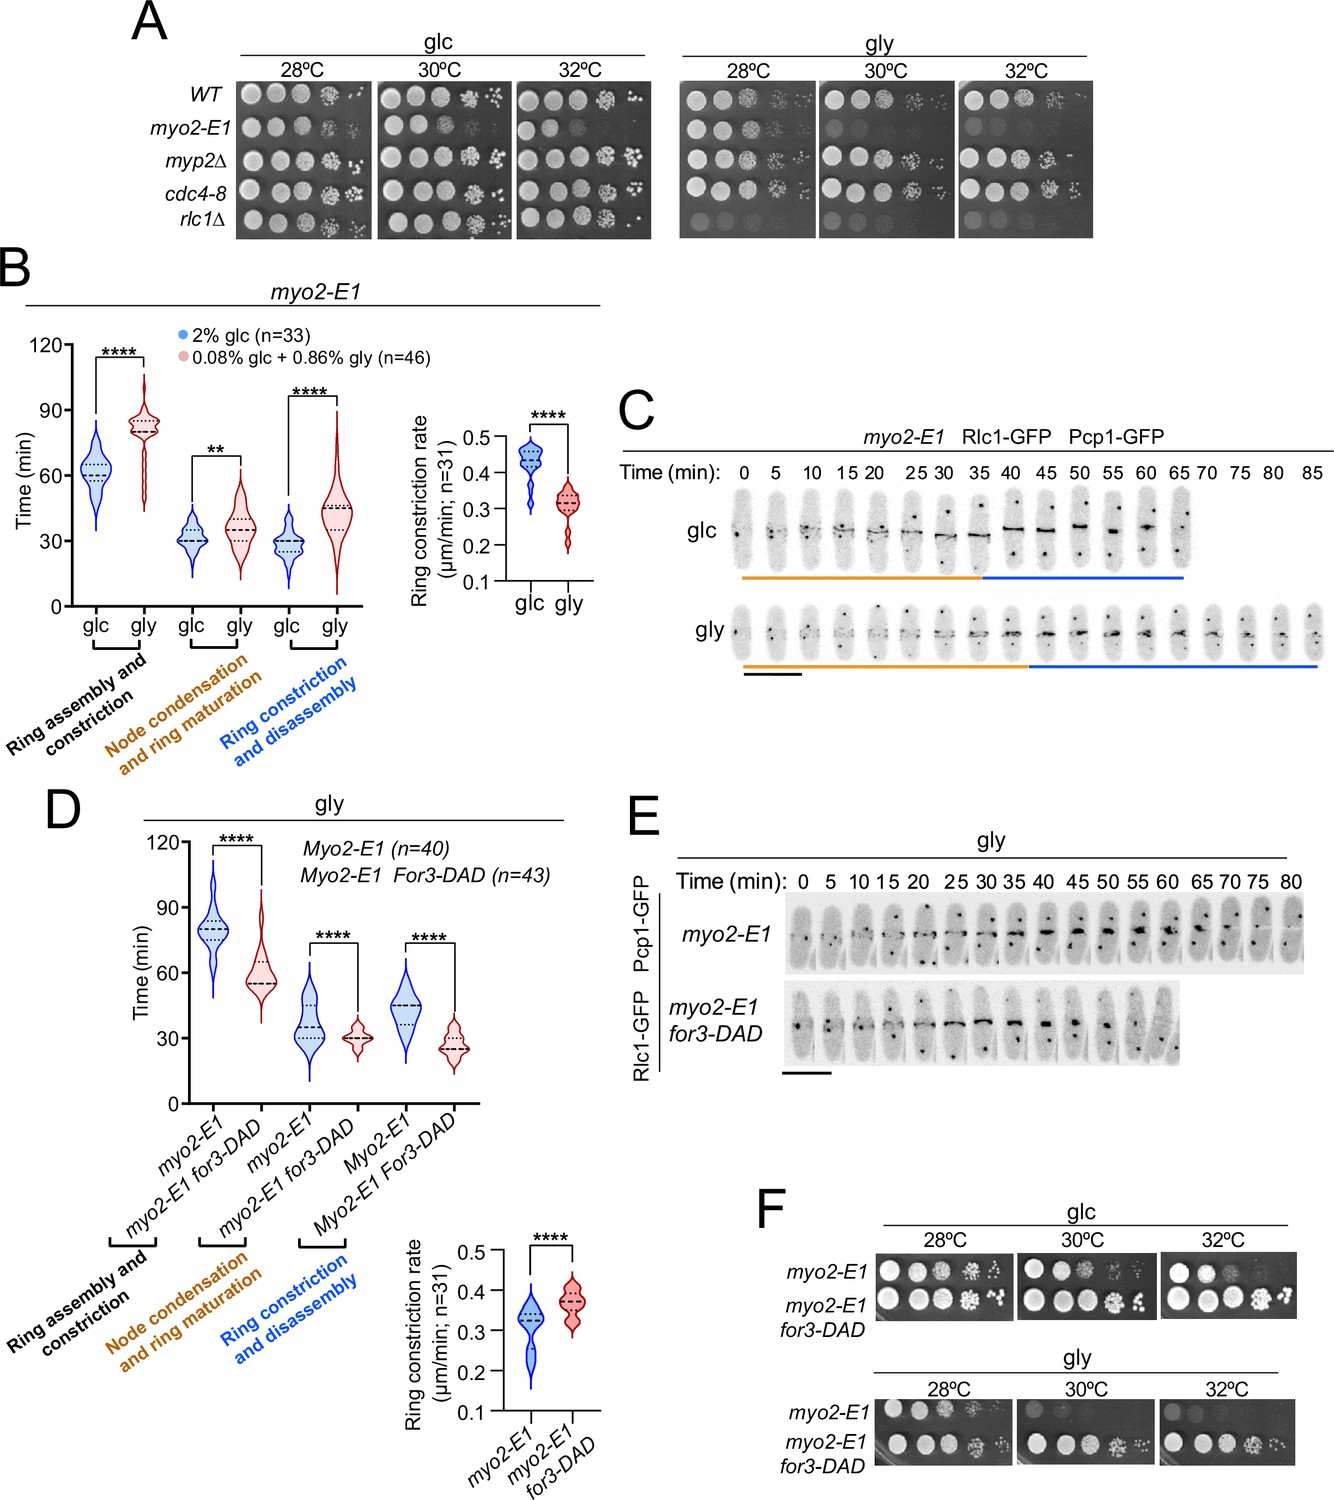
Control of Myo2 activity by Rlc1 phosphorylation regulates S. pombe cytokinesis and growth during respiration.
(A) Decimal dilutions of strains of the indicated genotypes were spotted on plates with YES-glucose or YES-glycerol, incubated at 28, 30, and 32 °C for three (glc) or five (gly) days, and photographed. The images correspond to a representative experiment, which was repeated at least three times with similar results. (B) Left: times for ring assembly and contraction, node condensation/ring maturation, and ring constriction and disassembly were estimated for myo2-E1 cells growing in YES-glucose (glc) and YES-glycerol medium (gly) by time-lapse confocal fluorescence microscopy. Mitotic progression was monitored using Pcp1-GFP-labeled SPBs. Right: ring constriction rates (μm/min). n is the total number of cells scored from three independent experiments, and data are presented as violin plots. ****, p<0.0001; **, p<0.005, as calculated by unpaired Student’s t-test. (C) Representative maximum-projection time-lapse images of Rlc1 dynamics at the equatorial region in myo2-E1 Rlc1-GFP cells growing in YES-glucose (glc) or YES-glycerol (gly). Mitotic progression was monitored using Pcp1-GFP-marked SPBs. Time interval is 5 min. Scale bar: 10 µm. (D) Upper: times for ring assembly and contraction, node condensation/ring maturation, and ring constriction and disassembly were estimated for the indicated strains grown on YES-glycerol (gly) using time-lapse confocal fluorescence microscopy. Lower: ring constriction rates (μm/min). n is the total number of cells scored from three independent experiments, and data are presented as violin plots. ****, p<0.0001, as calculated by unpaired Student’s t-test. (E) Representative maximum-projection time-lapse images of Rlc1-GFP dynamics at the equatorial region in myo2-E1 and myo2-E1 for3-DAD cells growing in YES-glycerol. Mitotic progression was monitored using Pcp1-GFP-labeled SPBs. Time interval is 5 min. (F) Decimal dilutions of strains of the indicated genotypes were spotted on plates with YES-glucose or YES-glycerol, incubated at 28, 30, and 32°C for three (glc) or five (gly) days, and photographed. The images correspond to a representative experiment that was repeated at least three times with similar results.
-
Figure 5—source data 1
Source data for Figure 5.
- https://cdn.elifesciences.org/articles/83285/elife-83285-fig5-data1-v2.zip
Figure 5—figure supplement 1
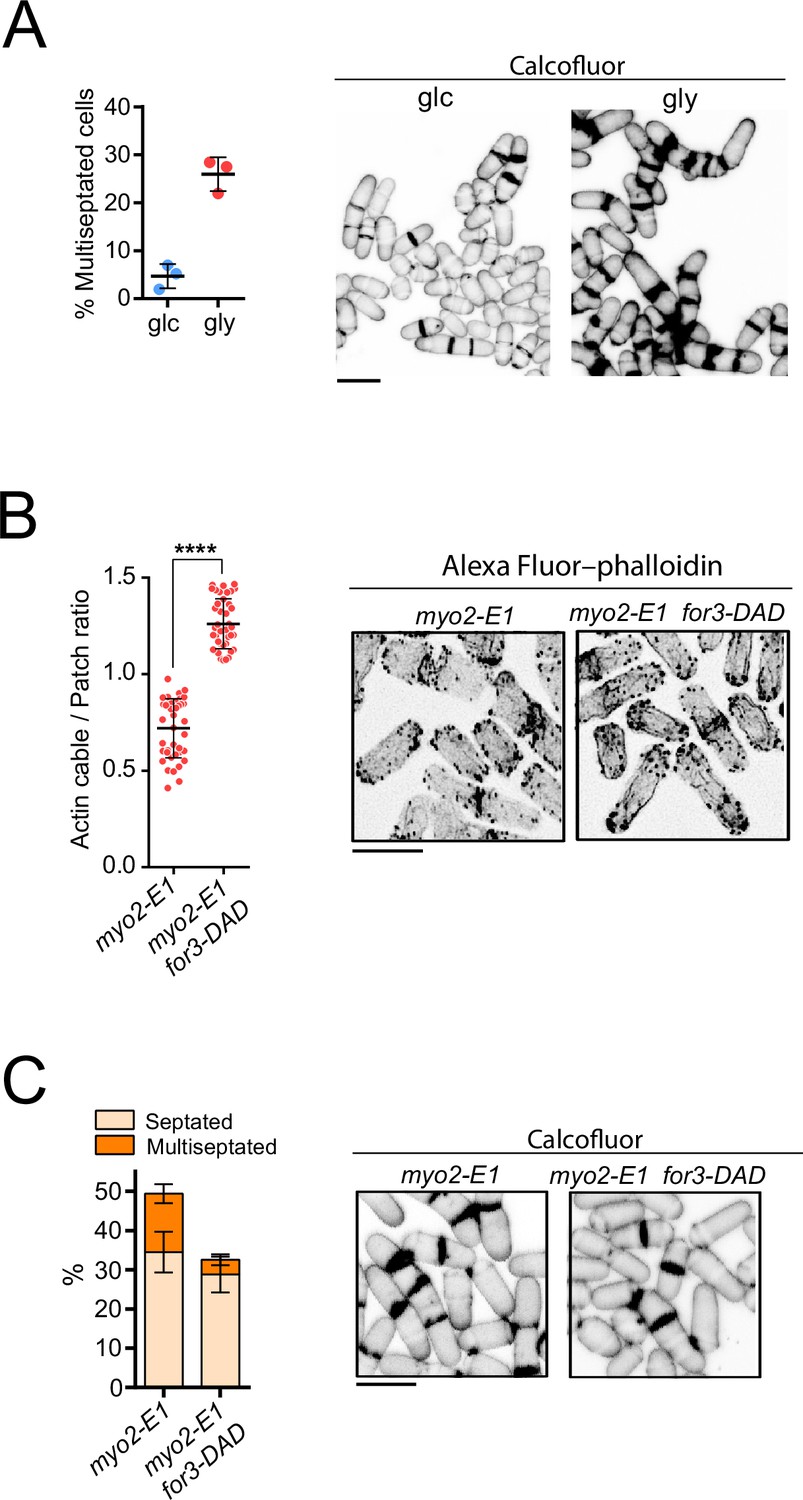
for3-DAD expression restores actin filaments and alleviates the septation defects of myo2-E1 cells during respiration.
(A) Left: the percentage of multiseptated cells was quantified in myo2-E1 cells grown exponentially in YES-glucose (glc) or YES-glycerol (gly) for 12 hr. Data correspond to three independent experiments and are presented as mean ± SD. Right: representative maximum projection confocal images of myo2-E1 cells growing in YES-glucose or YES-glycerol after cell-wall staining with calcofluor white. (B) Left: actin cable to patch ratio of G2 cells from the indicated strains growing in YES-glycerol medium for 12 hr. Quantification data (n=40 cells for each strain) are presented as mean relative units ± SD. ****, p<0.0001 S. pombe cells of the indicated strains grown in YES-glycerol medium for 12 hr. (C) Left: the percentage of septated and multiseptated cells was quantified in myo2-E1 and myo2-E1 for3-DAD cells grown for 12 hr in YES-glycerol medium. Data correspond to three independent experiments and are presented as mean ± SD. Right: representative maximum projection confocal images after cell-wall staining with calcofluor white.
-
Figure 5—figure supplement 1—source data 1
Source data for Figure 5—figure supplement 1.
- https://cdn.elifesciences.org/articles/83285/elife-83285-fig5-figsupp1-data1-v2.zip
Figure 5—figure supplement 2
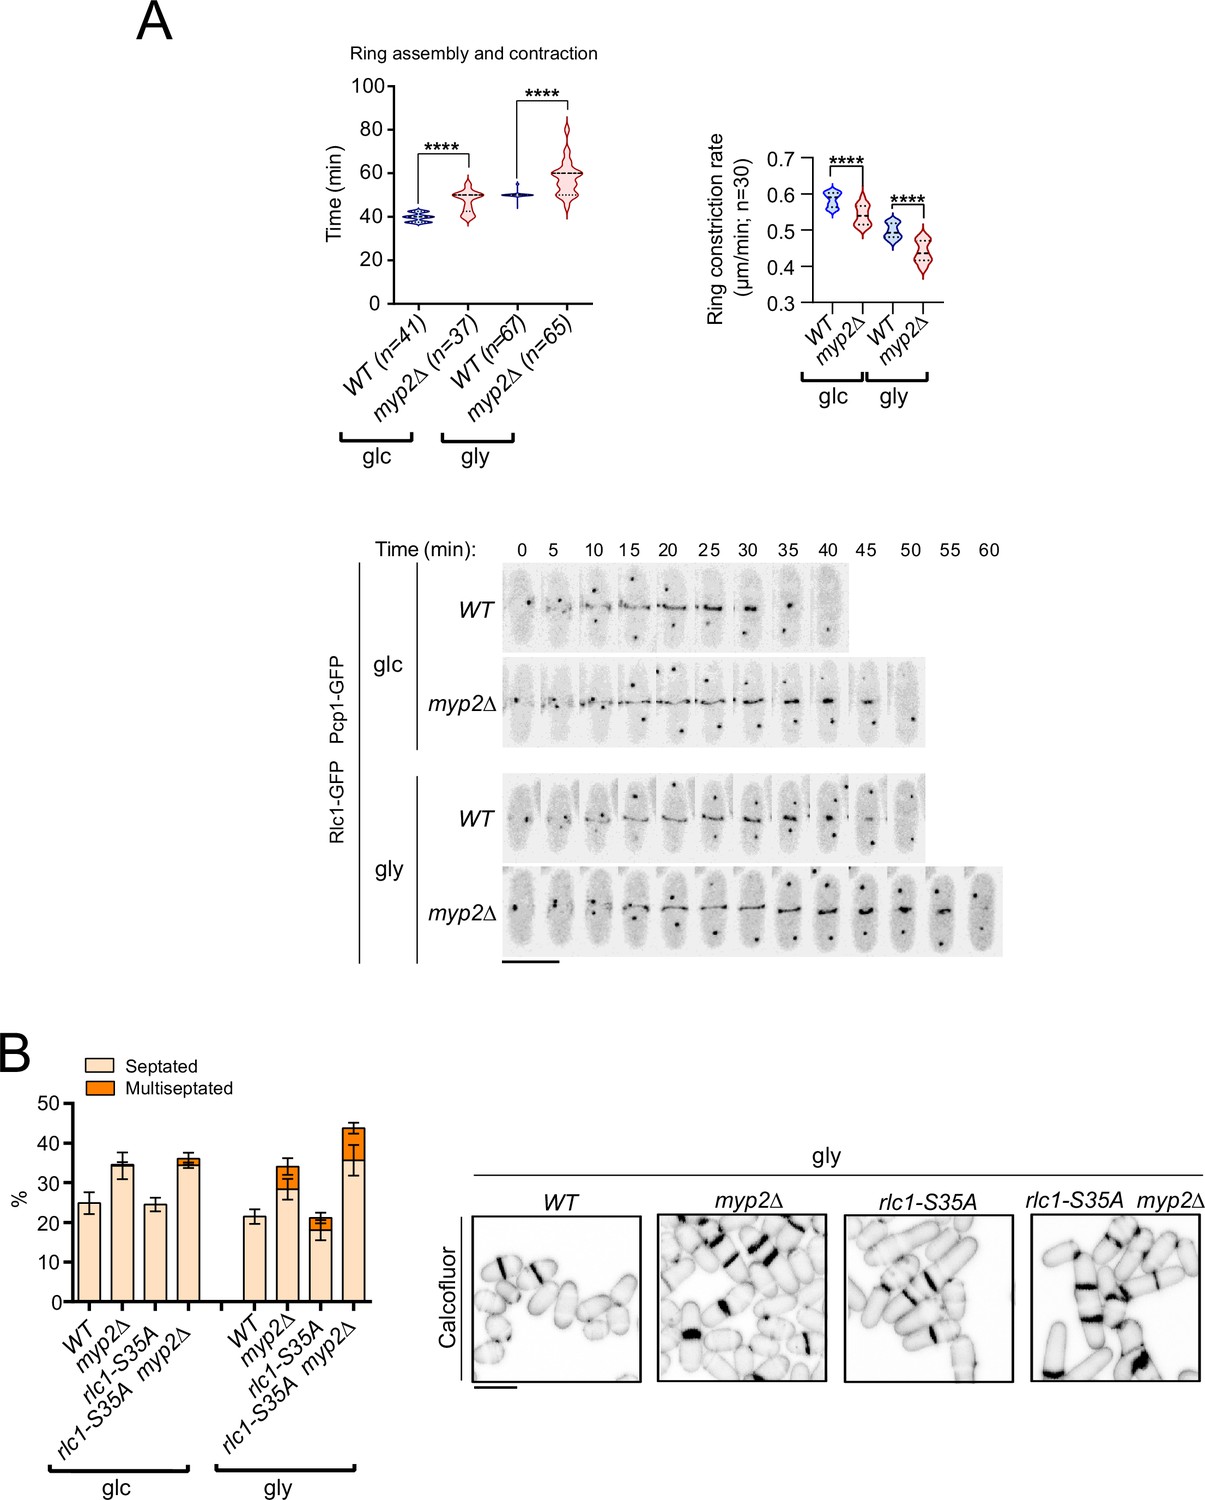
Role of Myp2 on S. pombe cytokinesis during respiration.
(A) Upper: ring assembly and contraction times and the ring constriction rates were estimated by time-lapse confocal fluorescence microscopy for wild-type and myp2∆ cells growing in YES-glucose (glc) or YES-glycerol (gly) medium. Mitotic progression was monitored using Pcp1-GFP-labeled SPBs. n is the total number of cells scored from three independent experiments, and data are presented as violin plots. p<0.0001, as calculated by unpaired Student’s t-test. Lower: representative maximum-projection time-lapse images of Rlc1 dynamics at the equatorial region of wild-type and myp2∆ cells growing in YES-glucose (glc) or YES-glycerol (gly). Mitotic progression was monitored using Pcp1-GFP-labeled SPBs. Time interval is 5 min. Scale bar: 10 µm. (B) Left: the percentage of septated and multiseptated cells was quantified in the indicated strains grown for 12 hr in YES-glucose (glc) or YES-glycerol (gly). Data correspond to three independent experiments and are presented as mean ± SD. Right: representative maximum projection confocal images of cells grown in YES-glycerol after cell-wall staining with calcofluor white. Scale bar: 10 µm.
-
Figure 5—figure supplement 2—source data 1
Source data for Figure 5—figure supplement 2.
- https://cdn.elifesciences.org/articles/83285/elife-83285-fig5-figsupp2-data1-v2.zip
Figure 6 with 2 supplements
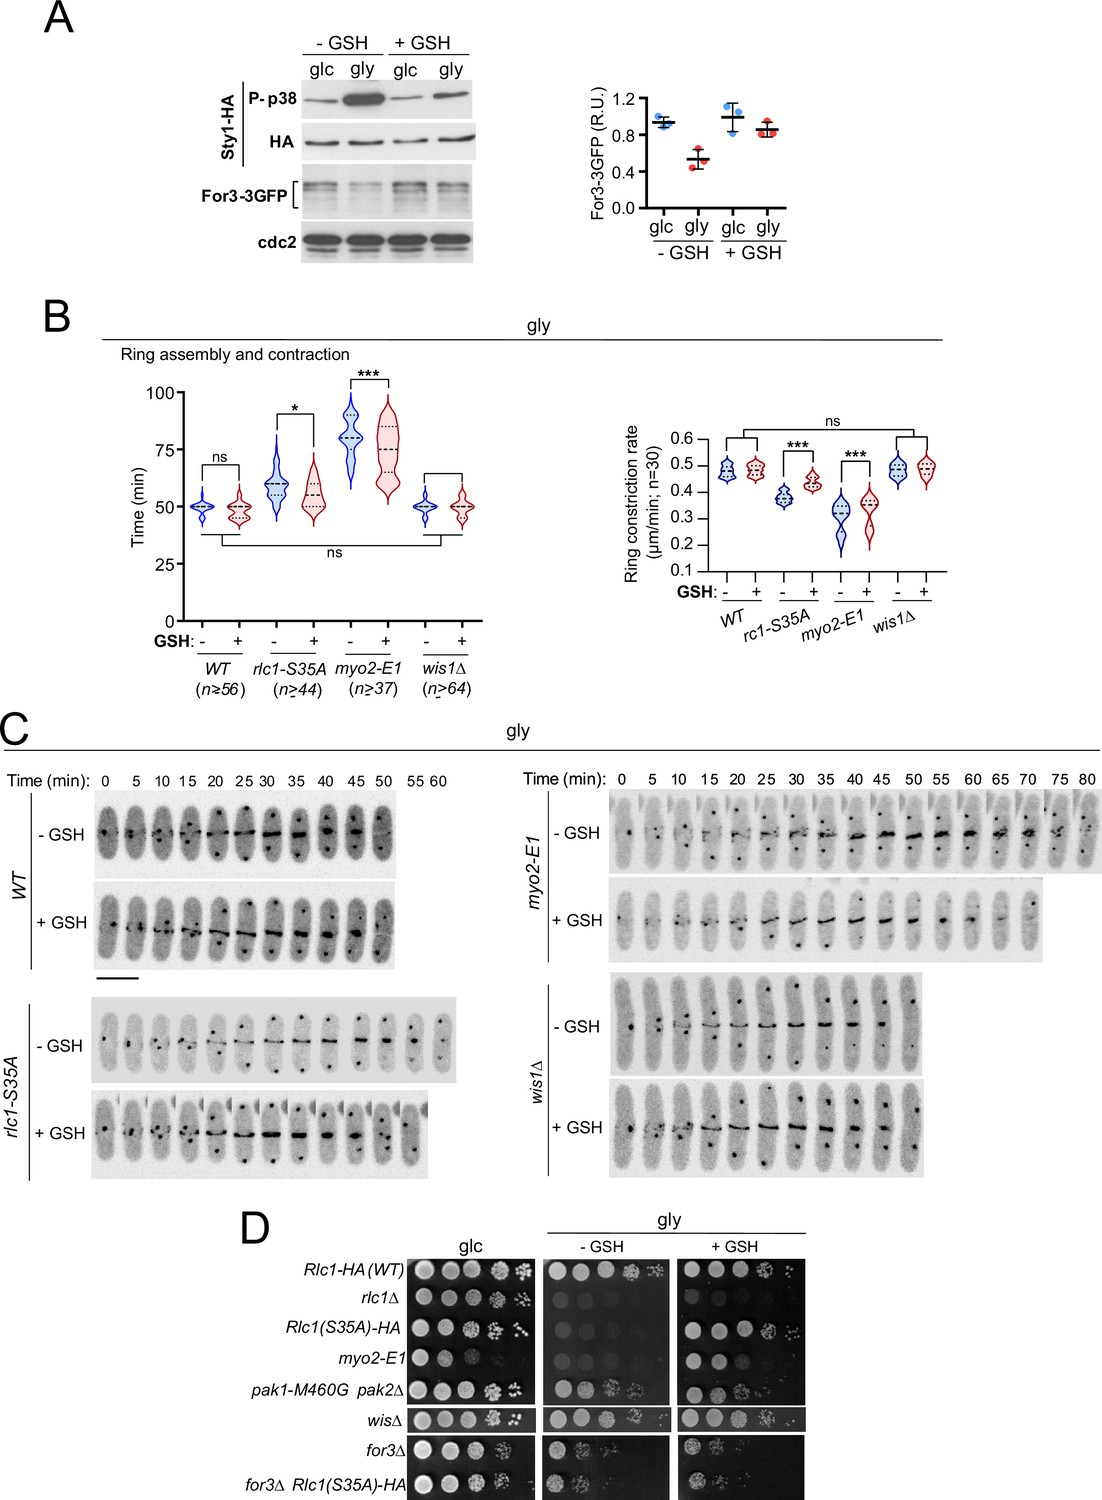
Exogenous antioxidants bypass the need for Rlc1 phosphorylation to regulate myosin II activity and cytokinesis during respiratory growth.
(A) Left: S. pombe wild-type cells expressing genomic Sty1-HA and For3-3GFP fusions were grown to mid-log phase in YES-glucose (glc) or YES-glycerol (gly), with or without 0.16 mM reduced glutathione (GSH). Activated/total Sty1 was detected with anti-phospho-p38 and anti-HA antibodies, respectively. Total For3 levels were detected with anti-GFP antibody. Anti-Cdc2 was used as a loading control. Right: For3 expression levels are expressed as mean relative units ± SD and correspond to experiments performed as biological triplicates. (B) Total ring assembly and contraction times (left) and ring constriction rates (μm/min) (right) were estimated by time-lapse confocal fluorescence microscopy for the indicated strains growing exponentially in YES-glycerol medium with or without 0.16 mM GSH. n is the total number of cells scored from three independent experiments, and data are presented as violin plots. ***, p<0.005; *, p<0.05; ns, not significant, as calculated by unpaired Student’s t-test. (C) Representative maximum-projection time-lapse images of Rlc1 dynamics at the equatorial region in cells from the indicated strains growing in YES-glycerol with or without 0.16 mM GSH. Mitotic progression was monitored using Pcp1-GFP-labeled SPBs. Time interval is 5 min. Scale bar: 10 µm. (D) Decimal dilutions of strains of the indicated genotypes were spotted onto plates with YES-glucose or YES-glycerol plates with or without 0.16 mM GSH, incubated at 28 °C for three (Glc) or five (Gly) days, and photographed. The images correspond to a representative experiment that was repeated at least three times with similar results.
-
Figure 6—source data 1
Source data for Figure 6.
- https://cdn.elifesciences.org/articles/83285/elife-83285-fig6-data1-v2.zip
-
Figure 6—source data 2
Western blot images for Figure 6A.
- https://cdn.elifesciences.org/articles/83285/elife-83285-fig6-data2-v2.zip
Figure 6—figure supplement 1
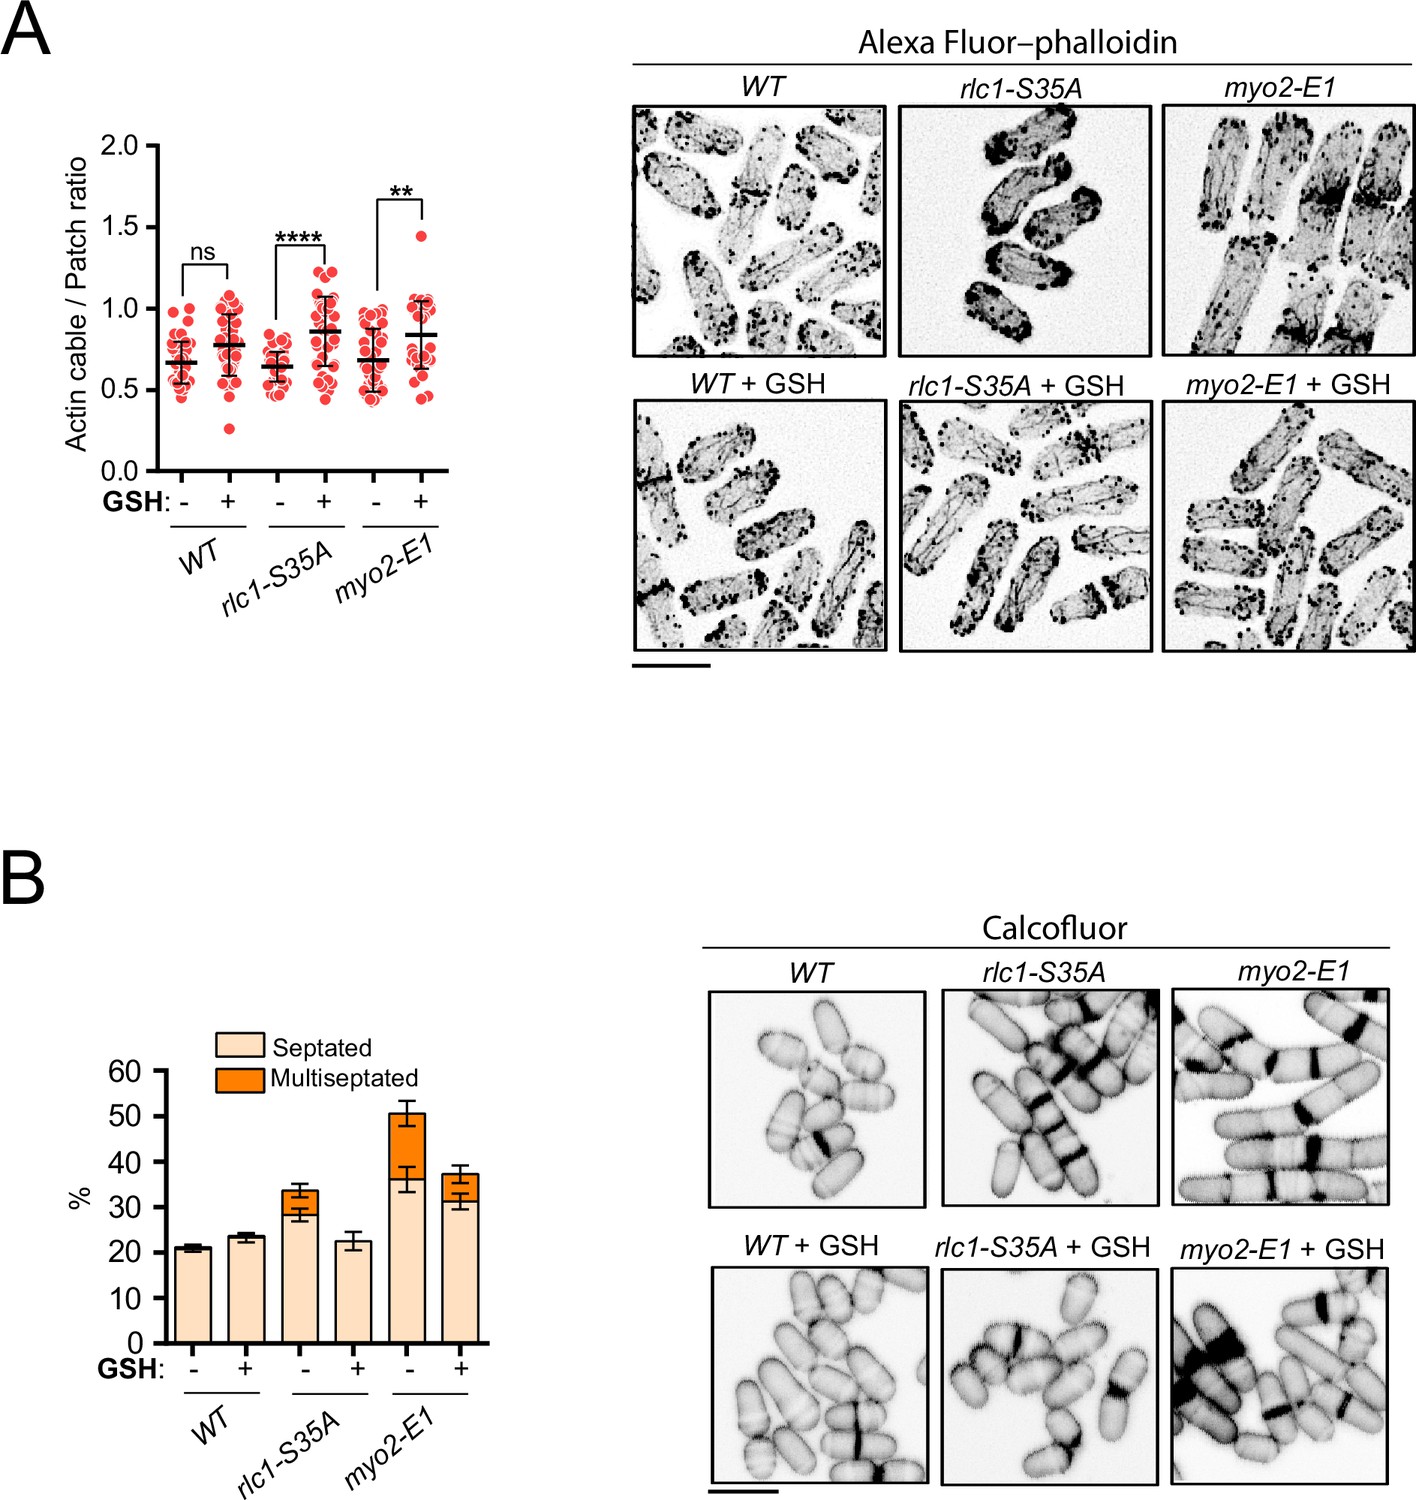
Reduced glutathione restores actin cables and alleviates septation defects in rlc1-S35A and myo2-E1 cells during respiration.
(A) Left: Actin cable to patch ratio of G2 cells from the indicated strains growing in YES-glycerol with or without 0.16 mM GSH. Quantification data (n=41 cells for each strain), are represented as mean relative units ± SD. ****, p<0.0001; **, p<0.01; ns, not significant, as calculated by unpaired Student’s t-test. Right: representative maximum projection images of Alexa Fluor–phalloidin stained S. pombe cells of the indicated strains grown for 12 hr in YES-glycerol medium with or without 0.16 mM GSH. Scale bar: 10 µm. (B) Left: the percentage of septated and multiseptated cells was quantified in the indicated strains grown for 12 hr in YES-glycerol medium with or without 0.16 mM GSH. Data correspond to three independent experiments and are presented as mean ± SD. Right: representative maximum projection confocal images of cells grown in YES-glycerol after cell-wall staining with calcofluor white.
-
Figure 6—figure supplement 1—source data 1
Source data for Figure 6—figure supplement 1.
- https://cdn.elifesciences.org/articles/83285/elife-83285-fig6-figsupp1-data1-v2.zip
Figure 6—figure supplement 2
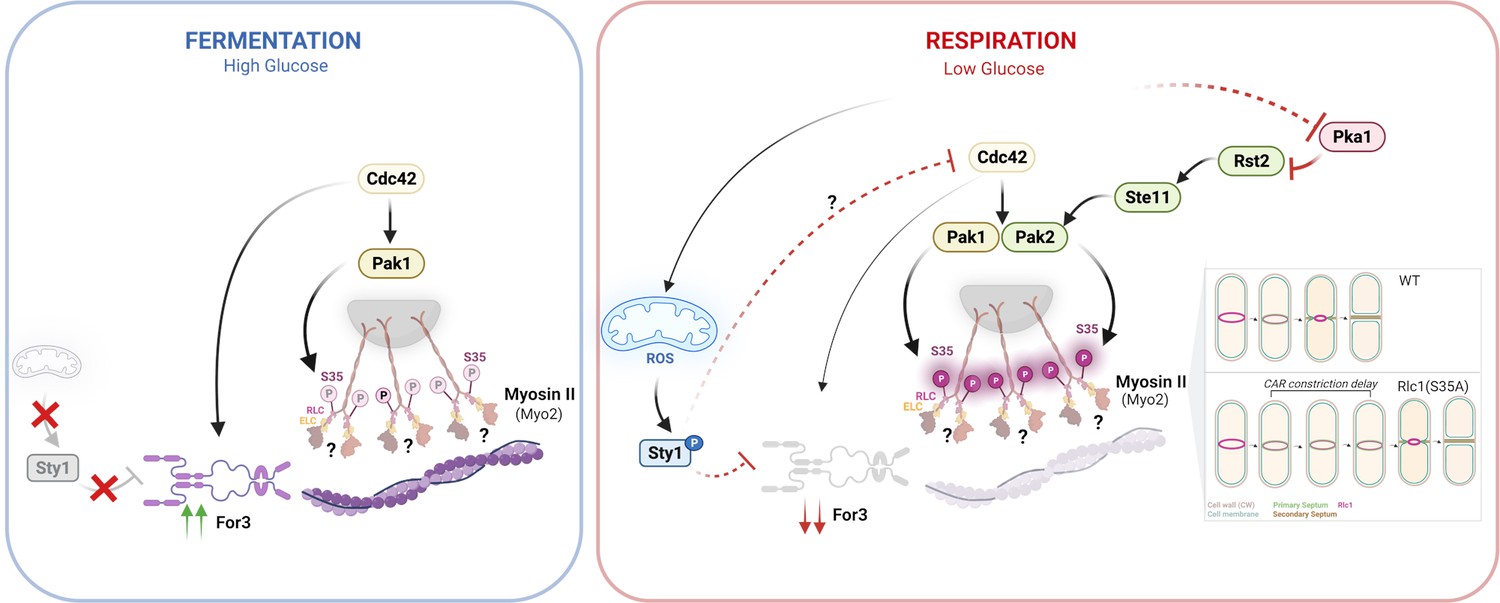
Model depicting the signaling pathways and mechanisms that regulate S. pombe cytokinesis by myosin II (Myo2) through regulatory light chain phosphorylation during respiratory metabolism.
See text for specific details.
Tables
Key resources table
| Reagent type (species) or resource | Designation | Source or reference | Identifiers | Additional information |
|---|---|---|---|---|
| Antibody | anti-Phospho-p38 (rabbit polyclonal) | Cell Signaling | Cat# 9211, RRID:AB_331641 | WB (1:1000) |
| Antibody | anti-HA (mouse monoclonal) | Roche | Cat# 11 583 816 001, RRID:AB_514505 | WB (1:1000) |
| Antibody | anti-GFP (mouse monoclonal) | Roche | Cat# 11 814 460 001, RRID:AB_390913 | WB (1:1000) |
| Antibody | HRP-conjugated anti-HA antibody (rat monoclonal) | Roche | Cat# 12 013 819 001, RRID:AB_390917 | WB (1:3000) |
| Antibody | anti-Cdk1/Cdc2 (PSTAIR)(rabbit polyclonal) | Millipore | Cat#: 06–923; RRID:AB_310302 | WB (1:1000) |
| Antibody | anti-Mouse IgG- peroxidase (goat polyclonal) | Sigma Aldrich | Cat#: A5278; RRID:AB_258232 | WB (1:2000) |
| Antibody | anti-Rabbit IgG- peroxidase (goat polyclonal) | Sigma Aldrich | Cat#: A6667; RRID:AB_258307 | WB (1:2000) |
| Commercial assay, kit | ECL Western Blotting Reagents | GE-Healthcare | Cat#: RPN2106 | |
| Chemical compound, drug | β-estradiol | Sigma Aldrich | Cat#: E2758 | 10–500 µM |
| Chemical compound, drug | PhosTag acrylamide | Wako Chemical | Cat#: 300–93523 | 15 µM |
| Chemical compound, drug | PP1 Analog III, 3-MB-PP1 | Sigma Aldrich | Cat#: 529582 | 1 μM |
| Chemical compound, drug | Alexa fluor 488-conjugated phalloidin | Thermo Fischer Scientific | Cat#: A12379 | 200 units/ml (~6.6 µM) |
| Chemical compound, drug | Soybean lectin | Sigma Aldrich | Cat#: L2650 | 1 mg/ml |
| Software, algorithm | ImageJ | ImageJ | https://imagej.net/Fiji/Downloads | Quantification of Western blots and microscopic analysis |
| Software, algorithm | Graphpad Prism 9.0.2 | Graphpad | https://www.graphpad.com/scientific-software/prism// | Statistical analysis and graphs representation |
| Software, algorithm | Ilastik | Ilastik | https://www.ilastik.org/ | Segmentation toolkit |
| Other | μ-Slide 8 well | Ibidi | Cat#: 80826 | For time-lapse imaging of CAR dynamics. (Microscopy analysis; Materials and Methods section) |
Additional files
-
MDAR checklist
- https://cdn.elifesciences.org/articles/83285/elife-83285-mdarchecklist1-v2.pdf
-
Supplementary file 1
S.pombe strains used in this study.
- https://cdn.elifesciences.org/articles/83285/elife-83285-supp1-v2.docx
-
Supplementary file 2
Oligonucleotides and DNA fragments used in this study.
- https://cdn.elifesciences.org/articles/83285/elife-83285-supp2-v2.docx
Download links
A two-part list of links to download the article, or parts of the article, in various formats.
Downloads (link to download the article as PDF)
Open citations (links to open the citations from this article in various online reference manager services)
Cite this article (links to download the citations from this article in formats compatible with various reference manager tools)
Myosin II regulatory light chain phosphorylation and formin availability modulate cytokinesis upon changes in carbohydrate metabolism
eLife 12:e83285.
https://doi.org/10.7554/eLife.83285


