Glycolytic flux-signaling controls mouse embryo mesoderm development
- Developmental Biology Unit, European Molecular Biology Laboratory, Germany
- Structural and Computational Biology Unit, European Molecular Biology Laboratory, Germany
Figures
Figure 1 with 1 supplement
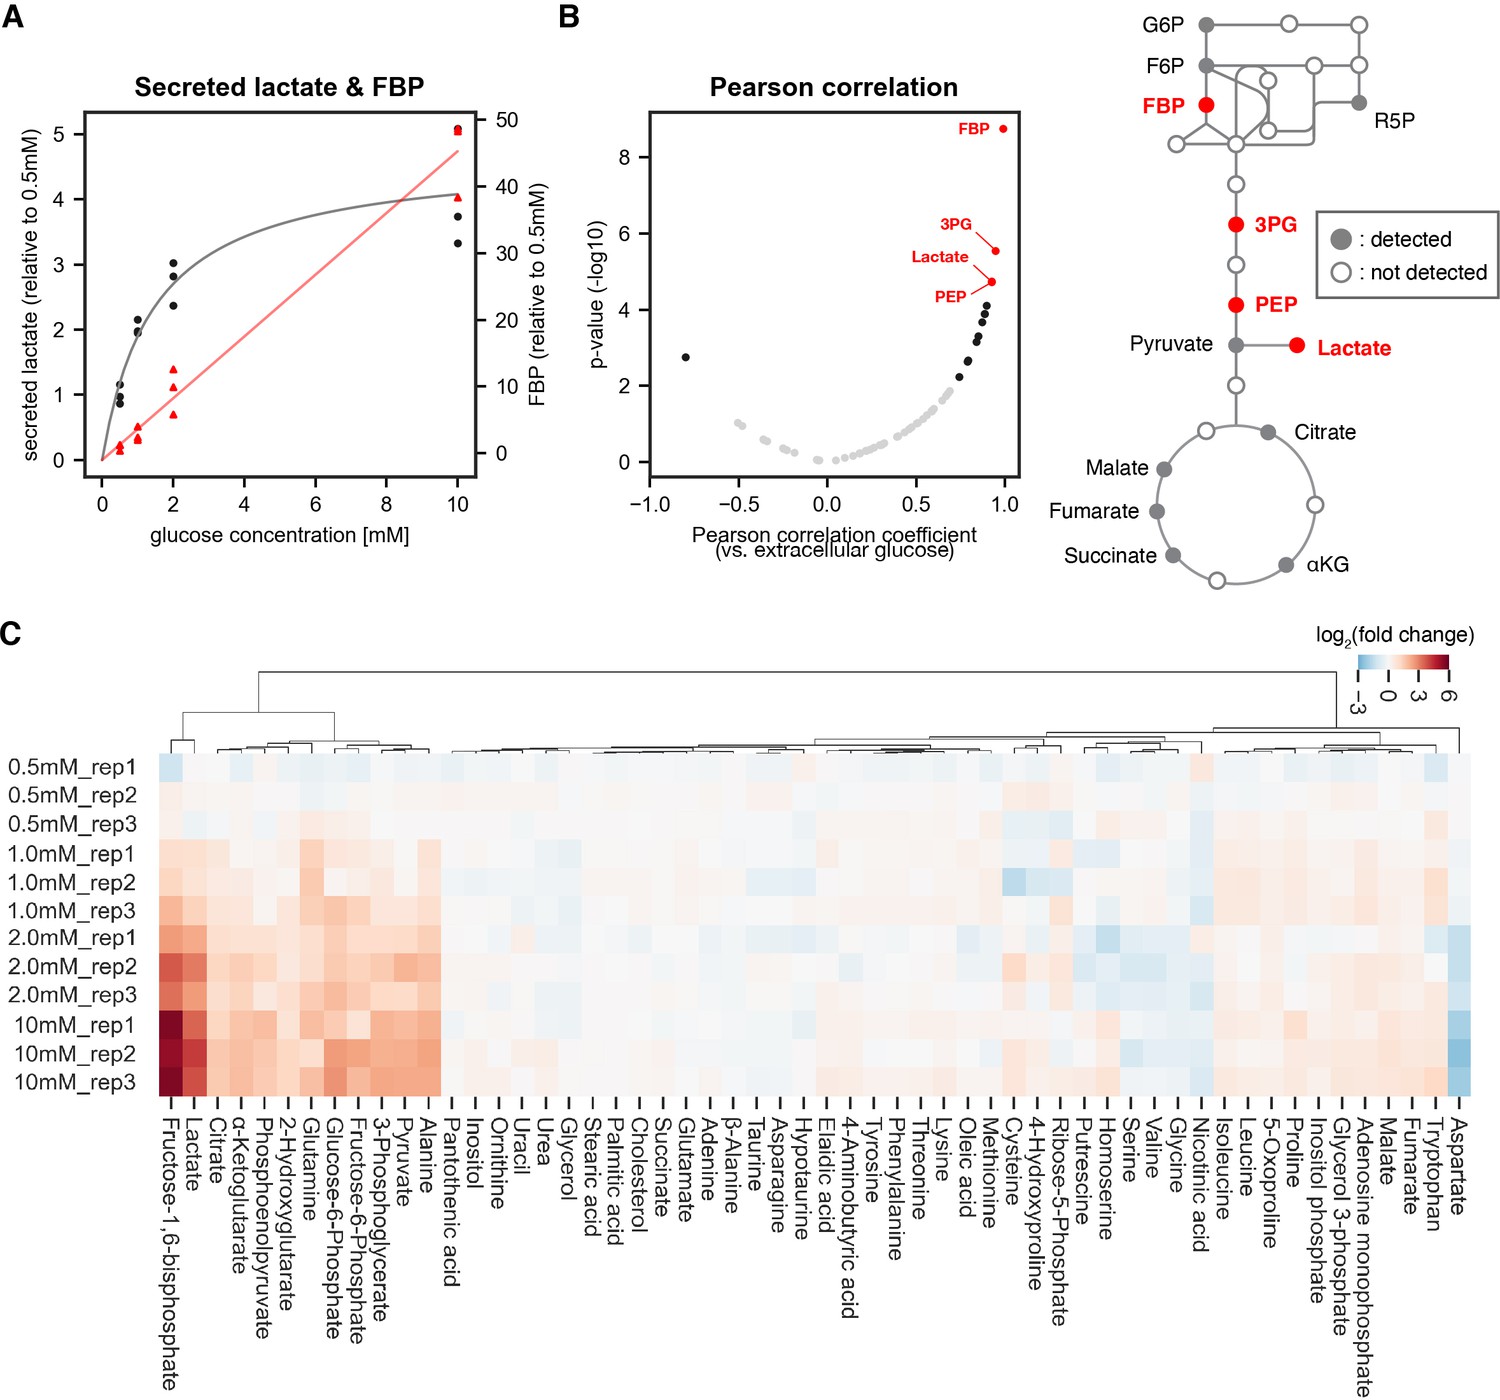
Identifying sentinel metabolites that mirror glycolytic flux.
The amount of secreted lactate and intracellular metabolites within PSM explants were measured by gas chromatography mass spectrometry (GC-MS; n=3 biological replicates for each condition). The explants were cultured for 3 hr ex vivo in 0.5 mM, 1.0 mM, 2.0 mM, or 10 mM glucose. (A) The relative amount of secreted lactate (shown in black circles) and intracellular fructose 1,6-bisphosphate (FBP; shown in red triangles) under various glucose conditions. The gray and red lines show the Michaelis-Menten fit (Vmax = 4.7 arbitrary unit, Km = 1.5 mM) for secreted lactate and the linear regression line for intracellular FBP, respectively. (B) Pearson correlation analysis between intracellular metabolite levels and extracellular glucose levels. Metabolites showing significant correlation (p-value < 0.01) are shown in black. Those with a |Pearson correlation coefficient|>0.9 are highlighted in red. Abbreviations: G6P, glucose 6-phosphate; F6P, fructose 6-phosphate; R5P, ribose 5-phosphate; FBP, fructose 1,6-bisphosphate; 3 PG, 3-phosphoglycerate; PEP, phosphoenol pyruvate; αKG, α-ketoglutarate. (C) Hierarchical clustering heatmap of metabolites detected in the PSM explants. Fold changes were calculated using 0.5 mM glucose condition as the reference. Hierarchical clustering was performed using Ward’s method with Euclidean distance.
Figure 1—figure supplement 1
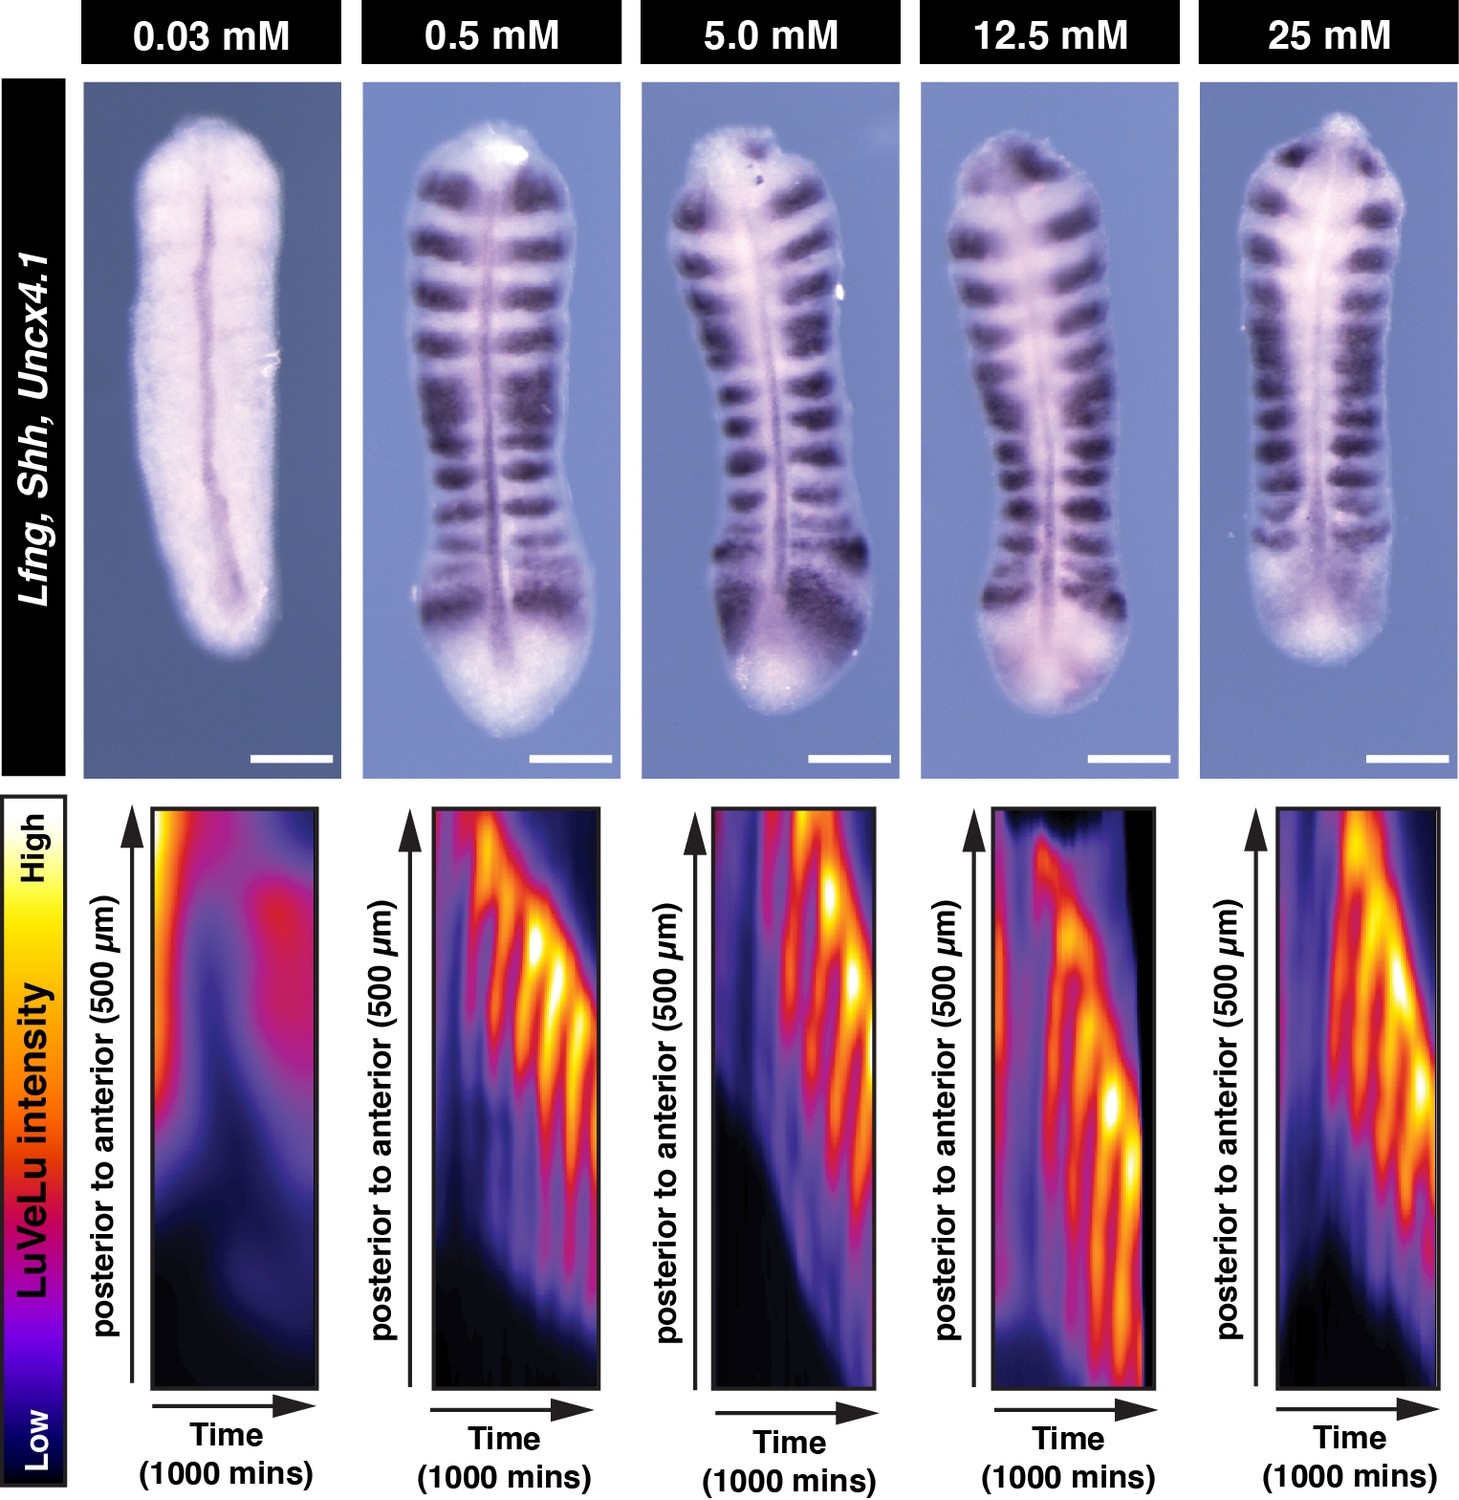
Effects of glucose titration on PSM patterning.
Whole mount in situ hybridization analysis for Lfng, Shh, and Uncx4.1 gene expressions in the PSM. PSM explants were incubated for 13 hr ex vivo in different glucose conditions. Kymographs show ongoing oscillatory dynamics of the Notch signaling activity reporter LuVeLu in the PSM in all conditions but 0.03 mM glucose condition. Scale bar, 100 µm.
Figure 2 with 2 supplements
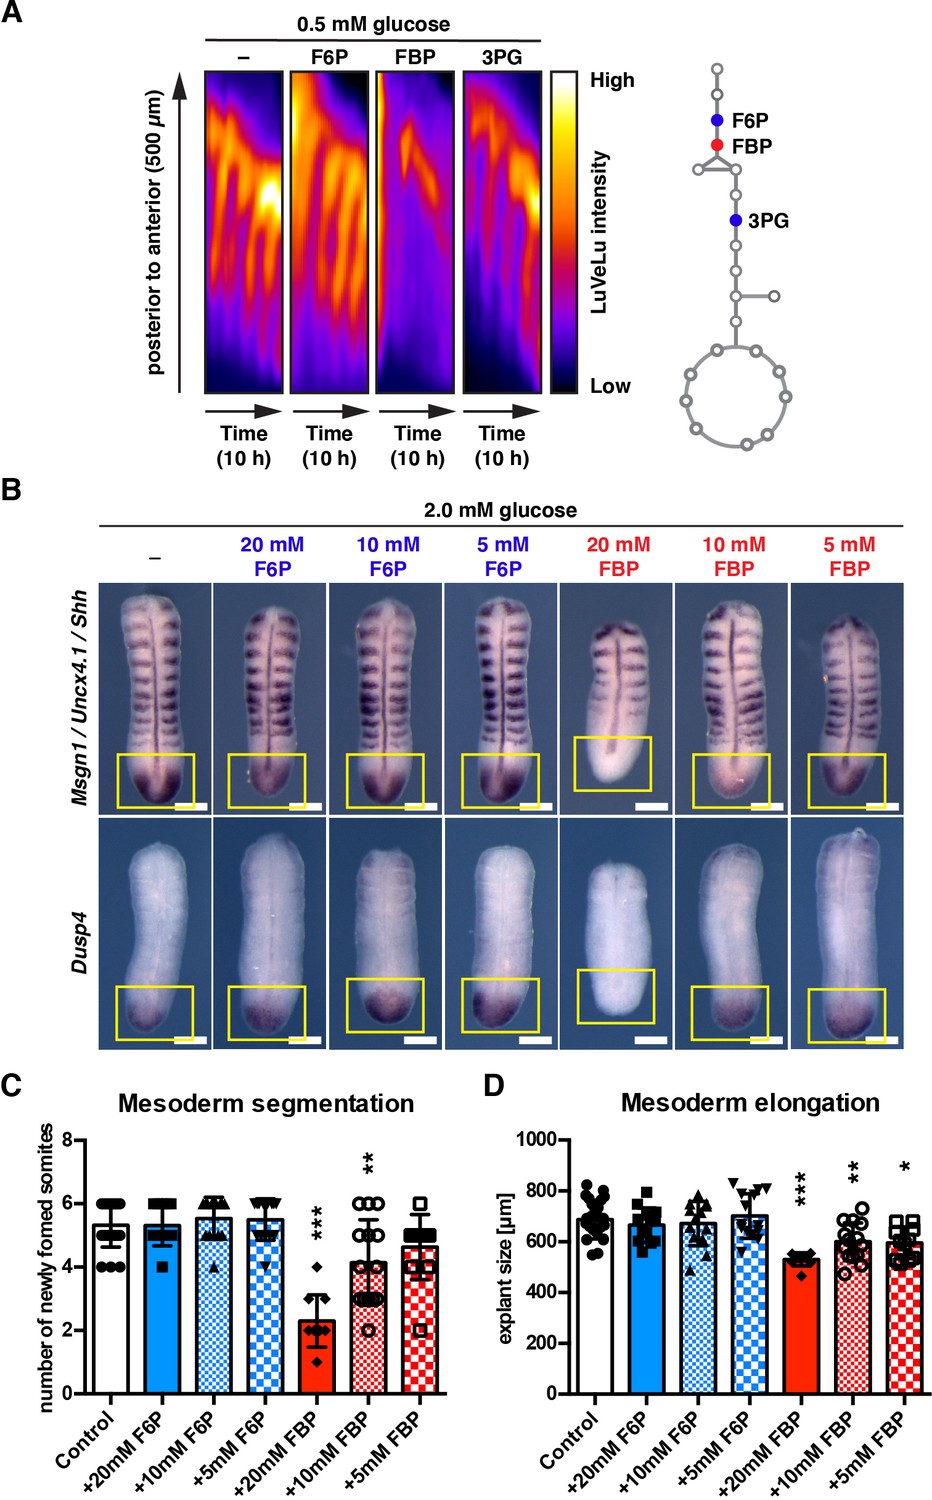
FBP supplementation impacts mesoderm segmentation and elongation in a dose-dependent manner.
(A) Kymographs showing dynamics of the Notch signaling activity reporter LuVeLu in PSM explants treated with 20 mM of the indicated metabolite. (B) Whole mount in situ hybridization analysis for the FGF (i.e. Dusp4) and the Wnt target (i.e. Msgn1) gene expression in the PSM. PSM explants were incubated for 12 hr in the presence of F6P or FBP. Expression domains of Dusp4 and Msgn1 are indicated by yellow squares. Shh and Uncx4.1 were used as markers for the neural tissue and posterior somite boundary, respectively. Scale bar, 200 µm. (C, D) The number of newly formed somites (C) and the length of PSM explants (D) after 12 hr ex vivo culture (one-way ANOVA with Tukey’s post-hoc test, *p-value <0.05, **p-value <0.01, ***p-value <0.001 versus control).
Figure 2—figure supplement 1
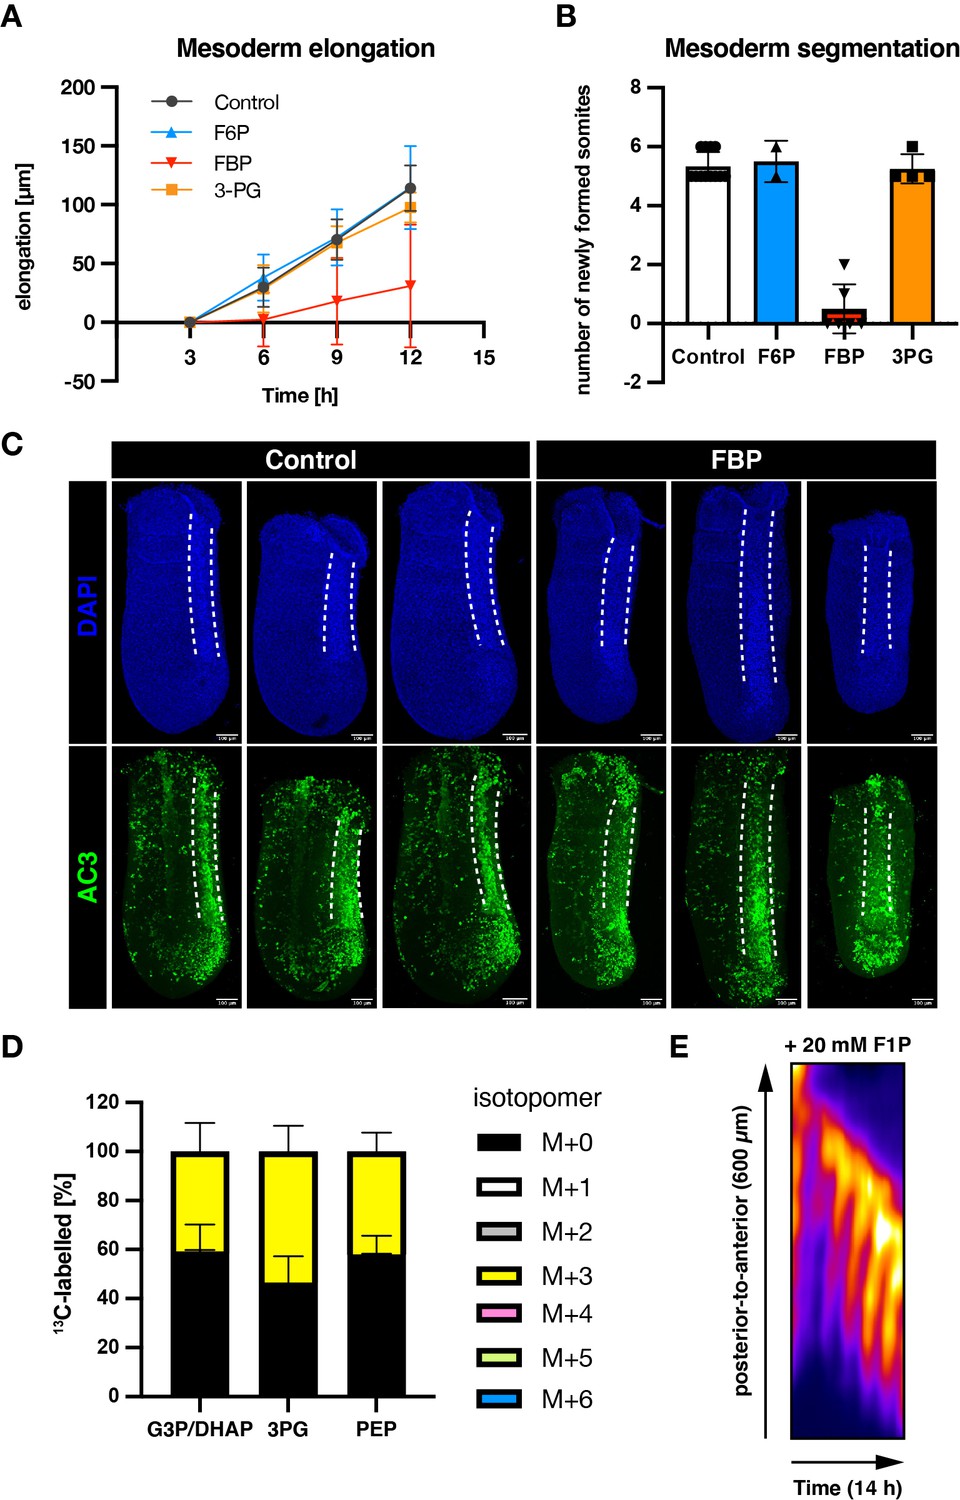
Effects of medium-supplementation of glycolytic intermediates on mesoderm elongation and segmentation.
(A) Elongation of PSM explants during ex vivo culture. The explants were cultured in the medium containing 0.5 mM glucose and supplemented with 20 mM of F6P/FBP/3 PG. The length of explants at 3 hr incubation was used as the reference. (B) The number of newly formed somites during 12 hr ex vivo incubation. (C) Immunostaining of active caspase-3 (AC3) in PSM explants cultured for 3 hr with or without 20 mM of FBP. Neural tubes were outlined by white dotted lines. (D) 13C-tracing experiments with fully 13C-labelled FBP (13C6-FBP). The PSM explants were cultured for 3 hr in the medium containing 2.0 mM of glucose and supplemented with 20 mM 13C6-FBP. (E) Kymographs showing dynamics of the Notch signaling activity reporter LuVeLu in the PSM. Explants were cultured in medium containing 0.5 mM glucose and supplemented with 20 mM fructose 1-phosphate (F1P).
Figure 2—figure supplement 2
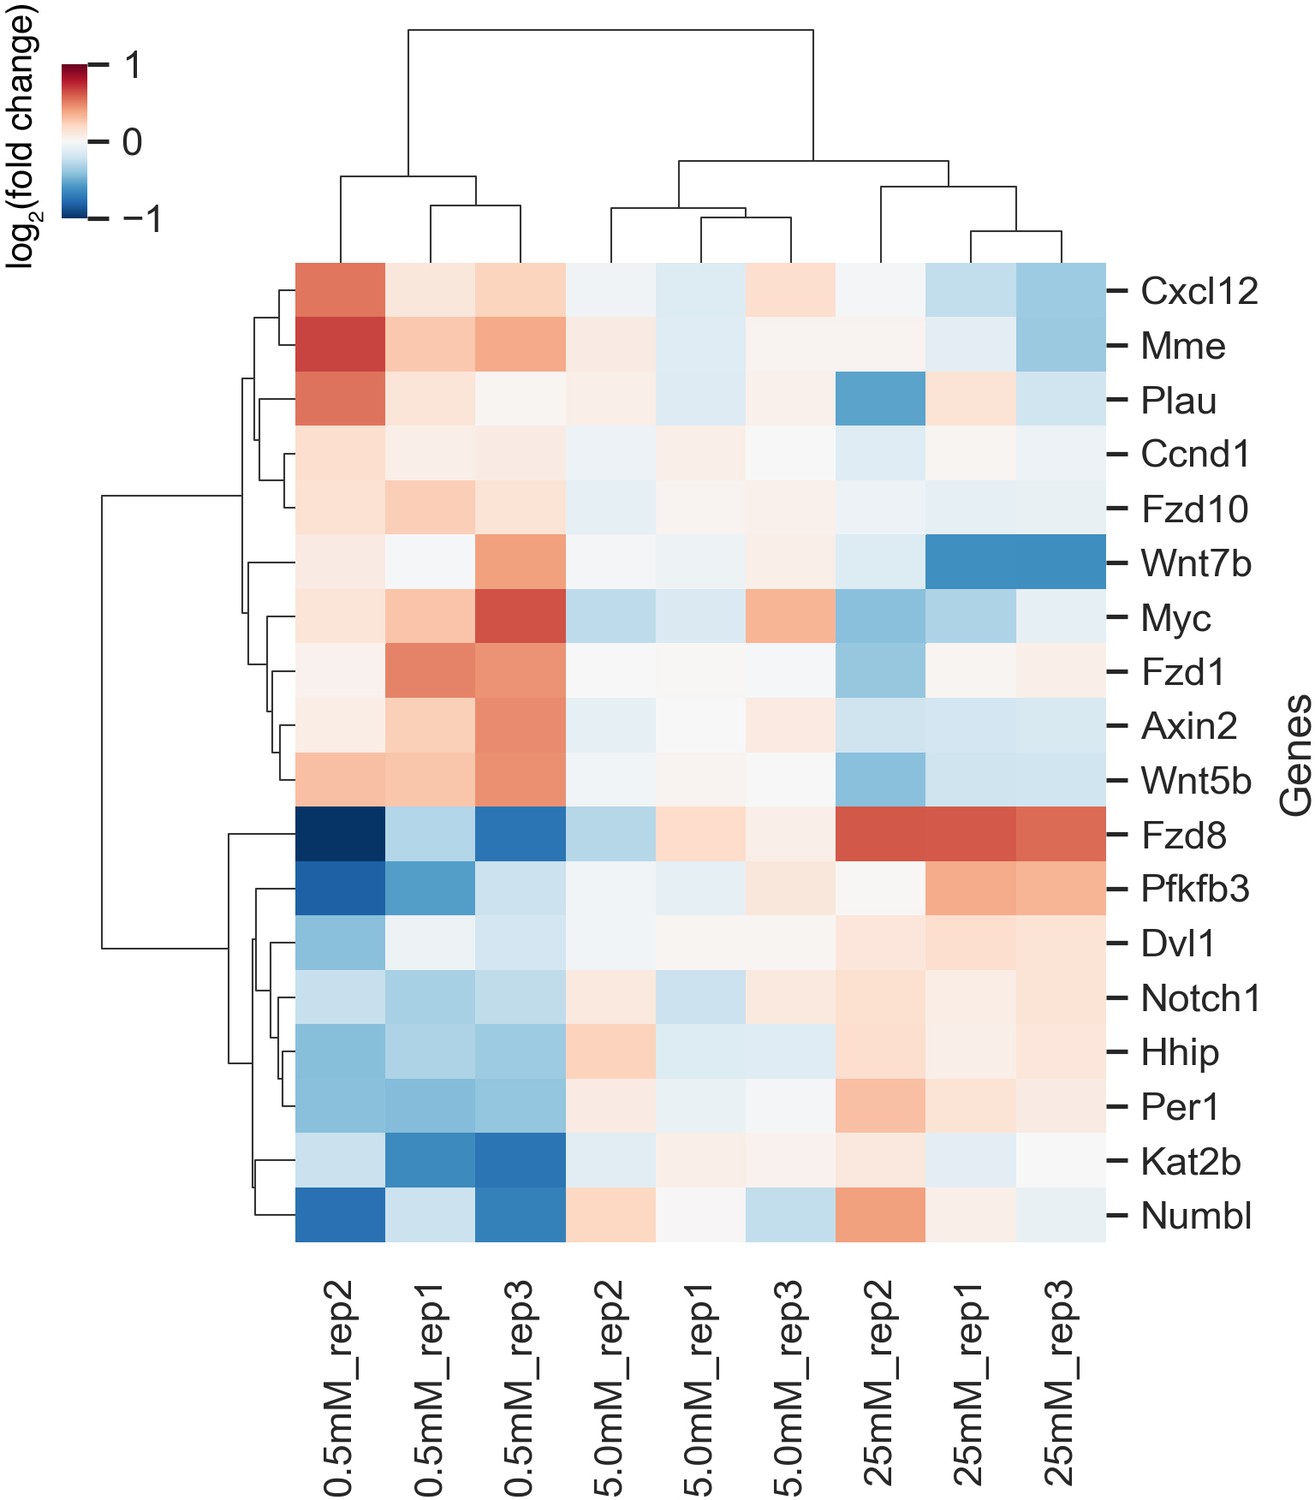
Modulation of Wnt-target gene expression upon glucose titration within PSM cells.
Hierarchical clustering heatmap of genes whose expression levels showed linear correlation with extracellular glucose concentrations (linear regression analysis; adjusted P-value < 0.1). Following 3 hr culture at varying concentrations of glucose, expressions of 237 genes were analyzed in the posterior PSM using the NanoString nCounter Analysis System. These genes included ones involved in glucose metabolism, Notch-, Wnt-, and FGF-signaling pathways. Fold changes were calculated using 5.0 mM glucose condition as the reference. Hierarchical clustering was performed using Ward’s method with Euclidean distance.
Figure 3 with 1 supplement

cytoPFKFB3 overexpression causes an increase in glycolytic flux and FBP levels within PSM cells.
(A) Conditional cytoPFKFB3 transgenic mice were generated to activate glycolysis through allosteric activation of Pfk. (B) Quantification of secreted lactate in control and cytoPFKFB3 transgenic PSM explants cultured for 12 hr under varying concentrations of glucose (unpaired Welch’s t-test, *p-value <0.05, **p-value <0.01). (C, D) Measurement of steady state metabolite levels by GC-MS (n=4 biological replicates for each condition) in control (Ctrl) and cytoPFKFB3 (Tg; crossed to HprtCre line) explants cultured for 3 hr in medium containing 10 mM glucose. SAM (Significance Analysis for Microarrays) analysis was performed using a significance threshold = 0.9, which corresponds to a false discovery rate (FDR)=0.012. G6P, glucose 6-phosphate. FBP, fructose 1,6-bisphosphate. 3 PG, 3-phosphoglycerate. PEP, phosphoenol pyruvate. Asp, aspartate. Asn, asparagine. (E) Targeted metabolomics analysis by liquid chromatography-mass spectrometry (LC-MS). Relative FBP levels were determined in control and cytoPFKFB3 explants cultured for 3 hr in various culture conditions (2 G: 2.0 mM glucose, 10 G: 10 mM glucose, 25 G: 25 mM glucose, F6P: 2.0 mM glucose plus 20 mM F6P; n=3 biological replicates for each culture condition). Unpaired Welch’s t-test (***p-value <0.001 vs. Ctrl-10G).
Figure 3—figure supplement 1
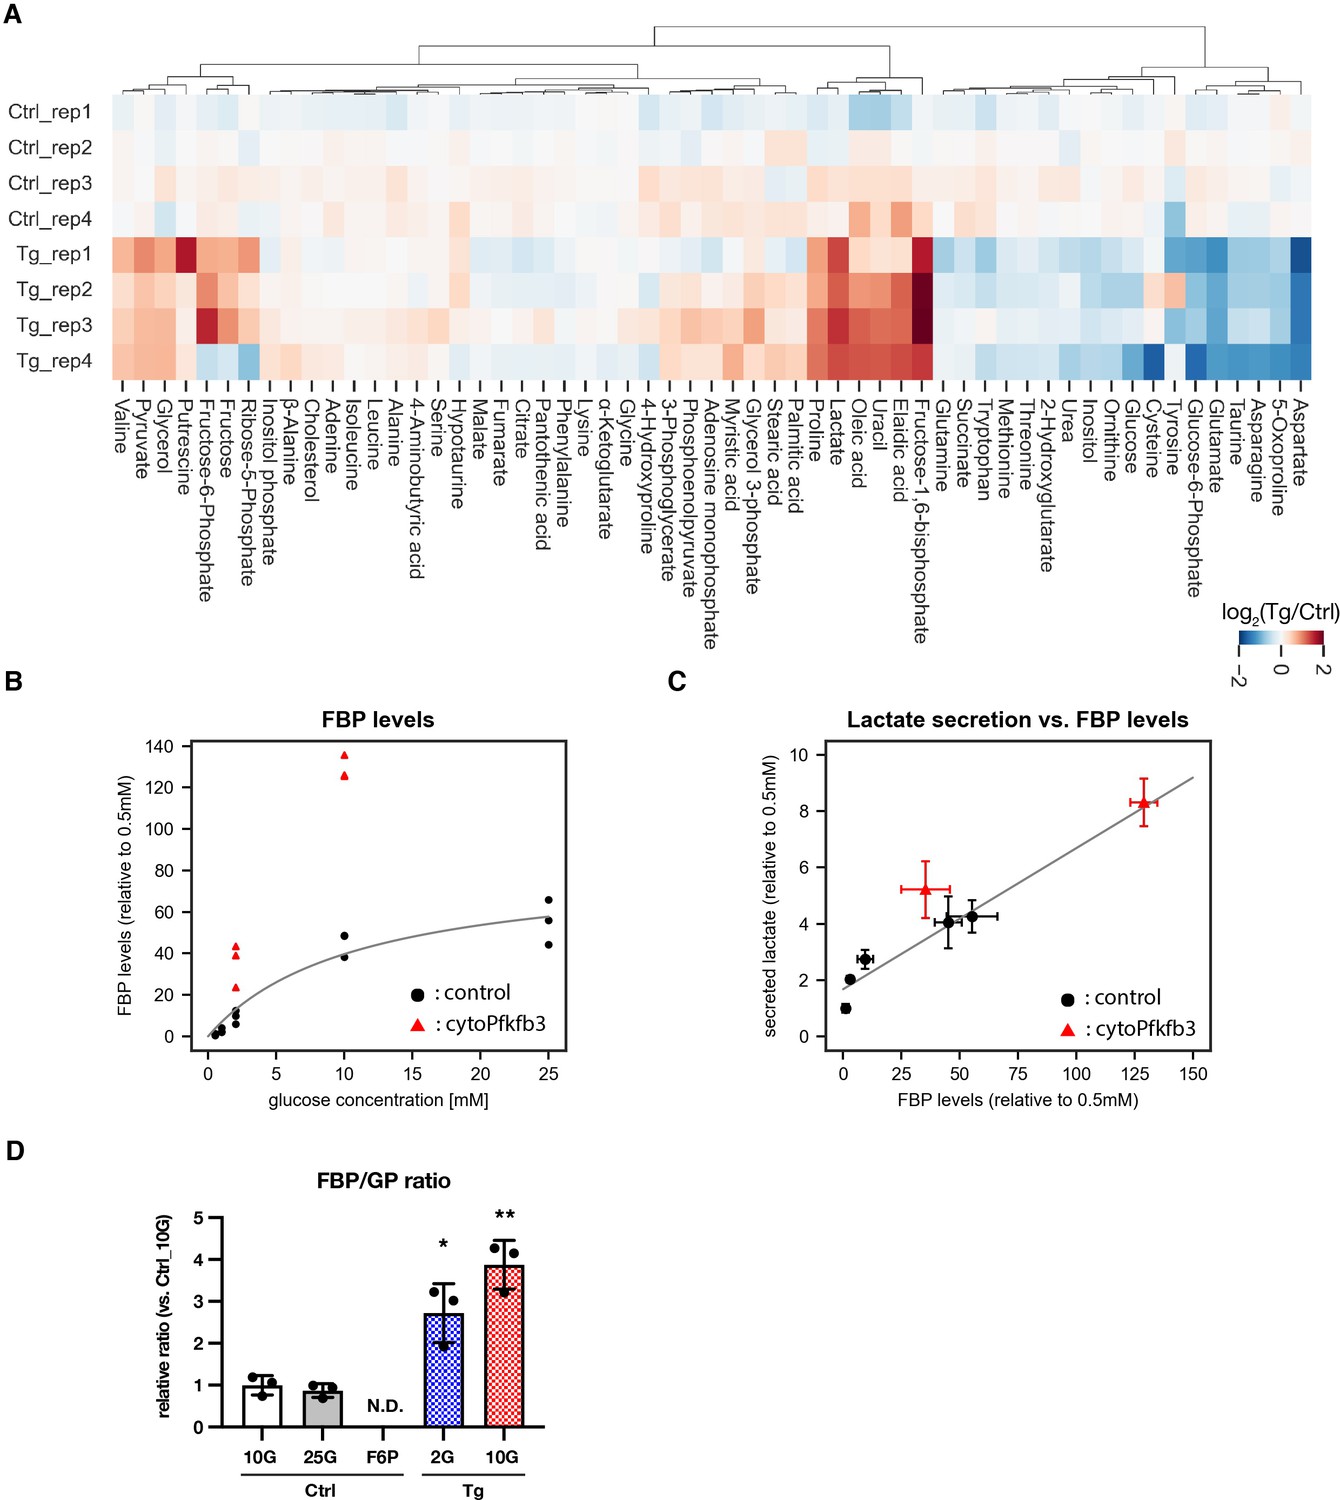
Steady state measurements of metabolites within cytoPFKFB3 and control PSM explants by GC-MS.
(A) Hierarchical clustering heatmap of metabolites detected in PSM explants. Metabolomics analysis was performed following 3 hr culture of PSM explants at 10 mM glucose cocentration (n=4 biological replicates for each condition). Hierarchical clustering was performed using Ward’s method with Euclidean distance. Ctrl, control explants; Tg, cytoPFKFB3 explants (crossed to HprtCre line). (B) The steady state levels of FBP across glucose concentrations in control and cytoPFKFB3 PSM explants. The data from Figure 1A, Figure 3B, and Figure 3E were combined. The gray line shows the Michaelis-Menten fit to the data from control samples. (C) A correlation between lactate secretion and FBP levels. The data from Figure 1A, Figure 3B, and Figure 3E were combined. A linear regression line was fitted to the data from control samples (Pearson correlation coefficient = 0.93, p-value = 0.02). (D) The ratios between FBP and glucose mono-phosphate (GP; i.e. glucose 6-phosphate, fructose 6-phosphate) levels were determined in control and cytoPFKFB3 explants cultured for 3 hr in various culture conditions (2 G: 2.0 mM glucose, 10 G: 10 mM glucose, 25 G: 25 mM glucose, F6P: 2.0 mM glucose plus 20 mM F6P). Unpaired Welch’s t-test (*p-value < 0.05, **p-value < 0.01 vs. Ctrl-10G). N.D., not determined.
Figure 4 with 2 supplements
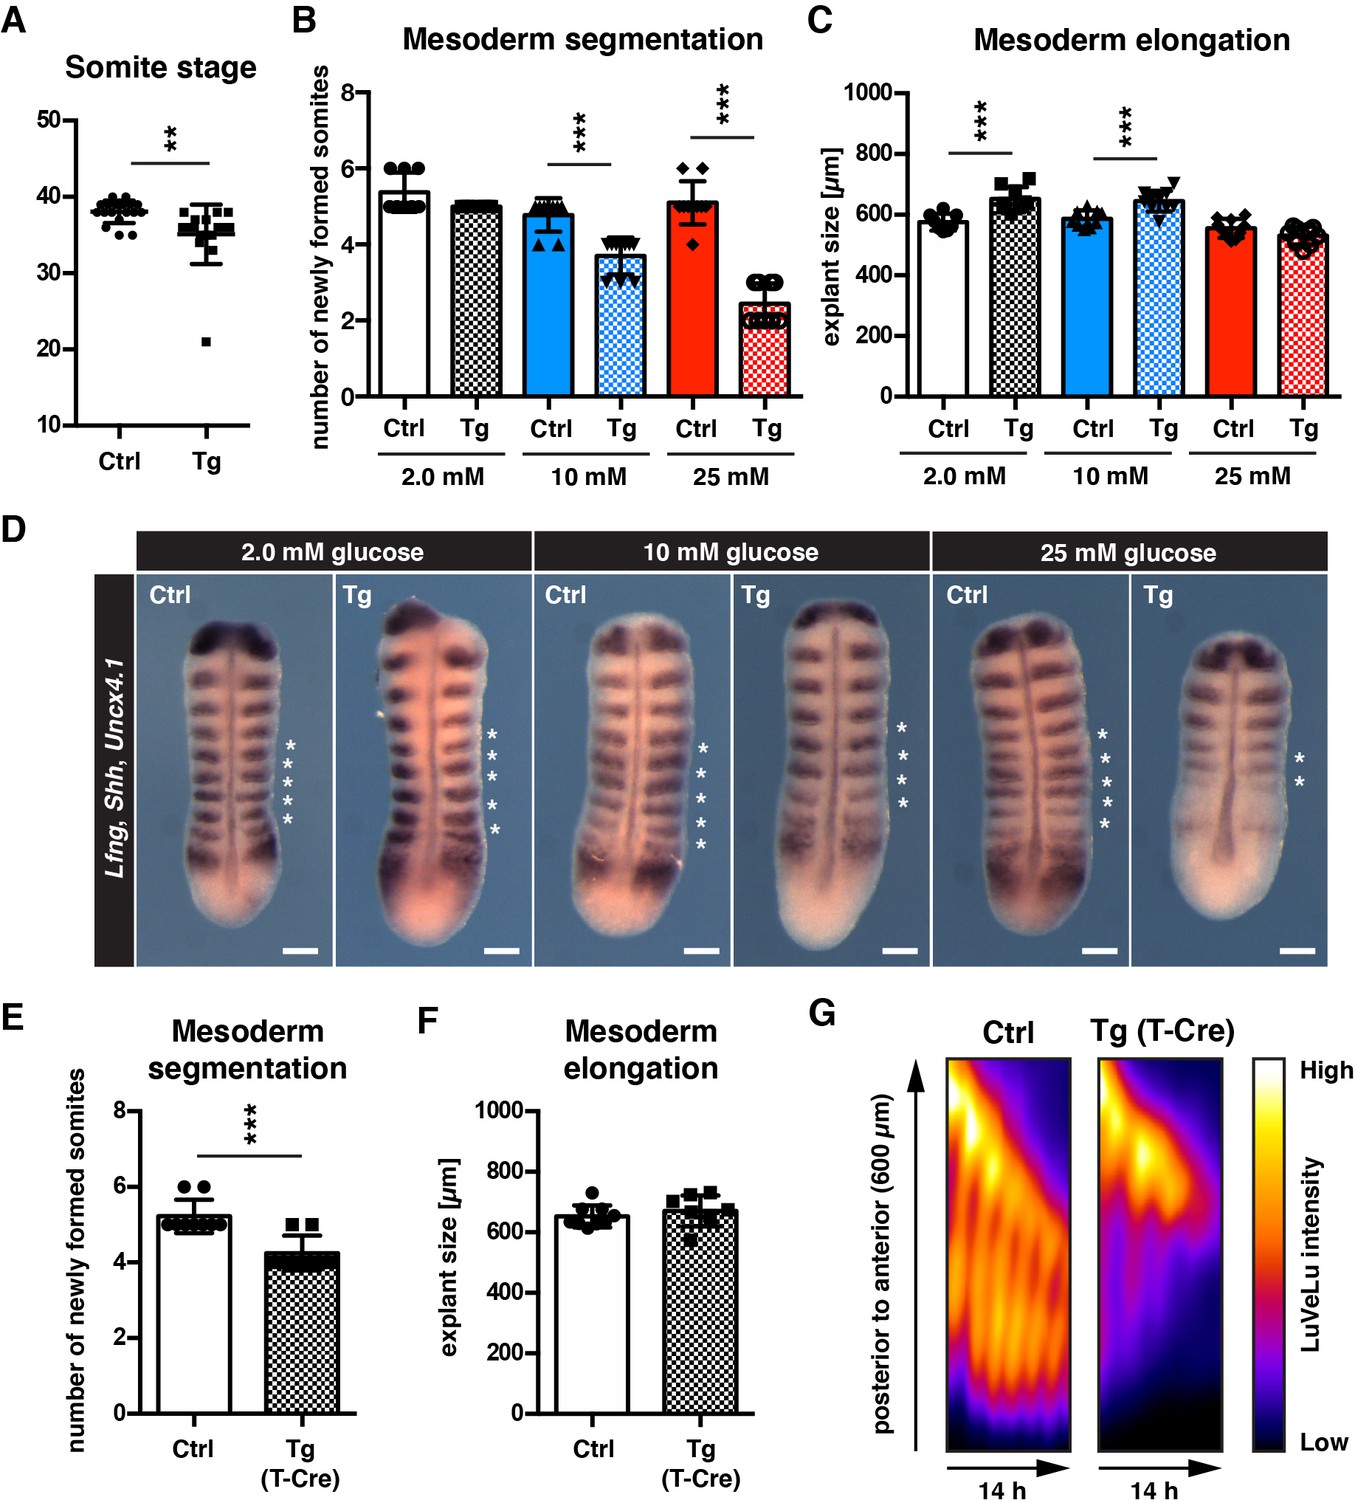
cytoPFKFB3 overexpression impacts mesoderm development in a glucose-concentration dependent manner.
(A) Total number of somites in E10.5 embryos (mean ±s.d; unpaired Welch’s t-test; **p-value <0.01). Ctrl, control embryos; Tg, cytoPFKFB3 embryos (crossed to HprtCre line). (B,C) Number of formed somites and quantification of PSM explant length after 12 hr in vitro culture. (D) Whole mount mRNA in situ hybridization analysis for Lfng, Shh, and Uncx4.1 in PSM explants after 12 hr in vitro culture at varying glucose concentrations. Asterisks denote somites that formed during the in vitro culture. Scale bar, 100 µm. (E,F) Effect of mesoderm-specific overexpression of cytoPFKFB3 on PSM segmentation and elongation (12 hr incubation). The PSM explants were cultured in medium containing 10 mM glucose. Bar graphs show the number of newly formed somites during the culture (E), and the length of explants after the culture (F; mean ±s.d; unpaired Welch’s t-test; ***p-value <0.001). (G) Real-time quantification of segmentation clock activity using Notch signaling activity reporter LuVeLu in PSM explants, shown as kymographs. Note that oscillatory reporter activity ceased in cytoPFKFB3/T-Cre samples during the experiment, while control samples showed ongoing periodic activity.
Figure 4—figure supplement 1
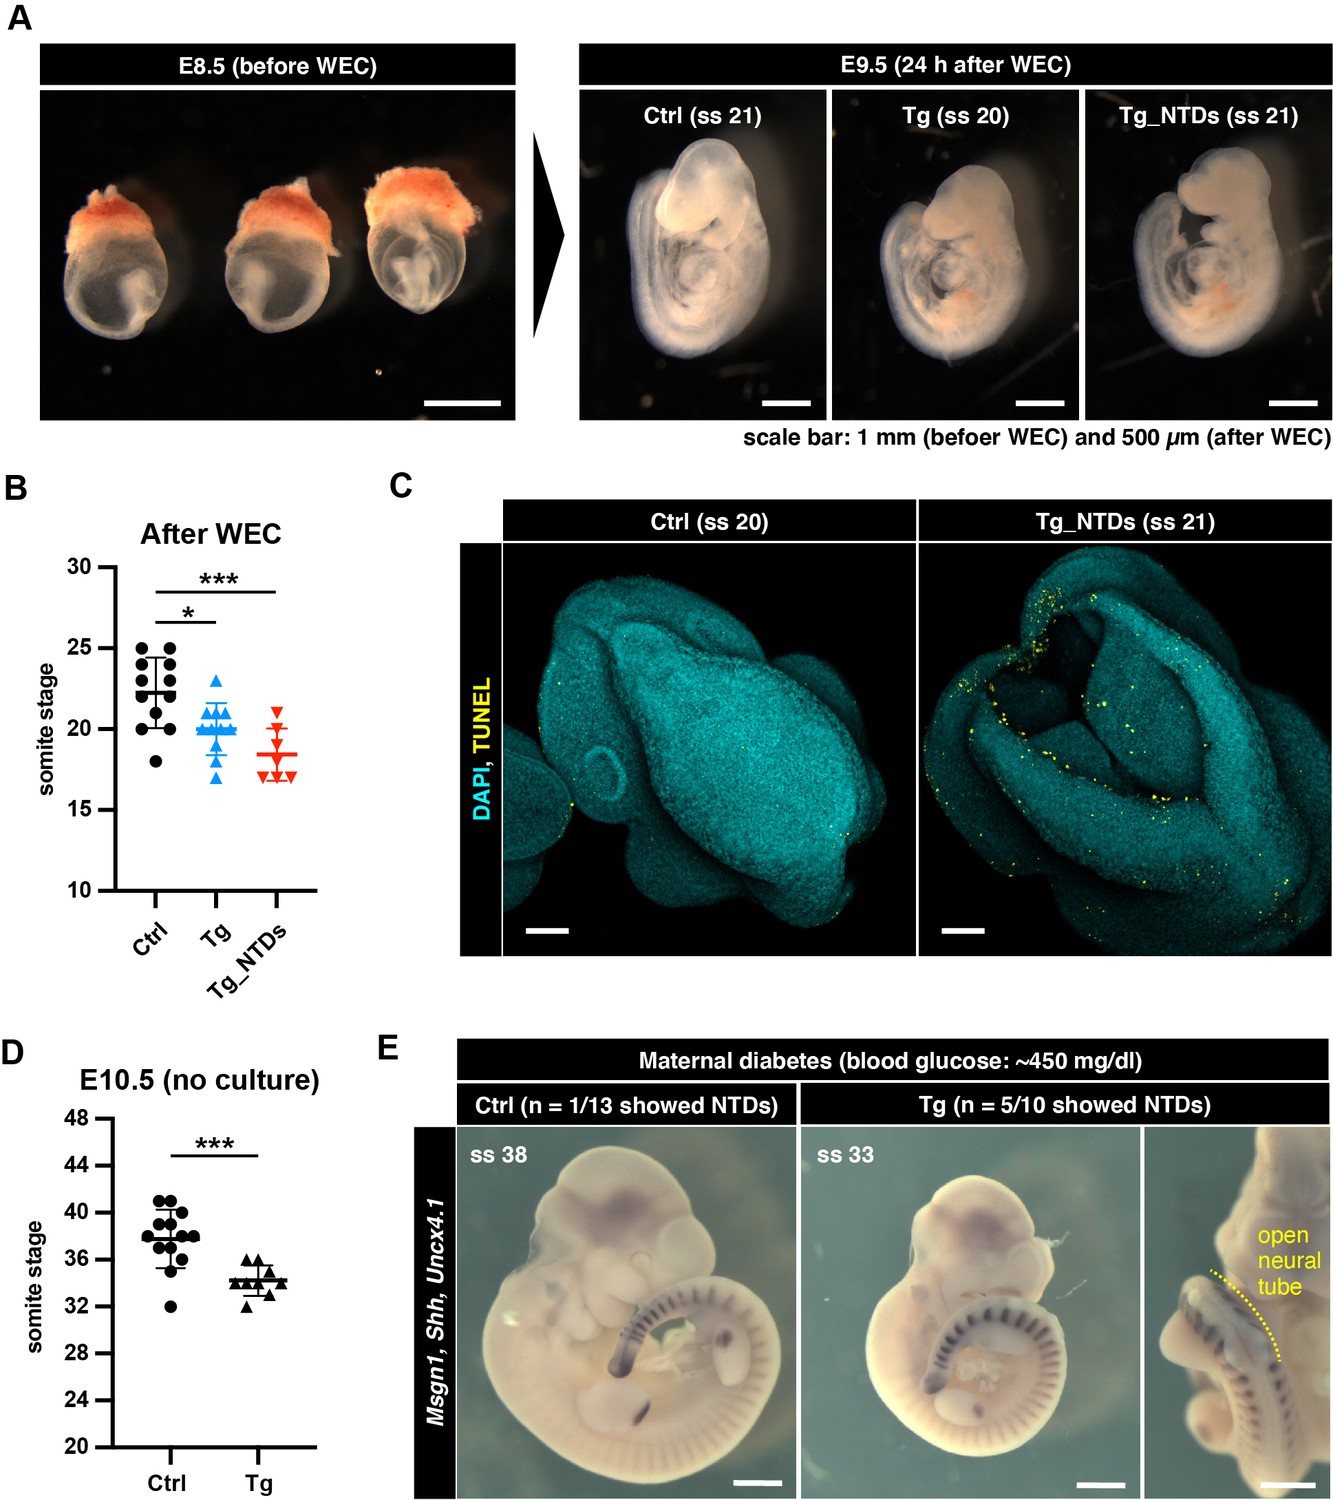
Phenotype of cytoPFKFB3 embryos in vivo is dependent on maternal glucose conditions.
(A) E8.5 embryos with the intact yolk sac were cultured for 24 hr at normoglycemic conditions using the whole embryo roller-culture (WEC) system. (B) Total number of somites after 24 hr of WEC. Data are represented as mean ±s.d (one-way ANOVA with Tukey’s post hoc test; *p-value <0.05, ***p-value <0.001). Ctrl, control embryos; Tg, cytoPFKFB3 embryos (crossed to HprtCre line); Tg_NTDs, cytoPFKFB3 embryos with neural tube closure defects. (C) DAPI and TUNEL staining of the embryos following WEC. Midbrain region of the embryos is shown. Scale bar, 100 µm (ss, somite stage). (D) Total number of somites in E10.5 embryos isolated from Akita heterozygous (i.e. diabetic) females (mean ±s.d; unpaired Welch’s t-test; ***p-value <0.001). Ctrl, control embryos; Tg, cytoPFKFB3 embryos (crossed to HprtCre line). (E) Whole mount mRNA in situ hybridization for Msgn1, Shh, and Uncx4.1 in E10.5 embryos. Scale bar, 500 µm (ss, somite stage).
Figure 4—video 1
Real-time imaging of control and cytoPFKFB3/T-Cre explants expressing the Notch signaling reporter LuVeLu.
Figure 5
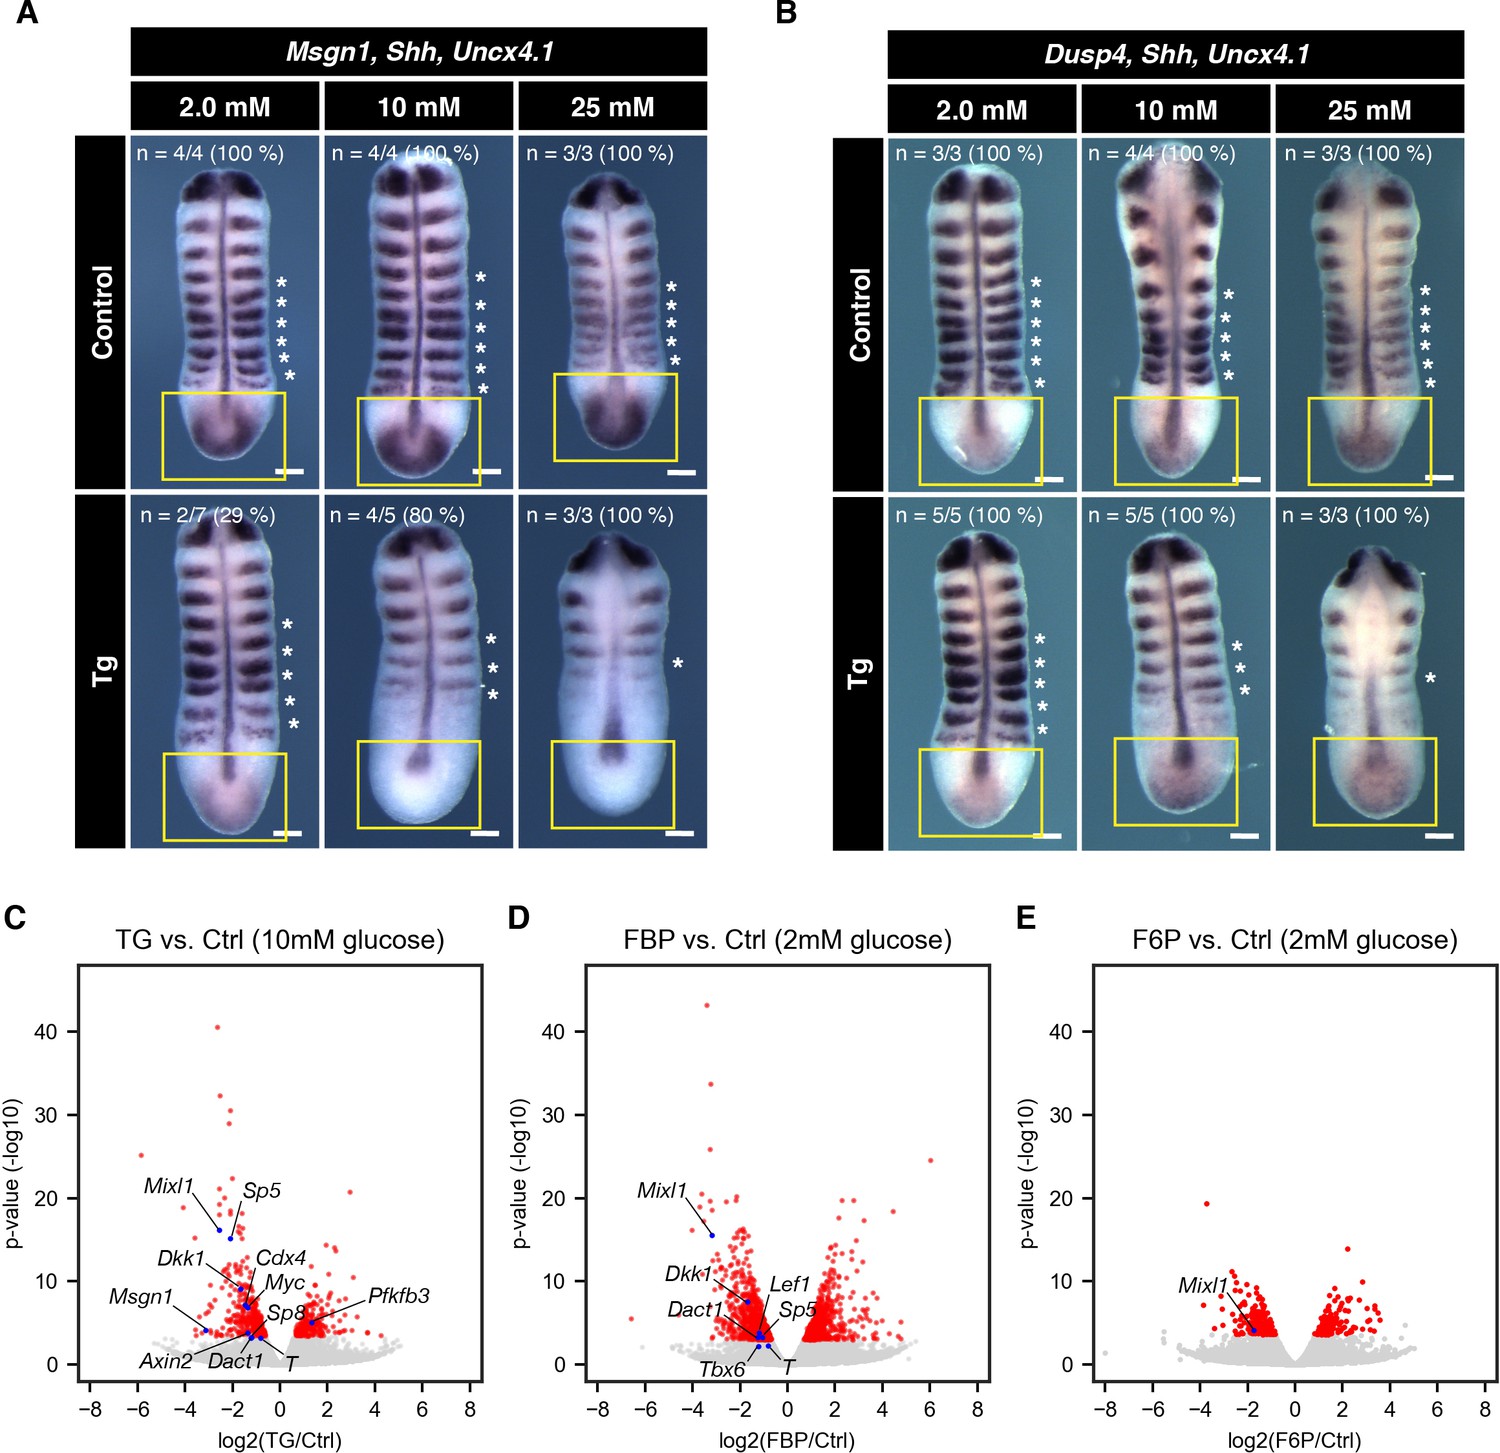
Effect of cytoPFKFB3 overexpression on Wnt and FGF target gene expression.
(A,B) Whole mount mRNA in situ hybridization for Msgn1 (Wnt-target gene) and Dusp4 (FGF-target gene) in the PSM explants. Explants were cultured for 12 hr under various glucose conditions, as indicated. Shh and Uncx4.1 were used as markers for neural tissue and posterior somite boundary, respectively. Expression domain of Msgn1 and Dusp4 is indicated by yellow rectangles. Note the glucose-dose dependent loss of Msgn1 expression in cytoPFKFB3 explants (Tg; crossed to HprtCre line). In contrast, Dusp4 expression appeared unaffected in cytoPFKFB3 explants. Asterisks mark somites that formed during the culture. Scale bar, 100 µm. (C–E) Transcriptome analysis of PSM explants cultured for 3 hr in vitro (n=3 biological replicates for each culture condition). Gene expression profiles were compared between control and cytoPFKFB3 explants (C), control and FBP (20 mM)-treated explants (D), or control and F6P (20 mM)-treated explants (E). Among differentially expressed genes (adjusted p-value <0.01; shown in red), Wnt-target genes and PFKFB3 were marked by blue.
Figure 6 with 1 supplement
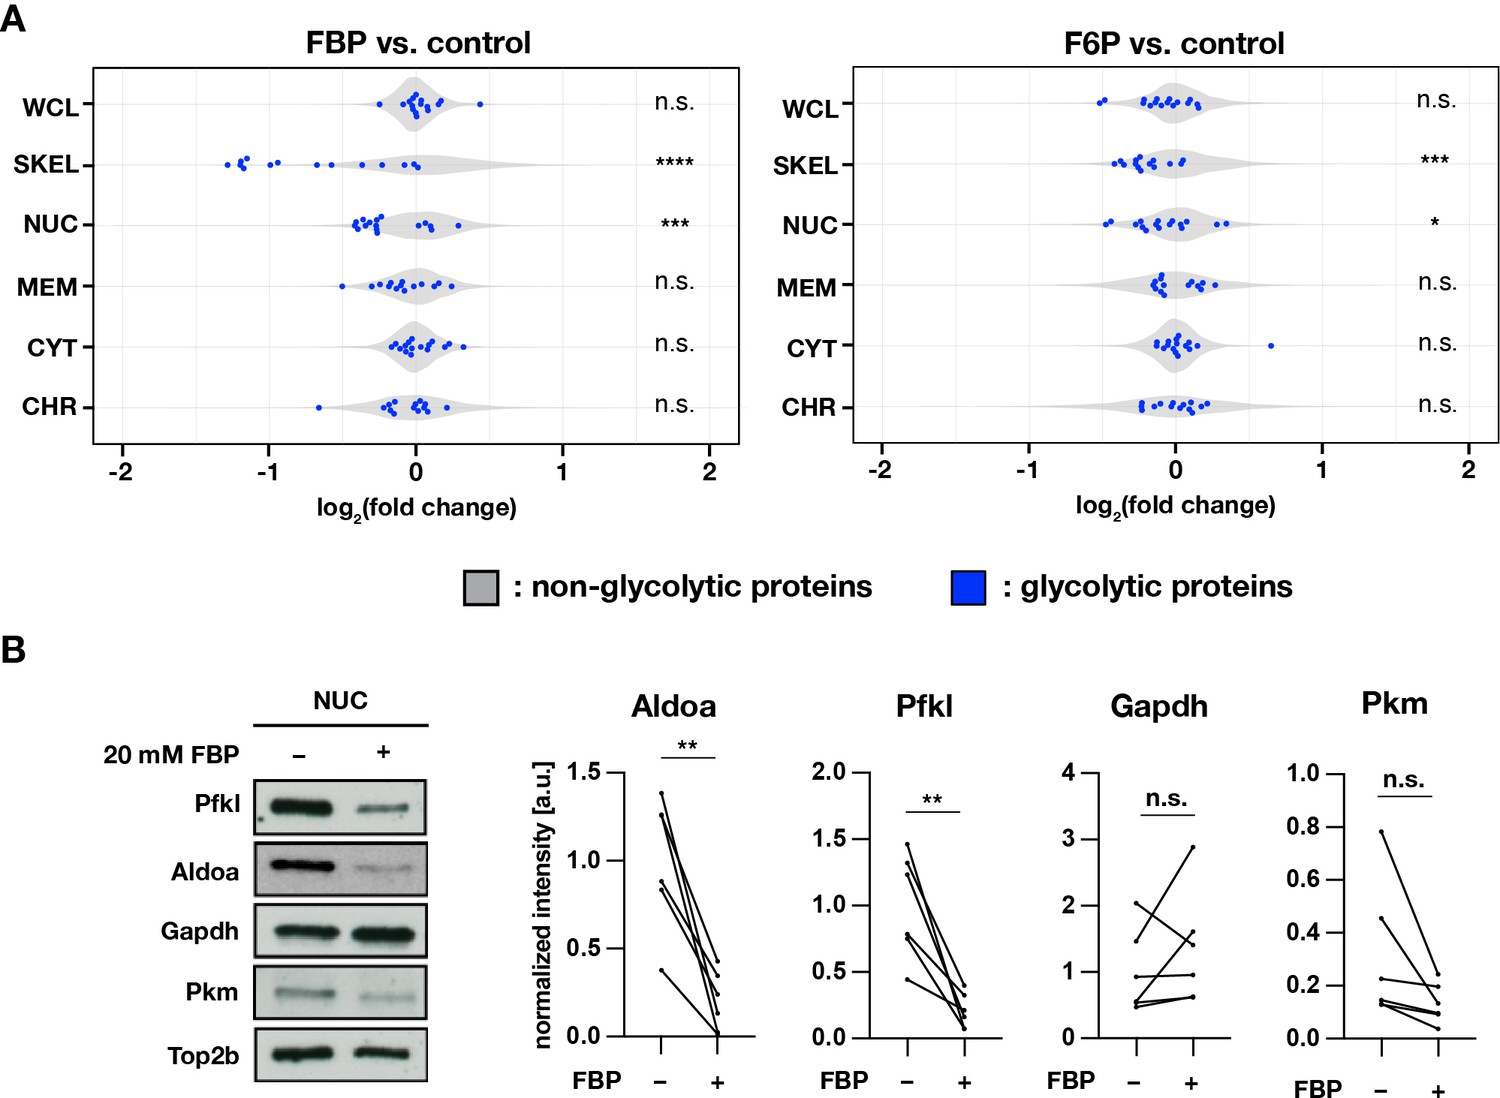
Subcellular localization of glycolytic enzymes are responsive to FBP treatment.
(A) Effects of FBP treatment on subcellular localization of glycolytic enzymes. PSM explants were cultured for 3 hr in media containing 2.0 mM glucose and supplemented with 20 mM F6P or FBP. In addition to whole cell lysates (WCL), protein extracts were prepared from cytoplasmic (CYT), membrane (MEM), nuclear-soluble (NUC), chromatin-bound (CHR), and cytoskeletal (SKEL) fractions (n=3 biological replicates). Abundance ratios (log2(F6P/FBP-treated/control)) of glycolytic enzymes (in blue) were compared to those of non-glycolytic proteins (the rest, in gray) for statistical analysis (unpaired two-sample Wilcoxon test, *p-value <0.05, ***p-value <0.001, ****p-value <0.0001, n.s., not significant). (B) Effects of FBP on the abundance of glycolytic enzymes in the nuclear soluble fraction. Subcellular protein fractionation was performed following 1 hr incubation of PSM explants in the media containing 0.5 mM glucose and supplemented with 20 mM FBP (n=6 biological replicates; paired t-test, **p-value <0.01, n.s., not significant).
-
Figure 6—source data 1
Uncropped, unedited blots for Figure 6B.
- https://cdn.elifesciences.org/articles/83299/elife-83299-fig6-data1-v2.zip
Figure 6—figure supplement 1
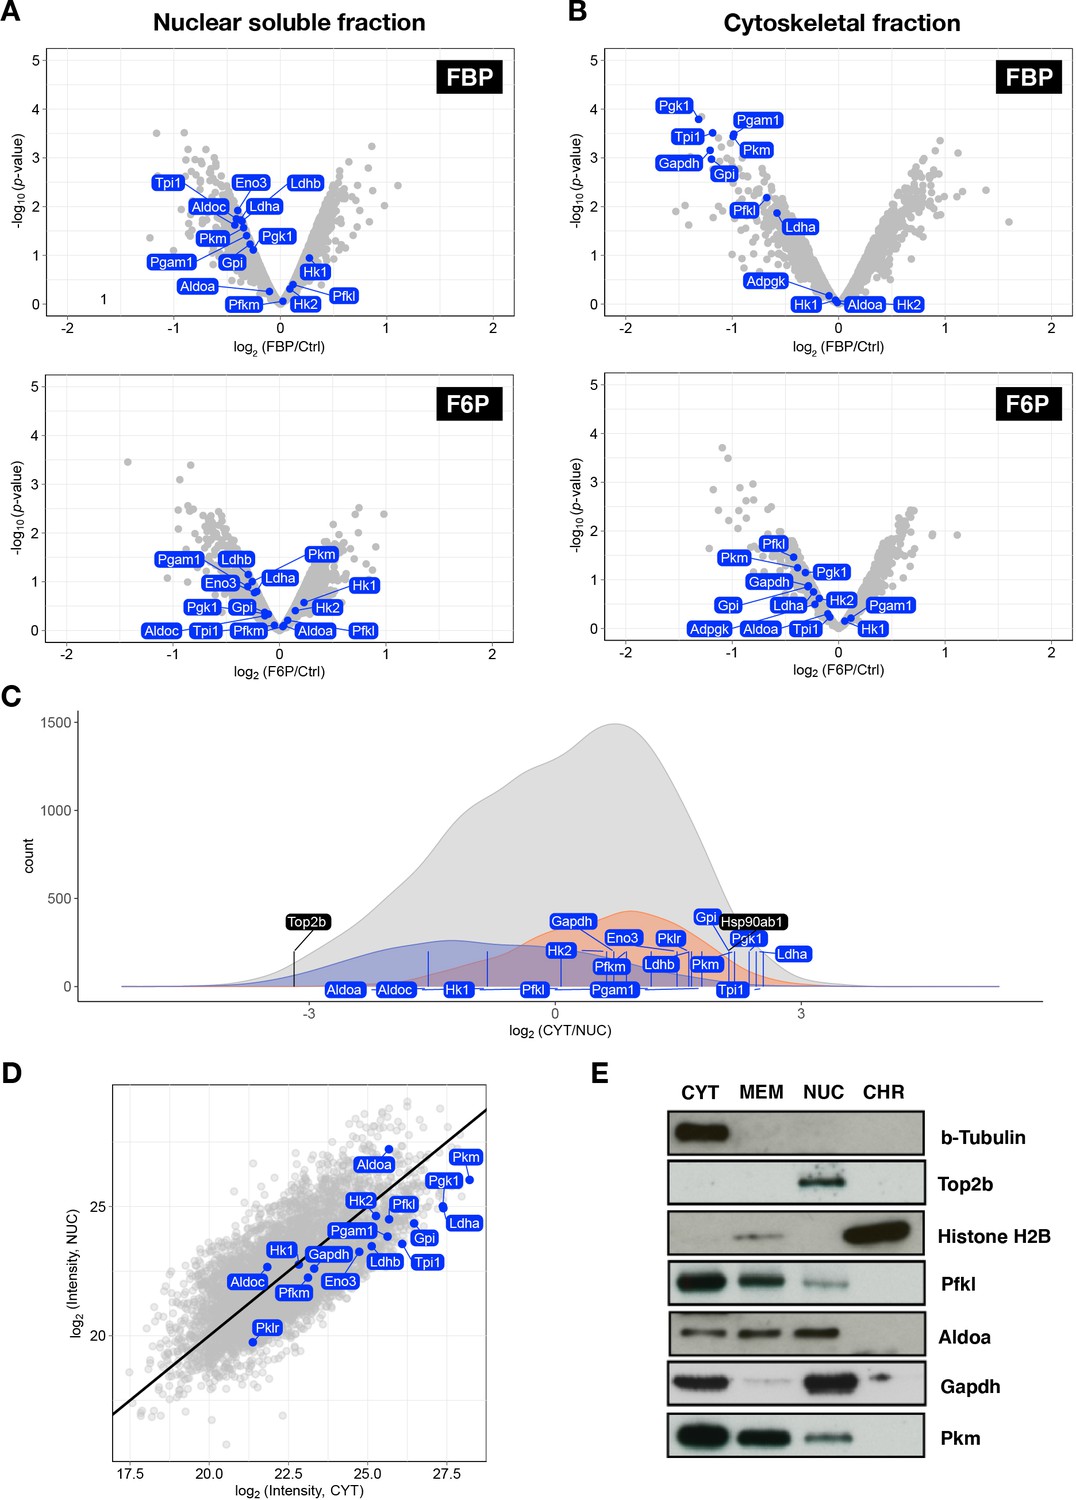
Proteome analysis of subcellular protein localization in the PSM.
(A, B) Volcano plots showing effects of FBP- or F6P-treatment on abundance of proteins in nuclear-soluble (A) or cytoskeletal fractions (B). Subcellular protein fractionation was performed following 3 hr culture of PSM explants in the medium containing 2.0 mM glucose and supplemented with 20 mM FBP or F6P. Glycolytic proteins are highlighted in blue. (C) Density plot showing the number of proteins that are annotated to nuclear (shown in blue) or cytoplasmic (shown in orange) compartments (based on GO term). PSM explants cultured in the control medium containing 2.0 mM gluocse were used for the analysis. All the detected-proteins are shown in gray. Glycolytic proteins are highlihgted by blue lines, and marker proteins for the nuclear-soluble (i.e. Top2b) and cytoplasmic (i.e. Hsp90ab1) fractions are highlihgted by black lines. (D) Abundance ratio of glycolytic proteins (marked by blue) between nuclear-soluble (NUC) and cytoplasmic (CYT) fractions. (E) Western blot analysis of glycolytic proteins following subcellular protein fractionation of the PSM explants cultured in the control medium containing 0.5 mM glucose.
-
Figure 6—figure supplement 1—source data 1
Uncropped, unedited blots for Figure 6—figure supplement 1E.
- https://cdn.elifesciences.org/articles/83299/elife-83299-fig6-figsupp1-data1-v2.zip
Figure 7
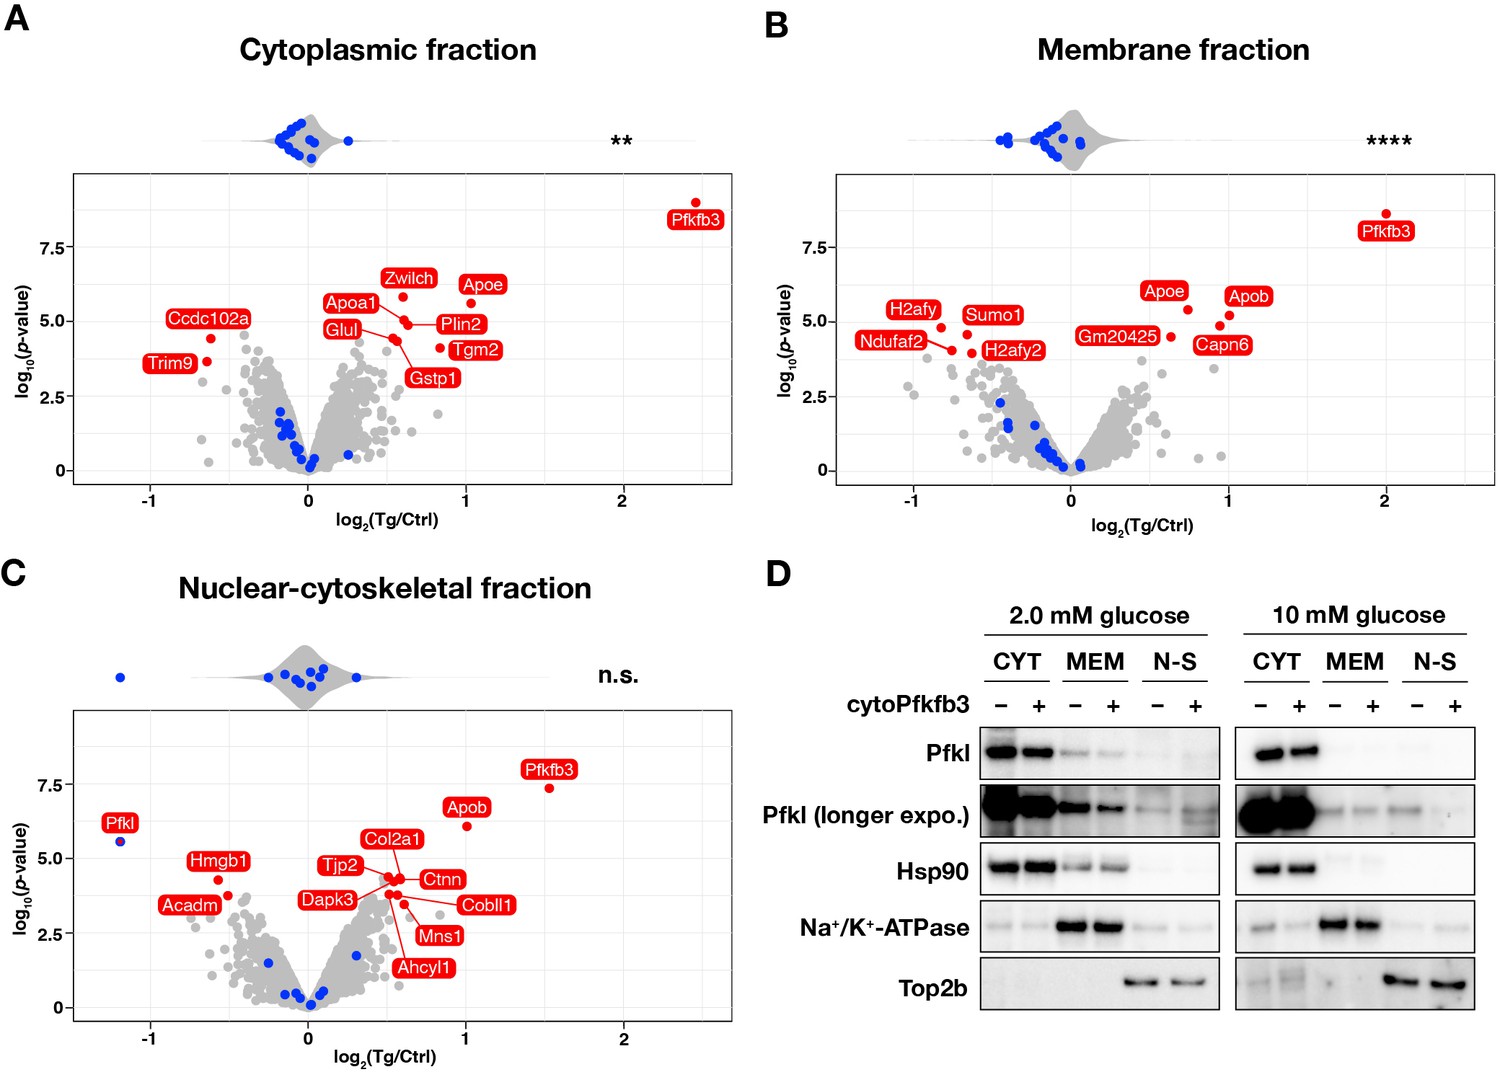
Subcellular localization of Pfkl responds to cytoPFKFB3 overexpression in a glucose-concentration dependent manner.
(A–C) Effects of cytoPFKFB3 overexpression on subcellular protein localization assessed by mass spectrometry. Following 1 hr incubation of PSM explants in 10 mM glucose, protein extracts were prepared from cytoplasmic (A), membrane (B), and nuclear-cytoskeletal (C) fractions (n=3 biological replicates for each culture condition). Proteins whose abundance showed significant changes (adjusted p-value <0.05 and |log2(fold change)|>0.5) are marked red in the volcano plots. Top violin plots show distribution of abundance changes of glycolytic (blue) and non-glycolytic (gray) proteins. Statistical comparison as in Figure 6. **p-value <0.01. Ctrl, control explants; Tg, cytoPFKFB3 explants (crossed to the HprtCre line). (D) Western-blot analysis of subcellular localization of Pfkl under different glucose conditions. Subcellular protein fractionation was performed following 1 hr incubation of PSM explants under 2.0 mM or 10 mM glucose (n=3 biological replicates for each culture condition). CYT, cytoplasmic fraction; MEM, membrane fraction; N-S, nuclear-cytoskeletal fraction.
-
Figure 7—source data 1
Uncropped, unedited blots for Figure 7D.
- https://cdn.elifesciences.org/articles/83299/elife-83299-fig7-data1-v2.zip
Additional files
-
Supplementary file 1
The list of DEGs between control and cytoPFKFB3 explants under 10 mM glucose condition.
- https://cdn.elifesciences.org/articles/83299/elife-83299-supp1-v2.xlsx
-
Supplementary file 2
GO term analysis with the DEGs identified in cytoPFKFB3 explants.
- https://cdn.elifesciences.org/articles/83299/elife-83299-supp2-v2.xlsx
-
Supplementary file 3
The list of DEGs between control and FBP-treated explants.
- https://cdn.elifesciences.org/articles/83299/elife-83299-supp3-v2.xlsx
-
Supplementary file 4
GO term analysis with the DEGs identified in FBP-treated explants.
- https://cdn.elifesciences.org/articles/83299/elife-83299-supp4-v2.xlsx
-
Supplementary file 5
The list of DEGs between control and FBP-treated explants.
- https://cdn.elifesciences.org/articles/83299/elife-83299-supp5-v2.xlsx
-
Supplementary file 6
GO term analysis with the DEGs identified in F6P-treated explants.
- https://cdn.elifesciences.org/articles/83299/elife-83299-supp6-v2.xlsx
-
MDAR checklist
- https://cdn.elifesciences.org/articles/83299/elife-83299-mdarchecklist1-v2.docx
Download links
A two-part list of links to download the article, or parts of the article, in various formats.
Downloads (link to download the article as PDF)
Open citations (links to open the citations from this article in various online reference manager services)
Cite this article (links to download the citations from this article in formats compatible with various reference manager tools)
Glycolytic flux-signaling controls mouse embryo mesoderm development
eLife 11:e83299.
https://doi.org/10.7554/eLife.83299


