A lncRNA identifies Irf8 enhancer element in negative feedback control of dendritic cell differentiation
- Department of Cell Biology, Institute of Biomedical Engineering, RWTH Aachen University Medical School, Germany
- Helmholtz Institute for Biomedical Engineering, RWTH Aachen University, Germany
- Institute for Computational Genomics, RWTH Aachen University Medical School, Germany
- Department of Hematology, Oncology, Hemostaseology, and Stem Cell Transplantation, Faculty of Medicine, RWTH Aachen University, Germany
Figures
Figure 1 with 3 supplements
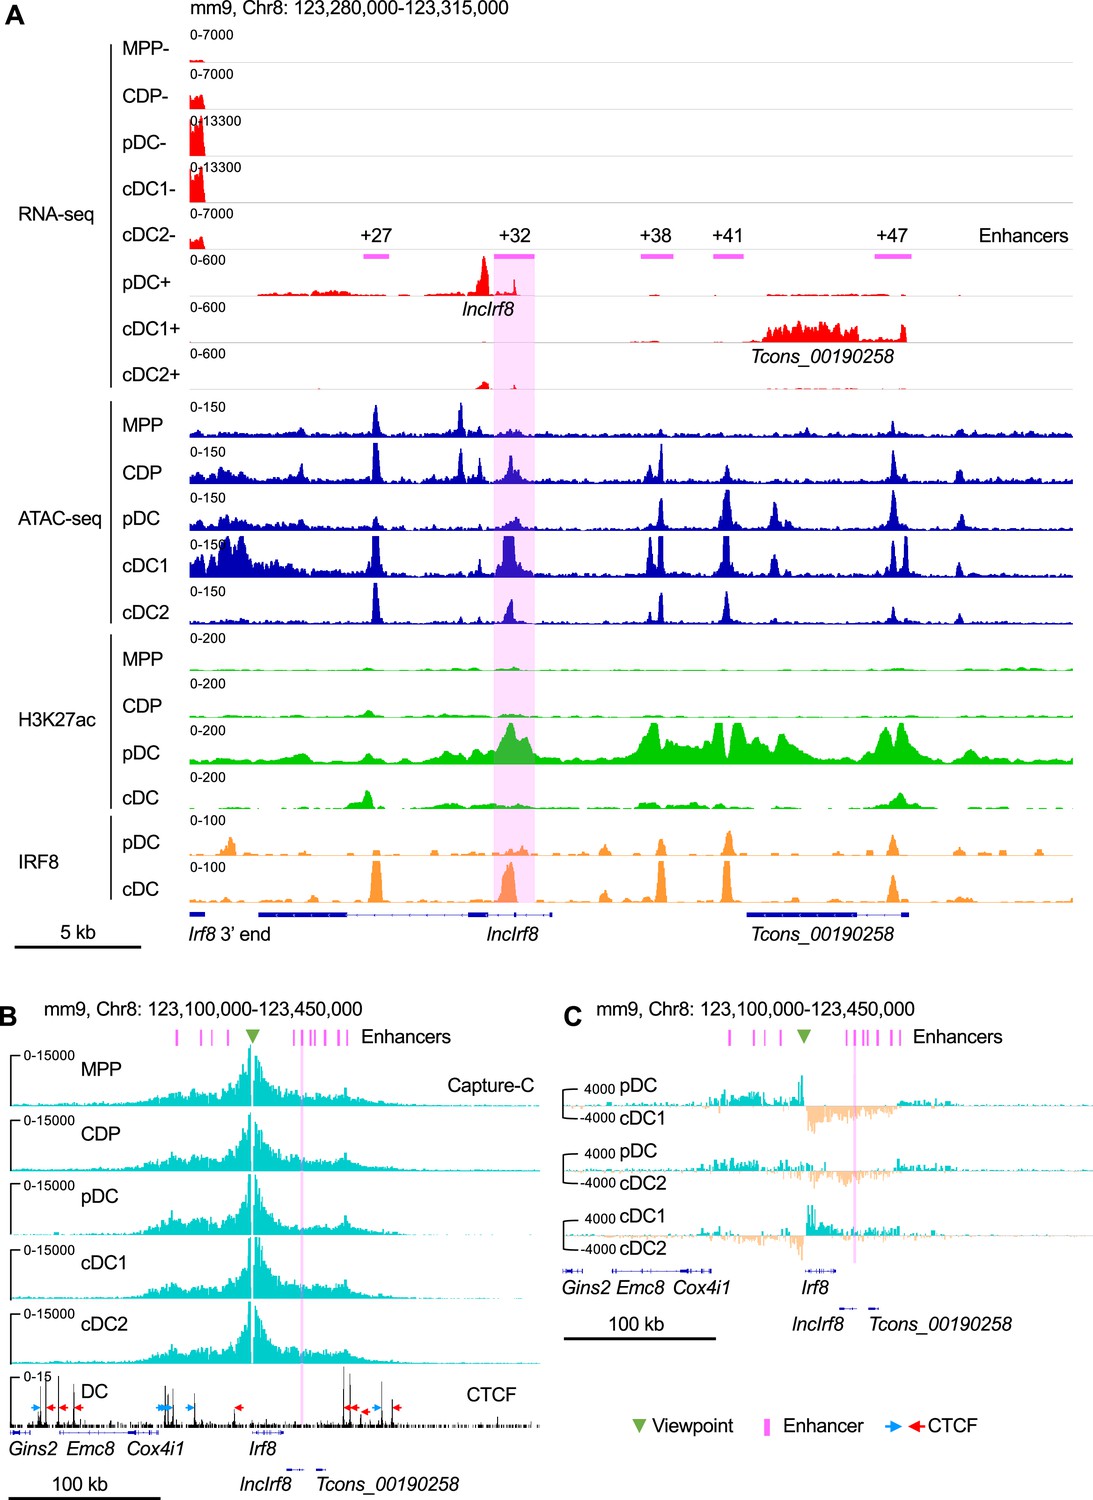
Irf8 epigenetic signatures and promoter-enhancer interaction maps during DC differentiation.
(A) Gene expression and epigenetic signatures of Irf8 downstream region in MPP, CDP, pDC, all cDC, cDC1, and cDC2 are visualized by IGV browser. Gene expression was measured by RNA-seq, chromatin accessibility by ATAC-seq, H3K27ac and IRF8 binding by ChIP-seq. Positions of Irf8 3’ end, Irf8 enhancers, pDC specific lncIrf8 and cDC1 specific Tcons_00190258 lncRNA are indicated. For RNA-seq - and +strands are shown. Scale bar: 5 kb. (B) Physical interactions of Irf8 promoter with flanking sequences in MPP, CDP, pDC, cDC1, and cDC2 by nuclear-titrated (NuTi) Capture-C (turquoise), and CTCF binding by ChIP-seq in DC (Garber et al., 2012). Mean numbers of unique interactions normalized to a 300 kb region around the Irf8 promoter viewpoint (green triangle) and scaled by a factor of 1,000,000 are shown (n=2). The orientations of CTCF binding are indicated with blue and red arrows. Tcons_00190258 refers to the cDC1-specific lncRNA shown in (A). Scale bar: 100 kb. (C) Comparations of the chromatin interactions with Irf8 promoter in pDC, cDC1 and cDC2. Differential tracks were created by subtraction of the mean normalized tracks of (B). Pairwise comparisons are shown and color coded. Turquoise and orange tracks represent specific interactions with the Irf8 promoter in the indicated cell types. Scale bar: 100 kb. Purple bars and lines indicate the position of flanking enhancers relative to Irf8 TSS. The purple bars from left to right represent –50 kb, –34 kb, –26 kb, –16 kb,+27 kb,+32 kb,+38 kb,+41 kb,+47 kb,+56 kb and +62 kb enhancer, respectively (panels B and C). Irf8 +32 kb enhancer is highlighted by purple box.
Figure 1—figure supplement 1
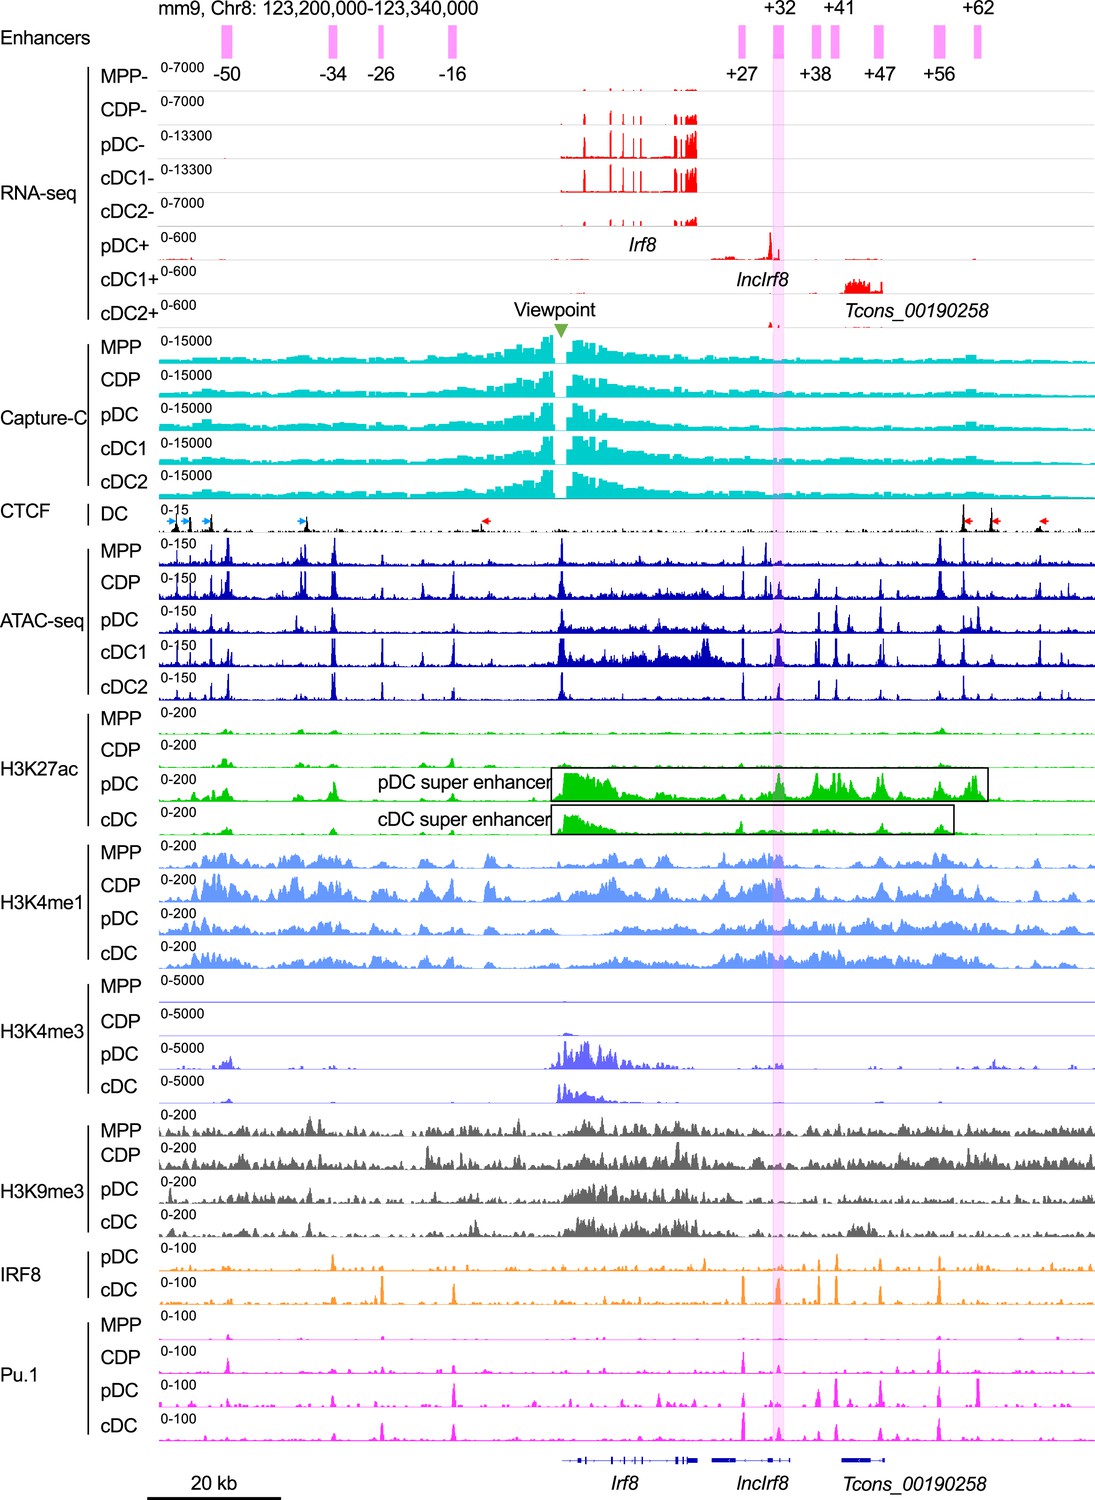
Epigenetic signatures of Irf8 locus during DC differentiation.
Gene expression and epigenetic signatures of Irf8 gene and its flanking regions in MPP, CDP, pDC, all cDC, cDC1, and cDC2 are visualized by IGV browser. Gene expression by RNA-seq, chromatin interactions with Irf8 promoter by Capture-C, chromatin accessibility by ATAC-seq, histone modification (H3K27ac, H3K4me3, H3K4me1, H3K9me3) and TF binding (CTCF, IRF8 and PU.1) by ChIP-seq are as in Figure 1A and B. Positions of upstream and downstream Irf8 enhancers are in purple, Capture-C viewpoint (green triangle), Irf8 gene, pDC-specific lncIrf8 and cDC1 specific Tcons_00190258 lncRNA are indicated. The orientation of CTCF binding is indicated with blue and red arrows. pDC and cDC super enhancers (Grajales-Reyes et al., 2015) are indicated with black boxes. For RNA-seq – and +strands are shown. Scale bar: 20 kb.
Figure 1—figure supplement 2
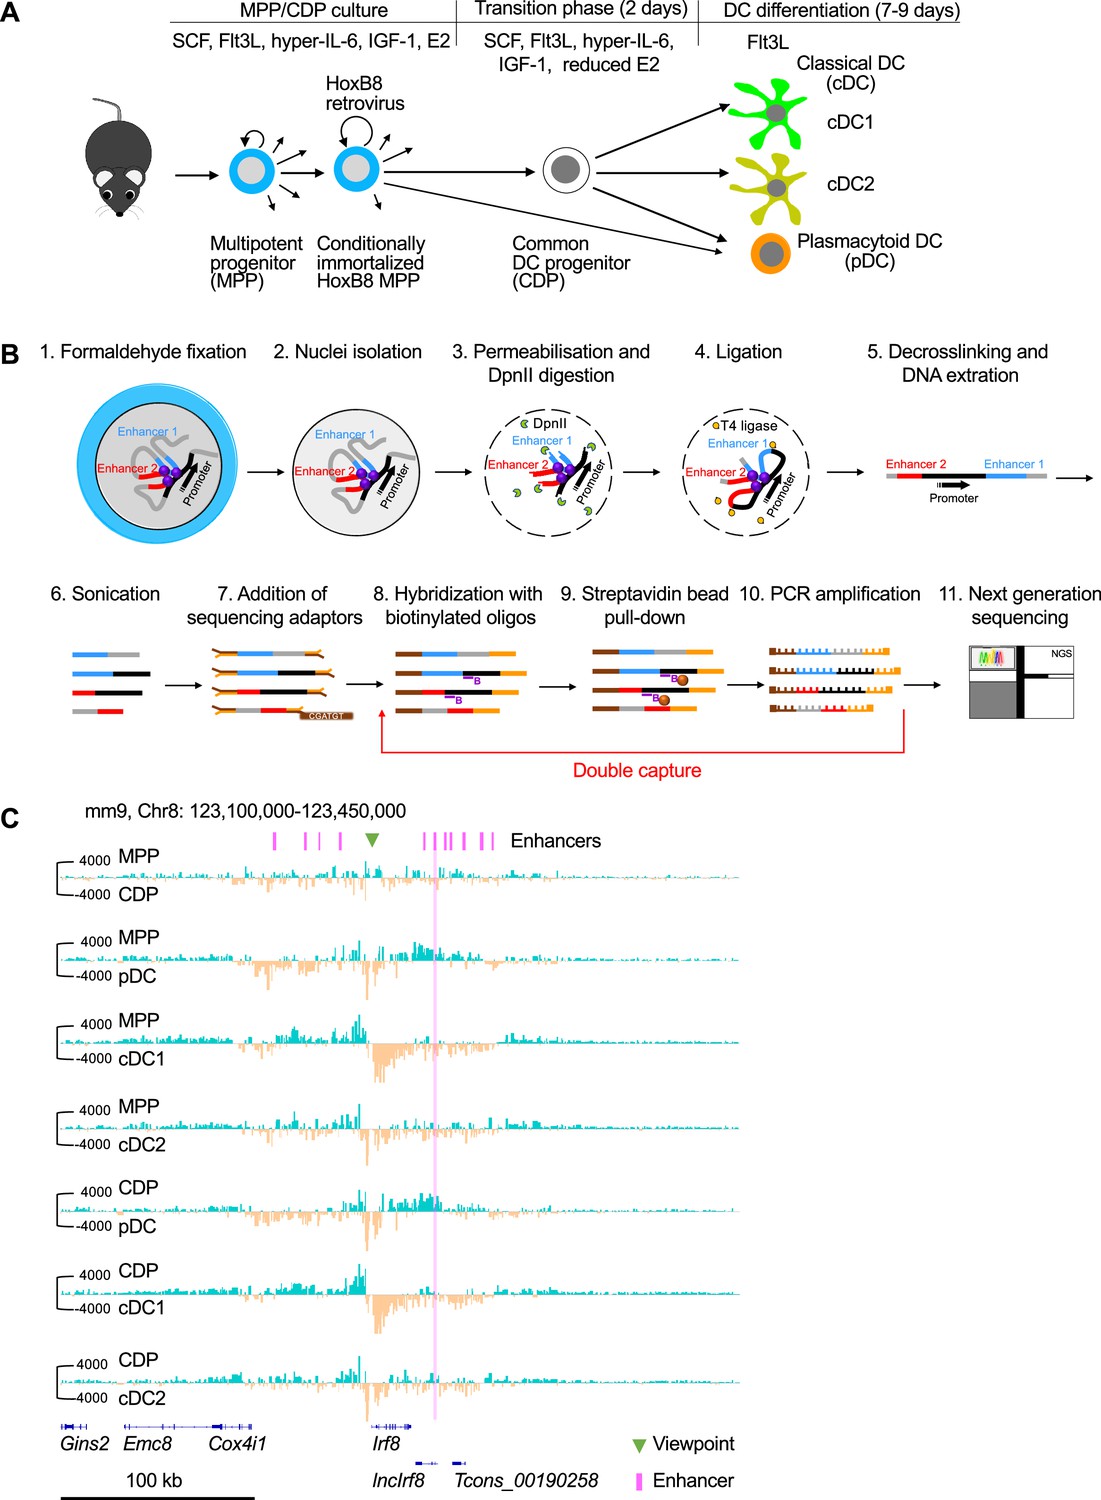
In vitro DC differentiation of HoxB8 MPP and nuclear-titrated (NuTi) Capture-C.
(A) HoxB8 MPP were obtained by infection of bone marrow MPP with HoxB8 retrovirus and cultured in growth medium with SCF, Flt3L, hyper-IL-6, IGF-1, and β-estradiol (E2) (MPP/CDP culture). DC differentiation is induced in growth medium plus high concentration of Flt3L and reduced E2 for 2 days (transition phase). Then growth factors and E2 are removed and cells are further differentiated into DC with high concentration of Flt3L only (DC differentiation). (B) For nuclear-titrated (NuTi) Capture-C FACS sorted cells were fixed with formaldehyde and nuclei were isolated (step 1 and 2). Nuclei were permeabilized with SDS and digested with DpnII (step 3). DNA fragments in nuclei were re-ligated by T4 ligase (step 4) and DNA was extracted to obtain 3C libraries (step 5). The 3C libraries were subjected to sonication (~200 bp fragments), sequencing adaptors were added and DNA was then hybridized with 70 bp biotinylated oligos of the viewpoint, followed by streptavidin bead pull-down and PCR amplification (steps 6–10). Steps 8–10 were repeated to increase capture efficiency. Finally, the captured DNA was subjected to next-generation sequencing (step 11). This scheme was adapted from Figure 1A of Downes et al., 2022. (C) Comparison of the chromatin interactions with the Irf8 promoter by Capture-C (viewpoint, green triangle) between MPP, CDP, pDC, cDC1, and cDC2. Positions of Irf8 enhancers are indicated (purple). Pairwise comparisons are shown and color coded (turquoise vs orange) as in Figure 1C. Differential tracks were created by subtraction of the mean normalized tracks of Figure 1B. Scale bar: 100 kb.
Figure 1—figure supplement 3
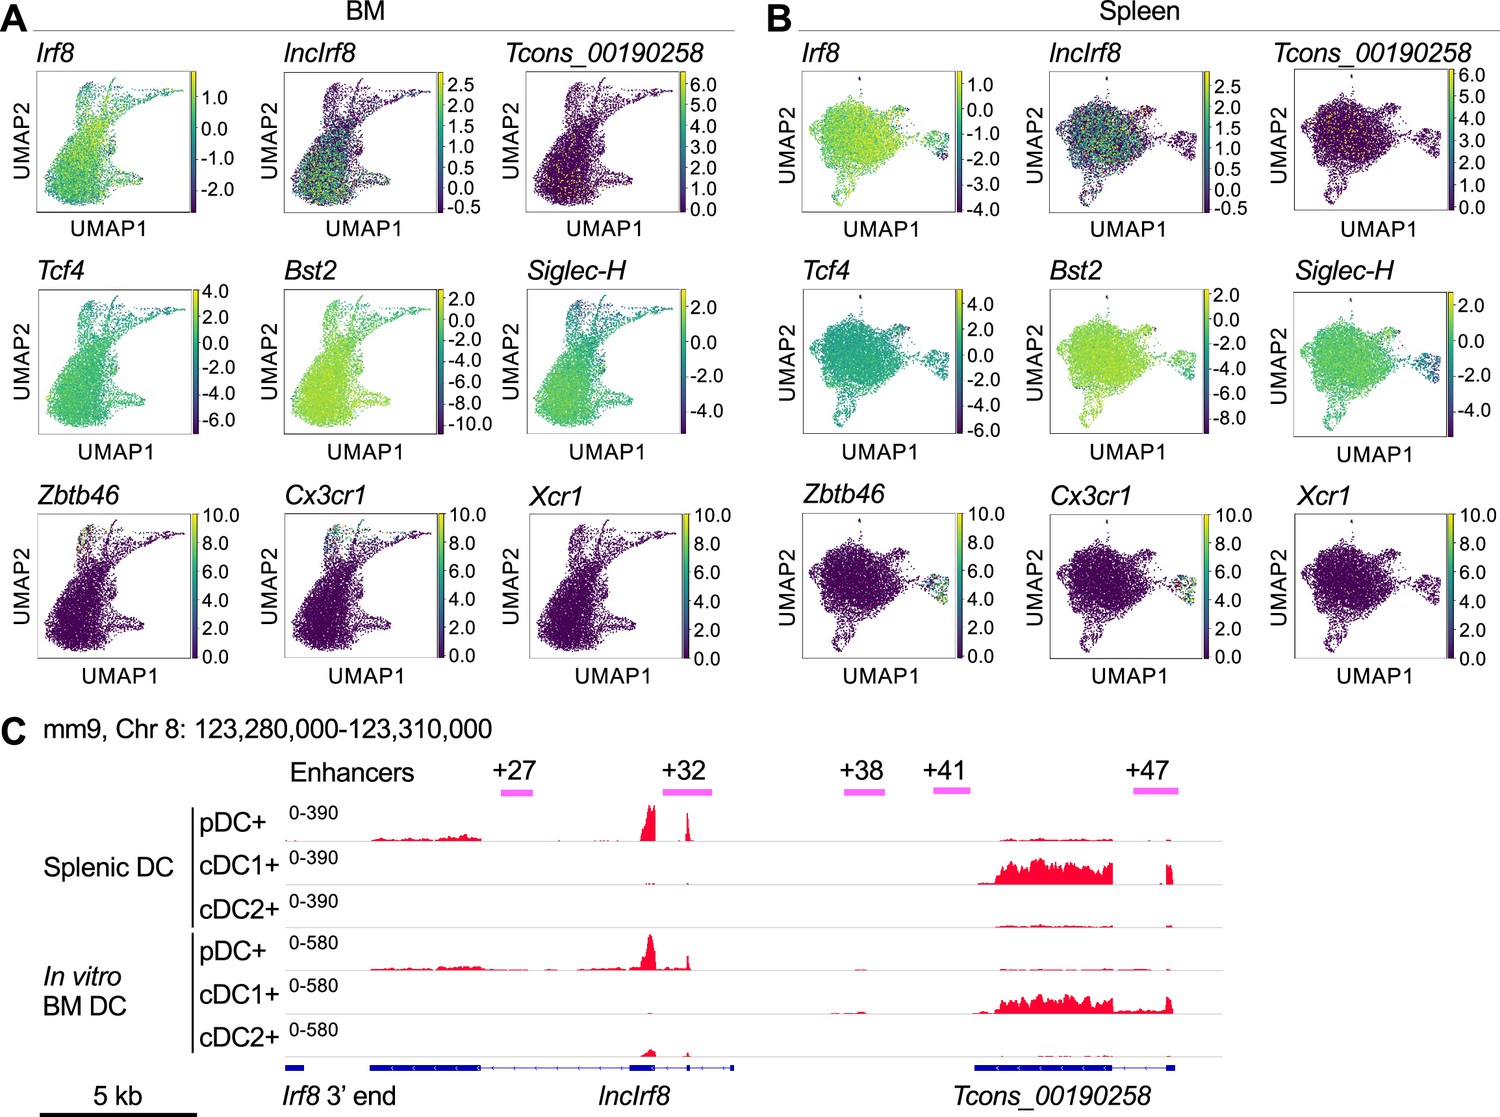
pDC specific lncIrf8 and cDC1 specific Tcons_00190258 lncRNA expression in ex-vivo DC.
(A and B) UMAPs show the expression of lncIrf8 and Tcons_00190258 lncRNA and the indicated marker genes in BM and splenic pDC (Lin- CD11c+ Bst2+ Siglec-H+) from scRNA-seq data (GSE114313) (Rodrigues et al., 2018). pDC marker genes, Tcf4, Bst2 and Siglec-H; cDC marker genes, Zbtb46, Cx3cr1 and Xcr1. (C) Gene expression of lncIrf8 and Tcons_00190258 lncRNA in splenic DC subsets in vivo and in DC subsets generated in in vitro BM Flt3L culture. Bulk RNA-seq data of splenic pDC (CD11cint CD317hi CD11b-), cDC1 (CD11chi CD317low CD8+ CD11b-), and cDC2 (CD11chi CD317low CD8- CD11b-) were obtained from GSE188992 (Pang et al., 2022). The bulk RNA-seq data of DC from Flt3L culture are from this study. Gene expression is visualized by IGV browser. Positions of Irf8 3’ end, Irf8 enhancers, pDC-specific lncIrf8 and cDC1 specific Tcons_00190258 lncRNA are indicated. Scale bar: 5 kb.
Figure 2 with 4 supplements

IncIrf8 promoter KO compromises pDC and cDC1 development in vitro.
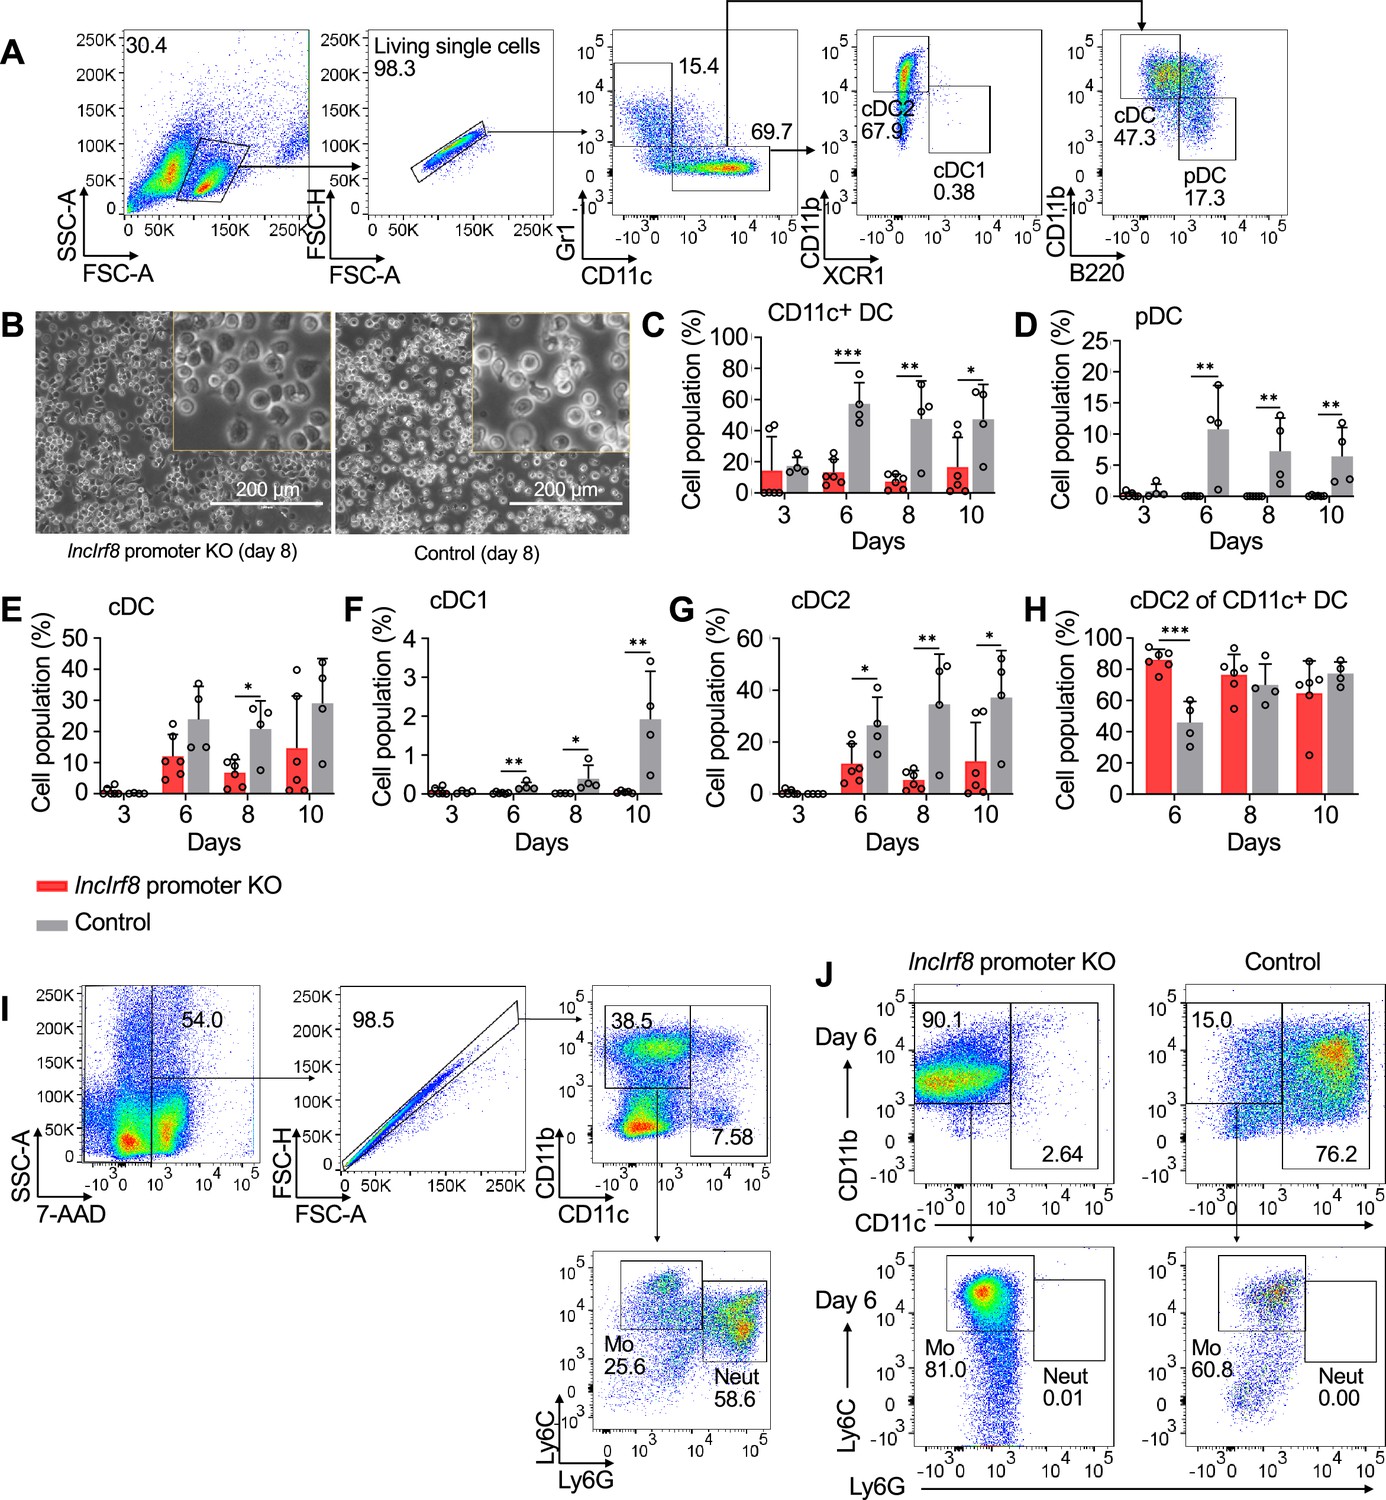
(A) Genomic anatomy of lncIrf8 locus determined by 3’ and 5’ RACE PCR. Blue box, exon 2 and 3 (48 bp and 468 bp, respectively). The 1010 bp intron and polyA tail are shown. Data of RNA-seq, ATAC-seq, ChIP-seq of H3K27ac (enhancer mark) and H3K4me3 (active promoter mark, near TSS) are visualized by IGV browser for the indicated cell populations (pDC, all cDC, cDC1 and cDC2). Grey box, lncIrf8 promoter KO region; open box, cDC1 specific +32 kb enhancer by Durai et al., 2019. Irf8 +32 kb enhancer based on the H3K27ac enhancer mark is indicated with a purple line. Scale bar: 1 kb. (B) Gene expression of lncIrf8 and Irf8 in lncIrf8 promoter KO and control at day 0, 5, and 7 of Flt3L directed DC differentiation. Gene expression was determined by RT-qPCR and normalized to GAPDH. n=4. (C) Representative flow cytometry analysis of Flt3L directed DC differentiation of lncIrf8 promoter KO HoxB8 MPP and control (Lutz et al., 2022; Xu et al., 2022). pDC, all cDC, cDC1, and cDC2 were gated as in Figure 2—figure supplement 1E and are shown. Bar diagrams depict quantification of pDC, cDC1 and cDC2 normalized to living single cells on DC differentiation day 0, 3, 5, 7, and 9. n=6–7. (D) Representative phase-contrast microscopy images of lncIrf8 promoter KO HoxB8 MPP and control on day 7 of Flt3L directed DC differentiation. Scale bar: 200 μm. (E) Representative flow cytometry analysis of spontaneous DC differentiation of lncIrf8 promoter KO HoxB8 MPP and control with growth factors but without E2 (Lutz et al., 2022; Xu et al., 2022) at day 8. Gr1+ monocytes and CD11c+ DC are shown. Quantification of Gr1+ monocytes of living single cells on day 3, 6, 8, and 10 of spontaneous DC differentiation. n=6, lncIrf8 promoter KO; n=4, control. Empty gRNA vector or non-targeting gRNA vector HoxB8 MPP were used as controls. Data represent mean ± SD of at least three independent experiments with different HoxB8 MPP clones of lncIrf8 promoter KO and control without deletion. *p<0.05, **p<0.01, ***p<0.001, multiple t-tests. Data that have no difference (p>0.05) are not labeled.
Figure 2—figure supplement 1

Generating lncIrf8 promoter KO HoxB8 MPP and its impact on DC differentiation.
(A) Mx-Cas9-GFP HoxB8 MPP were infected with 2 gRNA in RFP and RFP657 lentiviral vectors. Mouse interferon α (mIFNα) was applied for 4 hours to induce Cas9 and GFP expression. Cells were cultured for another 2 days and FACS sorted for GFP+ RFP+ RFP657+ cells and 3000 FACS sorted HoxB8 MPP were subjected to limiting dilution to obtain single cell colonies. Single cell HoxB8 MPP were genotyped by genomic PCR and clones with homozygous deletions in the lncIrf8 promoter were used for further studies. (B) Mx-Cas9-GFP mice contain a mIFNα inducible Cre recombinase that removes the stop cassette and allows Cas9 and GFP expression. Cas9 and GFP protein are separated by the 2 A self-cleaving peptide (P2A) and thus all GFP+ cells express Cas9. (C and D) Representative genotyping of lncIrf8 promoter KO in single-cell Mx-Cas9-GFP HoxB8 MPP. Homozygous deletions in lncIrf8 promoter (red) were detected by PCR and agarose gel electrophoresis (C). lncIrf8 promoter deletions determined by Sanger sequencing in three representative KO clones of (C) are depicted in (D). lncIrf8-F and lncIrf8-R refers to primers for genotyping and Sanger sequencing, and sequences for both directions, referred to F and R, of clones 19, 21, and 24 are shown. Positions of gRNA1 and gRNA2, which were used for generating the deletion in the lncIrf8 promoter, are indicated. (E) Gating strategy for Flt3L directed DC differentiation. CD11c+ DC were gated on CD11b- B220+ pDC, CD11b+ B220- cDC, CD11blow/- XCR1+ cDC1, and CD11b+ XCR1- cDC2. (F and G) Quantification of CD11c+ DC and cDC of panel (E) of living single cells in lncIrf8 promoter KO HoxB8 MPP and control on Flt3L directed DC differentiation at day 0, 3, 5, 7, and 9. n=6–7. Data represent mean ± SD of at least three independent experiments with different HoxB8 MPP clones of lncIrf8 promoter KO and control. *p<0.05, multiple t-tests. Data that have no difference (p>0.05) are not labeled.
-
Figure 2—figure supplement 1—source data 1
Full raw unedited gel of genotyping of lncIrf8 promoter KO HoxB8 MPP clones in Figure 2—figure supplement 1C.
- https://cdn.elifesciences.org/articles/83342/elife-83342-fig2-figsupp1-data1-v2.tif
-
Figure 2—figure supplement 1—source data 2
Labeled uncropped gel of genotyping of lncIrf8 promoter KO HoxB8 MPP clones in Figure 2—figure supplement 1C.
- https://cdn.elifesciences.org/articles/83342/elife-83342-fig2-figsupp1-data2-v2.tif
Figure 2—figure supplement 2

Information of lncIrf8 promoter KO.
(A) Schematic representation of lncIrf8 locus. The sequences deleted in the lncIrf8 promoter KO are indicated by a grey filled box and multiple potential IRF8 and PU.1 binding sites are depicted. The cDC1 specific +32 kb enhancer by Durai et al., 2019 is shown by an open box. Gene expression was by RNA-seq and IRF8 and PU.1 TF binding was by ChIP-seq as in Figure 1A, Figure 2A and Figure 1—figure supplement 1. Scale bar: 500 bp. (B) Sequence of lncIrf8 promoter and cDC1 specific +32 kb enhancer. Sequences underlined in black indicate gRNAs used for generating the deletions. Sequence motives for AP1-IRF composite elements (AICE), IRF8, PU.1, and BATF3 were indicated with green, orange, purple, and blue lines, respectively. lncIrf8 exon 2 is in turquoise; arrow indicates lncIrf8 transcriptional start site and direction. The shaded sequences represent the KO region of lncIrf8 promoter and the cDC1 specific +32 kb enhancer by Durai et al., 2019.
Figure 2—figure supplement 3
Impact of lncIrf8 promoter KO on spontaneous DC differentiation.
(A) Gating strategy for spontaneous DC differentiation. Gr1+ monocytes, and the pDC, all cDC, cDC1 and cDC2 subsets from Gr1- CD11c+ cells were gated as in Figure 2—figure supplement 1E. (B) Representative phase-contrast microscopy images of lncIrf8 promoter KO HoxB8 MPP and control on spontaneous DC differentiation (-E2) day 8. Scale bar: 200 μm. (C–G) Quantification of CD11c+ DC, pDC, all cDC, cDC1 and cDC2 of panel (A) of living single cells in lncIrf8 promoter KO HoxB8 MPP and control on spontaneous DC differentiation (-E2) day 3, 6, 8, and 10. n=6 for lncIrf8 promoter KO; n=4 for KO control. Data represent mean ± SD of at least three independent experiments with different HoxB8 MPP clones of lncIrf8 promoter KO and control without deletion. *p<0.05, **p<0.01, ***p<0.001, multiple t-tests. Data that have no difference (p>0.05) are not labeled. (H) Quantification of cDC2 normalized to CD11c+ cells of (G) at days 6, 8, and 10. Spontaneous DC differentiation of control cells progressed slower than differentiation of lncIrf8 promoter KO cells and therefore a lower frequency of cDC2 was observed at day 6. At later time points lncIrf8 promoter KO left cDC2 differentiation unaffected. (I) Gating strategy for identification of Gr1+ monocytes upon spontaneous DC differentiation in panel (A) and Figure 2E. Mouse BM cells were used and Gr1+ monocytes (Mo) were gated as 7-AAD- CD11b+ CD11c- Ly6C+ Ly6G-. Neutrophils (Neut) were gated as 7-AAD- CD11b+ CD11c- Ly6Clow/- Ly6G+ . (J) Representative flow cytometry analysis of Gr1+ monocytes at day 6 of spontaneous DC differentiation of lncIrf8 promoter KO and control. Cells were gated as in panel (I).
Figure 2—figure supplement 4
cDC1 specific +32 kb enhancer KO compromises cDC1 development in vitro.
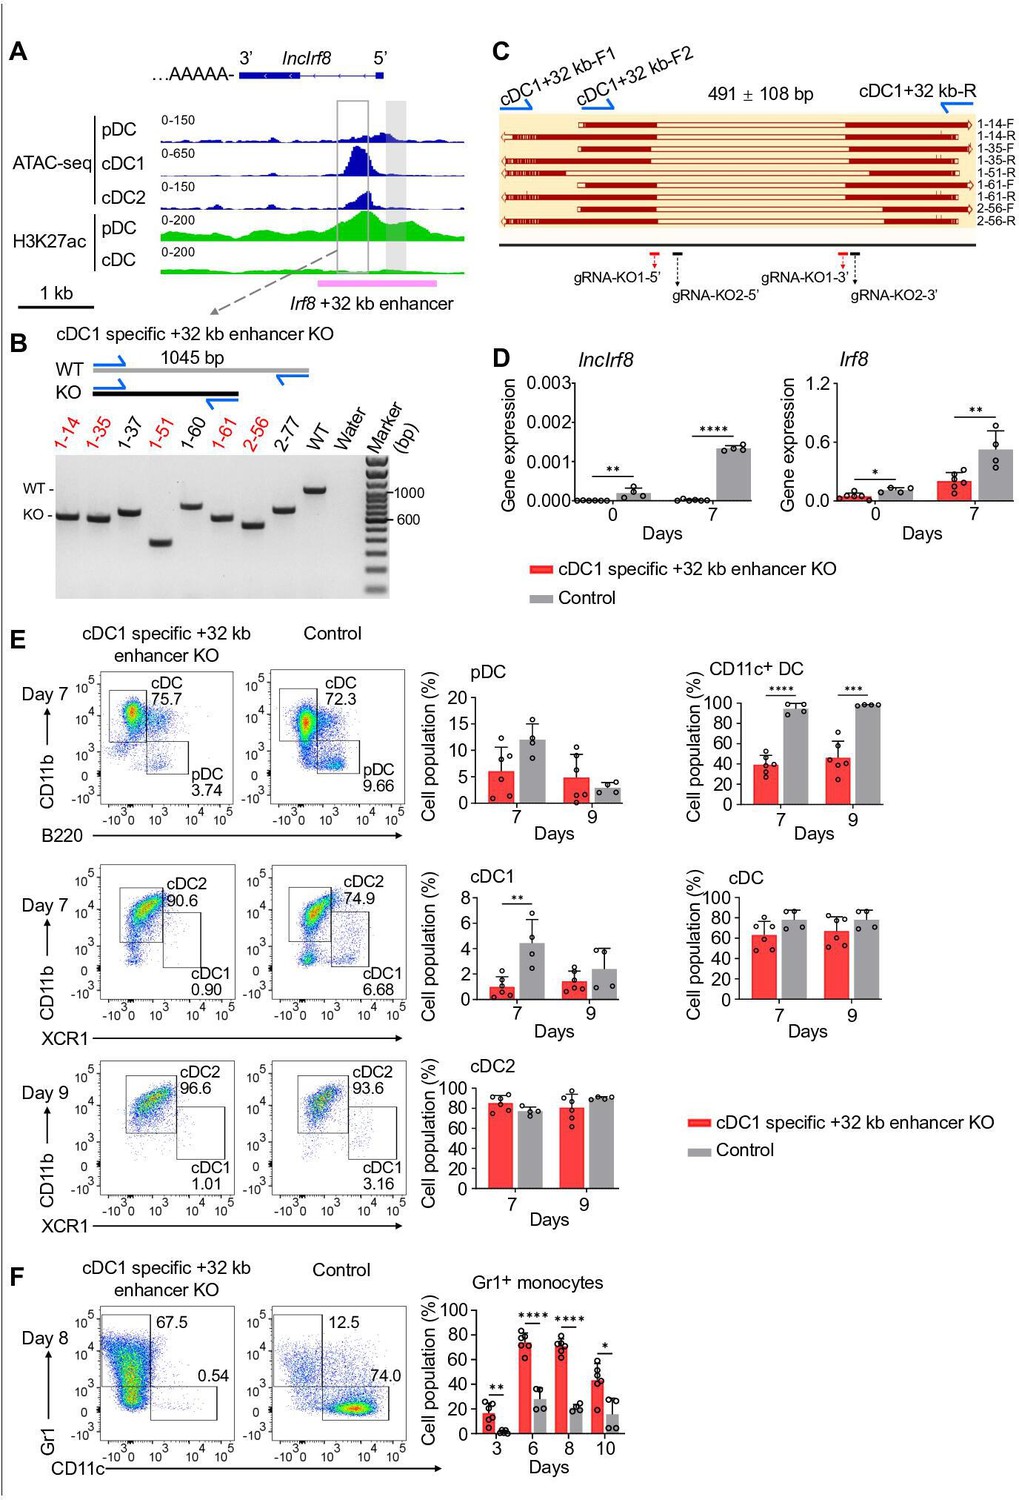
(A) Position of cDC1 specific +32 kb enhancer. Data of ATAC-seq, ChIP-seq of H3K27ac (enhancer mark) are visualized by IGV browser for the indicated cell populations (pDC, all cDC, cDC1, and cDC2). Open box, cDC1 specific +32 kb enhancer by Durai et al., 2019; grey box, lncIrf8 promoter KO region; Irf8 +32 kb enhancer based on the H3K27ac enhancer mark is indicated with a purple line. Scale bar: 1 kb. (B and C) Representative genotyping of cDC1 specific +32 kb enhancer KO in single-cell Mx-Cas9-GFP HoxB8 MPP. Homozygous deletions in cDC1 specific +32 kb enhancer KO (red) were detected by PCR and agarose gel electrophoresis (B). cDC1 specific +32 kb enhancer KO deletions determined by Sanger sequencing in five representative KO clones of (B) are depicted in (C). cDC1 +32 kb-F1 and cDC1 +32 kb-R refers to primers for genotyping. Sanger sequencing was performed from on both DNA strands: cDC1 +32 kb-F2 and cDC1 +32 kb-R was used for forward and reverse sequencing, respectively. Clones 1–14, 1–35, 1–51, 1–61, and 2–56 are shown. Positions of gRNAs used for generating the deletion of cDC1 +32 kb enhancer KO are indicated. gRNA-KO1-5' and gRNA-KO1-3' are from Durai et al., 2019; gRNA-KO2-5' and gRNA-KO2-3' were designed in the present study. (D) Gene expression of lncIrf8 and Irf8 in cDC1 specific +32 kb enhancer KO and control at day 0 and 7 of Flt3L directed DC differentiation. n=6, cDC1 specific +32 kb enhancer KO; n=4, control. (E) Representative flow cytometry analysis of Flt3L directed DC differentiation of cDC1 specific +32 kb enhancer KO HoxB8 MPP and control. pDC, all cDC, cDC1, and cDC2 were gated as in Figure 2—figure supplement 1E and are shown. Bar diagrams on the left depict quantification of pDC, cDC1 and cDC2 normalized to CD11c+ cells on DC differentiation day 7 and 9. Bar diagrams on the right depict CD11c+ DC and all cDC. CD11c+ DC were gated on living single cells. Frequencies of pDC were compromised in +32 kb enhancer KO at day 7, however this was not statistically significant. n=6, cDC1 specific +32 kb enhancer KO; n=4, control. (F) Representative flow cytometry analysis of spontaneous DC differentiation of cDC1 specific +32 kb enhancer KO and control with growth factors but without E2 at day 8. Gr1+ monocytes and CD11c+ DC are shown. Quantification of Gr1+ monocytes of living single cells on days 3, 6, 8, and 10 of spontaneous DC differentiation. n=6, cDC1 specific +32 kb enhancer KO; n=4, control. Empty gRNA vector or non-targeting gRNA vector HoxB8 MPP were used as controls. Data represent mean ± SD of three independent experiments with different HoxB8 MPP clones of cDC1 specific +32 kb enhancer KO and control without deletion. Differentiation kinetics of clones were normatized to control without deletion if required. *p<0.05, **p<0.01, ****p<0.0001, multiple t-tests. Data that have no difference (p>0.05) are not labeled.
-
Figure 2—figure supplement 4—source data 1
Full raw unedited gel of genotyping of cDC1 specific +32 kb enhancer KO clones in Figure 2—figure supplement 4B.
- https://cdn.elifesciences.org/articles/83342/elife-83342-fig2-figsupp4-data1-v2.tif
-
Figure 2—figure supplement 4—source data 2
Labeled uncropped gel of genotyping of cDC1 specific +32 kb enhancer KO clones in Figure 2—figure supplement 4B.
- https://cdn.elifesciences.org/articles/83342/elife-83342-fig2-figsupp4-data2-v2.tif
Figure 3 with 1 supplement
lncIrf8 promoter KO comprises pDC and cDC1 development in vivo upon cell transplantation.
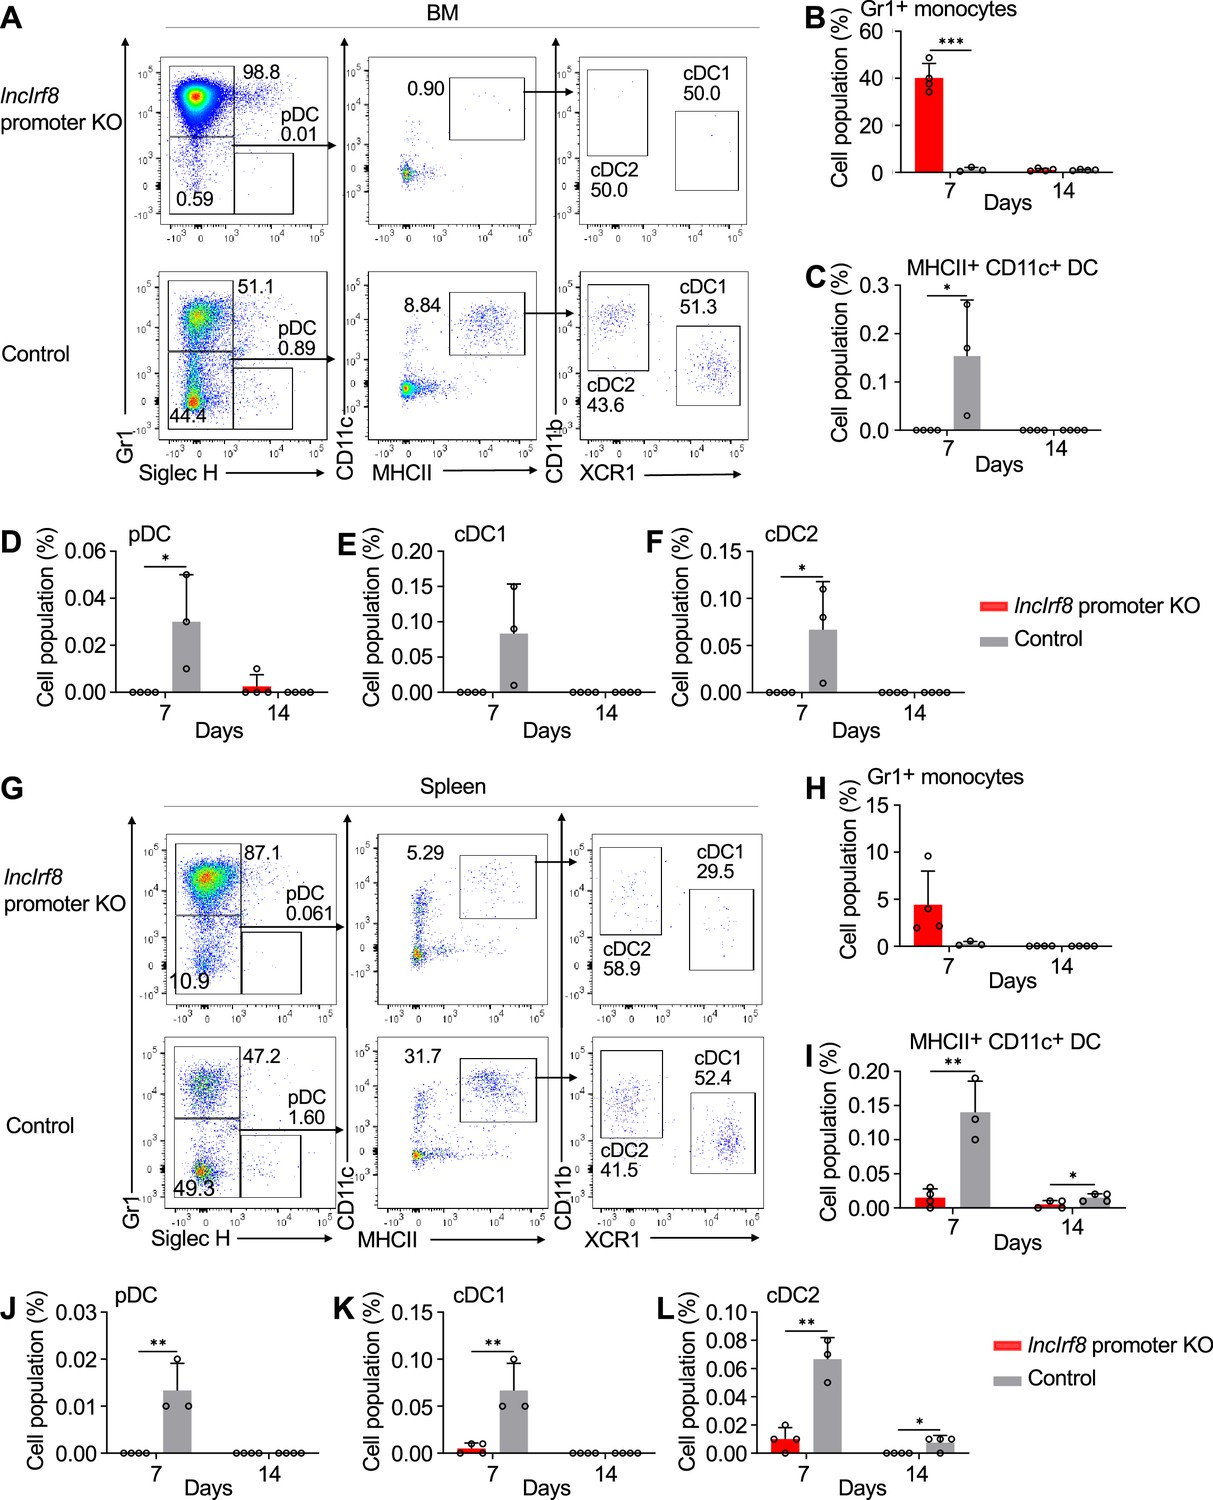
(A) Representative flow cytometry analysis of CD45.2 lncIrf8 promoter KO and control HoxB8 MPP in BM at day 7 after cell transplantation (for details see Figure 3—figure supplement 1A, B). Donor cell populations were gated from 7-AAD- CD45.2+ Lin- cells and Gr1+ monocytes, pDC, cDC1 and cDC2 are shown. (B–F) Quantification of Gr1+ monocytes, MHCII+ CD11c+ DC, pDC, cDC1, and cDC2 of living single cells in BM on day 7 and 14 after cell transplantation (n=3–4). (G) Representative flow cytometry analysis of lncIrf8 promoter KO and control HoxB8 MPP in spleen at day 7 after cell transplantation. Gating was as in panel (A). (H–L) Quantification of Gr1+ monocytes, MHCII+ CD11c+ DC, pDC, cDC1 and cDC2 on day 7 and 14 after cell transplantation (n=3–4). Data represent mean ± SD from 3 to 4 mice. *p<0.05, **p<0.01, ***p<0.001, multiple t-tests. Data that have no difference (p>0.05) are not labeled.
Figure 3—figure supplement 1
Cell transplantation of HoxB8 MPP.
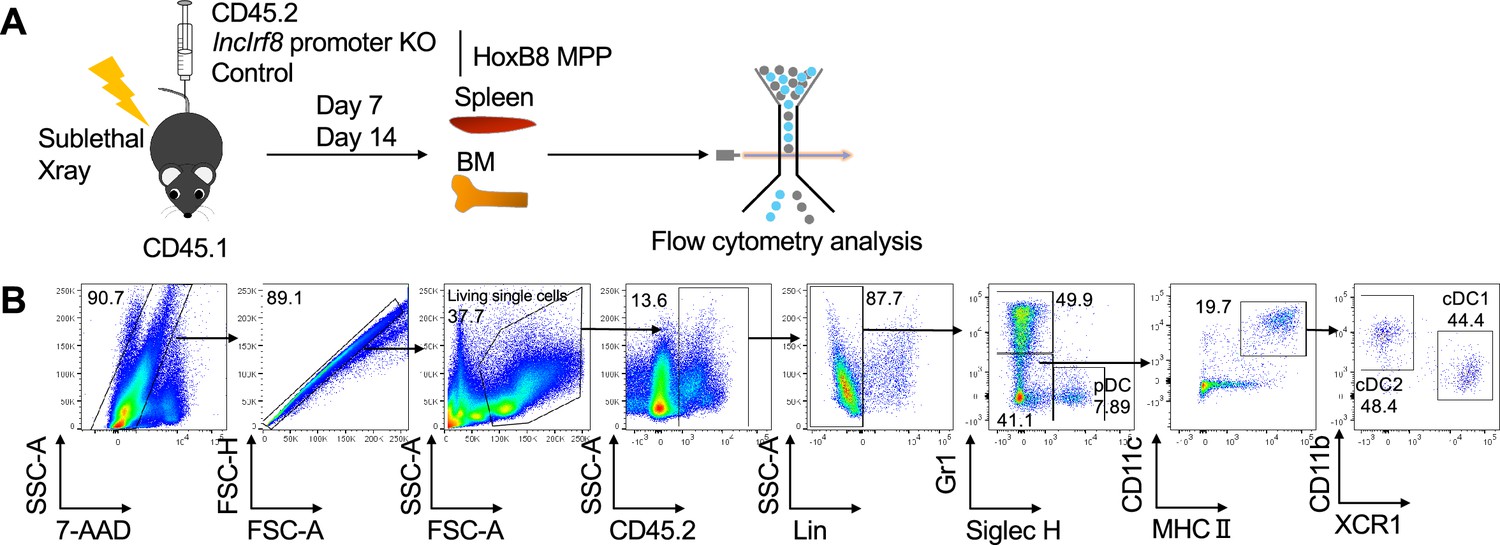
(A) Workflow of HoxB8 MPP transplantation. CD45.1 recipient mice were sublethal irradiated and injected with CD45.2 lncIrf8 promoter KO and control HoxB8 MPP. Seven and 14 days after cell transplantation, mice were sacrificed and cells from bone marrow and spleen were isolated and subjected to flow cytometry analysis for DC subsets. (B) Gating strategy for CD45.2 DC subsets following transplantation of CD45.2 lncIrf8 promoter KO HoxB8 MPP into CD45.1 recipient mice. 7-AAD- CD45.2+ lineage- donor cells were gated on Gr1+ monocytes, Gr1- Siglec H+ pDC, and Gr1-Siglec H- CD11c+ MHCII+ DC, and further on cDC1 and cDC2 subsets. cDC1 are Gr1- Siglec H- MHCII+ CD11c+ CD11blow/- XCR1+ and cDC2 are Gr1- Siglec H- MHCII+ CD11c+ CD11b+ XCR1-. The lineage cocktail (Lin) was: Ter119, CD19, CD3e, NK1.1, F4/80.
Figure 4 with 1 supplement
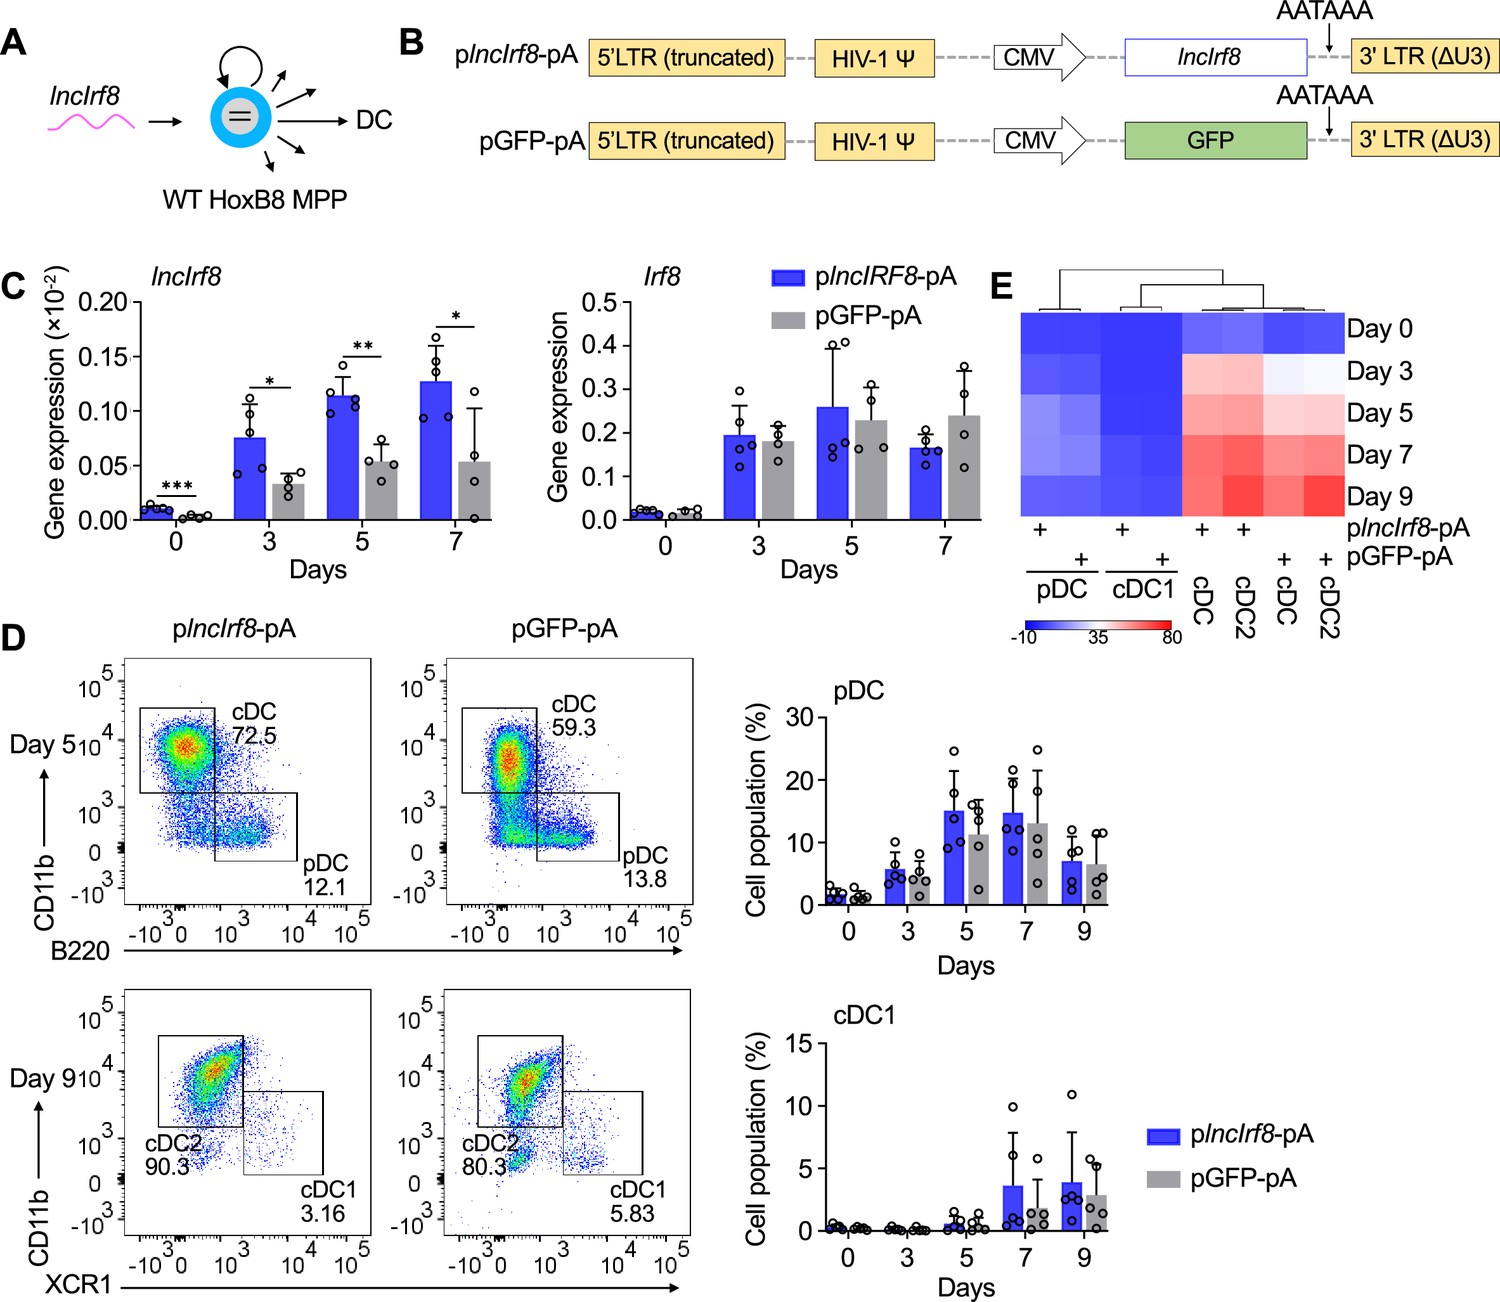
lncIrf8 overexpression leaves pDC and cDC1 development unaffected.
(A and B) Schematic representation of lncIrf8 overexpression in WT HoxB8 MPP and of plncIrf8-pA (lncIrf8 overexpression) and pGFP-pA (control) plasmids. A polyA signal AATAAA for transcription termination was inserted at the 3’ end of lncIrf8 and GFP. (C) Gene expression of lncIrf8 and Irf8 in plncIrf8-pA and pGFP-pA HoxB8 MPP on day 0, 3, 5, and 7 of Flt3L directed DC differentiation (n=4–5). Gene expression was by RT-qPCR and normalized to GAPDH. (D) Representative flow cytometry of DC subsets at day 5 and 9 of Flt3L directed DC differentiation of plncIrf8-pA and pGFP-pA HoxB8 MPP. Quantification of pDC and cDC1 of living single cells on Flt3L directed DC differentiation day 0, 3, 5, 7, and 9 (n=5) is shown. Gating for pDC and cDC1 was as in Figure 2—figure supplement 1E. (E) Heatmap representation of DC subsets of panel (D) at day 0, 3, 5, 7, and 9 of DC differentiation. Red, high frequency; white, intermediate frequency and blue, low frequency. Data represent mean ± SD of at least three independent experiments with different HoxB8 MPP clones of plncIrf8-pA and pGFP-pA. *p<0.05, **p<0.01, ***p<0.001, multiple t-tests. Data that have no difference (p>0.05) are not labeled.
Figure 4—figure supplement 1
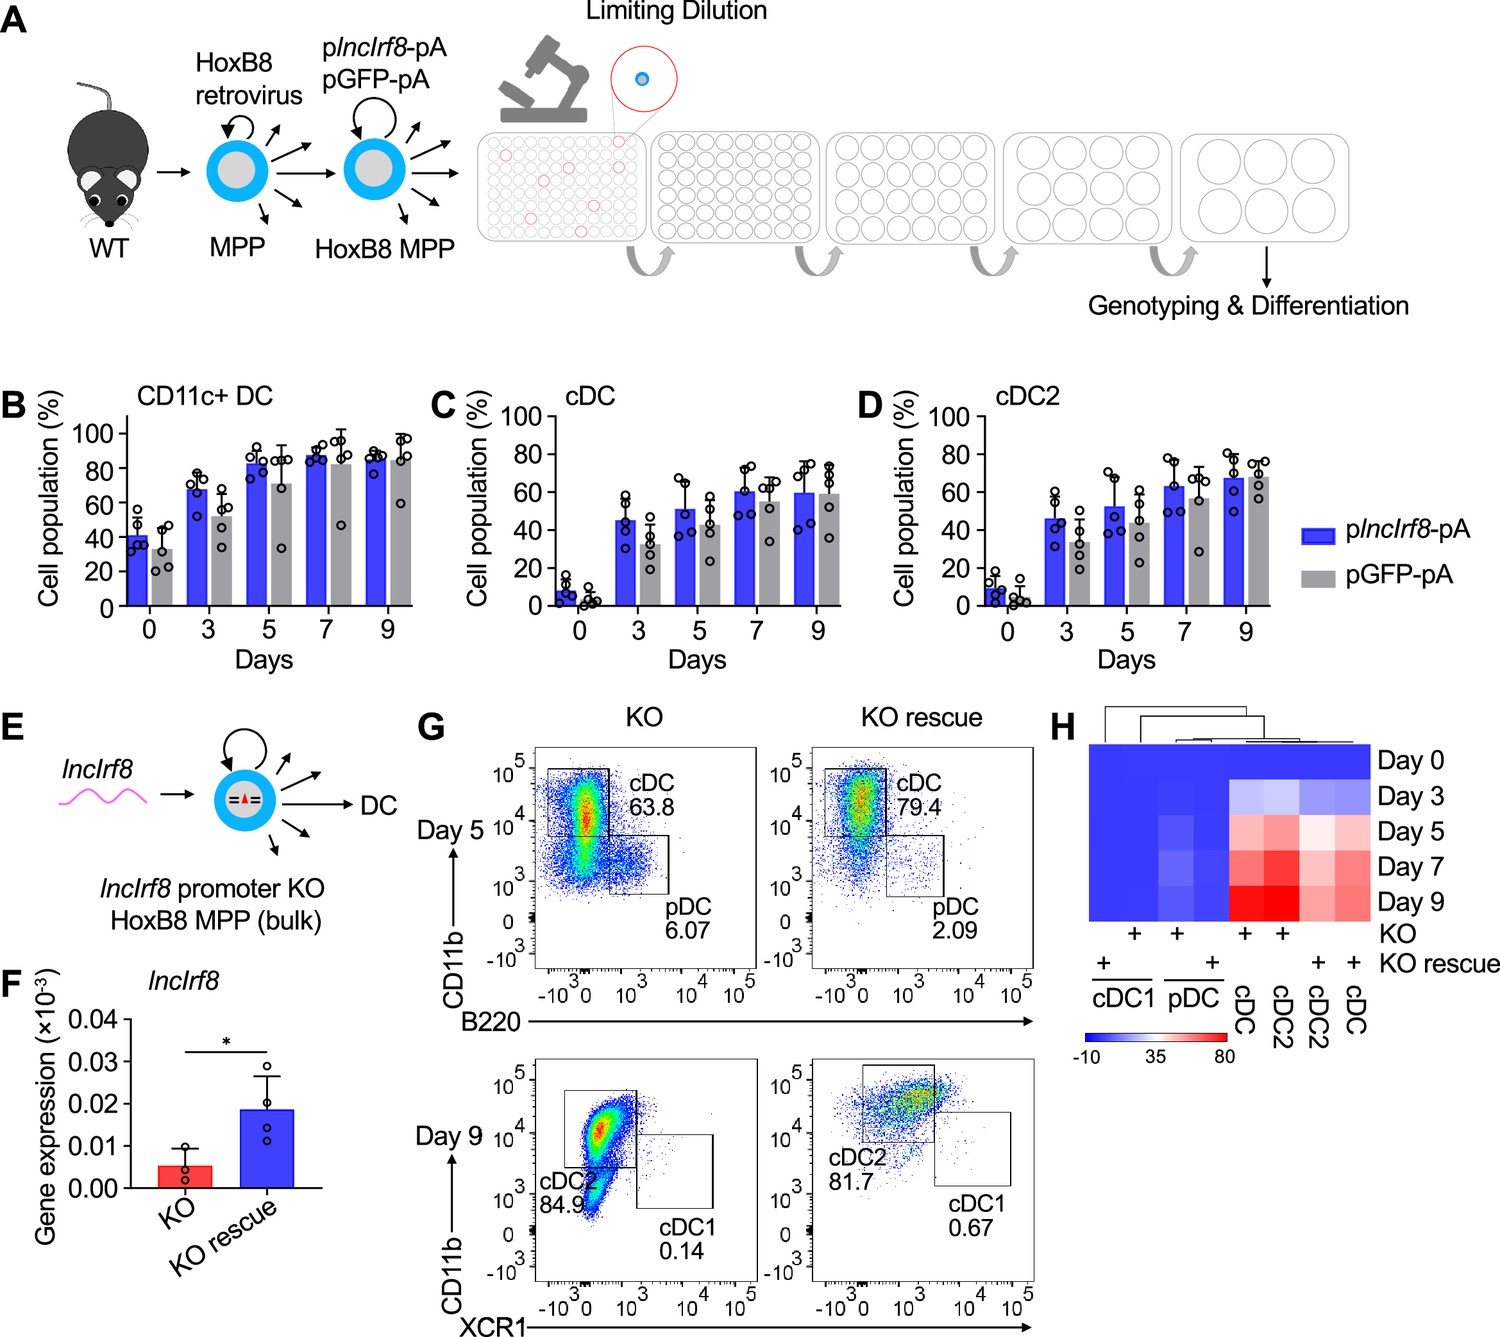
lncIrf8 overexpression and rescue left DC differentiation unaffected.
(A) WT HoxB8 MPP were infected with plncIrf8-pA (lncIrf8 overexpression) and pGFP-pA (control) lentiviral particles, followed by limiting dilution to obtain single cell colonies. HoxB8 MPP clones were screened by genomic PCR and the positive colonies were subjected to DC differentiation. (B–D) Quantification of CD11c+ DC, all cDC and cDC2 of living single cells in plncIrf8-pA and pGFP-pA HoxB8 MPP on day 0, 3, 5, 7, and 9 of Flt3L directed DC differentiation (n=5). Gating was as in Figure 2—figure supplement 1E. Data represent mean ± SD of at least three independent experiments with different HoxB8 MPP clones of plncIrf8-pA and pGFP-pA. Data were calculated by multiple t-tests and data that have no difference (p>0.05) are not labeled. (E) Schematic representation of lncIrf8 rescue in lncIrf8 promoter KO HoxB8 MPP (bulk). (F) Gene expression of lncIrf8 in lncIrf8 promoter KO and KO rescue HoxB8 MPP. Gene expression was by RT-qPCR and normalized to GAPDH. Data represent mean ± SD of at least three independent experiments and were calculated by unpaired t test. *p<0.05. (G) Representative flow cytometry analysis of DC subsets pDC, cDC1 and cDC2 at day 5 and 9 of Flt3L directed DC differentiation of lncIrf8 promoter KO rescue and control (KO). (H) DC subsets pDC, all cDC, cDC1 and cDC2 were calculated in percent of living single cells in lncIrf8 promoter KO and KO rescue on day 0, 3, 5, 7, and 9 of Flt3L directed DC differentiation and data are represented in heat map format; n=3–4 from at least three independent experiments. Red, high frequency; white, intermediate frequency and blue, low frequency.
Figure 5 with 1 supplement

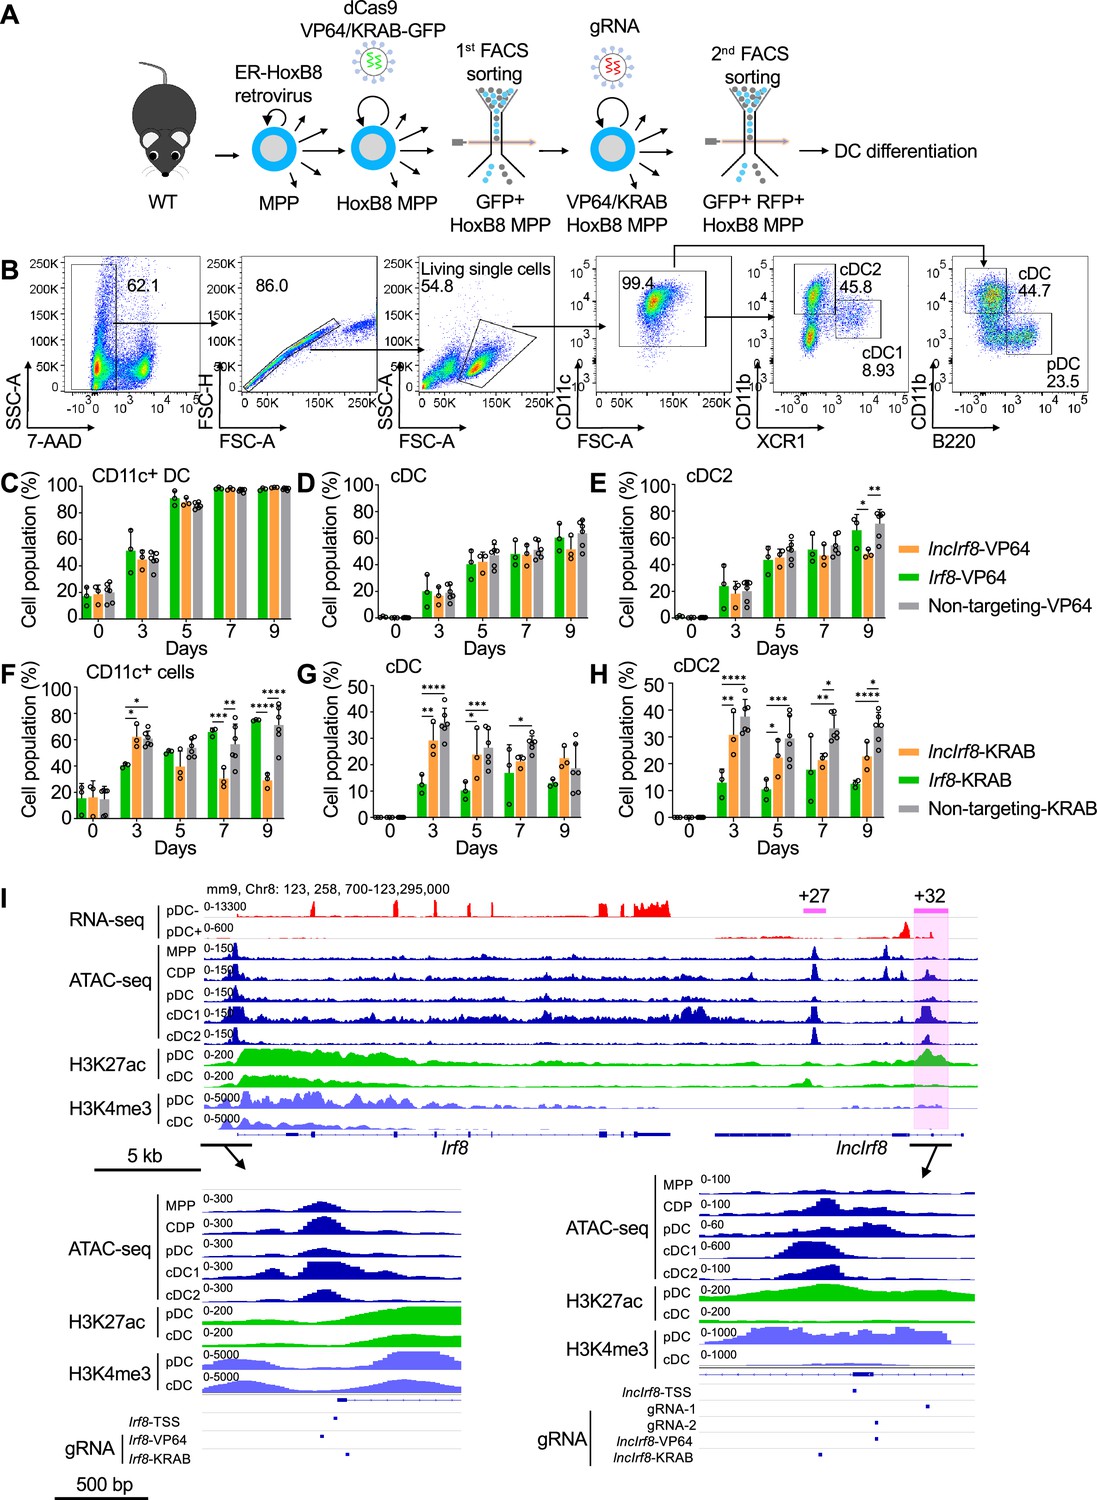
Activation of lncIrf8 promoter promotes cDC1 development.
(A) Schematic representation of lncIrf8 and Irf8 promoter activation (top and middle, respectively) by CRISPR activation with dCas9-VP64. gRNAs were positioned upstream of lncIrf8 and Irf8 TSS for gene activation. dCas9-VP64 cells with non-targeting gRNA were used as control (bottom). Green and purple wavy lines represent Irf8 and lncIrf8 RNA, respectively. The number of wavy lines indicates levels of gene transcription determined by RT-qPCR in (C). Different length of blue arrows represents the frequencies of pDC and cDC1 according to panel B, D and E. Nc, No change; Ctrl, Control. (B) Representative flow cytometry analysis of CRISPR activation targeting the lncIrf8 and Irf8 promoters at day 7 and 9 of Flt3L directed DC differentiation. Two non-targeting gRNAs were used as controls and one representative non-targeting gRNA is shown (Non-targeting-VP64). Top row, CD11b+ B220- cDC and CD11b- B220+ pDC at day 7 of Flt3L directed DC differentiation; bottom row, CD11blow/- XCR1+ cDC1 and CD11b+ XCR1- cDC2 at day 9 of DC differentiation. For gating strategy see Figure 5—figure supplement 1B. (C) Gene expression of lncIrf8 and Irf8 in lncIrf8-VP64, Irf8-VP64 and non-targeting-VP64 HoxB8 MPP on day 0, 5, 7, and 9 of Flt3L directed DC differentiation (n=3). Gene expression analysis was by RT-qPCR and data are normalized to GAPDH. Data represent mean ± SD of three independent experiments. *p<0.05, **p<0.01, ****p<0.0001, two-way ANOVA, Tukey’s multiple comparisons test. Data that have no difference (p>0.05) are not labeled. (D and E) Quantification of pDC and cDC1 in percent of living single cells as in panel (B) on various days of Flt3L directed DC differentiation (n=3). Non-targeting-VP64 refers to both non-targeting-VP64 controls (n=6). Data represent mean ± SD of 3 independent experiments. *p<0.05, **p<0.01, ***p<0.001, ****p<0.0001, two-way ANOVA, Tukey’s multiple comparisons test. Data that have no difference (p>0.05) are not labeled.
Figure 5—figure supplement 1
CRISPR/dCas9 mediated gene activation and repression, and gRNA positions.
(A) WT HoxB8 MPP were infected with dCas9-VP64-GFP and KRAB-dCas9-GFP lentiviral vectors followed by 1st FACS sorting for GFP+ cells to obtain dCas9-VP64-GFP and dCas9-KRAB-GFP HoxB8 MPP. Gene targeting of dCas9-VP64 and dCas9-KRAB was achieved by infection of MPP with specific gRNA vectors and 2nd FACS sorting for GFP+ RFP+ cells. (B) Gating strategy for DC subsets in CRISPR/dCas9 HoxB8 MPP upon DC differentiation. DC subsets were gated from 7-AAD- CD11c+ cells, and further gated on all cDC, cDC1, cDC2 and pDC as in Figure 2—figure supplement 1E. (C–H) Quantification of CD11c+ cells, all cDC, and cDC2 of panel (B) in percent of living single cells in dCas9-VP64 cells and dCas9-KRAB cells on day 0, 3, 5, 7, and 9 of Flt3L directed DC differentiation (n=3). Non-targeting-VP64 and Non-targeting-KRAB refers to non-targeting-VP64 and KRAB controls, respectively (n=6). Data represent mean ± SD of 3 independent experiments. *P<0.05, **P<0.01, ***P<0.001, ****P<0.0001, two-way ANOVA, Tukey’s multiple comparisons test. Data that have no difference (P>0.05) are not labeled. (I) Gene expression and epigenetic landscape of Irf8 gene and its flanking regions in MPP, CDP, pDC, all cDC, cDC1 and cDC2 are depicted as in Figure 1A and Figure 1—figure supplement 1. Irf8 +27 kb and +32 kb enhancer (purple line and box, respectively), transcription start sites of Irf8 (Irf8-TSS) and lncIrf8 (lncIrf8-TSS) are indicated. Bottom, positions of gRNAs used in this study: gRNA1 and gRNA2, lncIrf8 promoter KO by the CRISPR/Cas9 system; Irf8-VP64 and KRAB gRNAs for activation and repression of Irf8 promoter, respectively; lncIrf8-VP64 and KRAB gRNAs for activation and repression of lncIrf8 promoter, respectively.
Figure 6
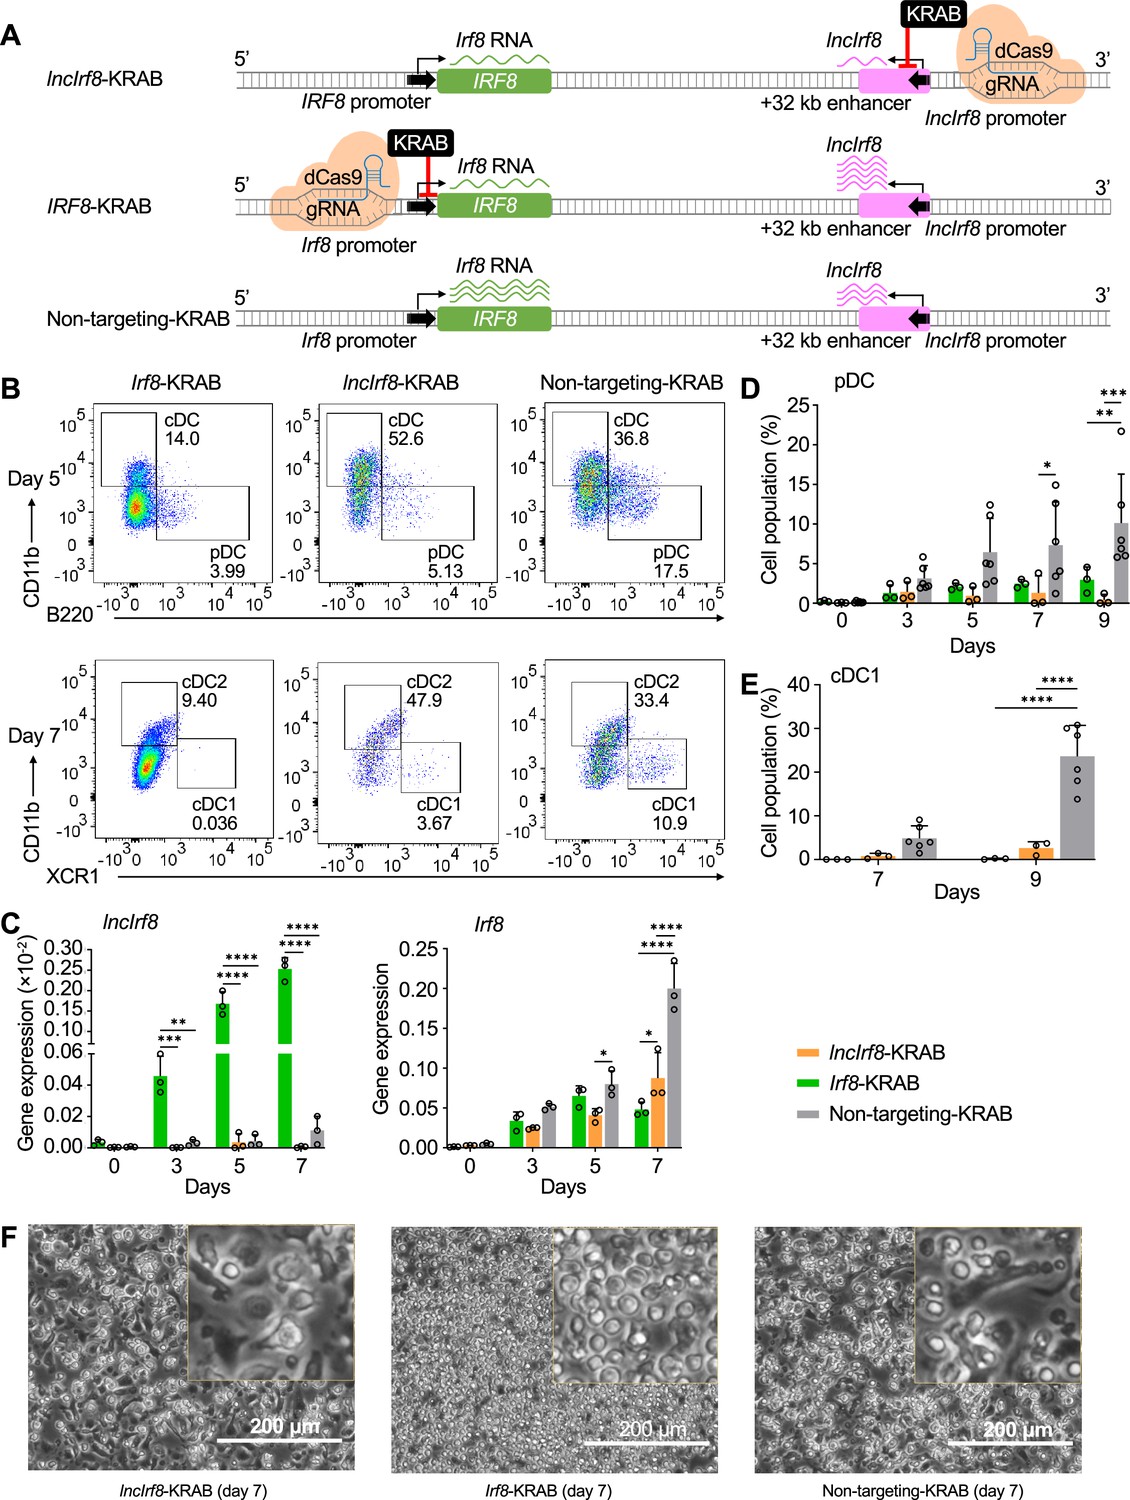
Repression of lncIrf8 promoter compromises pDC and cDC1 development.
(A) Schematic representation of lncIrf8 and Irf8 promoter repression (top and middle, respectively) by CRISPR interference with dCas9-KRAB. gRNAs were positioned downstream of lncIrf8 and Irf8 TSS to block gene transcription. dCas9-KRAB cells with non-targeting gRNA were used as control (bottom). Green and purple wavy lines represent Irf8 and lncIrf8 RNA, respectively. The number of wavy lines indicates levels of gene transcription determined by RT-qPCR in (C). (B) Representative flow cytometry analysis of CRISPR interference targeting the lncIrf8 and Irf8 promoters at day 5 and 7 of Flt3L directed DC differentiation. Two non-targeting gRNAs were used as controls and one representative non-targeting gRNA is shown (Non-targeting-KRAB). cDC and pDC at day 5 and cDC1 and cDC2 at day 7 of Flt3L directed DC differentiation are shown similar to Figure 5B. (C) Gene expression of lncIrf8 and Irf8 in lncIrf8-KRAB, Irf8-KRAB and non-targeting-KRAB HoxB8 MPP on day 0, 3, 5, and 7 of Flt3L directed DC differentiation (n=3). Gene expression analysis was by RT-qPCR and data are normalized to GAPDH. Data represent mean ± SD of three independent experiments. *p<0.05, **p<0.01, ***p<0.001, ****p<0.0001, two-way ANOVA, Tukey’s multiple comparisons test. Data that have no difference (p>0.05) are not labeled. (D and E) Quantification of pDC and cDC1 in percent of living single cells as in panel (B) on various days of Flt3L directed DC differentiation (n=3). Non-targeting-KRAB refers to both non-targeting-KRAB controls (n=6). Data represent mean ± SD of three independent experiments. *p<0.05, **p<0.01, ***p<0.001, ****p<0.0001, two-way ANOVA, Tukey’s multiple comparisons test. Data that have no difference (p>0.05) are not labeled. (F) Representative phase-contrast microscopy image of lncIrf8-KRAB, Irf8-KRAB and non-targeting-KRAB on day 7 of Flt3L directed DC differentiation. Scale bar: 200 μm.
Figure 7

Negative feedback loop of Irf8 through +32 kb enhancer governs DC differentiation.
(A) Schematic representation of Irf8 gene regulation during DC differentiation. Irf8 transcription is induced at the CDP stage by its flanking enhancers, including the +32 kb enhancer, and is further increased in pDC and cDC1 (green wavy lines; the number of wavy lines indicates levels of gene transcription as in Figure 5A and Figure 6A). The increase in Irf8 expression is due to an increase in the interactions of the Irf8 promoter with upstream and downstream sequences. Irf8 promoter interactions with upstream sequences are stronger in pDC and Irf8 promoter interactions with downstream sequences are stronger in cDC1. In pDC the +32 kb enhancer marked by lncIrf8 is less repressed by IRF8 repressor complex compared to cDC1, resulting in particularly high Irf8 expression and lncIrf8 transcription in pDC (purple wavy lines). This negative feedback inhibition of IRF8 on the +32 kb enhancer allows Irf8 to regulate its own expression and thus DC differentiation. (B) Negative feedback regulation of Irf8 through the +32 kb enhancer in cDC1 and pDC specification as described in panel (A). The RNA-seq and IRF8 ChIP-seq data are shown as in Figure 1A, Figure 1—figure supplement 1 and Figure 2—figure supplement 2A. (C) Recapitulating Irf8 and lncIrf8 transcription by repression and activation of the Irf8 +32 kb enhancer in HoxB8 MPP by targeted dCas9-KRAB and dCas9-VP64, respectively. Green and purple wavy lines represent gene expression as described in Figure 5A and Figure 6A.
Author response image 1

Mouse lncIrf8 is not conserved across species.
(A) Visualization of lncRNA downstream of Irf8 gene in mouse, human and zebrafish using data from NCBI. Red box indicates lncRNA. (B) Sequence alignment of mouse lncIrf8 and human LINC02132 using MEGA 6.0. (C) Visualization of human LINC02132 by UCSC browser. Data of gene transcription, H3K27ac signal and DNase signal are from ENCODE. (D) Gene expression of human LINC02132 in different tissues. Data are from GTEx RNA-seq in 54 tissues of 17382 samples, 948 donors.
Author response image 2
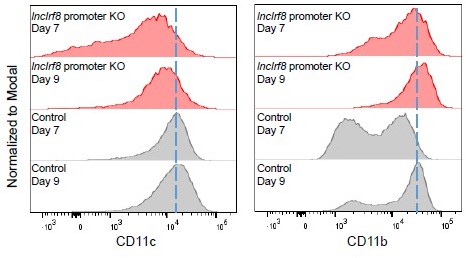
CD11c and CD11b median fluorescence intensity (MFI) of single cells in lncIrf8 promoter KO and Control cells.
Author response image 3
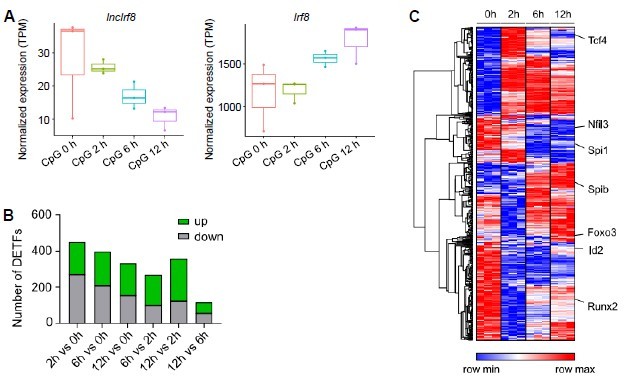
Gene expression after pDC activation by CpG 2216 stimulation.
(A) Visualization of lncIrf8 and Irf8 expression in BM cell-derived pDC upon CpG 2216 stimulation after 0, 2, 6 and 12 hours recalculated from RNA-seq data of FACS sorted pDC (CD3- CD19- CD11c+ CD11blow B220+ Siglec-H+ CD317+; GSE170750 from Mann-Nuettel et al., BMC Genom. Data, 2021). (B and C) Differentially expressed transcription factors in CpG 2216 stimulated pDC. Panel (A) is our calculation, panels (B) and (C) are from Mann-Nüttel et al., BMC Genom. Data, 2021 Figure 2B and Figure 2F.
Tables
Table 1
Off-target analysis.
| Potential off-targets | KO bulk(100 cells) | KO single-cell clones | Gene expression | |||||||||
|---|---|---|---|---|---|---|---|---|---|---|---|---|
| 6 | 7 | 19 | 21 | 24 | MPP | CDP | cDC | pDC | ||||
| gRNA1 | Chr 13: –48032179 | Gm36101 | No | No | No | No | No | No | No | No | No | No |
| Chr 2: –131293076 | Non-coding | No | No | No | No | No | No | No | No | No | No | |
| gRNA2 | Chr 1: –136050990 | AsCl5 | 16 bp deletion | 16 bp deletion | 16 bp deletion | No | 1 bp insertion | No | No | No | No | No |
| Chr 6:+119352090 | CACNA2D4 | No | No | No | No | No | No | No | No | No | Yes | |
| Chr 3:+33982811 | Non-coding | 3–29 bp deletion; 1–3 bp insertion | 3–29 bp deletion | 3 bp deletion | 1–2 bp insertion | No | No | No | No | No | No | |
| Chr 2: –132060887 | Non-coding | No | No | No | No | No | No | No | No | No | No | |
| Chr 2: –150624255 | Non-coding | No | No | No | No | No | No | No | No | No | No | |
-
Top potential off-targets of gRNA1 and gRNA2 predicted by CRISPR-Cas9 gRNA checker (see Materials and methods) were analyzed in lncIrf8 promoter KO bulk culture and KO single-cell clones by PCR analysis of genomic DNA. Potential off-target genes (coding) and non-coding sequences are listed. The absence of off-targets (No) and off-target deletions/insertion are shown.
Appendix 1—key resources table
| Reagent type (species) or resource | Designation | Source or reference | Identifiers | Additional information |
|---|---|---|---|---|
| Genetic reagent (M. musculus) | C57BL/6 mice (CD45.1 and CD45.2) | Jackson Laboratory | ||
| Genetic reagent (M. musculus) | Mx-Cas9-GFP mice | Medical Faculty, RWTH Aachen University Xu et al., 2022 | ||
| Cell line (H. sapiens) | HEK293T | ATCC | https://www.atcc.org | Lentivirus and retrovirus production |
| Cell line (M. musculus) | lncIrf8 promoter KO HoxB8 MPP; Control HoxB8 MPP | This paper | lncIrf8 promoter KO | |
| Cell line (M. musculus) | plncIrf8-pA HoxB8 MPP; pGFP-pA HoxB8 MPP | This paper | lncIrf8 overexpression and rescue | |
| Cell line (M. musculus) | Irf8-VP64 HoxB8 MPP; lncIrf8-VP64 HoxB8 MPP; Non-targeting-VP64-1 HoxB8 MPP; Non-targeting-VP64-2 HoxB8 MPP | This paper | Irf8 and lncIrf8 promoters activation | |
| Cell line (M. musculus) | Irf8-KRAB HoxB8 MPP; lncIrf8-KRAB HoxB8 MPP; Non-targeting-KRAB-1 HoxB8 MPP; Non-targeting-KRAB-2 HoxB8 MPP | This paper | Irf8 and lncIrf8 promoters repression | |
| Antibody | APC/Cyanine 7 anti-mouse/human B220 (rat monoclonal) | Biolegend | Cat# 103223; RRID: AB_313006 | FACS (1:400) |
| Antibody | Brilliant Violet 510 anti-mouse/human CD11b (rat monoclonal) | Biolegend | Cat# 101245; RRID: AB_2561390 | FACS (1:400) |
| Antibody | PE/Cyanine 7 anti-mouse CD11c (Armenian hamster monoclonal) | Biolegend | Cat# 117317; RRID: AB_493569 | FACS (1:400) |
| Antibody | APC anti-mouse CD115 (rat monoclonal) | eBioscience | Cat# 17-1152-80; RRID: AB_1210789 | FACS (1:400) |
| Antibody | PE/Cyanine 7 anti-mouse CD117 (rat monoclonal) | eBioscience | Cat# 25-1172-82; RRID: AB_469646 | FACS (1:400) |
| Antibody | PE anti-mouse CD135 (rat monoclonal) | eBioscience | Cat# 12-1351-82; RRID: AB_465859 | FACS (1:400) |
| Antibody | Biotin anti-mouse CD19 (rat monoclonal) | Biolegend | Cat# 115503; RRID: AB_313638 | FACS (1:800) |
| Antibody | Biotin anti-mouse CD3e (Armenian hamster monoclonal) | eBioscience | Cat# 13-0031-82; RRID: AB_466319 | FACS (1:800) |
| Antibody | APC/Cyanine 7 anti-mouse CD45.2 (mouse monoclonal) | Biolegend | Cat# 109823; RRID: AB_830788 | FACS (1:400) |
| Antibody | Biotin anti-mouse F4/80 (rat monoclonal) | Biolegend | Cat# 123105; RRID: AB_893499 | FACS (1:800) |
| Antibody | Alexa Fluor 700 anti-mouse Gr1 (rat monoclonal) | Biolegend | Cat# 108421; RRID: AB_493728 | FACS (1:400) |
| Antibody | PerCP/Cyanine 5.5 anti-mouse Gr1 (rat monoclonal) | eBioscience | Cat# 45-5931-80; RRID: AB_906247 | FACS (1:400) |
| Antibody | Alexa Fluor 700 anti-mouse Ly6C (rat monoclonal) | Biolegend | Cat# 128023; RRID: AB_10640119 | FACS (1:400) |
| Antibody | Biotin anti-mouse Ly6G (rat monoclonal) | Biolegend | Cat# 127603; RRID: AB_1186105 | FACS (1:800) |
| Antibody | Brilliant Violet 785 anti-mouse MHCII (rat monoclonal) | Biolegend | Cat# 107645; RRID: AB_2565977 | FACS (1:2000) |
| Antibody | Biotin anti-mouse NK1.1 (mouse monoclonal) | eBioscience | Cat# 14-5941-82; RRID: AB_467736 | FACS (1:800) |
| Antibody | Super Bright anti-mouse Siglec-H (rat monoclonal) | Invitrogen | Cat# 63-0333-82 RRID: AB_2784853 | FACS (1:400) |
| Antibody | PE/Dazzle 594 Streptavidin | Biolegend | Cat# 405247 | FACS (1:1000) |
| Antibody | Biotin anti-mouse Ter119 (rat monoclonal) | eBioscience | Cat# 14-5921-82; RRID: AB_467727 | FACS (1:800) |
| Antibody | Brilliant Violet 421 anti-mouse/rat XCR1 (mouse monoclonal) | Biolegend | Cat# 148216; RRID: AB_2565230 | FACS (1:400) |
| Antibody | 7-Aminoactinomycin D (7-AAD) | Thermo Fisher Scientific | Cat# A1310 | FACS (3 μl per test) |
| Chemical compound, drug | β-estradiol (E2) | Sigma-Aldrich | Cat# E2758 | |
| Chemical compound, drug | β-mercaptoethanol (β-ME) | Gibco | Cat# 31350010 | |
| Chemical compound, drug | BsmBI-v2 | New England Biolabs | Cat# R0739S | |
| Chemical compound, drug | Chondroitin sulfate sodium salt from shark cartilage (CSS) | Sigma-Aldrich | Cat# C4384 | |
| Chemical compound, drug | cOmplete Mini | Roche | Cat# 11836153001 | |
| Chemical compound, drug | dATP | New England Biolabs | Cat# N0440S | |
| Chemical compound, drug | Dimethysulfoxide (DMSO) | Sigma-Aldrich | Cat# D8418 | |
| Chemical compound, drug | Doxycycline hyclate | Sigma-Aldrich | Cat# D9891 | |
| Chemical compound, drug | DpnII | A kind gift from A. Marieke Oudelaar, Max Planck Institute for Multidisciplinary Sciences, Göttingen, Germany. DpnII enzyme with a similar activity is also available from New England Biolabs. | Cat# R0543M | |
| Chemical compound, drug | DMEM | Gibco | Cat# 41965039 | |
| Chemical compound, drug | DTT | Thermo Fisher Scientific | Cat# 20290 | |
| Chemical compound, drug | EDTA | Gibco | Cat# 15575–038 | |
| Chemical compound, drug | Fetal calf serum (FCS) | PAA | Cat# A01125-499 | |
| Chemical compound, drug | Fetal calf serum (FCS) | Gibco | Cat# 10270106 | |
| Chemical compound, drug | Formaldehyde (37%) | AppliChem | Cat# A0877 | |
| Chemical compound, drug | Recombinant human Flt3-Ligand (Flt3L) | Peprotech | Cat# 300–19 | |
| Chemical compound, drug | Recombinant murine stem cell factor (SCF) | Peprotech | Cat# 250–03 | |
| Chemical compound, drug | Human IGF-1 long range | Sigma-Aldrich | Cat# 85,580 C | |
| Chemical compound, drug | Recombinant IL-6/soluble IL-6 receptor fusion protein | A kind gift from S. Rose-John, Kiel, Germany Fischer et al., 1997. R&D Systems provides a similar product with the same activity. | Cat# 9038 SR | |
| Chemical compound, drug | HEPES | Sigma-Aldrich | Cat# H4034 | |
| Chemical compound, drug | L-glutamine | Gibco | Cat# 25030081 | |
| Chemical compound, drug | M-270 Streptavidin Dynabeads | Invitrogen | Cat# 65305 | |
| Chemical compound, drug | Mouse interferon α (mIFNα) | Miltenyi Biotec | Cat# 130-093-131 | |
| Chemical compound, drug | Murine RNase Inhibitor | New England Biolabs | Cat# M0314S | |
| Chemical compound, drug | Pancoll human, density 1.077 g/ml (Ficoll) | PAN-Biotech | Cat# P04-601000 | |
| Chemical compound, drug | Penicillin/streptomycin | Gibco | Cat# 15140122 | |
| Chemical compound, drug | Phenol-Chloroform-Isoamyl alcohol (PCI) | Sigma-Aldrich | Cat# 77617 | |
| Chemical compound, drug | Phosphate buffered saline (PBS) | Gibco | Cat# 10010023 | |
| Chemical compound, drug | Polybrene (PB, Hexadimethrine bromide) | Sigma-Aldrich | Cat# H9268 | |
| Chemical compound, drug | Q5 high fidelity DNA polymerase | New England Biolabs | Cat# M0491L | |
| Chemical compound, drug | RPMI 1640 | Gibco | Cat# 31870025 | |
| Chemical compound, drug | SalI | New England Biolabs | Cat# R0138S | |
| Chemical compound, drug | Supernatant from Flt3L-producing B16F1 cells (1%) | Homemade. Flt3L from Peprotech has the same activity (1:1000) | Cat# 300–19 | |
| Chemical compound, drug | Supernatant from CHO KLS C6 cells expressing soluble murine SCF (1%) | Homemade. Peprotech provides a similar product with the same activity (1:1000). | Cat# 250–03 | |
| Chemical compound, drug | SYBR-green fluorescence | Applied Biosystems | Cat# 4385610 | |
| Chemical compound, drug | T4 DNA HC ligase | Life Tech | Cat# EL0013 | |
| Chemical compound, drug | Taq DNA polymerase | Homemade | ||
| Chemical compound, drug | Taq buffer (10 x) | Thermo Fisher Scientific | Cat# B33 | |
| Chemical compound, drug | Template-switching RT enzyme mix | New England Biolabs | Cat# M0466 | |
| Chemical compound, drug | XhoI | New England Biolabs | Cat# R0146S | |
| Commercial assay or kit | Gibson Assembly kit | New England Biolabs | Cat# E5510S | |
| Commercial assay or kit | High-Capacity cDNA Reverse Transcription Kit | Applied Biosystems | Cat# 4368814 | |
| Commercial assay or kit | KAPA Hyper Capture Reagent Kit | Roche | Cat# 9075828001 | |
| Commercial assay or kit | NEBNext Ultra II DNA Library Prep Kit for Illumina | New England Biolabs | Cat# E7645S | |
| Commercial assay or kit | NEBNext Multiplex Oligos for Illumina (Index Primers Set 1) | New England Biolabs | Cat# E7335S | |
| Commercial assay or kit | NEBNext Multiplex Oligos for Illumina (Index Primers Set 2) | New England Biolabs | Cat# E7500S | |
| Commercial assay or kit | NucleoSpin RNA kit | Macherey-Nagel | Cat# 740955.250 | |
| Commercial assay or kit | PCR clean-up kit | Macherey-Nagel | Cat# 740609.50 | |
| Commercial assay or kit | TA cloning kit | Thermo Fisher Scientific | Cat# K202020 | |
| Sequence-based reagent | 5'RACE-TSO | New England Biolabs | 5’ RACE PCR primers | GCTAATCATTGCAAGCAGTGGTATC AACGCAGAGTACATrGrGrG |
| Sequence-based reagent | 5'RACE-TSO-Specific | New England Biolabs | 5’ RACE PCR primers | CATTGCAAGCAGTGGTATCAAC |
| Sequence-based reagent | 5'RACE-GSP-lncIrf8-R1 | New England Biolabs | 5’ RACE PCR primers | TGTCAGTGATGGGGGCTGGAGAAAT |
| Sequence-based reagent | 5'RACE-GSP-lncIrf8-R2 | New England Biolabs | 5’ RACE PCR primers | GCTCAGGATGCCAGGTCCCTTCTT |
| Sequence-based reagent | 3'RACE-QT | Scotto-Lavino et al., 2006 | 3’ RACE PCR primers | CCAGTGAGCAGAGTGACGAGGACTC GAGCTCAAGCTTTTTTTTTTTTTTTTT |
| Sequence-based reagent | 3'RACE-Q0 | Scotto-Lavino et al., 2006 | 3’ RACE PCR primers | CCAGTGAGCAGAGTGACG |
| Sequence-based reagent | 3'RACE-QI | Scotto-Lavino et al., 2006 | 3’ RACE PCR primers | GAGGACTCGAGCTCAAGC |
| Sequence-based reagent | 3'RACE-GSP-lncIrf8-F1 | This paper | 3’ RACE PCR primers | ATTTCTCCAGCCCCCATCACTGACA |
| Sequence-based reagent | 3'RACE-GSP-lncIrf8-F2 | This paper | 3’ RACE PCR primers | AAGAAGGGACCTGGCATCCTGAGC |
| Sequence-based reagent | lncIrf8-F | This paper | Genotyping primers | TCCTGAAGGGACAGGCAAG |
| Sequence-based reagent | lncIrf8-R | This paper | Genotyping primers | CTTGGACATTGAGGACGCC |
| Sequence-based reagent | cDC1 +32 kb-F1 | This paper | Genotyping primers | GTGACTGCAAGTAAGTTCTTCGG |
| Sequence-based reagent | cDC1 +32 kb-F2 | This paper | Genotyping primers | AAGTAGAGATTCCCTTTCTAAGCC |
| Sequence-based reagent | cDC1 +32 kb-R | This paper | Genotyping primers | ATCAGGCTGGGTGGTGGTT |
| Sequence-based reagent | Sc-lncIrf8-F | This paper | Cloning primers | ACACTCGAGACTGTCAGATGCAGGGG; the underline sequences represent cloning sites |
| Sequence-based reagent | Sc-lncIrf8-R | This paper | Cloning primers | AAAAAAGTCGACGCATCAGATTTAATATA GAACTAGGACA; the underline sequences represent cloning sites |
| Sequence-based reagent | CMV-lncIrf8-F | This paper | Genotyping primers | TGGGCGTGGATAGCGGTTT |
| Sequence-based reagent | CMV-lncIrf8-R | This paper | Genotyping primers | CACTGAGACTTAGCAAGGGGGA |
| Sequence-based reagent | CMV-GFP-F | This paper | Genotyping primers | TGGGCGTGGATAGCGGTTT |
| Sequence-based reagent | CMV-GFP-R | This paper | Genotyping primers | TGGGGGTGTTCTGCTGGTAG |
| Sequence-based reagent | mlncIrf8-tQ-F | This paper | RT-qPCR primers | ACTGTCAGATGCAGGGG |
| Sequence-based reagent | mlncIrf8-tQ-R | This paper | RT-qPCR primers | TCACAATCGTCTGTAACTCCG |
| Sequence-based reagent | mIrf8-tQ-F | This paper | RT-qPCR primers | GAGCGAAGTTCCTGAGATGG |
| Sequence-based reagent | mIrf8-tQ-R | This paper | RT-qPCR primers | TGGGCTCCTCTTGGTCATAC |
| Sequence-based reagent | mGAPDH-tQ-F | This paper | RT-qPCR primers | ACCTGCCAAGTATGATGACATCA |
| Sequence-based reagent | mGAPDH-tQ-R | This paper | RT-qPCR primers | GGTCCTCAGTGTAGCCCAAGAT |
| Sequence-based reagent | m3C-F | Downes et al., 2021; Downes et al., 2022 | Capture-C qPCR primers | GGAGAAAGAAGGCTGGTGTTAT |
| Sequence-based reagent | m3C-R | Downes et al., 2021; Downes et al., 2022 | Capture-C qPCR primers | TATCTGAGTTGGACAGCATTGG |
| Sequence-based reagent | m3C-control-F | Downes et al., 2021; Downes et al., 2022 | Capture-C qPCR primers | TTATCTTGCATTTGCCAACTCG |
| Sequence-based reagent | m3C-control-R | Downes et al., 2021; Downes et al., 2022 | Capture-C qPCR primers | TGGGTTTCCCTGATTCTGAAA |
| Sequence-based reagent | Irf8_P_L | This paper | Capture probes | GATCCGTGCATCACCAGCCTCC TTGACCTTAGGCAGACGCCCCA GCCCCCCGGCCATTTTTGGGGCAGCC |
| Sequence-based reagent | Irf8_P_R | This paper | Capture probes | CCAAATGAACAAACACCTCTCCC TTTAAAATCTGCCTGATGGCCAA CTTCATAATGAAGAGAAATAGATC |
| Sequence-based reagent | gRNA-1-F | This paper | gRNAs | CACCGTCCATTATACTAAGATACCC; the underline sequences represent cloning sites |
| Sequence-based reagent | gRNA-1-R | This paper | gRNAs | AAACGGGTATCTTAGTATAATGGAC; the underline sequences represent cloning sites |
| Sequence-based reagent | gRNA-2-F | This paper | gRNAs | CACCGGTGCCGAGAAAGGACACGT; the underline sequences represent cloning sites |
| Sequence-based reagent | gRNA-2-R | This paper | gRNAs | AAACACGTGTCCTTTCTCGGCACC; the underline sequences represent cloning sites |
| Sequence-based reagent | gRNA-KO1-5‘F | Durai et al., 2019 | gRNAs | CACCGTTGTGATCTTTGAGGTAGA; the underline sequences represent cloning sites |
| Sequence-based reagent | gRNA-KO1-5’R | Durai et al., 2019 | gRNAs | AAACTCTACCTCAAAGATCACAAC; the underline sequences represent cloning sites |
| Sequence-based reagent | gRNA-KO1-3‘F | Durai et al., 2019 | gRNAs | CACCGAACTGGCCTGGGGCAGGTC; the underline sequences represent cloning sites |
| Sequence-based reagent | gRNA-KO1-3’R | Durai et al., 2019 | gRNAs | AAACGACCTGCCCCAGGCCAGTTC; the underline sequences represent cloning sites |
| Sequence-based reagent | gRNA-KO2-5’F | This paper | gRNAs | CACCGACATTCTGCACCCCAGTCA; the underline sequences represent cloning sites |
| Sequence-based reagent | gRNA-KO2-5’R | This paper | gRNAs | AAACTGACTGGGGTGCAGAATGTC; the underline sequences represent cloning sites |
| Sequence-based reagent | gRNA-KO2-3’F | This paper | gRNAs | CACCGAGGATCGCACCTCACCTACT; the underline sequences represent cloning sites |
| Sequence-based reagent | gRNA-KO2-3’R | This paper | gRNAs | AAACAGTAGGTGAGGTGCGATCCTC; the underline sequences represent cloning sites |
| Sequence-based reagent | gRNA-Irf8-VP64-F | This paper | gRNAs | CACCGACGGTCGCGCGAGCTAATTG; the underline sequences represent cloning sites |
| Sequence-based reagent | gRNA-Irf8-VP64-R | This paper | gRNAs | AAACCAATTAGCTCGCGCGACCGTC; the underline sequences represent cloning sites |
| Sequence-based reagent | gRNA-Irf8-KRAB-F | This paper | gRNAs | CACCGCGGCAGGTAGGACGCGATG; the underline sequences represent cloning sites |
| Sequence-based reagent | gRNA-Irf8-KRAB-R | This paper | gRNAs | AAACCATCGCGTCCTACCTGCCGC; the underline sequences represent cloning sites |
| Sequence-based reagent | gRNA-lncIrf8-VP64-F | This paper | gRNAs | CACCGGTGCCGAGAAAGGACACGT; the underline sequences represent cloning sites |
| Sequence-based reagent | gRNA-lncIrf8-VP64-R | This paper | gRNAs | AAACACGTGTCCTTTCTCGGCACC; the underline sequences represent cloning sites |
| Sequence-based reagent | gRNA-lncIrf8-KRAB-F | This paper | gRNAs | CACCGAGTCACTCGTCCTTTGGGG; the underline sequences represent cloning sites |
| Sequence-based reagent | gRNA-lncIrf8-KRAB-R | This paper | gRNAs | AAACCCCCAAAGGACGAGTGACTC; the underline sequences represent cloning sites |
| Sequence-based reagent | gRNA-non-targeting-1-F | Manguso et al., 2017 | gRNAs | CACCGCGAGGTATTCGGCTCCGCG; the underline sequences represent cloning sites |
| Sequence-based reagent | gRNA-non-targeting-1-R | Manguso et al., 2017 | gRNAs | AAACCGCGGAGCCGAATACCTCGC; the underline sequences represent cloning sites |
| Sequence-based reagent | gRNA-non-targeting-2-F | Manguso et al., 2017 | gRNAs | CACCGATGTTGCAGTTCGGCTCGAT; the underline sequences represent cloning sites |
| Sequence-based reagent | gRNA-non-targeting-2-R | Manguso et al., 2017 | gRNAs | AAACATCGAGCCGAACTGCAACATC; the underline sequences represent cloning sites |
| Software, algorithm | Bamtofastq | 10 x Genomics | https://support.10xgenomics.com/docs/bamtofastq | |
| Software, algorithm | Bowtie2 | Langmead and Salzberg, 2012 | http://bowtie-bio.sourceforge.net | |
| Software, algorithm | CapCruncher (v0.1.1a1) | Downes et al., 2022 | https://github.com/sims-lab/CapCruncher | |
| Software, algorithm | CPAT | Wang et al., 2013 | http://code.google.com/p/cpat/ | |
| Software, algorithm | Cufflinks (version 2.0) | Trapnell et al., 2012 | http://cufflinks.cbcb.umd.edu/ | |
| Software, algorithm | FlowJo V10 | BD Biosciences | ||
| Software, algorithm | IGV browser | Broad Institute | ||
| Software, algorithm | MOODS | Korhonen et al., 2009 | https://www.cs.helsinki.fi/group/pssmfind/ | |
| Software, algorithm | Oligo | Oudelaar et al., 2020 | https://oligo.readthedocs.io/en/latest/index.html | |
| Software, algorithm | PhyloCSF | Lin et al., 2011 | http://compbio.mit.edu/PhyloCSF | |
| Software, algorithm | Prism | GraphPad | ||
| Software, algorithm | Scanpy | Wolf et al., 2018 | ||
| Software, algorithm | Star aligner (version 2.4) | Dobin et al., 2013 | http://code.google.com/p/rna-star/ | |
| Software, algorithm | Snapgene | GSL Biotech | ||
| Software, algorithm | UMAP | Becht et al., 2019 |
Additional files
Download links
A two-part list of links to download the article, or parts of the article, in various formats.
Downloads (link to download the article as PDF)
Open citations (links to open the citations from this article in various online reference manager services)
Cite this article (links to download the citations from this article in formats compatible with various reference manager tools)
A lncRNA identifies Irf8 enhancer element in negative feedback control of dendritic cell differentiation
eLife 12:e83342.
https://doi.org/10.7554/eLife.83342


