Tyramine and its Amtyr1 receptor modulate attention in honey bees (Apis mellifera)
- School of Life Sciences, Arizona State University, United States
Figures
Figure 1
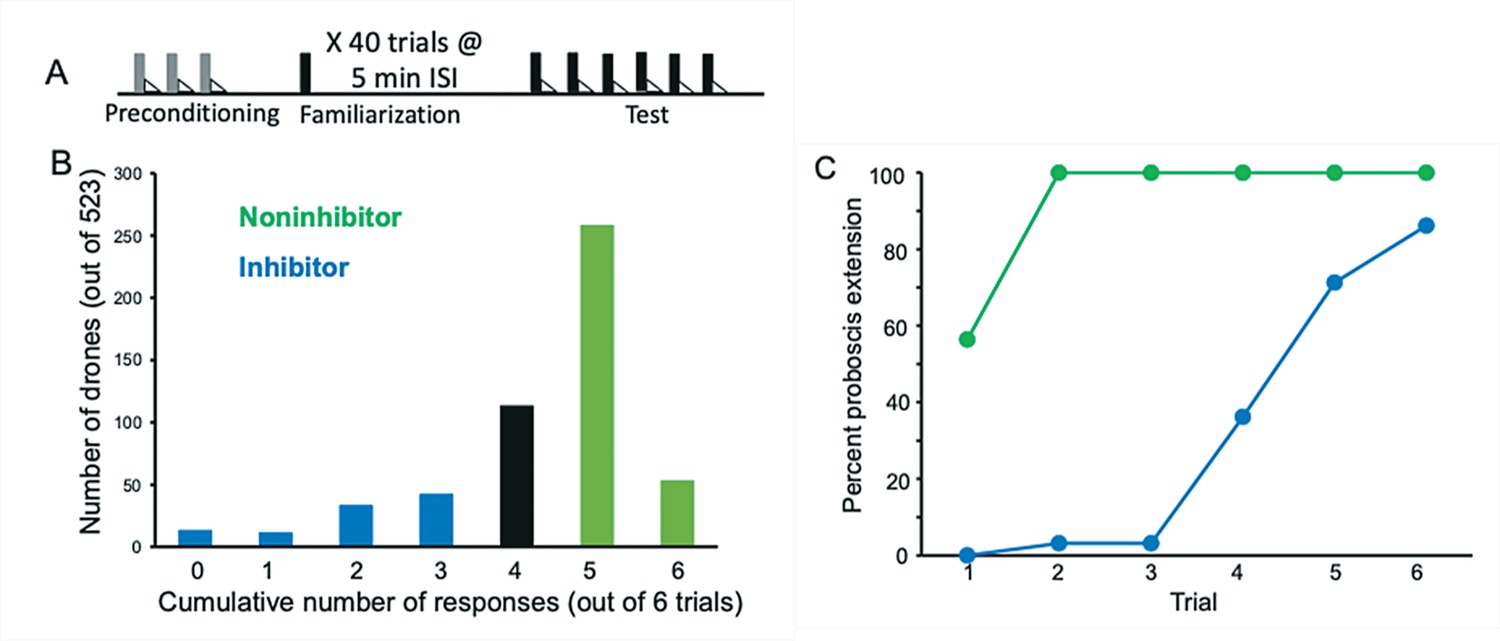
Evaluation and selection of drones from an F1 queen.
(A) Drone honey bees were first evaluated by conditioning them over three trials to an odor (A; gray bars) followed by sucrose reinforcement (triangles) in a way that produces robust associative conditioning expressed as odor-induced proboscis extension response (PER) (Bitterman et al., 1983). All drones that showed no PER response on the first trial and PER response on each of the following two trials were selected for the subsequent familiarization phase. This procedure ensured that only drones motivated to respond to sucrose and learn the association with odor were selected. Approximately 10% of honey bees fail to show evidence of learning in PER conditioning using the collection methods described in Materials and methods. The familiarization phase involved 40 4 s exposures to a different odor (X; black bars) using a 5-min interstimulus interval. These conditions are sufficient for generating latent inhibition that lasts for at least 24 hr (Chandra et al., 2010). Finally, the test phase involved six exposures to X followed by sucrose reinforcement. (B) Frequency distribution of 523 drones evaluated in the test phase. The x-axis shows the summed number of responses over six conditioning trials. Fewer responses correspond to stronger latent inhibition. A total of 94 drones were selected in each tail of the distribution. ‘Inhibitor’ drones showed zero through three responses, and ‘Noninhibitor’ drones showed five or six responses. (C) Acquisition curves for the 94 inhibitor and noninhibitor drones. Approximately half of the noninhibitor drones showed spontaneous responses on the first trial, which is typical for noninhibitors in latent inhibition studies of honey bees (Chandra et al., 2010). All of the drones in that category showed responses on trials 1–6. In contrast, inhibitor drones showed delayed acquisition to the now familiar odor.
Figure 2
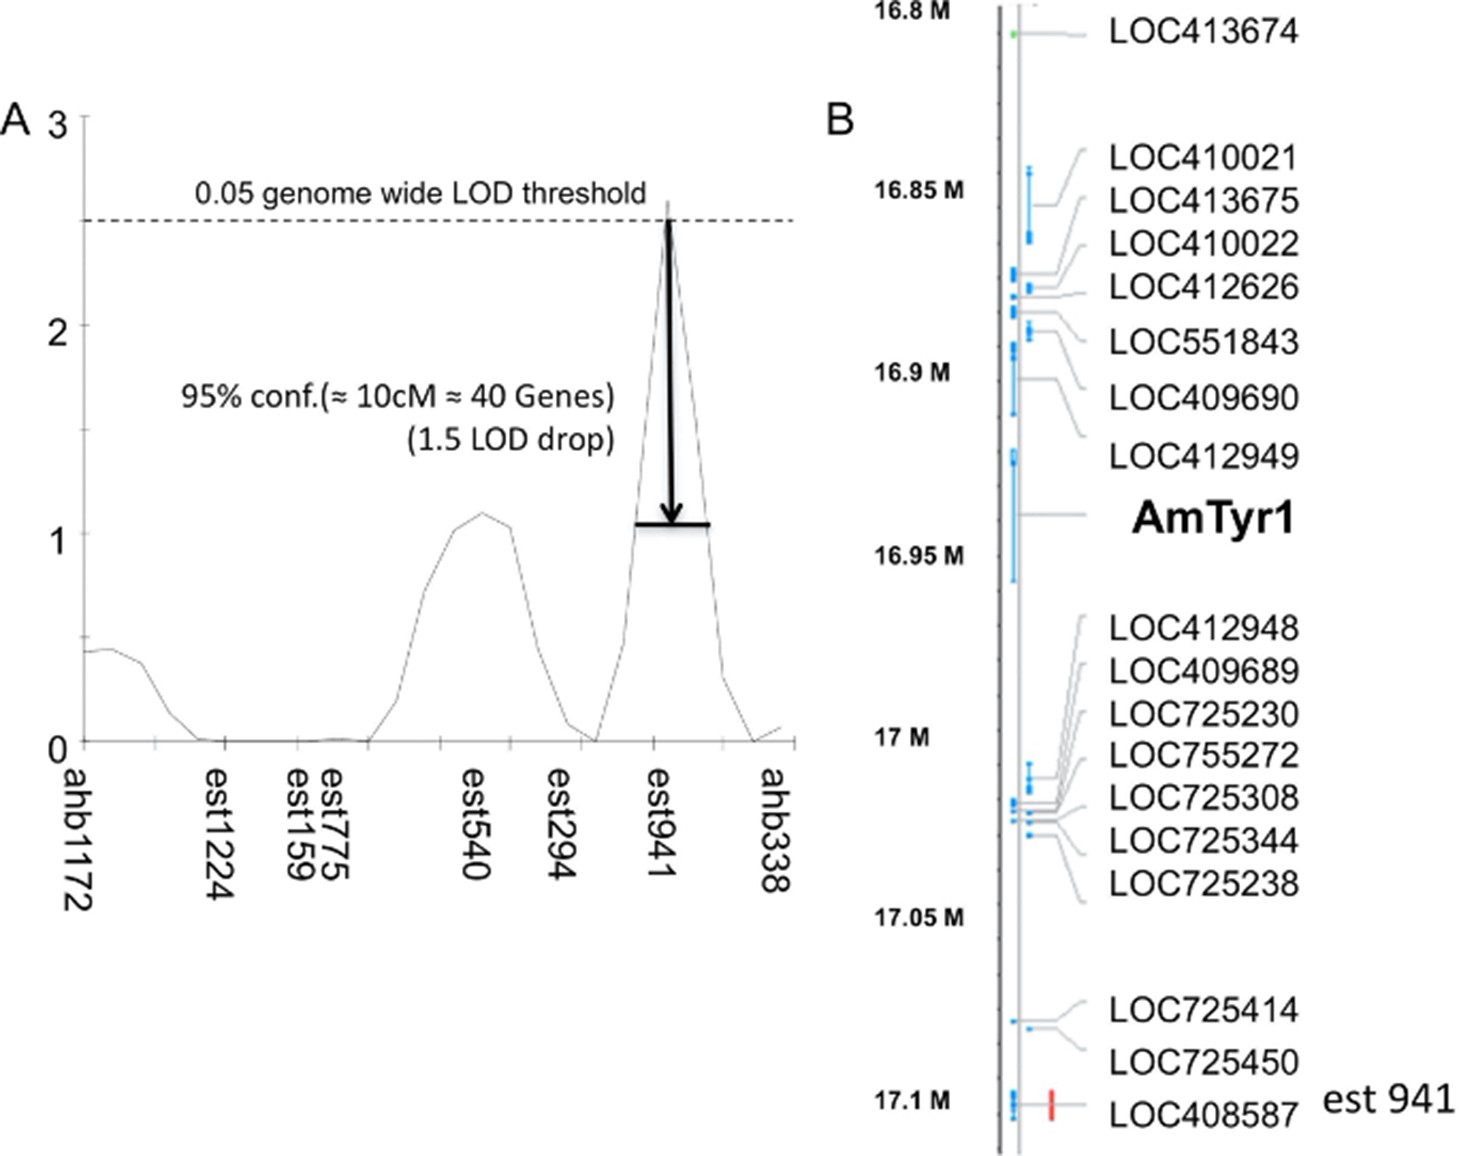
Single-nucleotide polymorphism (SNP) mapping of high and low recombinant drones.
(A) Markers from linkage group 1.55 surrounding one significant Quantitative Trait Locus (QTL; est941 with a LOD score of 2.6). (B) Partial list of genes within 10 cM of the marker showing the location of Amtyr1.
Figure 3
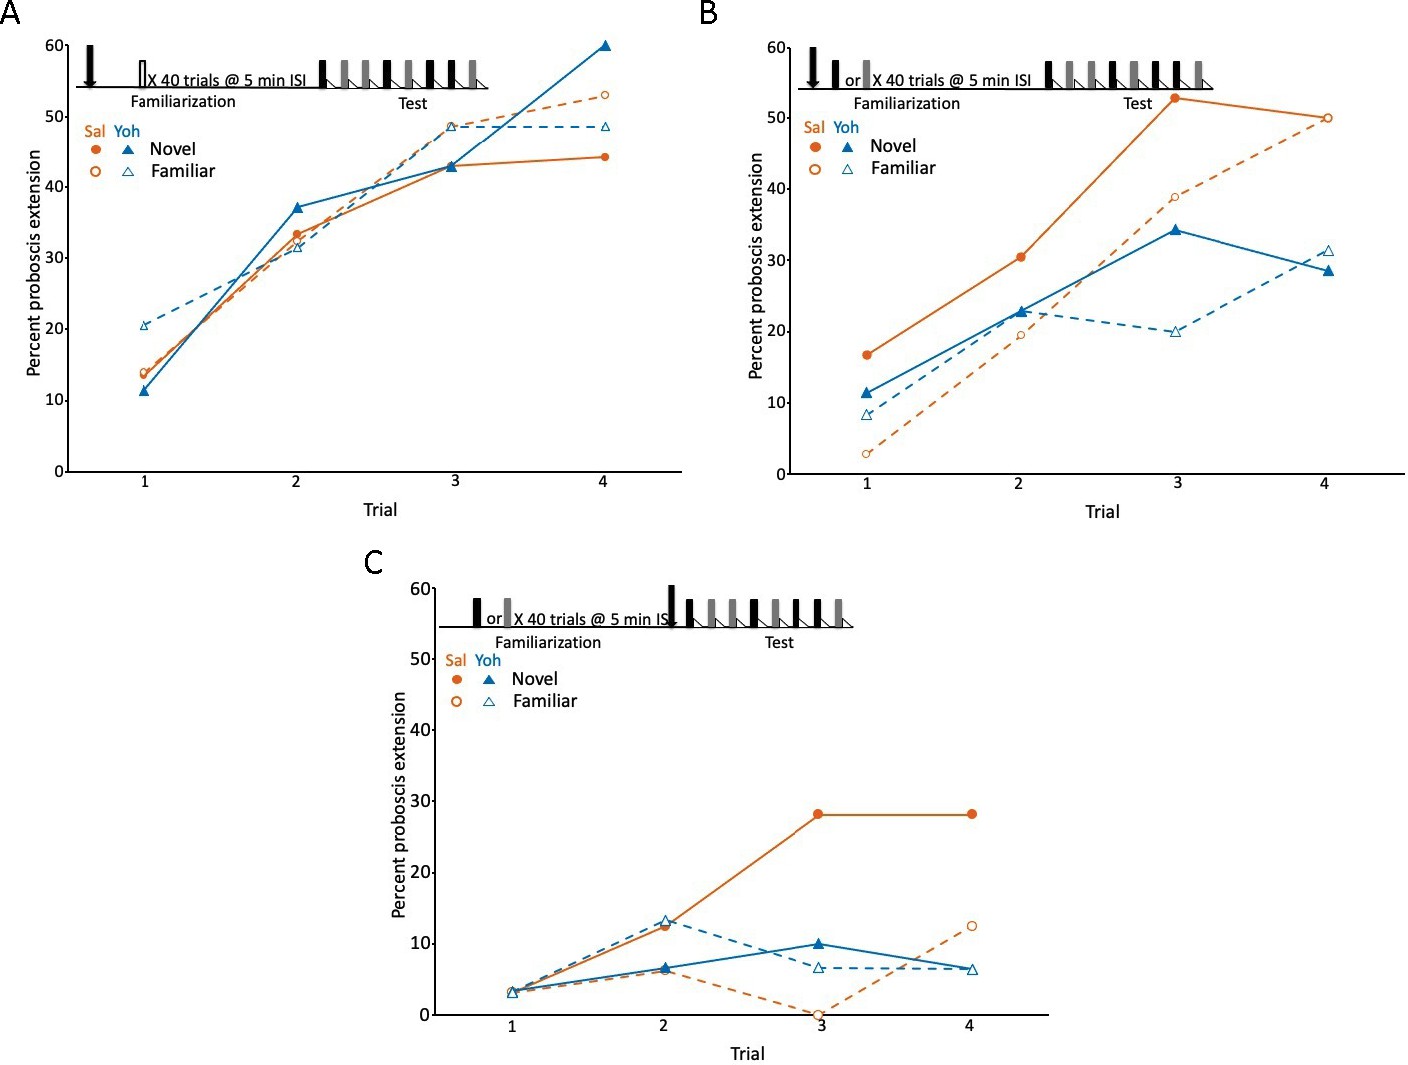
Blockade of the tyramine receptor with yohimbine modulated expression of latent inhibition.
(A) Acquisition during the test phase in two injection groups of honey bees familiarized to air as a control procedure to evaluate the effects of yohimbine on excitatory conditioning. The conditioning protocol is shown at the top. In this experiment (and in B and C) we omitted the first phase (Figure 1A), which does not affect expression of latent inhibition (Chandra et al., 2010) and is only necessary when subjects are being selected for development of genetic lines. One group was injected (arrow) with saline (orange circles; n = 37 animals) and the other with yohimbine (blue triangles; n = 35) prior to familiarization. Because there was no odor presented during familiarization (open box), odors during the test phase were both ‘novel’ when conditioned, although one was arbitrarily assigned as familiar. The test phase in this experiment (also in B and C) differed from the test phase in Figure 1. For this design, each subject was equivalently conditioned to both odors on separate, pseudorandomly interspersed trials. Acquisition to both odors in both injection groups was evident as a significant effect of trial (X2 = 47.5, df = 3, p < 0.001). None of the remaining effects (odor, injection, or any of the interaction terms) were significant (p > 0.05). (B) As in A, except both groups (orange saline: n = 36; blue yohimbine: n = 36) in this experiment were familiarized to odor; each odor (gray and black boxes; see Methods) was familiarized in approximately half of the animals in each injection group. In this design, each individual was equivalently conditioned to both odors during the test phase; latent inhibition is evident when the response to the novel odor is greater than to the familiar odor. Injection was prior to odor familiarization. (C) As in B, except injection of saline (n = 32) or yohimbine (n = 30) occurred prior to the test phase. Statistical analysis of datasets in B and C yielded a significant interaction (X2 = 7.4, df = 1, p < 0.01) between injection (saline vs yohimbine) and odor (novel vs familiar) that was the same in both experiments, as judged by the lack of a significant odor × injection × experiment interaction term (p > 0.05). There was a higher response to the novel odor than to the familiar odor, but only in the saline injected groups. The lower rate of acquisition in C (X2 = 64.0, 1, p < 0.01) could be due to performance of this experiment at a different time of year, or to injections immediately prior to testing, which affects levels proboscis extension response (PER) conditioning in honey bees but leaves intact relative differences between groups (Gerber et al., 1996).
Figure 4
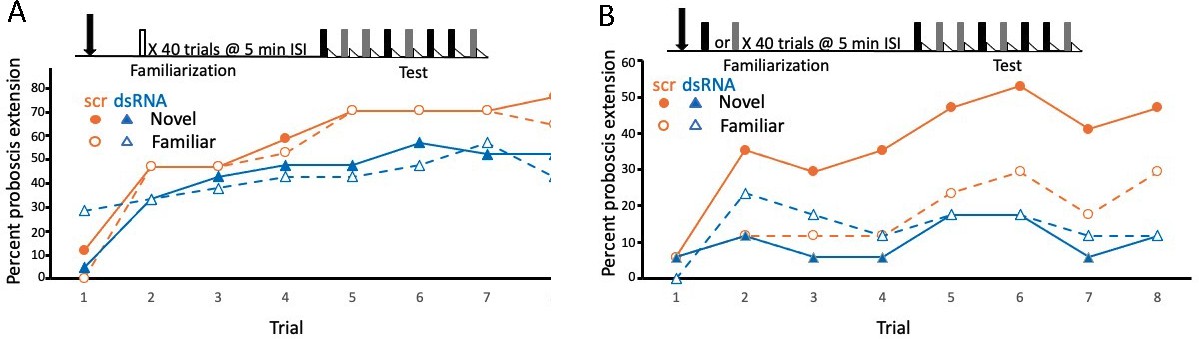
Disruption of translation of the tyramine receptor by DsiRNA also modulated expression of latent inhibition.
This experiment was identical to that shown in Figure 3A, B, except injections were performed with a mixture of Dsi Amtyr1RNA (dsRNA; arrow) 24 hr prior to behavioral training and testing. The control for this experiment was a scrambled sequence of the Amtyr1 RNA, Dsiscr (scr). (A) After treatment with Dsiscr (N = 17) or DsiRNA (N = 19) and familiarization to air, acquisition to both odors was significant across trials (X2 = 62.7, 7, p << 0.01). There was also a significant effect of injection (X2 = 8.8, 1, p < 0.01). However, the odor × injection interaction was not significant. (B) Same as in A, except familiarization was to odor (Dsiscr (N = 17) DsiRNA (N = 13)). The injection × odor interaction was significant (X2 = 7.8, 1, p < 0.01). Quantitative PCR analysis of Amtyr1 mRNA levels in brains revealed lower levels of mRNA in DsiAmtyr1 injected animals (0.046 ± 0.006) than in Dsiscr injected animals (0.142 ± 0.028).
Figure 5
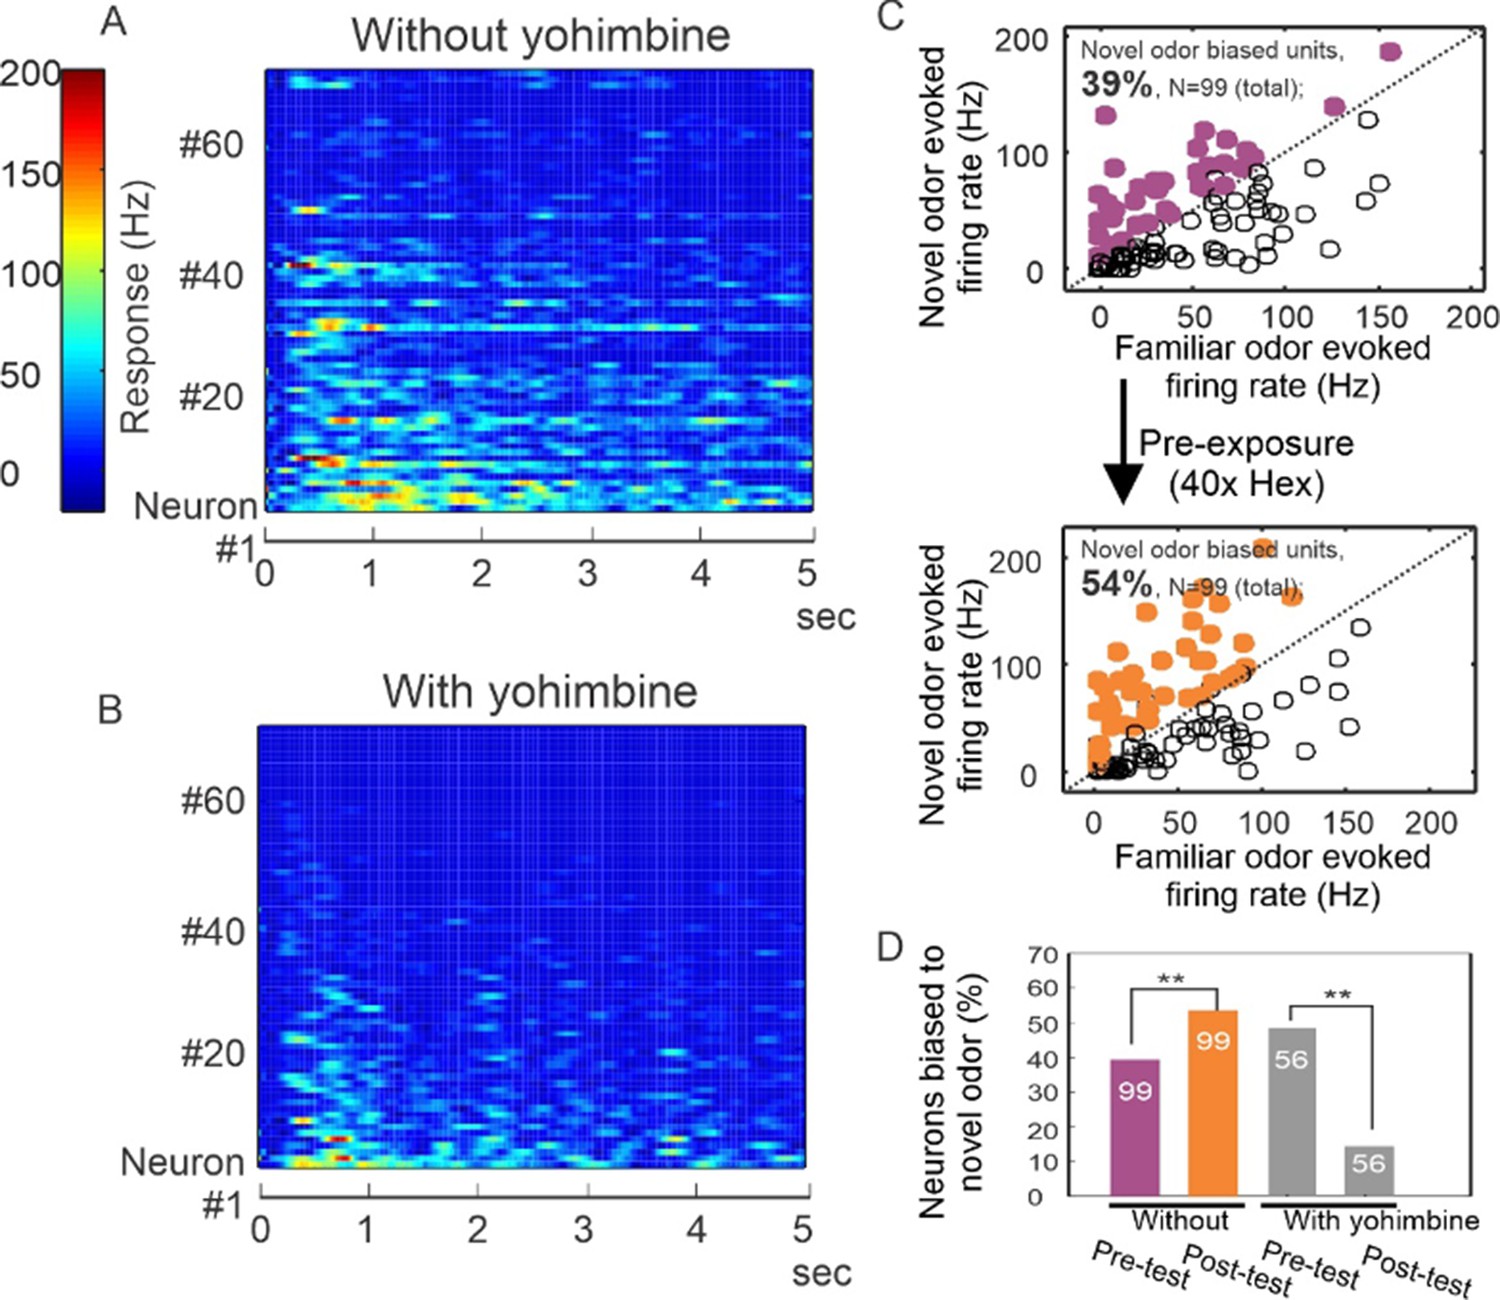
Yohimbine disrupts processing in the honey bee antennal lobe.
(A, B) Perfusion of yohimbine solution (50 µM in physiological saline) into honey bee head capsule caused antennal lobe units to decrease response magnitude to odor stimuli (2-octanone and 1-hexanol) in general. Odor was delivered through a solenoid valve that was open at time zero and lasted for 4 s. (C) In control experiments where yohimbine was not applied, most of the units were responsive to both hexanol and octanone, but 39% were biased toward octanone (purple dots above the diagonal line), that is showing stronger response to octanone than to hexanol. During the familiarization protocol, these units were familiarized to hexanol 40 times with 1-min interval (arrow down) and were tested again with hexanol and octanone 10 min after the last odor stimulation in the familiarization phase. The test results show 54% of units responded more strongly to octanone (orange dots), which is a novel odor in this protocol. The 15% increase is statistically significant (McNemar test with Yates’s correction, df = 1, Chi-square = 5.939, p < 0.02) (asterisks on purple and orange bars, N = 99). (D) When the familiarization protocol was used with saline versus yohimbine perfusion, the response bias toward novel odor was disrupted, showing a significant decrease in comparison with the familiar odor (McNemar test with Yates’s correction, df = 1, Chi-square = 11.13, p < 0.001) (asterisks on gray bars, N = 56).
Figure 6
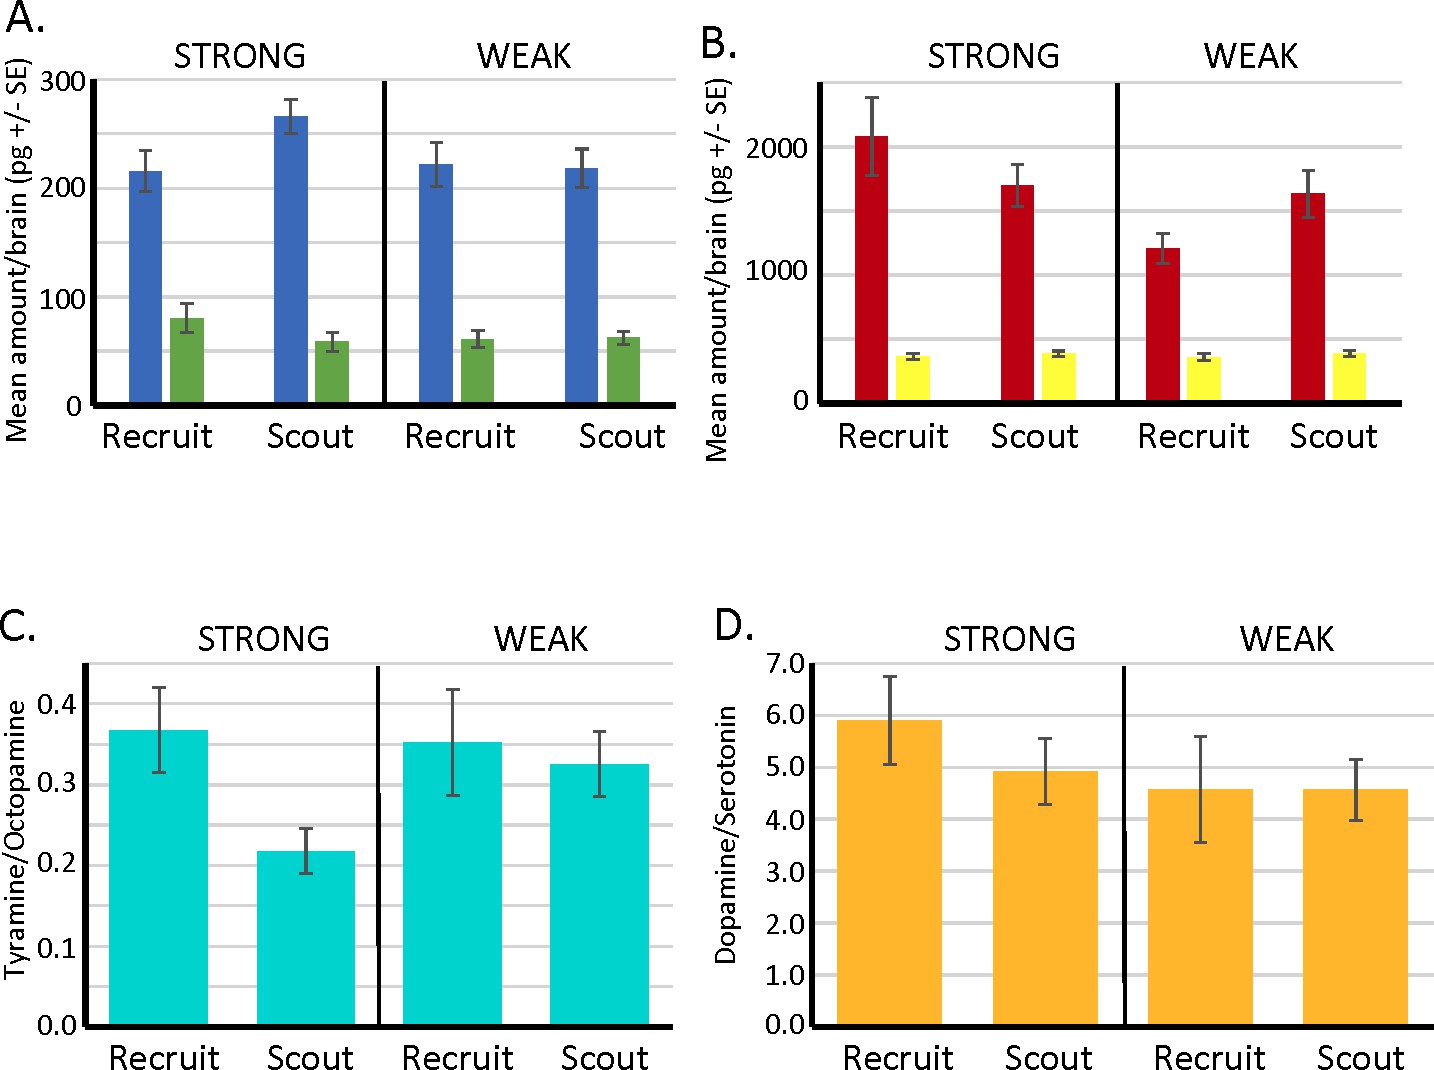
Biogenic amine levels in individual brains of scout and recruit foragers that expressed strong or weak latent inhibition.
(A, B) Absolute levels of octopamine (blue) and tyramine (green) and of dopamine (red) and serotonin (yellow) in individual forager brains. (C) Ratios of tyramine/octopamine. In foragers that exhibited strong latent inhibition, the ratio was significantly lower in scouts (N = 25) than recruits (N = 13) (Wilcoxon W = 56.0, p < 0.05). Ratios did not differ in scouts (N = 24) and recruits (N = 19) that exhibited weak latent inhibition (p > 0.05). (D) Ratios of dopamine/serotonin did not differ in either the strong or weak groups (p > 0.05). Sample sizes the same as in C.
Figure 7
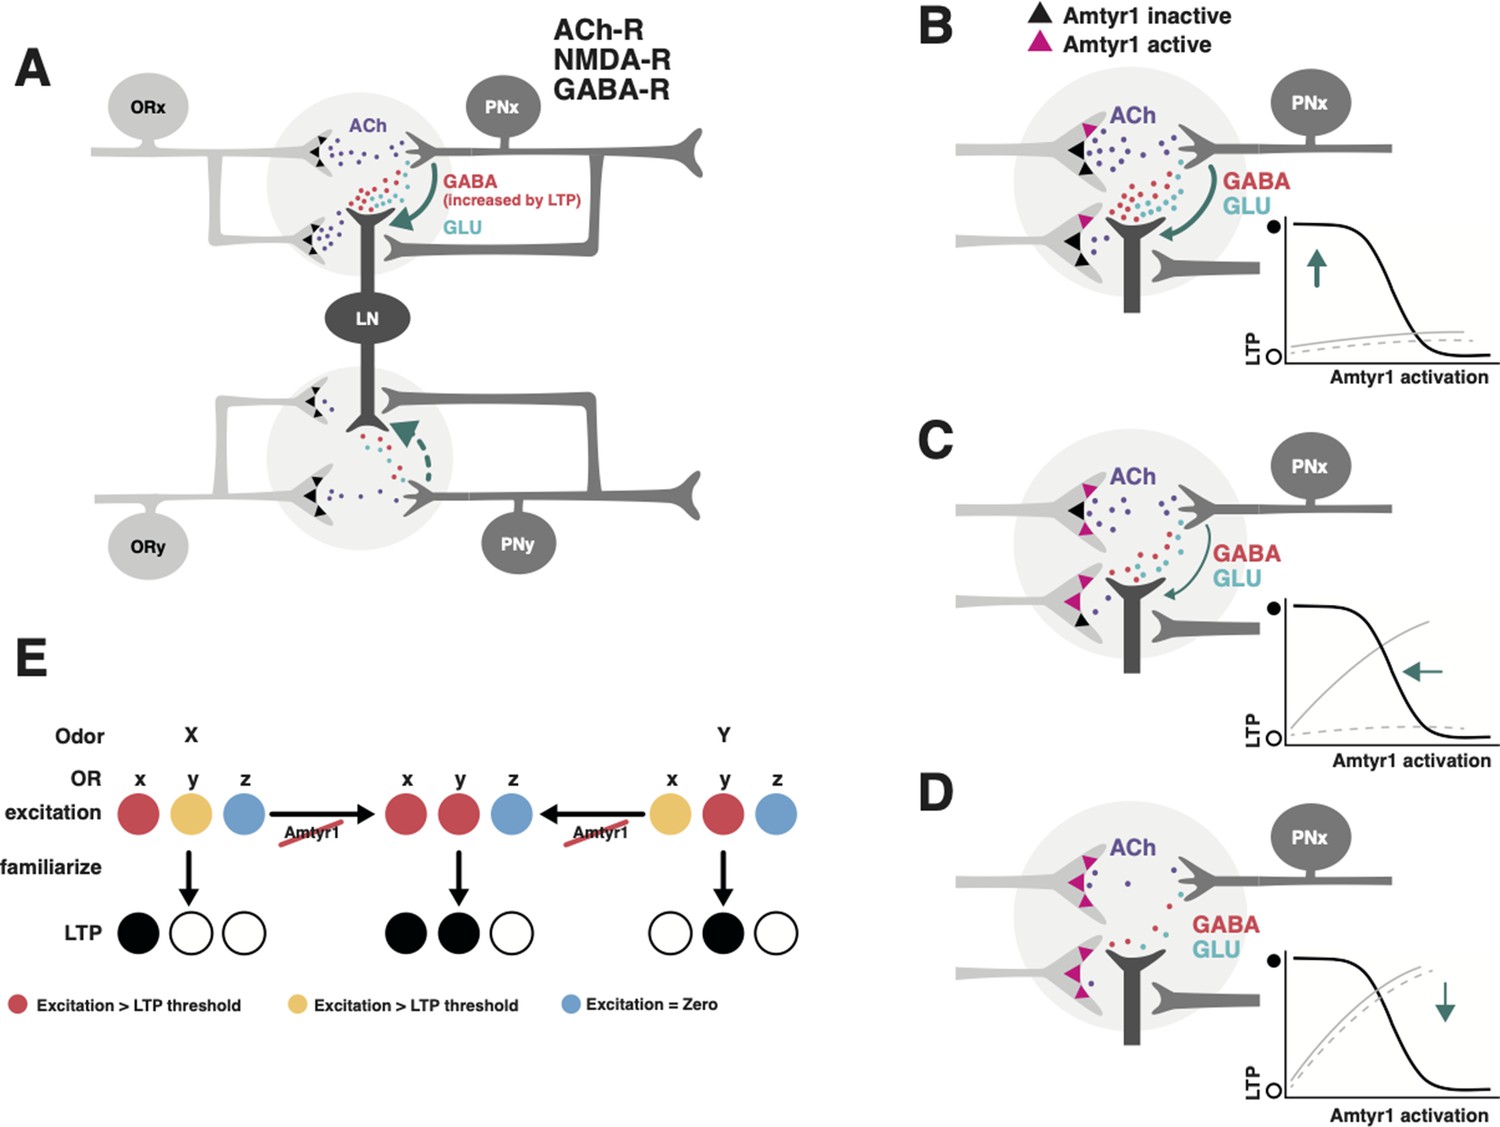
Hypothetical model of how Amtyr1 could modulate hebbian plasticity inhibition to modulate latent inhibition.
(A) Circuitry of two glomeruli (A has been adapted from Figure P1 from Das et al., 2011) that underlies latent inhibition (habituation) in the fruit fly antennal lobe, and which was also proposed via a computational model to underlie changes in antennal lobe responses to familiar and novel odors in the honey bee (Locatelli et al., 2013). The only addition here is incorporation of Amtyr1 receptors on Olfactory Receptor Neuron axon terminals (Sinakevitch et al., 2017). In the fruit fly (Das et al., 2011), ORNs release Ach (purple) to coactivate Projection Neurons (PNs) and Local GABAergic Inhibitory Interneurons (LNs), which both express ACh receptors. LNs release both GABA (red) and glutamate (green) onto synapses with PNs. NMDA receptors on PNs potentiate the LN/PN synapses via a retrograde signal (green arrows) to LNs to hypothetically increase the release of GABA. This hebbian plasticity increases inhibition of PNs by LNs and thus decreases excitation of the PN. LN/PN coactivation in other glomeruli is either nonexistent (e.g. Das et al., 2011), too low to produce potentiation of the LN/PN synapse, or strong enough to produce inhibition to odors other than the familiar odor (dashed green arrow). AmTYR1 receptors on presynaptic terminals of ORNs (Sinakevitch et al., 2017) are shown as black triangles. Here, we do not show the source for tyramine. We assume it could be from the VUM neuron, which has terminals in the cortex of every glomerulus, where ORN terminals overlap with PN and LN dendrites (Sinakevitch et al., 2013). (B–D) Increasing activation of AmTYR1 (pink triangles) progressively decreases release of ACh and lowers coactivation of LNs and PNs. Decreased coactivation reaches a threshold (D) below which it fails to modify the LN/PN synapse, although ACh release might still activate the glomeruli. Graphs inset in each figure show the hypothetical relationship between activation of AmTYR1 (x-axis) verses LTP-based hebbian plasticity (y-axis; open and filled circles indicate low and high LTP, respectively). Low activation of AmTYR1 produces high coactivation-based LTP (B) and vice versa (D). Arrows show the hypothetical point on the LTP curve that represents LTP in each figure. Gray lines represent the hypothetical acquisition levels to novel (solid) and familiar (dashed) odors given the strength of hebbian plasticity in each figure. For these lines, the x-axis would be ‘Trial’ and y-axis ‘Percent proboscis extension’, as in Figures 3 and 4. (E) Hypothetical relationship between overlapping odor coding, Amtyr1 activity and LTP across three ORN types in the antennal lobe. ORNs x and y show coding with different levels of activity (red, yellow, blue high to no activity) for odors X and Y. Disruption of Amtyr1 increases activity in x and y but not in a third ORN(z), which shows no activity to either odor. LTP is generated whenever activity reaches a ‘red’ threshold.
Tables
Table 1
Nucleotide sequences of sense and antisense strands of control DsiSCR and AmTyr1 DsiRNA.
| DsiRNA | Sequences |
|---|---|
| DsiScr | 5′-GAGUCCUAAGUUAACCAAGUCACAGCA-3′ 3′-CUCAGGAUUCAAUUGGUUCAGUGUCGU-5′ |
| DsiTyr1_N | 5′-AGCGUGACGUUGGAUUGACGAGAGC-3′ 3′-CCUCGCACUGCAACCUAACUGCUCUCG-5′ |
| DsiTyr1_T1 | 5′-CCUGUGCAAAUUGUGGCUAACCUGC-3′ 3′-GUGGACACGUUUAACACCGAUUGGACG-5′ |
| DsiTyr_C | 5′-CAACGCUUGUUUAUUGCAUCUAUCG-3′ 3′-CCGUUGCGAACAAAUAACGUAGAUAGC-5′ |
Additional files
Download links
A two-part list of links to download the article, or parts of the article, in various formats.
Downloads (link to download the article as PDF)
Open citations (links to open the citations from this article in various online reference manager services)
Cite this article (links to download the citations from this article in formats compatible with various reference manager tools)
Tyramine and its Amtyr1 receptor modulate attention in honey bees (Apis mellifera)
eLife 12:e83348.
https://doi.org/10.7554/eLife.83348


