Heterosynaptic plasticity of the visuo-auditory projection requires cholecystokinin released from entorhinal cortex afferents
- Department of Neuroscience, City University of Hong Kong, China
- Centre for Regenerative Medicine and Health, Hong Kong Institute of Science & Innovation, Chinese Academy of Sciences, China
- Department of Neuroscience, Karolinska Institutet, Sweden
- City University of Hong Kong Shenzhen Research Institute, China
- Institute of Advanced Study, City University of Hong Kong, China
Figures
Figure 1 with 1 supplement
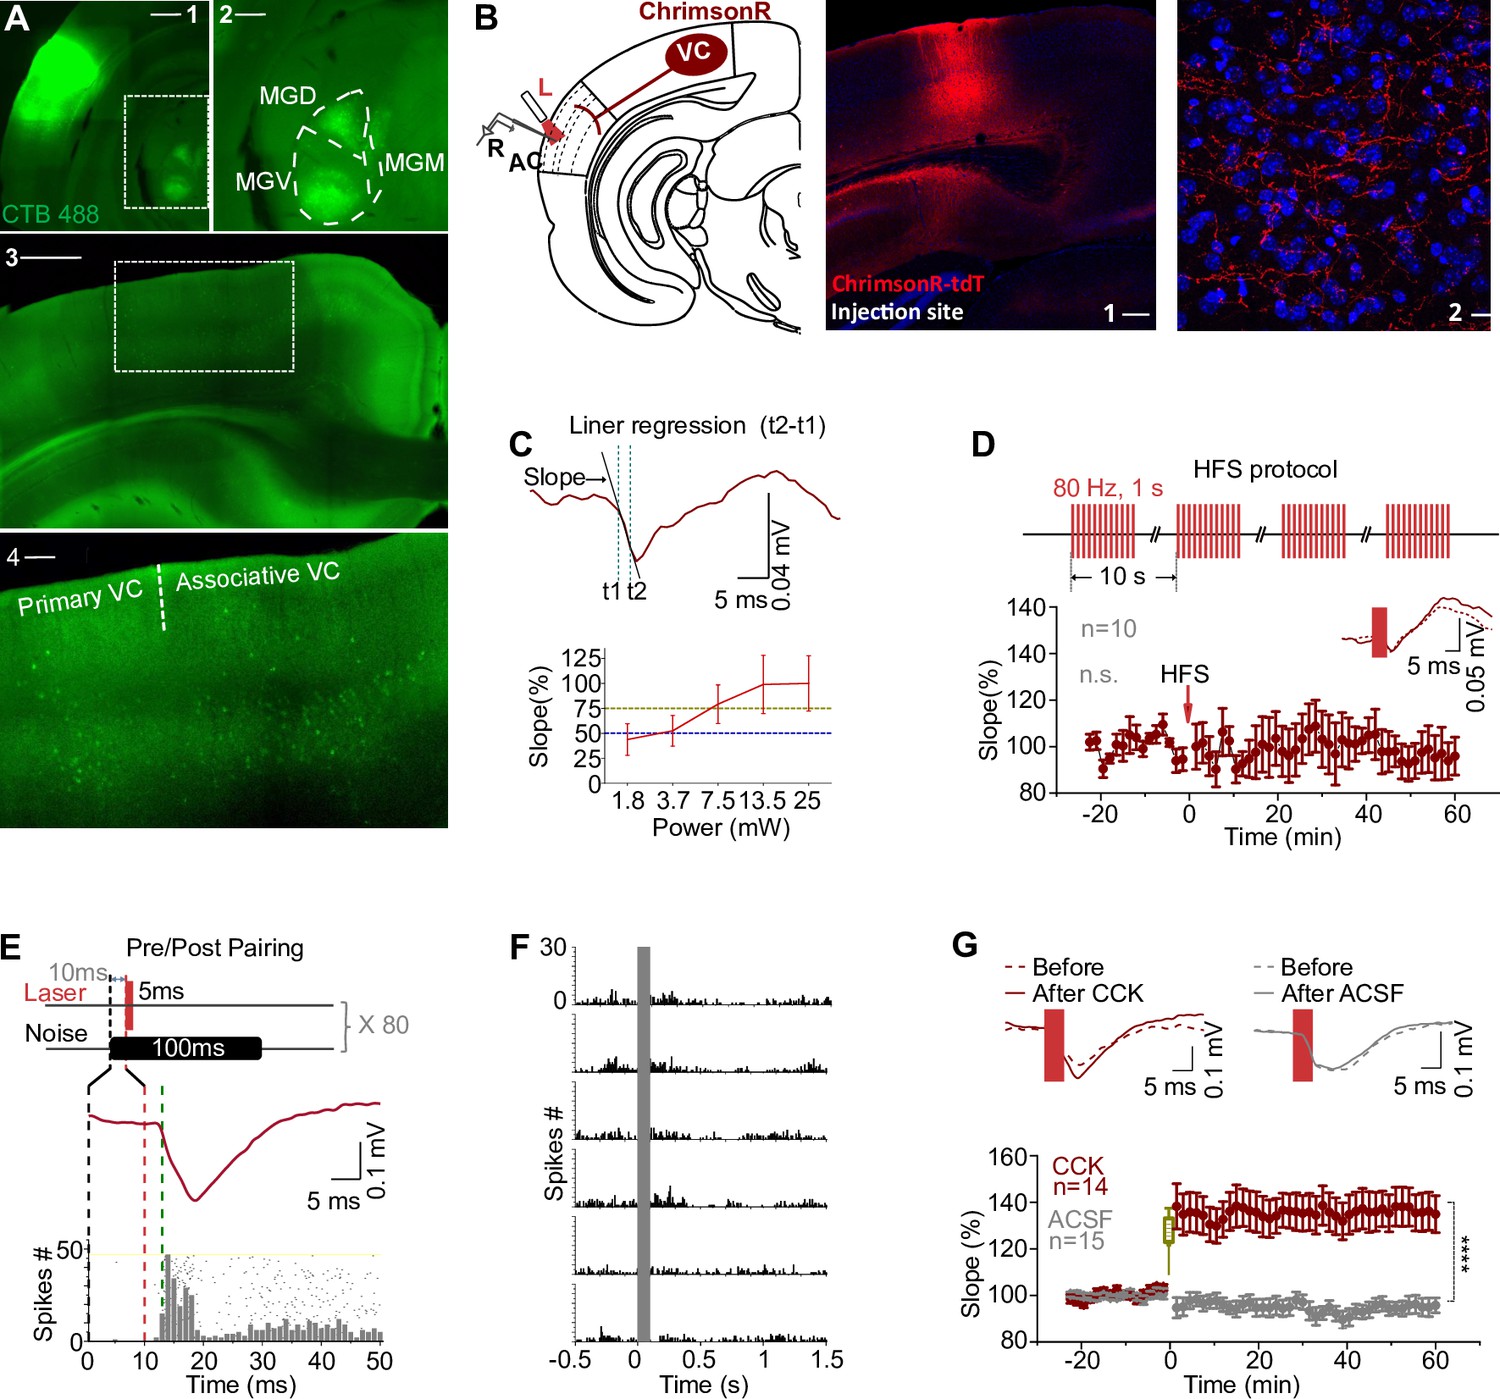
Visual cortex-to-auditory cortex (VC-to-AC) projection was potentiated after pairing laser stimulation evoked presynaptic activation with noise-induced postsynaptic firing in the presence of CCK.
(A) Images show the injection site of the retrograde tracer (CTB488) in the AC (A1, scale bar: 1000 µm) and retrogradely labeled neurons in the auditory thalamus (A2, an enlargement of the boxed area in A1, scale bar: 500 µm) and the VC (A3, scale bar: 1000 µm; A4, an enlargement of the boxed area in A3, scale bar: 200 µm). MGV, MGD, and MGM are abbreviations for the ventral, dorsal, and medial parts of the medial geniculate nucleus, respectively. (B) Left: schematic drawing of the experimental setup. AAV9-syn-ChrimsonR-tdtomato was injected in the VC. The recording of field excitatory postsynaptic potential (fEPSP) was performed across layer II/III to layer V. L, laser fiber; R, recording electrode. Right: representative images of the injection site in the VC (1) and the projection terminals in the AC (2). Blue, Nissl staining. Scale bars: 1, 200 µm; 2, 20 µm. (C) Illustration of the fEPSP slope measurement (upper, for details refer to ‘Materials and ethods’) and the input/output curve of fEPSP slope evoked by laser stimulation at different intensities (bottom). Blue and yellow lines indicate 50 and 75% of fEPSP saturation. (D) Upper: modified high-frequency stimulation (HFS) protocol. Bottom: normalized fEPSPVC-to-AC slopes before and after HFS laser of VC-to-AC projection alone; inset, example traces before (dashed) and after (solid) HFS laser. Error bars represent SEM. Paired t-test, t(9) = 0.878, n.s. p=0.403, n = 10. (E) The protocol of pairing laser stimulation-evoked presynaptic input with noise-induced postsynaptic firing. (F) Peristimulus time histogram (PSTH)s of spike responses to noises at different sound intensities (40–90 dB, from bottom to top). (G) Normalized fEPSPVC-to-AC slopes (bottom) and example traces (upper) before and after Pre/Post Pairing with CCK-8S (red) or artificial cerebrospinal fluid (ACSF, gray) infusion in the AC. Error bars represent SEM. ****p<0.0001, n = 14 for the CCK group, n = 15 for the ACSF group, two-way repeated measures (RM) ANOVA with Bonferroni’s post hoc test. See Supplementary file 1 for detailed statistics.
-
Figure 1—source data 1
Data for Figure 1 and Figure 1—figure supplement 1.
- https://cdn.elifesciences.org/articles/83356/elife-83356-fig1-data1-v2.xlsx
Figure 1—figure supplement 1
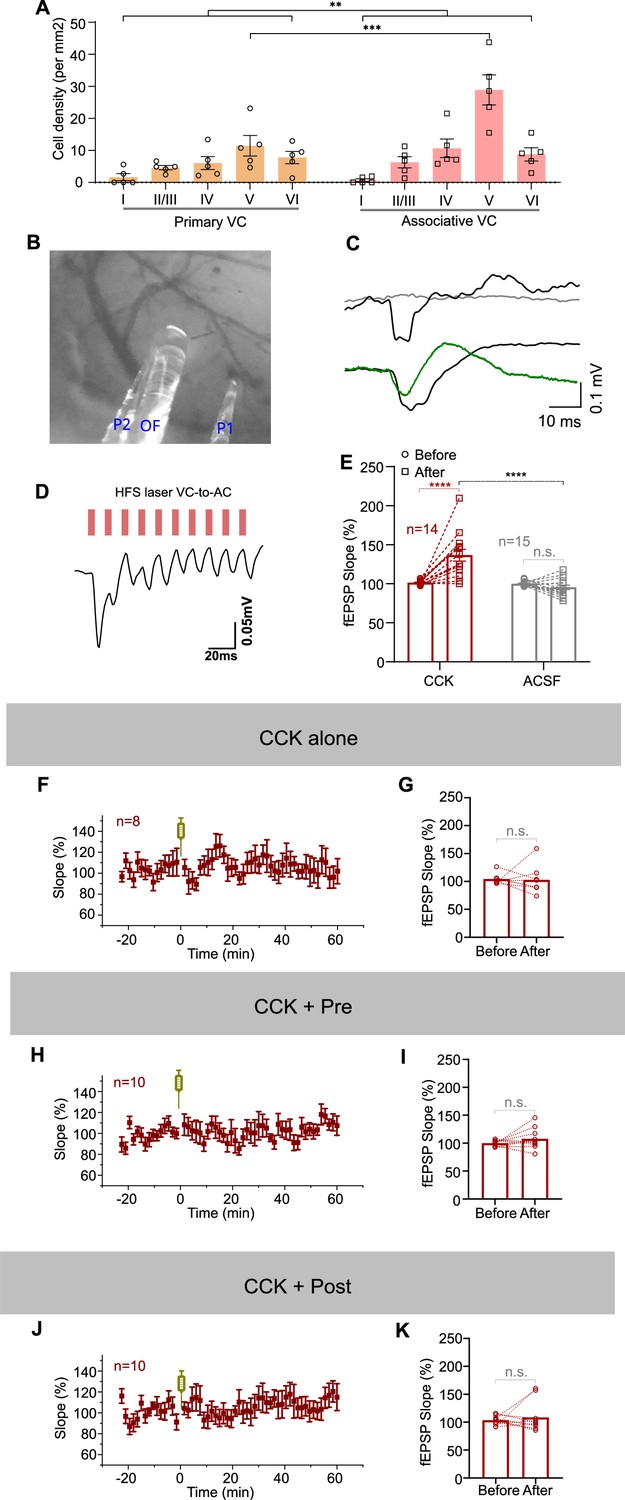
VC-to-AC projection was not potentiated in the absence of any one of the following three conditions: presynaptic activation, postsynaptic firing, and CCK.
(A) Statistics of the number of retrograde-labeled neurons in the primary and associative visual cortex (VC). **p=0.0033, ***p<0.001, two-way ANOVA with Bonferroni’s post hoc test, n = 5. (B) An example image of the positions of glass pipette recording electrodes (P1 and P2) and optical fiber (OF) for laser stimulation. (C) Upper: example field excitatory postsynaptic potential (fEPSP) traces recorded by glass (gray) or tungsten (black, artifact) electrode in wildtype mice without virus injection in the recording site. Bottom: example fEPSP traces recorded by glass (green, real signal) or tungsten (black, mixture of artifact and true signal) electrodes in the CckIres-Cre mice with the expression of ChR2 in the projecting terminals of the recording area. (D) An example trace of an fEPSP recorded in the auditory cortex (AC), responsive to high-frequency stimulation (HFS) laser at 80 Hz stimulating the VC-to-AC projection, which expresses ChrimsonR. Scale bars: left, 20 ms and 0.05 mV. (E) Statistic shows fEPSPVC-to-AC slope changes before and after Pre/Post Pairing with CCK-8S (red) or ACSF (gray) infusion in the AC. **** p<0.0001, n.s. p=0.411, n = 14 for the CCK group, n = 15 for the ACSF group, two-way repeated measures (RM) ANOVA with post hoc Bonferroni test. (F) Normalized fEPSPVC-to-AC slopes before and after CCK-8S infusion in the AC. Error bars represent SEM. (G) Statistic shows fEPSPVC-to-AC slope changes before and after CCK-8S infusion in the AC. n = 8, n.s. p=0.8959, paired t-test. (H) Normalized fEPSPVC-to-AC slopes before and after CCK + Pre protocol. Error bars represent SEM. (I) Statistic shows fEPSPVC-to-AC slope changes before and after CCK + Pre protocol. n = 10, n.s. p=0.2110, paired t-test. (J) Normalized fEPSPVC-to-AC slopes before and after CCK + Post protocol. Error bars represent SEM. (K) Statistic shows fEPSPVC-to-AC slope changes before and after CCK + Post protocol. n = 10, p=0.5814, paired t-test. See Supplementary file 1 for detailed statistics.
Figure 2 with 1 supplement
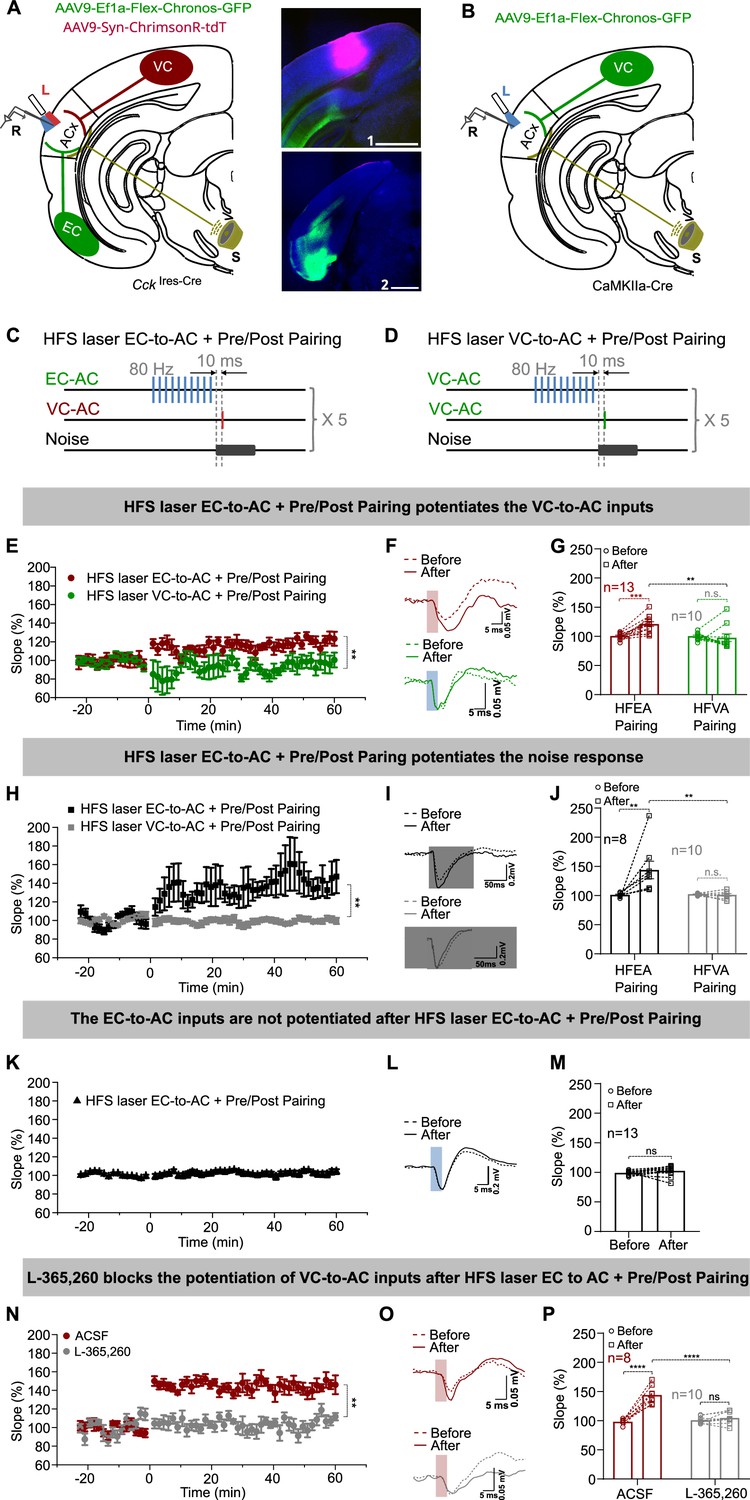
High-frequency stimulation (HFS) laser of entorhinal cortex-to-auditory cortex (EC-to-AC) CCK+ projection but not the visual cortex-to-auditory cortex (VC-to-AC) projection induced the potentiation of VC-to-AC inputs after pairing with noise-evoked postsynaptic activation.
(A) Left: schematic drawing of the experimental setup. AAV9-Ef1α-Flex-Chronos-GFP and AAV9-Syn-ChrimsonR-tdTomato were injected in the EC and VC of CckIres-Cre mice, respectively. L, laser fiber; R, recording electrode; S, sound. Right: representative images of the injection sites in the VC (1) and the EC (2). Blue, Nissl staining. Scale bars: 1, 1000 µm; 2, 1000 µm. (B) Schematic drawing of the experimental setup. AAV9-Ef1α-Flex-Chronos-GFP was injected in the VC of CaMKIIa-cre mice. L, laser fiber; R, recording electrode; S, sound. (C, D) Protocols of HFS laser EC-to-AC + Pre/Post Pairing and HFS laser VC-to-AC + Pre/Post Pairing, respectively. (E) Normalized fEPSPVC-to-AC slopes before and after HFS laser EC-to-AC + Pre/Post Pairing (red) or HFS laser VC-to-AC + Pre/Post Pairing (green). **p<0.01, two-way repeated measures (RM) ANOVA with post hoc Bonferroni test. (F) Example fEPSPVC-to-AC traces before and after HFS laser EC-to-AC + Pre/Post Pairing (red) or HFS laser VC-to-AC + Pre/Post Pairing (green). Scale bars: upper, 5 ms and 0.05 mV; bottom, 5 ms and 0.05 mV. (G) Individual and average fEPSPVC-to-AC slope changes before and after HFS laser EC-to-AC + Pre/Post Pairing (red) or HFS laser VC-to-AC + Pre/Post Pairing (green). **p<0.01, ***p<0.001, n.s. p=0.623, n = 13 for HFS laser EC-to-AC + Pre/Post Pairing, n = 10 for HFS laser VC-to-AC + Pre/Post Pairing group, two-way RM ANOVA with post hoc Bonferroni test. (H) Normalized fEPSPNoise slopes before and after HFS laser EC-to-AC + Pre/Post Pairing (black) or HFS laser VC-to-AC + Pre/Post Pairing (gray). **p<0.01, two-way RM ANOVA with post hoc Bonferroni test. (I) Example fEPSPNoise traces before and after HFS laser EC-to-AC + Pre/Post Pairing (black) or HFS laser VC-to-AC + Pre/Post Pairing (gray). Scale bars: upper, 50 ms and 0.2 mV; bottom, 50 ms and 0.2 mV. (J) Individual and average fEPSPNoise slope changes before and after HFS laser EC-to-AC + Pre/Post Pairing (black) or HFS laser VC-to-AC + Pre/Post Pairing (gray). **p<0.01, n.s. p=0.898, n = 8 for HFS laser EC-to-AC + Pre/Post Pairing group, n = 10 for HFS laser VC-to-AC + Pre/Post Pairing group, two-way RM ANOVA with post hoc Bonferroni test (K) Normalized fEPSPEC-to-AC slopes before and after HFS laser EC-to-AC + Pre/Post Pairing. (L) Example fEPSPEC-to-AC traces before and after HFS laser EC-to-AC + Pre/Post Pairing. Scale bars: upper, 5 ms and 0.2 mV. (M) Individual and average fEPSPEC-to-AC slope changes before and after HFS laser EC-to-AC + Pre/Post Pairing. paired t-test, t(12) = –1.424, n.s. p=0.180, n = 13. (N) Normalized fEPSPVC-to-AC slopes before and after HFS laser EC-to-AC + Pre/Post Pairing in the presence of ACSF (red) or L-365,260 (gray). **p<0.01, two-way RM ANOVA with post hoc Bonferroni test. (O) Example fEPSPVC-to-AC traces before and after HFS laser EC-to-AC + Pre/Post Pairing in the presence of ACSF (red) or L-365,260 (gray). Scale bars: upper, 5 ms and 0.05 mV; bottom, 5 ms and 0.05 mV. (P) Individual and average fEPSPVC-to-AC slope changes before and after HFS laser EC-to-AC + Pre/Post Pairing in the presence of ACSF (red) or L-365,260 (gray). ****p<0.0001, n.s. p=0.6354, n = 8 for the ACSF group, n = 10 for the L-365,260 group, two-way RM ANOVA with post hoc Bonferroni test. See Supplementary file 1 for detailed statistics.
-
Figure 2—source data 1
Data for Figure 2 and Figure 2—figure supplement 1.
- https://cdn.elifesciences.org/articles/83356/elife-83356-fig2-data1-v2.xlsx
Figure 2—figure supplement 1
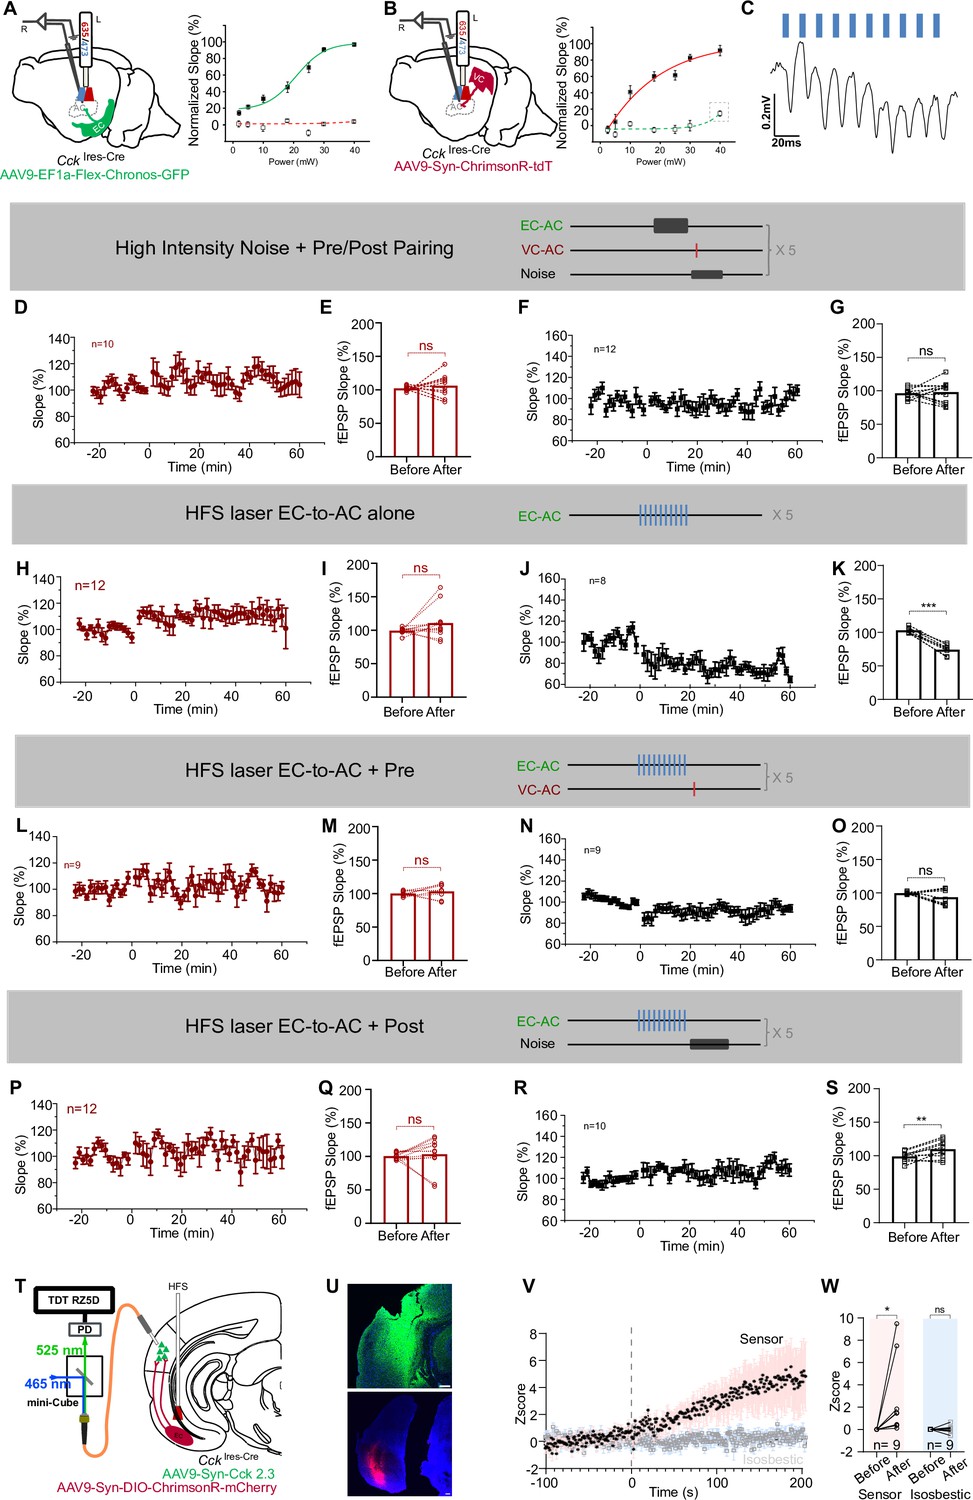
Essential trio for VC-to-AC projection potentiation: presynaptic activation, postsynaptic activation, and HFS of EC-to-AC CCK+ projection that induced CCK release in the AC.
(A, B) Optimal laser power determination of 473 nm and 635 nm to prevent crosstalk. Diagram of the experimental design, animals with only one injection of either AAV9-Ef1α-Flex-Chronos-GFP into the entorhinal cortex (EC) (A, left) or AAV9-Syn-ChrimsonR-tdTomato into the visual cortex (VC) (B, left) were prepared, 473 nm and 635 nm were both applied to stimulate their terminals in the auditory cortex. (A, right): normalized field excitatory postsynaptic potential (fEPSP) slopes (n = 9) evoked by 473 nm (green line) or 635 nm (red dashed line) laser stimulation of CCK+ EC-to-AC (auditory cortex) projection; (B, right): normalized fEPSP slopes (n = 12) evoked by 473 nm (green dashed line) or 635 nm (red solid line) laser stimulation of VC-to-AC projection; gray dashed rectangle in (B, right) emphasizes the power that may induce crosstalk. (C) An example trace of an fEPSP recorded in the AC, responsive to the high-frequency stimulation (HFS) laser at 80 Hz stimulating the EC-to-AC CCK+ projection, which expresses Chronos. Scale bars: left, 20 ms and 0.2 mV. (D) Normalized fEPSPVC-to-AC slopes before and after High-Intensity Noise + Pre/Post Pairing protocol. Error bars represent SEM. (E) Statistic shows fEPSPVC-to-AC slope changes before and after High-Intensity Noise + Pre/Post Pairing protocol. n = 10, p=0.5408, paired t-test. (F) Normalized fEPSPnoise slopes before and after High-Intensity Noise + Pre/Post Pairing protocol. Error bars represent SEM. (G) Statistic shows fEPSPnoise slope changes before and after High-Intensity Noise + Pre/Post Pairing protocol. n = 12, p=0.7308, paired t-test. (H) Normalized fEPSPVC-to-AC slopes before and after HFS laser EC-to-AC alone protocol. Error bars represent SEM. (I) Statistic shows fEPSPVC-to-AC slope changes before and after HFS laser EC-to-AC alone protocol. n = 12, p=0.1283, paired t-test. (J) Normalized fEPSPnoise slopes before and after HFS laser EC-to-AC alone protocol. Error bars represent SEM. (K) Statistic shows fEPSPnoise slope changes before and after HFS laser EC-to-AC alone protocol. n = 8, p<0.0001, paired t-test. (L) Normalized fEPSPVC-to-AC slopes before and after HFS laser EC-to-AC + Pre protocol. Error bars represent SEM. (M) Statistic shows fEPSPVC-to-AC slope changes before and after HFS laser EC-to-AC + Pre protocol. n = 9, p=0.3950, paired t-test. (N) Normalized fEPSPnoise slopes before and after HFS laser EC-to-AC + Pre protocol. Error bars represent SEM. (O) Statistic shows fEPSPnoise slope changes before and after HFS laser EC-to-AC + Pre protocol. n = 9, p=0.1836, paired t-test. (P) Normalized fEPSPVC-to-AC slopes before and after HFS laser EC-to-AC + Post protocol. Error bars represent SEM. (Q) Statistic shows fEPSPVC-to-AC slope changes before and after HFS laser EC-to-AC + Post protocol. n = 12, p=0.6904, paired t-test. (R) Normalized fEPSPnoise slopes before and after HFS laser EC-to-AC + Post protocol. Error bars represent SEM. (S) Statistic shows fEPSPnoise slope changes before and after HFS laser EC-to-AC + Post protocol. n = 10, p=0.0068, paired t-test. (T) Schematic drawing of the experimental setup to monitor the CCK release in the AC using fiber photometry. (U) Representative images of the expression of CCK sensor in the AC (upper) and ChrimsonR-mCherry in the EC (lower). Blue, Nissl staining. Scale bars: 200 µm. (V) Z-score of CCK dynamics (pink) or isosbestic signal (blue) in the AC in response to the HFS laser (50 Hz) stimulation of the CCK+ neurons in the EC. Error bars represent SEM. (W) Statistics shows the Z-scores changes of CCK dynamics (pink) or isosbestic signals (blue) before and after the HFS laser stimulation of the CCK+ neurons in the EC. n = 9 trials in N = 2 animals, two-way repeated measures (RM) ANOVA with post hoc Bonferroni test, *p<0.05, ns: p>0.9999. See Supplementary file 1 for detailed statistics.
Figure 3 with 1 supplement
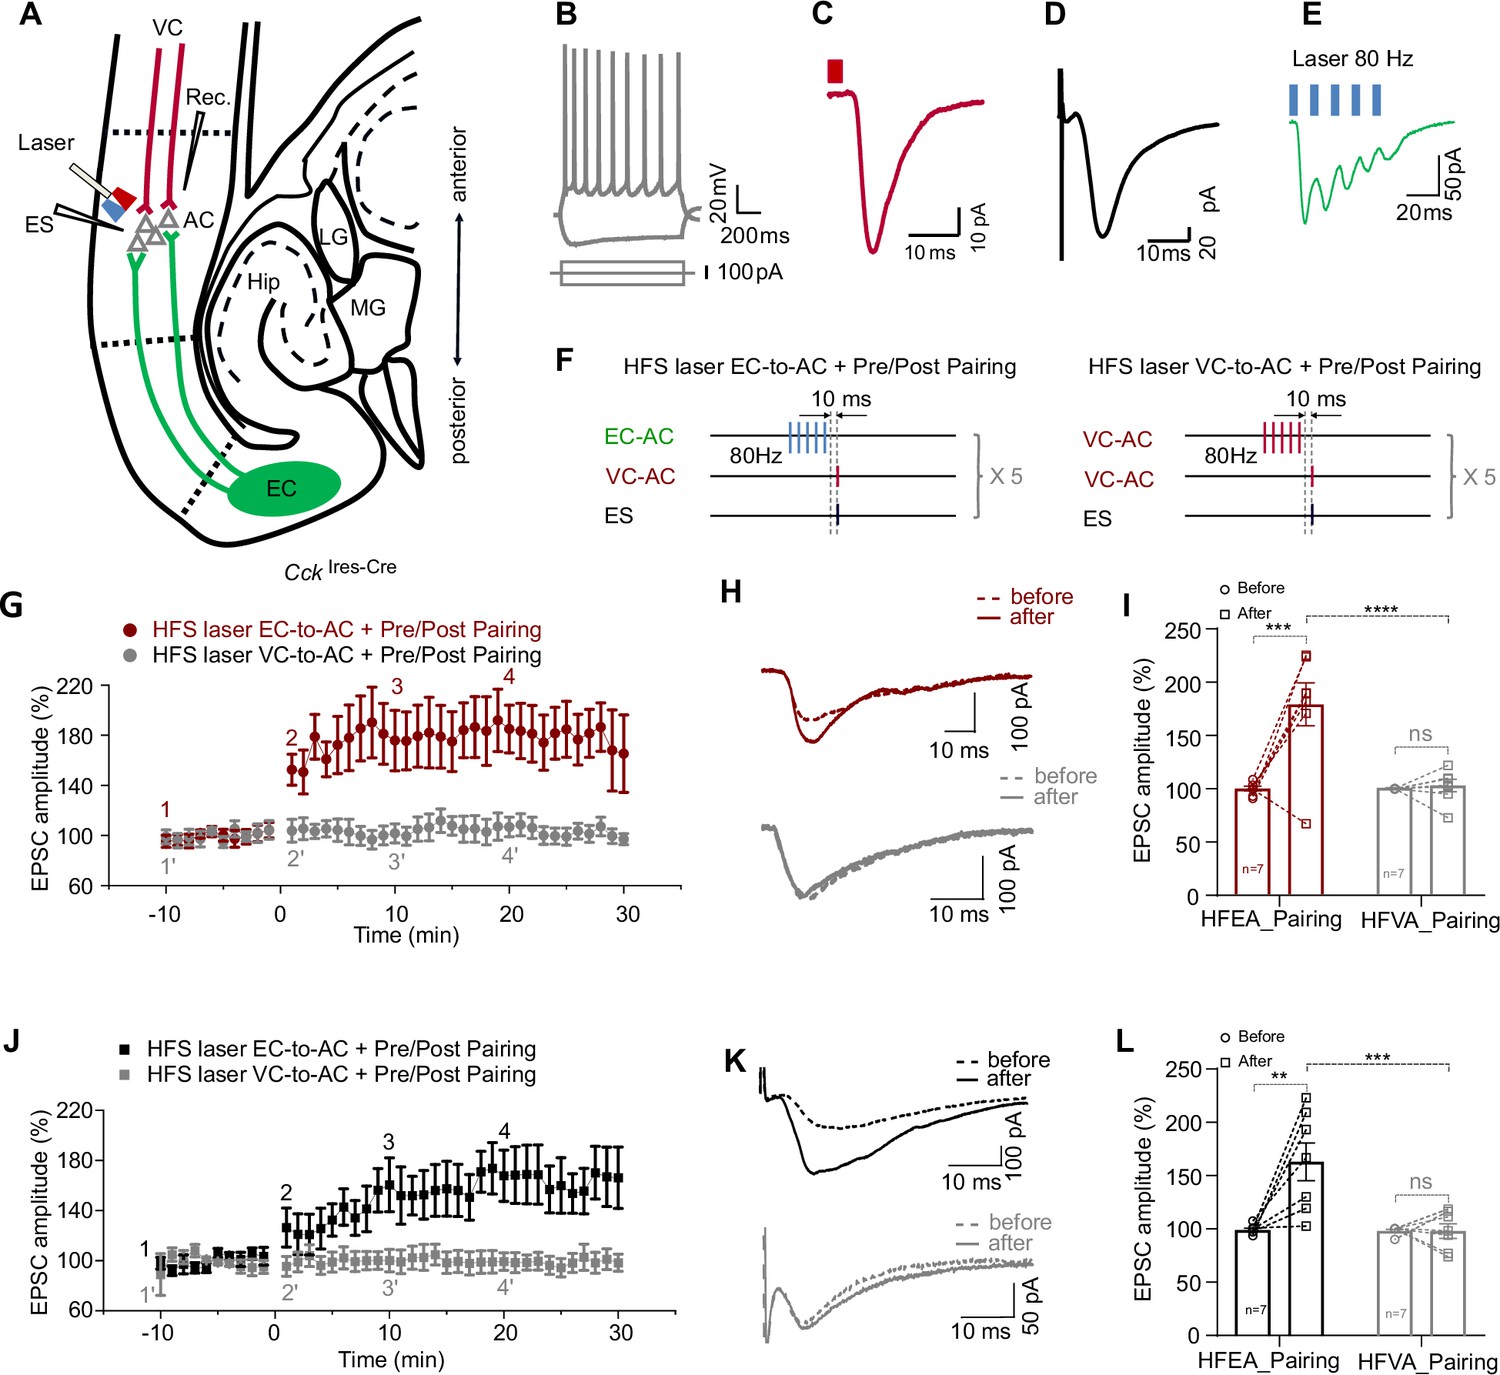
High-frequency stimulation (HFS) laser of entorhinal cortex-to-auditory cortex (EC-to-AC) CCK+ projection ex vivo leads to long-term potentiation (LTP) of visual cortex-to-auditory cortex (VC-to-AC) inputs after pairing with electrical stimulation (ES).
(A) Positions of the whole-cell recording pipette, electrical stimulation electrode, and the optical fiber in a slice of CckIres-Cre mice with AAV-Ef1α-Flex-Chronos-GFP injected in the EC and AAV-Syn-ChrimsonR-tdTomato injected in the VC. (B) Representative pyramidal neuron firing in response to current injection. (C, D) Representative traces of EPSCVC-to-AC (C) and EPSCES (D) of pyramidal neuron. EPSC, excitatory postsynaptic current. Scale bars: (C), 10 ms and 10 pA; (D), 10 ms and 20 pA. (E) Representative EPSC trace in response to HFS laser of the EC-to-AC CCK+ terminals (blue rectangles, 80 Hz, 5 ms/pulse). (F) Protocols of HFS laser EC-to-AC + Pre/Post Pairing (left) and HFS laser VC-to-AC + Pre/Post Pairing (right). (G) Normalized EPSCVC-to-AC amplitudes before and after HFS laser EC-to-AC + Pre/Post Pairing (red) or HFS laser VC-to-AC + Pre/Post Pairing (gray). (H) Example EPSCVC-to-AC traces before (dashed, at timepoint 1 or 1’ in G) and after (solid, at timepoint 4 or 4’ in G) HFS laser EC-to-AC + Pre/Post Pairing (red, upper) or HFS laser VC-to-AC + Pre/Post Pairing (gray, bottom). (I) Individual and average EPSCVC-to-AC amplitude changes before and after HFS laser EC-to-AC + Pre/Post Pairing (red) or HFS laser VC-to-AC + Pre/Post Pairing (gray). ***p<0.001, ****p<0.0001, n.s. p>0.9999, n = 7 for both HFS laser EC-to-AC + Pre/Post Pairing group and HFS laser VC-to-AC + Pre/Post Pairing group, two-way repeated measures (RM) ANOVA with post hoc Bonferroni test. (J) Normalized EPSCES amplitudes before and after HFS laser EC-to-AC + Pre/Post Pairing (black) or HFS laser VC-to-AC + Pre/Post Pairing (gray). (K) Example EPSCES traces before (dashed, at timepoint 1 or 1’ in J) and after (solid, at timepoint 4 or 4’ in J) HFS laser EC-to-AC + Pre/Post Pairing (black, upper) or HFS laser VC-to-AC + Pre/Post Pairing (gray, bottom). (L) Individual and average EPSCES amplitude changes before and after HFS laser EC-to-AC + Pre/Post Pairing (black) or HFS laser VC-to-AC + Pre/Post Pairing (gray). **p<0.01, ***p<0.001, n.s. p>0.9999, n = 7 for both HFS laser EC-to-AC + Pre/Post Pairing group and HFS laser VC-to-AC + Pre/Post Pairing group, two-way RM ANOVA with post hoc Bonferroni test. See Supplementary file 1 for detailed statistics.
-
Figure 3—source data 1
Data for Figure 3.
- https://cdn.elifesciences.org/articles/83356/elife-83356-fig3-data1-v2.xlsx
Figure 3—figure supplement 1
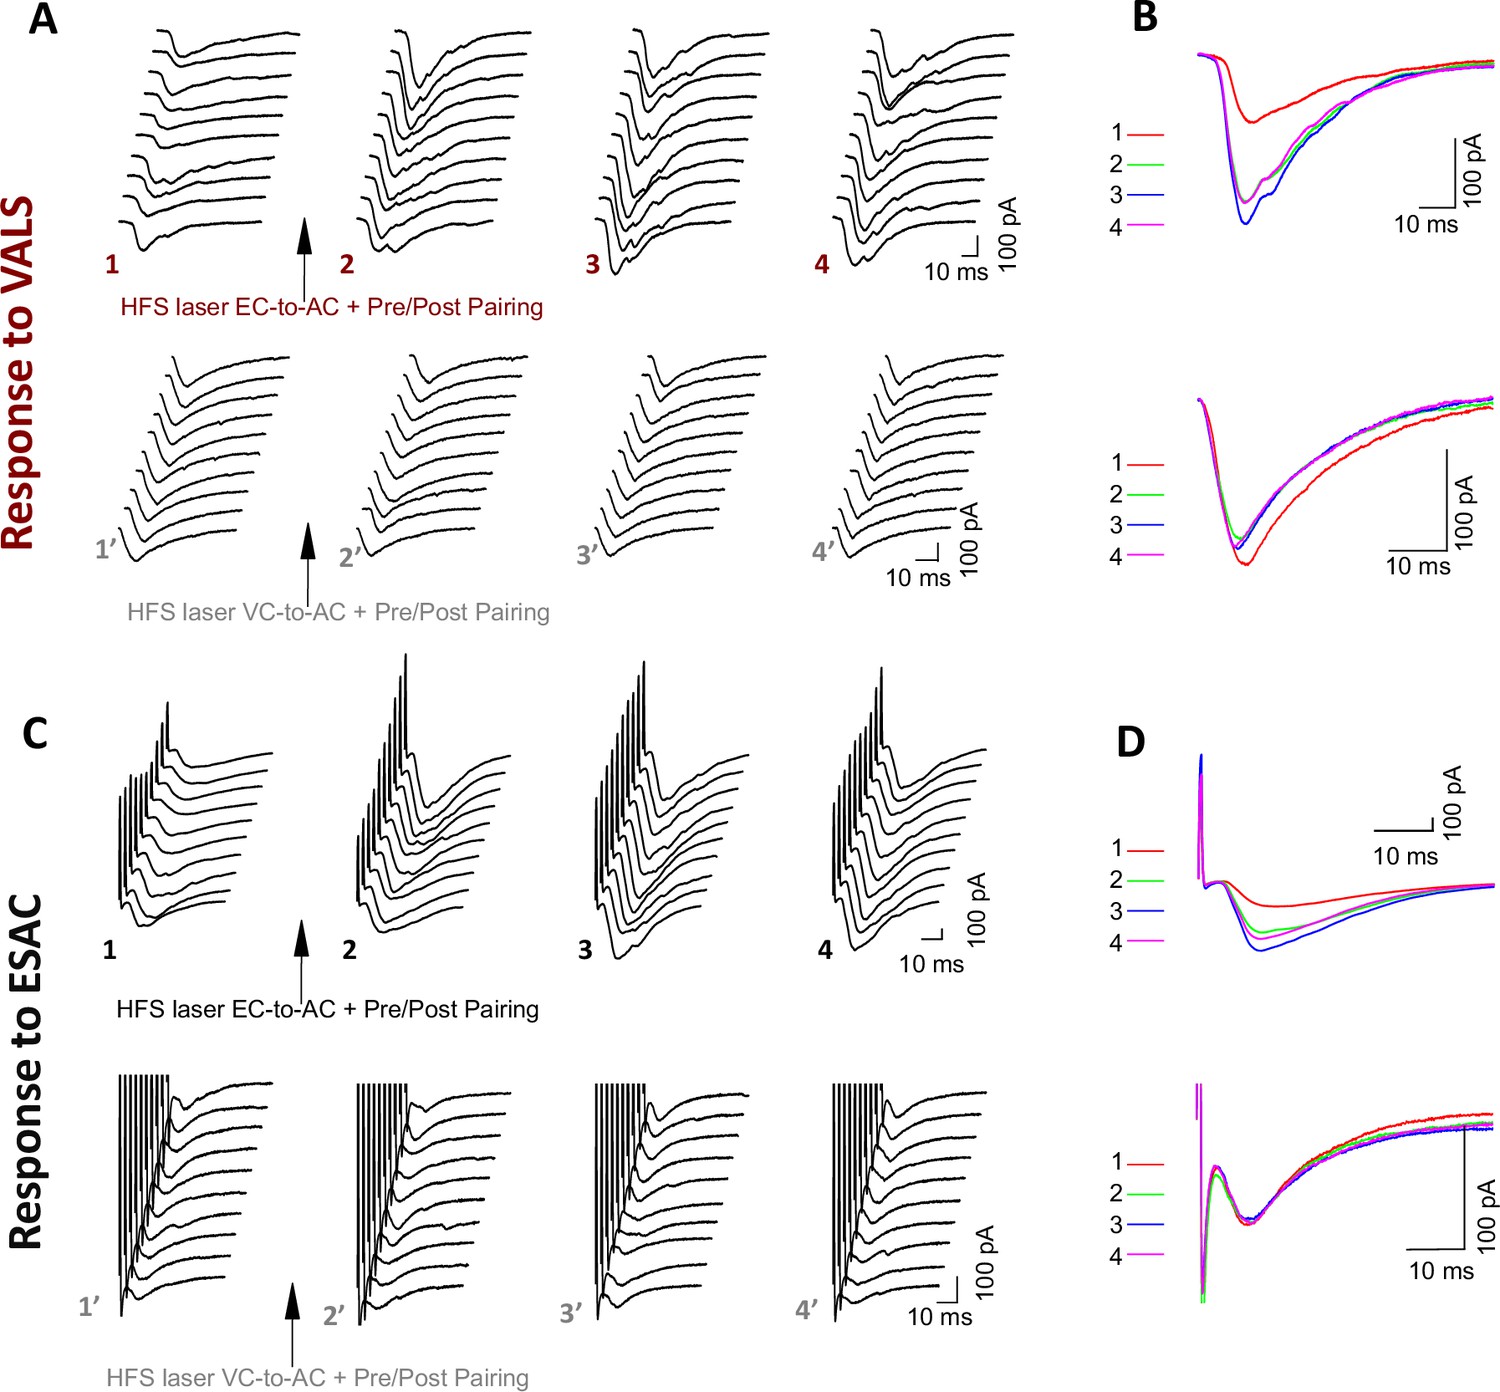
Examples of EPSC traces evoked by different stimuli at specified time points in Figure 3 recorded under various conditions.
(A) Representative EPSCVC-to-AC traces at different timepoints and (B) their averaged traces in the high-frequency stimulation (HFS) laser entorhinal cortex-to-auditory cortex (EC-to-AC) + Pre/Post Pairing (upper) or HFS laser EC-to-AC + Pre/Post Pairing (bottom) group. (1 or 1’: first 10 consecutive individual trace before pairing; 2–4 or 2’–4’: 10 consecutive individual trace starting at 0 min, 10 min, and 20 min after pairing, respectively). (C) Representative EPSCES traces at different timepoints and (D) their averaged traces in the HFS laser EC-to-AC + Pre/Post Pairing (upper) or HFS laser EC-to-AC + Pre/Post Pairing (bottom) group. (1 or 1’: first 10 consecutive individual trace before pairing; 2–4 or 2’–4’: 10 consecutive individual trace starting at 0 min, 10 min, and 20 min after pairing, respectively). EPSC, excitatory postsynaptic currents; VC, visual cortex.
Figure 4 with 1 supplement

Auditory cortex (AC)-projecting neurons in the entorhinal cortex (EC) express higher level of Cck than those in the visual cortex (VC).
(A) Overview of injection site at the AC and projecting neurons in the VC. Scale bar: 500 um. (B) Expression of Slc17a7 (vGlut1) and Cck in retrogradely labeled neurons (tdTomato+) in the VC. Scale bars: upper, 200 µm; bottom, 20 µm. (C) Overview of injection site at the AC and projecting neurons in the EC. Scale bar: 500 µm. (D) Expression of Slc17a7 and Cck in retrogradely labeled neurons (tdTomato+) in the EC. Scale bars: upper, 200 µm; bottom, 20 µm. (E) Comparison of Cck expression level in AC-projecting neurons of EC and VC (data points are from three animals). Unpaired t-test, ***p<0.001. Black, high level; gray, low level. (F) Pie chart shows percentage of projecting neurons expressing low and high Cck level in the VC (upper) and the EC (bottom), respectively. See Supplementary file 1 for detailed statistics.
-
Figure 4—source data 1
Data for Figure 4 and Figure 4—figure supplement 1.
- https://cdn.elifesciences.org/articles/83356/elife-83356-fig4-data1-v2.csv
Figure 4—figure supplement 1

Comparison of Cck expression level in neurons in the entorhinal cortex (EC) and visual cortex (VC), which project to the auditory cortex (AC).
For each animal, Cck expression level is normalized to the average Cck expression in projecting neurons in the VC. Unpaired t-test, ***p<0.0001, **p<0.01, *p<0.05. See Supplementary file 1 for detailed statistics.
Figure 5
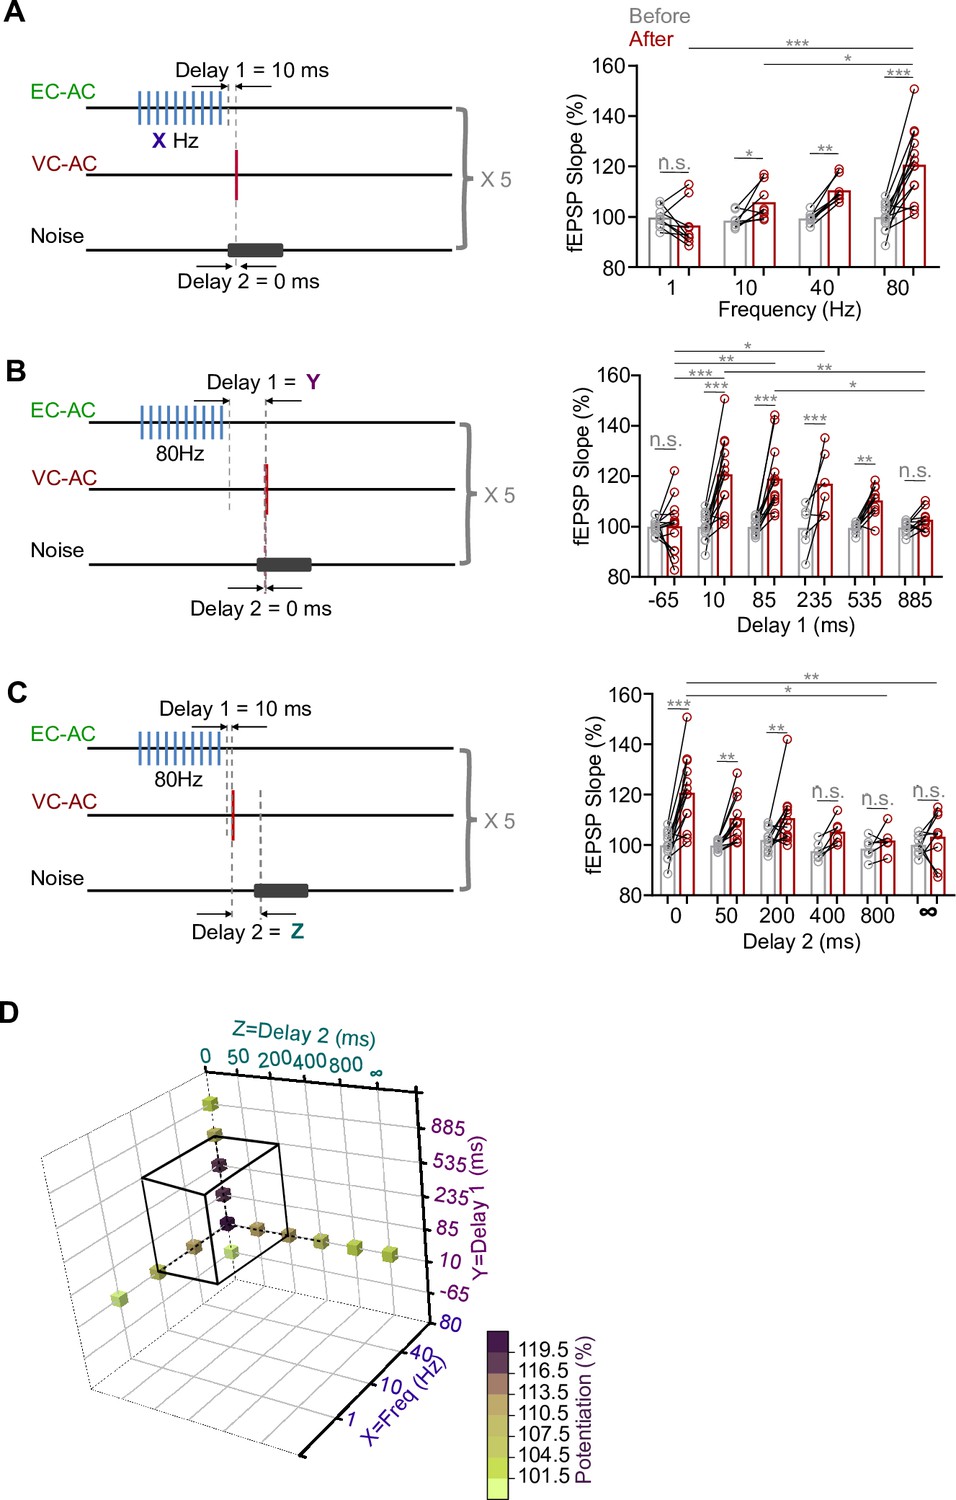
Effect of different parameters of the pairing protocol on the potentiation level of the visual cortex-to-auditory cortex (VC-to-AC) inputs.
(A) Left: schematic drawing of experiment design. Delay 1 = 10 ms, Delay 2 = 0 ms, and the frequency was varied (80, 40, 10, or 1 Hz). Right: individual and average fEPSPVC-to-AC slopes (normalized to the baseline) after pairing at different frequencies. Two-way repeated measures (RM) ANOVA with post hoc Bonferroni test, n.s., no significant, *p<0.05, **p<0.01, ***p<0.001, n = 9 for 1 Hz, n = 8 for 10 Hz, n = 8 for 40 Hz, n = 13 for 80 Hz. Data points in groups 1 Hz and 40 Hz refer to our previous study (Zhang et al., 2020). (B) Left: schematic drawing of experiment design. HFS laser frequency = 80 Hz, Delay 2 = 0 ms, and Delay 1 was varied (10, 85 235, 535, 885, and –65 ms). Right: individual and average fEPSPVC-to-AC slopes (normalized to the baseline) after pairing at different Delay 1s. Two-way RM ANOVA with post hoc Bonferroni test, n.s., no significant, *p<0.05, **p<0.01, ***p<0.001, n = 13, 13, 13, 6, 10, 10 for Delay 1 = –65, 10, 85, 235, 535, and 885 ms, respectively. (C) Left: schematic drawing of experiment design. HFS laser frequency = 80 Hz, Delay 1 = 10 ms, and Delay 2 was varied (0, 50, 200, 400, 800 ms, and ∞). Right: individual and average fEPSPVC-to-AC slopes (normalized to the baseline) after pairing at different Delay 2s. Two-way RM ANOVA with post hoc Bonferroni test, n.s., not significant, *p<0.05, **p<0.01, ***p<0.001, n = 13, 11, 12, 6, 6, 9 for Delay 2 = 0, 50, 200, 400, 800 ms, and ∞, respectively. (D) Three-dimensional summary of the effect of different parameters (Frequency, Delay 1 and Delay 2) on the potentiation level of the VC-to-AC inputs. Parameters locate inside black cubes can induce significant potentiation. See for Supplementary file 1 detailed statistics.fEPSP, field excitatory postsynaptic potential; HFS, high-frequency stimulation.
-
Figure 5—source data 1
Data for Figure 5.
- https://cdn.elifesciences.org/articles/83356/elife-83356-fig5-data1-v2.xlsx
Figure 6 with 1 supplement

Roles of the entorhinal cortex-to-auditory cortex (EC-to-AC) CCK+ projection and visual cortex-to-auditory cortex (VC-to-AC) projection in establishing and retrieving of the visuo-auditory associative memories.
(A) Schematic drawing of the experimental design that the chemogenetic manipulation was applied in the encoding phase. (B) Bar chart showing freezing percentages to the auditory stimulus (AS) and visual stimulus (VS) before and after the conditioning in different conditions. ****p<0.01, n.s., not significant, n = 7 for the EC-AC-hM4Di-CNO group, n = 7 for the VC-AC-hM4Di-CNO group, and n = 10 for the GFP-CNO group, two-way repeated measures (RM) ANOVA with post hoc Bonferroni test. (C) Schematic drawing of the experimental design that the chemogenetic manipulation was applied in the retrieval phase. (D) Bar chart showing freezing percentages to the AS and VS before and after the conditioning in different conditions. ****p<0.01, **p<0.01, n.s., not significant, n = 6 for the EC-AC-hM4Di-CNO group, n = 7 for the VC-AC-hM4Di-CNO group, and n = 6 for the GFP-CNO group, two-way RM ANOVA with post hoc Bonferroni test. (E) Schematic drawing of our theory that endogenous CCK, presynaptic activation, and postsynaptic firing enables the plasticity of the VC-to-AC inputs. See Supplementary file 1 for detailed statistics.
-
Figure 6—source data 1
Data for Figure 6 and Figure 6—figure supplement 1.
- https://cdn.elifesciences.org/articles/83356/elife-83356-fig6-data1-v2.xlsx
Figure 6—figure supplement 1
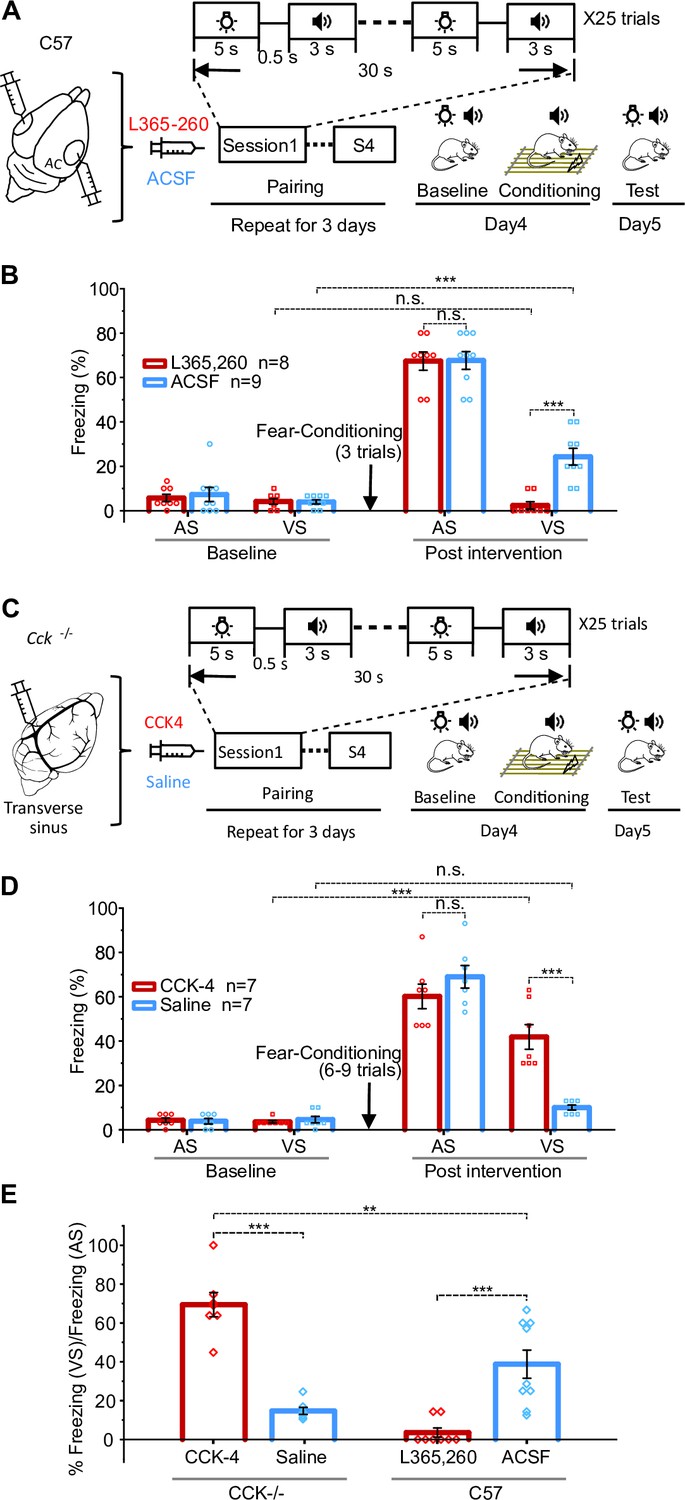
Visuo-auditory associative memory could not be formed without CCK.
(A) Schematic drawing of the training protocol for wildtype mice to associate the visual stimulus (VS) and auditory stimulus (AS). L-365,260 or ACSF was infused to the auditory cortex (AC) before pairing of VS and AS. (B) Bar chart showing freezing percentages to the AS and VS before and after the conditioning. ***p<0.001, n.s. p=1.000 for L-365,260-VS-Baseline vs. L-365,260-VS-Post intervention, n.s. p=0.962 for L-365,260-AS-Post intervention vs. ACSF-AS-Post intervention, n = 8 for L-365,260 group, and n = 9 for ACSF group, two-way repeated measures (RM) ANOVA with post hoc Bonferroni test. (C) Schematic drawing of the training protocol for Cck-/- mice to associate the VS and AS. CCK-4 or ACSF was systemically administrated through the drug infusion cannula in the transverse sinus before paring of VS and AS. (D) Bar chart showing freezing percentages of Cck-/- mice to the VS and AS before and after the intervention. ***p<0.001, n.s. p=1.000 for Saline-VS-Baseline vs. Saline-VS-Post intervention, n.s. p=0.264 for CCK-AS-Post intervention vs. Saline-AS-Post intervention, n = 7 for CCK-4 group, and n = 7 for Saline group, two-way RM ANOVA with post hoc Bonferroni test. (E) The ratio of freezing in response to the VS over that to the AS after the intervention of wildtype and Cck-/- in all conditions are summarized in the bar chart. **p<0.01, ***p<0.001, one-way ANOVA with post hoc Bonferroni test. See Supplementary file 1 for detailed statistics.
Tables
Key resources table
| Reagent type (species) or resource | Designation | Source or reference | Identifiers | Additional information |
|---|---|---|---|---|
| Peptide, recombinant protein | Alexa Fluor 488-conjugated Cholera Toxin Subunit B | Thermo Fisher Scientific | Cat# C34775 | |
| Sequence-based reagent | Mm-Slc17a7-C2 | Advanced Cell Diagnostics | Cat# 416631-C2 | |
| Sequence-based reagent | Mm-Cck-C1 | Advanced Cell Diagnostics | Cat# 402271-C1 | |
| Sequence-based reagent | Mm-Tomato-C4 | Advanced Cell Diagnostics | Cat# 317041-C4 | |
| Recombinant DNA reagent | AAV9-Syn-ChrimsonR-tdTomato | UNC Vector Core | N/A | |
| Recombinant DNA reagent | AAV9-Ef1α-Flex-Chronos-GFP | UNC Vector Core | N/A | |
| Recombinant DNA reagent | AAV9-Syn-hM4Di-EGFP-WPRE-PA | Taitool BioScience | N/A | |
| Recombinant DNA reagent | AAV9-Syn-EGFP-WPRE-pA | Taitool BioScience | N/A | |
| Recombinant DNA reagent | AAVretro-hSyn-Cre-WPRE-hGH | A gift from James M. Wilson | Addgene viral prep #105553-AAVrg, RRID:Addgene_105553 | |
| Recombinant DNA reagent | AAV9-EF1a-DIO-EYFP-WPRE | BrainVTA | Cat# PT-0899 | |
| Recombinant DNA reagent | AAV9-Syn-DIO-ChrimsonR-mCherry-WPRE-Hgh | BrainVTA | Cat# PT-1374 | |
| Recombinant DNA reagent | AAV9-Syn-DIO-hM4Di-EYFP-WPRE-hGH pA | BrainVTA | Cat# PT-0043 | |
| Recombinant DNA reagent | AAV9-Syn-Cck2.3 | BrainVTA | Cat# PT-1629 | |
| Genetic reagent (Mus musculus) | Mouse: C57BL/6J | The Laboratory Animal Services Centre, Chinese University of Hong Kong; Laboratory Animal Research Unit, City University of Hong Kong | RRID:IMSR_JAX:000664 | |
| Genetic reagent (M. musculus) | Mouse: B6.Cg-Tg(Camk2a-cre)T29-1Stl/J | The Jackson Laboratory | RRID:IMSR_JAX:005359 | |
| Genetic reagent (M. musculus) | Mouse: B6.Cg-Gt(ROSA)26Sortm14(CAG-tdTomato)Hze/J (Ai14) | The Jackson Laboratory | RRID:IMSR_JAX:007914 | |
| Genetic reagent (M. musculus) | Mouse: Ccktm1.1(cre)Zjh/J (CckIres-Cre) | The Jackson Laboratory | RRID:IMSR_JAX:012706 | |
| Genetic reagent (Rattus norvegicus) | Rat: Sprague–Dawley | The Laboratory Animal Services Centre; Chinese University of Hong Kong | N/A | |
| Chemical compound, drug | Pentobarbital sodium (Dorminal 20%) | Alfasan International B.V. | N/A | |
| Chemical compound, drug | Urethane | Sigma-Aldrich | Cat# U2500 | |
| Chemical compound, drug | Lidocaine | Tokyo Chemical Industry | Cat# L0156 | |
| Chemical compound, drug | CNO | Sigma-Aldrich | Cat# C0832 | |
| Chemical compound, drug | CCK-4 | Abcam, Cambridge | Cat# ab141328 | |
| Chemical compound, drug | CCK-8S | Tocris Bioscience | Cat# 1166 | |
| Chemical compound, drug | L-365,260 | Tocris Bioscience | Cat# 2767 | |
| Software, algorithm | Fiji | https://imagej.net/software/fiji/ | RRID:SCR_002285 | |
| Software, algorithm | MATLAB R2020a | MathWorks | http://www.mathworks.com/products/matlab/; RRID:SCR_001622 | |
| Software, algorithm | ffline sorter | Plexon | http://www.plexon.com/products/offline-sorter; RRID:SCR_000012 | |
| Software, algorithm | Synapse suite | Tucker-Davis Technologies | https://www.tdt.com/component/synapse-software/ | |
| Software, algorithm | Origin | OriginLab | https://www.originlab.com/; | |
| Software, algorithm | SPSS | IBM | https://www.ibm.com/products/spss-statistics; RRID:SCR_019096 | |
| Other (stains) | Fluorescent Nissl Stain (Neurotrace 640) | Thermo Fisher Scientific | Cat# N21483; RRID:AB_2572212 | IHC 1:200 (To satin the Nissl bodies in the neurons, refer to section ‘Histology’) |
| Other | Guide Cannula | RWD Life Science | Cat# 62004 | Please refer to section ‘Drug infusion’ |
| Other | Dummy cannula (metal) | RWD Life Science | Cat# 62108 | Please refer to section ‘Drug infusion’ |
| Other | Internal injector | RWD Life Science | Cat# 62204 | Please refer to section ‘Drug infusion’ |
| Other | PE tube | RWD Life Science | Cat# 62329 | Please refer to section ‘Drug infusion’ |
| Other | Fiber Optic Cannula | Inper | Cat# FOC-W-L-6-20037 | Please refer to section ‘Endogenous CCK release detection with fiber photometry’ |
Additional files
-
MDAR checklist
- https://cdn.elifesciences.org/articles/83356/elife-83356-mdarchecklist1-v2.docx
-
Supplementary file 1
Detailed statistics related to all figures and figure supplements.
- https://cdn.elifesciences.org/articles/83356/elife-83356-supp1-v2.xlsx
Download links
A two-part list of links to download the article, or parts of the article, in various formats.
Downloads (link to download the article as PDF)
Open citations (links to open the citations from this article in various online reference manager services)
Cite this article (links to download the citations from this article in formats compatible with various reference manager tools)
Heterosynaptic plasticity of the visuo-auditory projection requires cholecystokinin released from entorhinal cortex afferents
eLife 13:e83356.
https://doi.org/10.7554/eLife.83356


