Increased public health threat of avian-origin H3N2 influenza virus caused by its evolution in dogs
- National Key Laboratory of Veterinary Public Health Security, Key Laboratory for Prevention and Control of Avian Influenza and Other Major Poultry Diseases and Key Laboratory of Animal Epidemiology of Ministry of Agriculture and Rural Affairs, College of Veterinary Medicine, China Agricultural University, China
- Veterinary Teaching Hospital, China Agricultural University, China
- Department of Laboratory Medicine, the First Medical Centre, Chinese People's Liberation Army (PLA) General Hospital, China
- Liaoning Agricultural Development Service Center, China
- Department of Epidemiology and Biostatistics, University of Georgia, United States
Figures
Figure 1 with 10 supplements
Genetic and antigenic characterization of H3N2 CIVs.
(A) Maximum-likelihood phylogenetic tree of hemagglutinin (HA) genomic segment of H3N2 CIVs. The phylogenetic tree of the HA gene was estimated using genetic distances calculated by maximum likelihood under the GTRGAMMA +I model. Viruses with full names in the tree in (A) were selected for animal experiments. Black, red, dark purple, and aqua blue indicate H3N2 CIVs from China, the United States, Thailand, and South Korea, respectively. A, B, C, D, E, F, and G represent different antigen groups of H3N2 CIVs, respectively. A full detailed HA gene tree with a consistent topology is shown in Figure 1—figure supplement 3 (scale bar is in units of nucleotide substitutions per site). (B) Prevalence of mammalian adaption markers among H3N2 CIVs. The sequences of H3N2 CIVs available in NCBI have compared with avian and human influenza A viruses. Color indicates the frequency of indicated substitutions in H3N2 CIVs for each indicated time period. (C) Antigenic map based on the HI assay data. Open squares and filled circles represent the positions of antisera and viruses, respectively. A k-means clustering algorithm identified clusters. Strains belonging to the same antigenic cluster are encircled with an oval. The vertical and horizontal axes both represent antigenic distance. The spacing between grid lines is 1 unit of antigenic distance, corresponding to a twofold dilution of antiserum in the HI assay. Details of the hemagglutinin inhibition (HI) assay data are shown in Supplementary file 1.
Figure 1—figure supplement 1
Map showing pet hospital and kennel density in China and geographic location of influenza surveillance in dogs from 2012–2019.
The number of pet hospitals and kennels in each province is the average number from 2015–2019; data were from the National Bureau of Statistics of China. Red triangles indicate provinces where surveillance was conducted.
Figure 1—figure supplement 2
Isolation rate (%) of H3N2 CIVs during 2012–2019 from dogs with respiratory symptoms.
Histogram indicates monthly isolation rates; the red horizontal line (connected with dots) and the numbers above indicate mean annual isolation rates; and a gray horizontal dashed line indicates 95% CI.
Figure 1—figure supplement 3
Hemagglutinin (HA) phylogenetic tree of fully sequenced H3N2 CIVs worldwide from 2006 to 2019.
All phylogenetic trees were estimated using genetic distances calculated by maximum likelihood under the GTRGAMMA +I model. The color of strain names indicates the year of isolation (see color bar). Scale bar is in units of nucleotide substitutions per site. Node labels in the HA gene tree represent bootstrap values. Red asterisks indicate the phylogenetic position of H3N2 CIVs used in animal experiments.
Figure 1—figure supplement 4
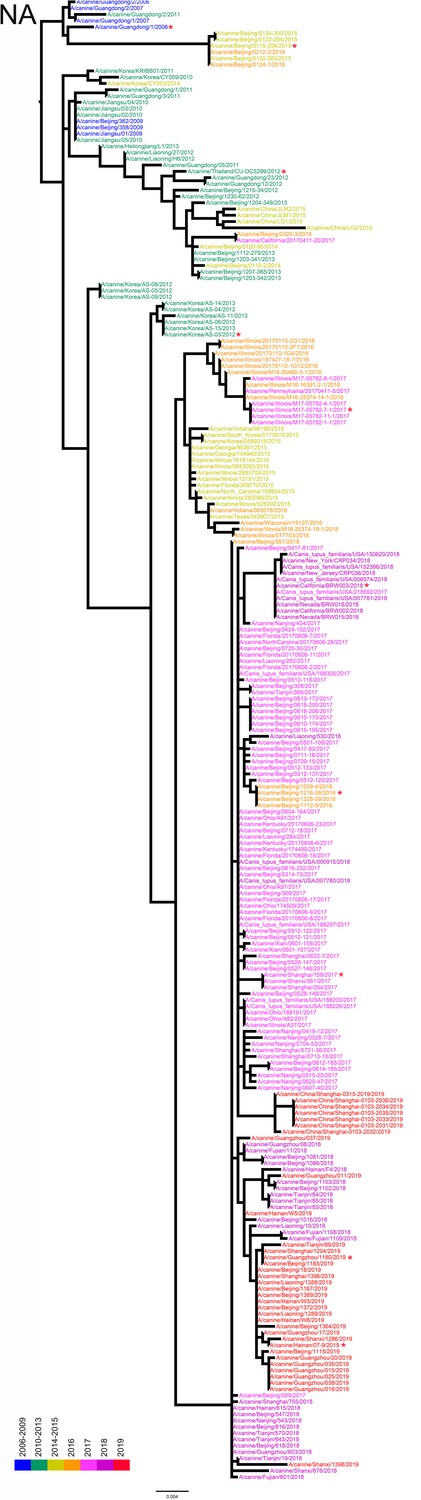
NA phylogenetic tree of fully sequenced H3N2 CIVs worldwide from 2006 to 2019.
Figure 1—figure supplement 5
PB2 phylogenetic tree of fully sequenced H3N2 CIVs worldwide from 2006 to 2019.
Figure 1—figure supplement 6
PB1 phylogenetic tree of fully sequenced H3N2 CIVs worldwide from 2006 to 2019.
Figure 1—figure supplement 7
PA phylogenetic tree of fully sequenced H3N2 CIVs worldwide from 2006 to 2019.
Figure 1—figure supplement 8
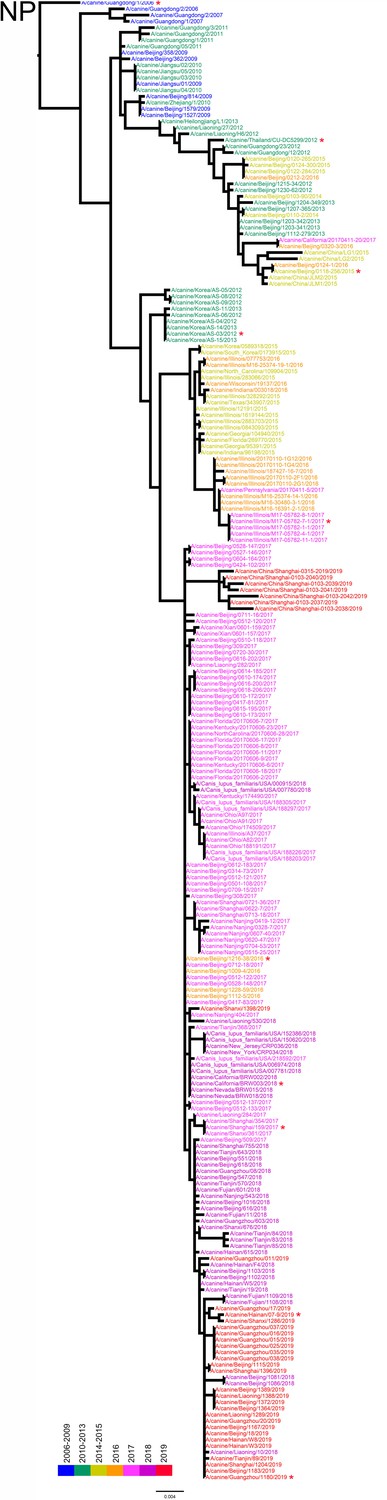
NP phylogenetic tree of fully sequenced H3N2 CIVs worldwide from 2006 to 2019.
Figure 1—figure supplement 9
M phylogenetic tree of fully sequenced H3N2 CIVs worldwide from 2006 to 2019.
Figure 1—figure supplement 10
NS phylogenetic tree of fully sequenced H3N2 CIVs worldwide from 2006 to 2019.
Figure 2 with 2 supplements

Binding specificities toward α–2, 3-, or α–2, 6-linked sialic acid receptors and hemagglutinin (HA) acid stability.
(A) Characterization of receptor-binding properties of H3N2 CIVs. Direct binding of the virus to sialylglycopolymers containing either 2,3-linked (blue) or 2,6-linked (red) sialic acids was tested (n=3 biological replicates and n=3 technical replicates). Values are expressed as means ± standard deviations (SD). (B) HA activation pH measured by syncytia assay. Representative fields of cells infected with the indicated viruses and exposed to pH 5.2, 5.3, 5.4, 5.5, or 5.6 are shown. Scale bar, 100μm. The experiments were repeated three times, with similar results.
Figure 2—figure supplement 1
Characterization of the receptor-binding properties of H3N2 CIVs.
The direct binding of the virus to sialylglycopolymers containing either 2,3-linked (blue) or 2,6-linked (red) sialic acids were tested (n=3 biological replicates and n=3 technical replicates). Values are expressed as means ± standard deviations (SD).
Figure 2—figure supplement 2
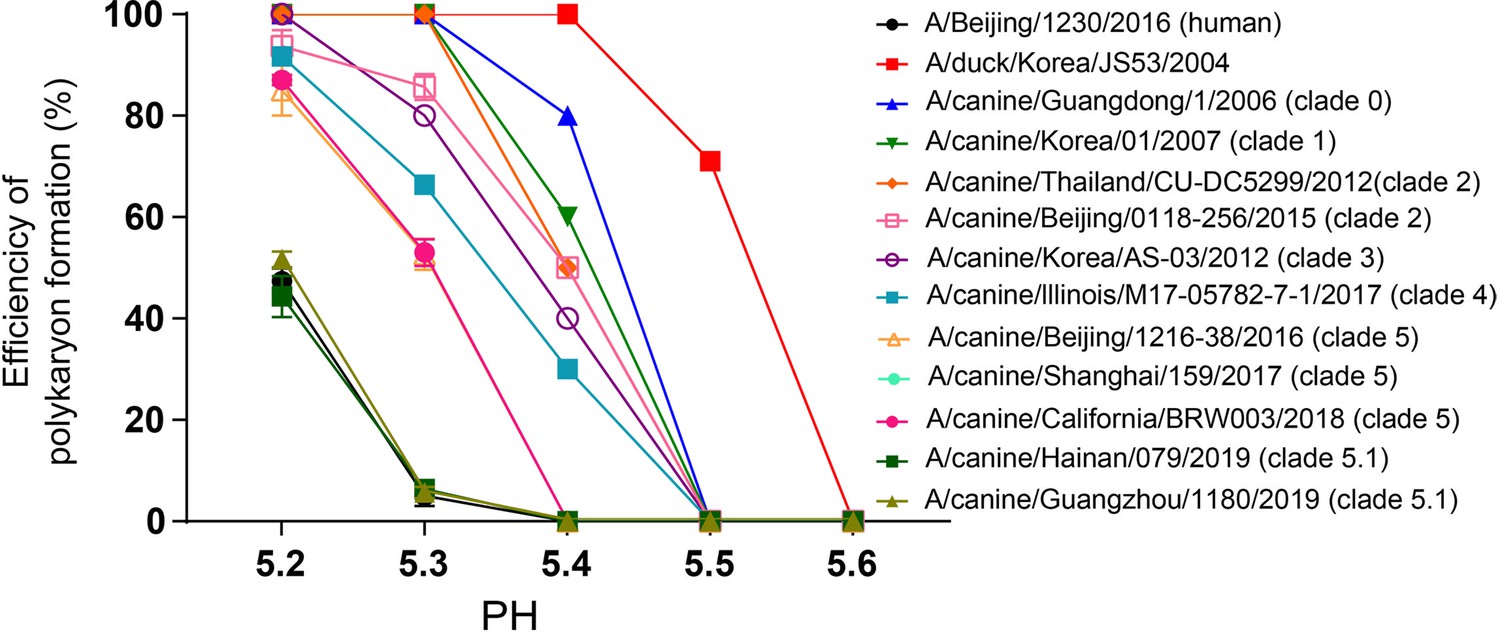
Syncytia assay results for H3N2 CIVs.
The efficiency of polykaryon formation over a pH range of 5.2–5.6 was estimated from the number of nuclei in the polykaryons divided by the total number of nuclei in the same field. The mean and standard deviation determined from five randomly chosen fields of cell culture are shown.
Figure 3
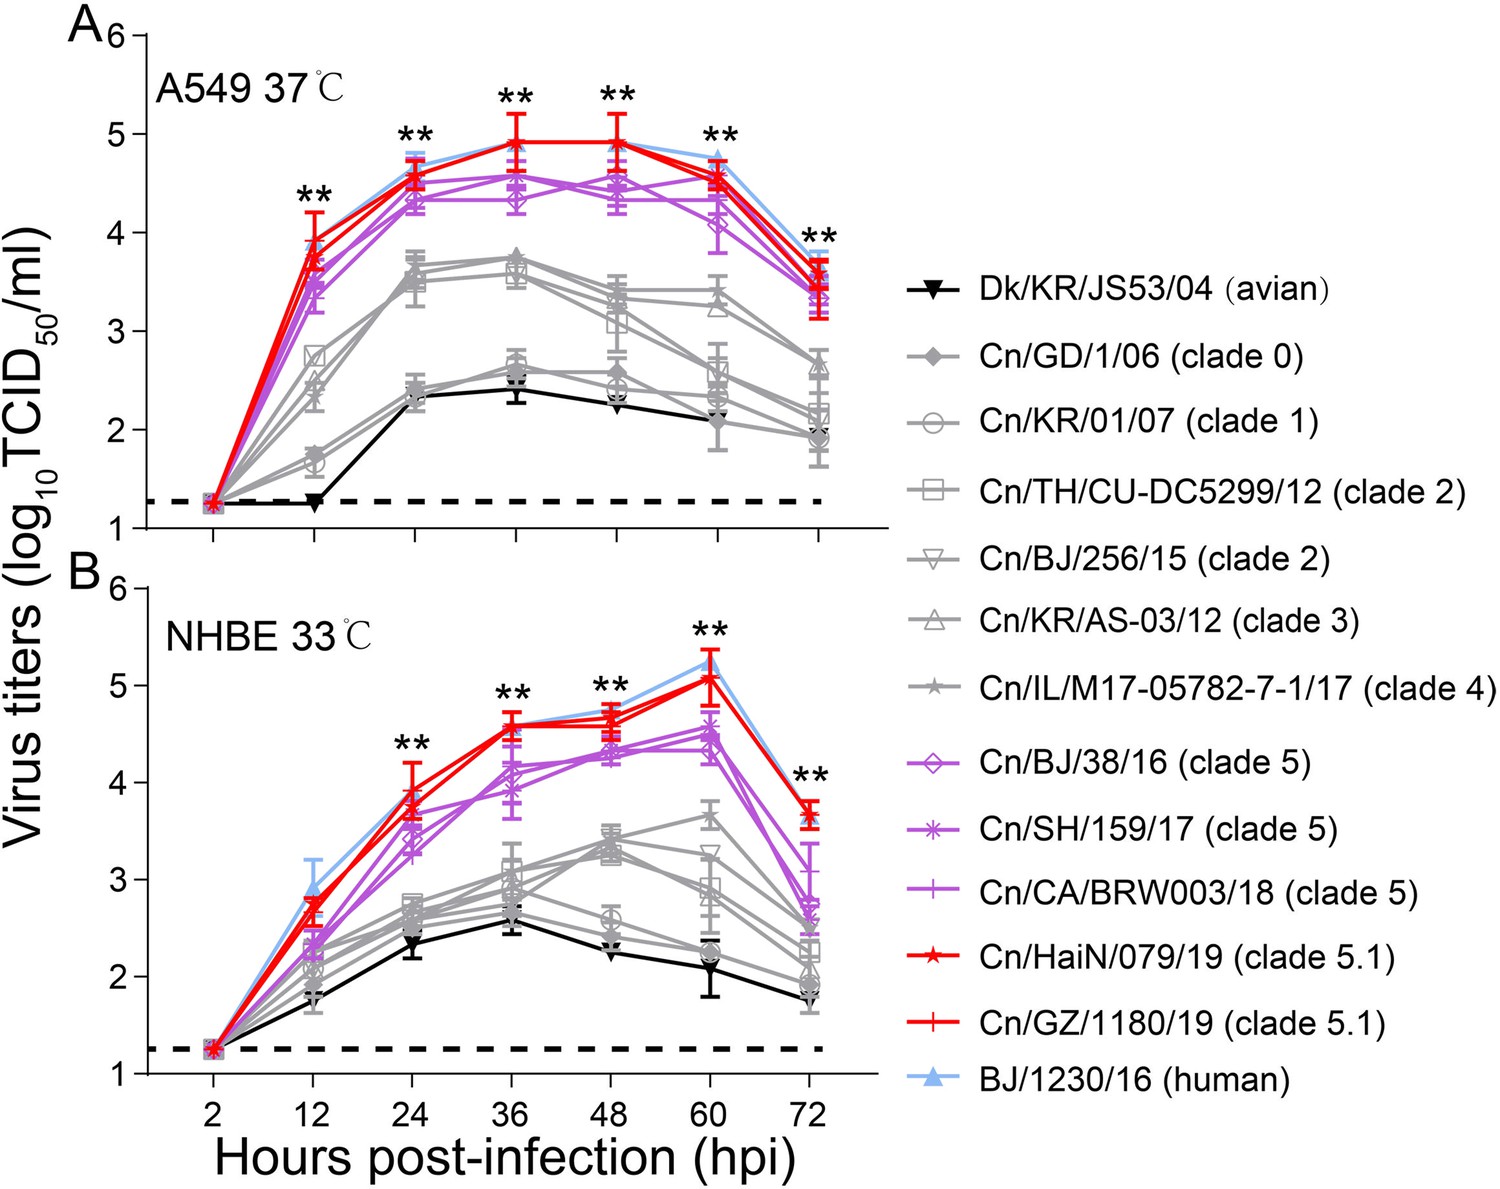
Viral growth properties in A549 (A) and NHBE (B) cells.
Cells were infected with indicated viruses at MOI of 0.01 and incubated at 37 °C or 33 °C. Supernatants were harvested at the indicated time points, and the virus titers were determined in MDCK cells. Values are expressed as means ± standard deviations (SD) (n=3 biological replicates and n=3 technical replicates). **p<0.01,statistical significance was assessed using two-way ANOVA, the titers of BJ/1230/16 (human seasonal H3N2 virus) and clade 5 or 5.1 viruses were significantly higher than other viruses. The dashed black lines indicate the lower limit of detection.
Figure 4 with 1 supplement
Infectivity and transmissibility of H3N2 CIVs in dogs.
(A) Virus replication in the indicated organ. Three dogs were infected intranasally with 106 EID50 of each virus and euthanized at 4 dpi for virus titration. Each color bar represents the virus titer of an individual animal. (B) Clinical symptoms score of dogs infected with H3N2 CIVs. (C) Body temperatures of dogs infected with H3N2 CIVs. The results are shown as the means ± standard deviations (n = 3) (*p<0.05; **p<0.01). (D) Direct contact transmission of H3N2 CIVs in dogs. Each virus was tested with a total of three donors that were in direct contact with each group. Dogs housed in the same cage are denoted by the same color. The dashed black lines indicate the lower limit of detection. Statistical significance of clade 5 or clade 5.1 viruses relative to other viruses in the inoculated animals was assessed using two-way ANOVA (*p<0.05; **p<0.01).
Figure 4—figure supplement 1
Direct contact transmission of H3N2 CIVs in dogs.
Groups of three female beagles housed in a cage placed inside an isolator were inoculated intranasally with 106 EID50 of the indicated virus. Twenty-four hours later, the three inoculated animals were individually paired by co-housing with a direct-contact dog. Nasal swabs were collected every other day from all animals for virus-shedding detection from day 2 of the initial infection. Each color bar represents the virus titer of an individual animal. No data are displayed when the virus was not detected from all of the groups. Dashed lines indicate the lower limit of virus detection. Statistical significance of clade 5.1 or clade 5 viruses relative to other viruses in the inoculated animals were assessed using two-way ANOVA (**p<0.01).
Figure 5
Respiratory droplet transmission of H3N2 CIVs in ferrets.
Groups of three ferrets were infected intranasally with 106 EID50 of indicated viruses and then housed separately in solid stainless-steel cages within an isolator. The next day, three uninfected respiratory droplet contact animals were individually housed in a wire-frame cage adjacent to the infected ferret. Nasal washes were collected every other day from all animals for virus-shedding detection from day 2 of the initial infection. Each color bar represents the virus titer of an individual animal. No data are displayed when no virus was detected in any of the groups. Dashed lines indicate the lower limit of virus detection. Statistical significance of the human influenza virus (BJ/1230/16) and clade 5.1 or clade 5 viruses relative to other viruses in the inoculated animals was assessed using two-way ANOVA (**p<0.01).
Figure 6 with 1 supplement
HA-G16S, G146S, N188D, and PB1-D154G mutations in H3N2 CIVs were the minimal molecular change required to facilitate the efficient aerosol transmissibility of the non-transmissible clade 2 virus.
(A) Detection frequency of G/S at hemagglutinin (HA) residue 16 and 146, N/D at HA1 residue 188 (n= 437), and D/G at PB1 residue 154 (n=437) in avian, canine, and human influenza viruses. Amino acid residues are colored blue, red, and green, respectively. (B) Identification of mutations that confer binding to human-type receptors (n=3 biological replicates and n=3 technical replicates). Values are expressed as means ± standard deviations (SD). The wildtype data (Cn/BJ/256/15) were reproduced from Figure 2. (C) Representative fields of Vero cells expressing the indicated HAs and exposed to pH 5.2, 5.3, 5.4, or 5.5 are shown. Scale bar, 100μm. The experiments were repeated three times, with similar results. (D) HA protein stability as measured by the ability of viruses to agglutinate CRBCs after incubation at indicated temperatures for 40 min. Colors indicate the hemagglutination titers upon treatment at various temperatures for 40 min, as shown in the legend. The experiments were repeated three times with similar results. (E) The effects of PB1 from 19(Cn/HaiN/079/19) and amino-acid substitutions at PB1 residue 154 on the viral polymerase activity were determined using a minigenome assay in 293T cells. Values shown are the mean ± SD of the three independent experiments and are standardized to those of 15 (Cn/BJ/256/15) measured at 37℃ (100%) and 33℃ (100%). Statistical significance was assessed using two-way ANOVA (**p<0.01). (F) Aerosol transmissibility of the mutation viruses in ferrets. The wildtype data (Cn/BJ/256/15) were reproduced from Figure 5. Statistical significance of rgHA(G16S, G146S, N188D)PB1(D154G) viruses relative to other single substitution viruses were assessed using two-way ANOVA (*p<0.05).
Figure 6—figure supplement 1
Detection frequency of the 15 amino acids that differed between 2006–2015 H3N2 CIVs and 2016–2019 H3N2 CIVs among HA (n=298) and PB1(n=298).
Amino acid residues are colored in blue or red.
Tables
Table 1
Cross-reactive antibody responses against influenza A (H3N2) viruses of human sera collected in China.
| Age group (year) | Antigen | %HI titer ≥40 (95% CI*) | %NI titer ≥10 (95% CI*) | %NT titer ≥40 for children or ≥80 for adults (95% CI*) |
|---|---|---|---|---|
| ≤10, n=100 | BJ/1230/16 (human) | 15.0 (7.9–22.1) | 26.0 (17.4–34.6) | 14.0 (7.2–20.8) |
| Cn/BJ/38/16 | 1.0 (0–2.9) | 2.0 (0–4.7) | 1.0 (0–2.9) | |
| Cn/FJ/1109/18 | 1.0 (0–2.9) | 2.0 (0–4.7) | 1.0 (0–2.9) | |
| Cn/GZ/011/19 | 2.0 (0–4.7) | 3.0 (0–6.3) | 2.0 (0–4.7) | |
| 25–53, n=100 | BJ/1230/16 (human) | 8.0 (2.7–13.3) | 12.0 (5.6–18.4) | 6.0 (1.4–10.6) |
| Cn/BJ/38/16 | 0 | 1.0 (0–2.9) | 0 | |
| Cn/FJ/1109/18 | 1.0 (0–2.9) | 2.0 (0–4.7) | 0 | |
| Cn/GZ/011/19 | 1.0 (0–2.9) | 1.0 (0–2.9) | 0 | |
| ≥60, n=100 | BJ/1230/16 (human) | 5.0 (0.7–9.3) | 12.0 (5.6–18.4) | 4.0 (0.2–7.8) |
| Cn/BJ/38/16 | 0 | 1.0 (0–2.9) | 0 | |
| Cn/FJ/1109/18 | 1.0 (0–2.9) | 1.0 (0–2.9) | 0 | |
| Cn/GZ/011/19 | 1.0 (0–2.9) | 2.0 (0–4.7) | 0 |
-
*
Confidence interval.
Additional files
-
Supplementary file 1
Antigenic analysis of H3N2 subtype canine influenza viruses in the world.
HI titers are the inverse of the highest dilution that inhibited hemagglutination. Cells containing moderate HI titers (160, 320) are shaded gray, and high titers (>640) black. Low HI titers (40, 80) are not shaded. Titers <10 are indicated with the sign <. HI, hemagglutinin inhibition. †Homologous titer.
- https://cdn.elifesciences.org/articles/83470/elife-83470-supp1-v2.docx
-
Supplementary file 2
NI titers of ferret antisera against human influenza A (H3N2) and H3N2 canine influenza preponderant prevalent viruses used in this study.
NI titers are the inverse of the highest dilution that inhibited neuraminidase activity. NI, neuraminidase inhibition. †Homologous titer.
- https://cdn.elifesciences.org/articles/83470/elife-83470-supp2-v2.docx
-
Supplementary file 3
Seroconversion of the dogs in transmission experiments.
aSera were collected from the dogs 3 weeks after virus inoculation or exposure; these animals were used for the transmission studies shown in Figure 4 and Figure 4—figure supplement 1. HI, hemagglutinin inhibition.
- https://cdn.elifesciences.org/articles/83470/elife-83470-supp3-v2.docx
-
Supplementary file 4
Seroconversion of the ferrets in transmission experiments.
aSera were collected from the ferrets 3 weeks after virus inoculation or exposure; these animals were used for the transmission studies shown in Figure 5. HI, hemagglutinin inhibition.
- https://cdn.elifesciences.org/articles/83470/elife-83470-supp4-v2.docx
-
Supplementary file 5
Transmission of H3N2 reassortant viruses in dogs.
‡Number of animals in which virus was detected in nasal swabs. Values in parentheses indicate nasal swab titers, which are expressed as mean log10 peak virus titer observed within the first 9 dpi. §Number of animals in which seroconversion was observed. Values in parentheses show HI antibody titers in sera collected at 21 dpi. HI titers were determined using the homologous virus as a test antigen.
- https://cdn.elifesciences.org/articles/83470/elife-83470-supp5-v2.docx
-
Supplementary file 6
Transmission of H3N2 reassortant viruses in ferrets.
‡Number of animals in which virus was detected in nasal washes. Values in parentheses indicate nasal wash titers, which are expressed as mean log10 peak virus titer observed within the first 9 dpi. §Number of animals in which seroconversion was observed. Values in parentheses show HI antibody titers in sera collected at 21 dpi. HI titers were determined using the homologous virus as a test antigen.
- https://cdn.elifesciences.org/articles/83470/elife-83470-supp6-v2.docx
-
MDAR checklist
- https://cdn.elifesciences.org/articles/83470/elife-83470-mdarchecklist1-v2.docx
Download links
A two-part list of links to download the article, or parts of the article, in various formats.
Downloads (link to download the article as PDF)
Open citations (links to open the citations from this article in various online reference manager services)
Cite this article (links to download the citations from this article in formats compatible with various reference manager tools)
Increased public health threat of avian-origin H3N2 influenza virus caused by its evolution in dogs
eLife 12:e83470.
https://doi.org/10.7554/eLife.83470


