Pharmacological hallmarks of allostery at the M4 muscarinic receptor elucidated through structure and dynamics
- Drug Discovery Biology, Monash Institute of Pharmaceutical Sciences, Monash University, Australia
- Center for Computational Biology and Department of Molecular Biosciences, University of Kansas, United States
- ARC Centre for Cryo-electron Microscopy of Membrane Proteins, Monash Institute of Pharmaceutical Sciences, Monash University, Australia
- Department of Pharmacology, Warren Center for Neuroscience Drug Discovery and Department of Chemistry, Warren Center for Neuroscience Drug Discovery, Vanderbilt University, United States
- The Centre for Translational Pharmacology, Advanced Research Centre (ARC), College of Medical, Veterinary and Life Sciences, University of Glasgow, United Kingdom
- Graduate School of Medicine, University of Tokyo, Japan
- Neuromedicines Discovery Centre, Monash University, Australia
Figures
Figure 1 with 2 supplements
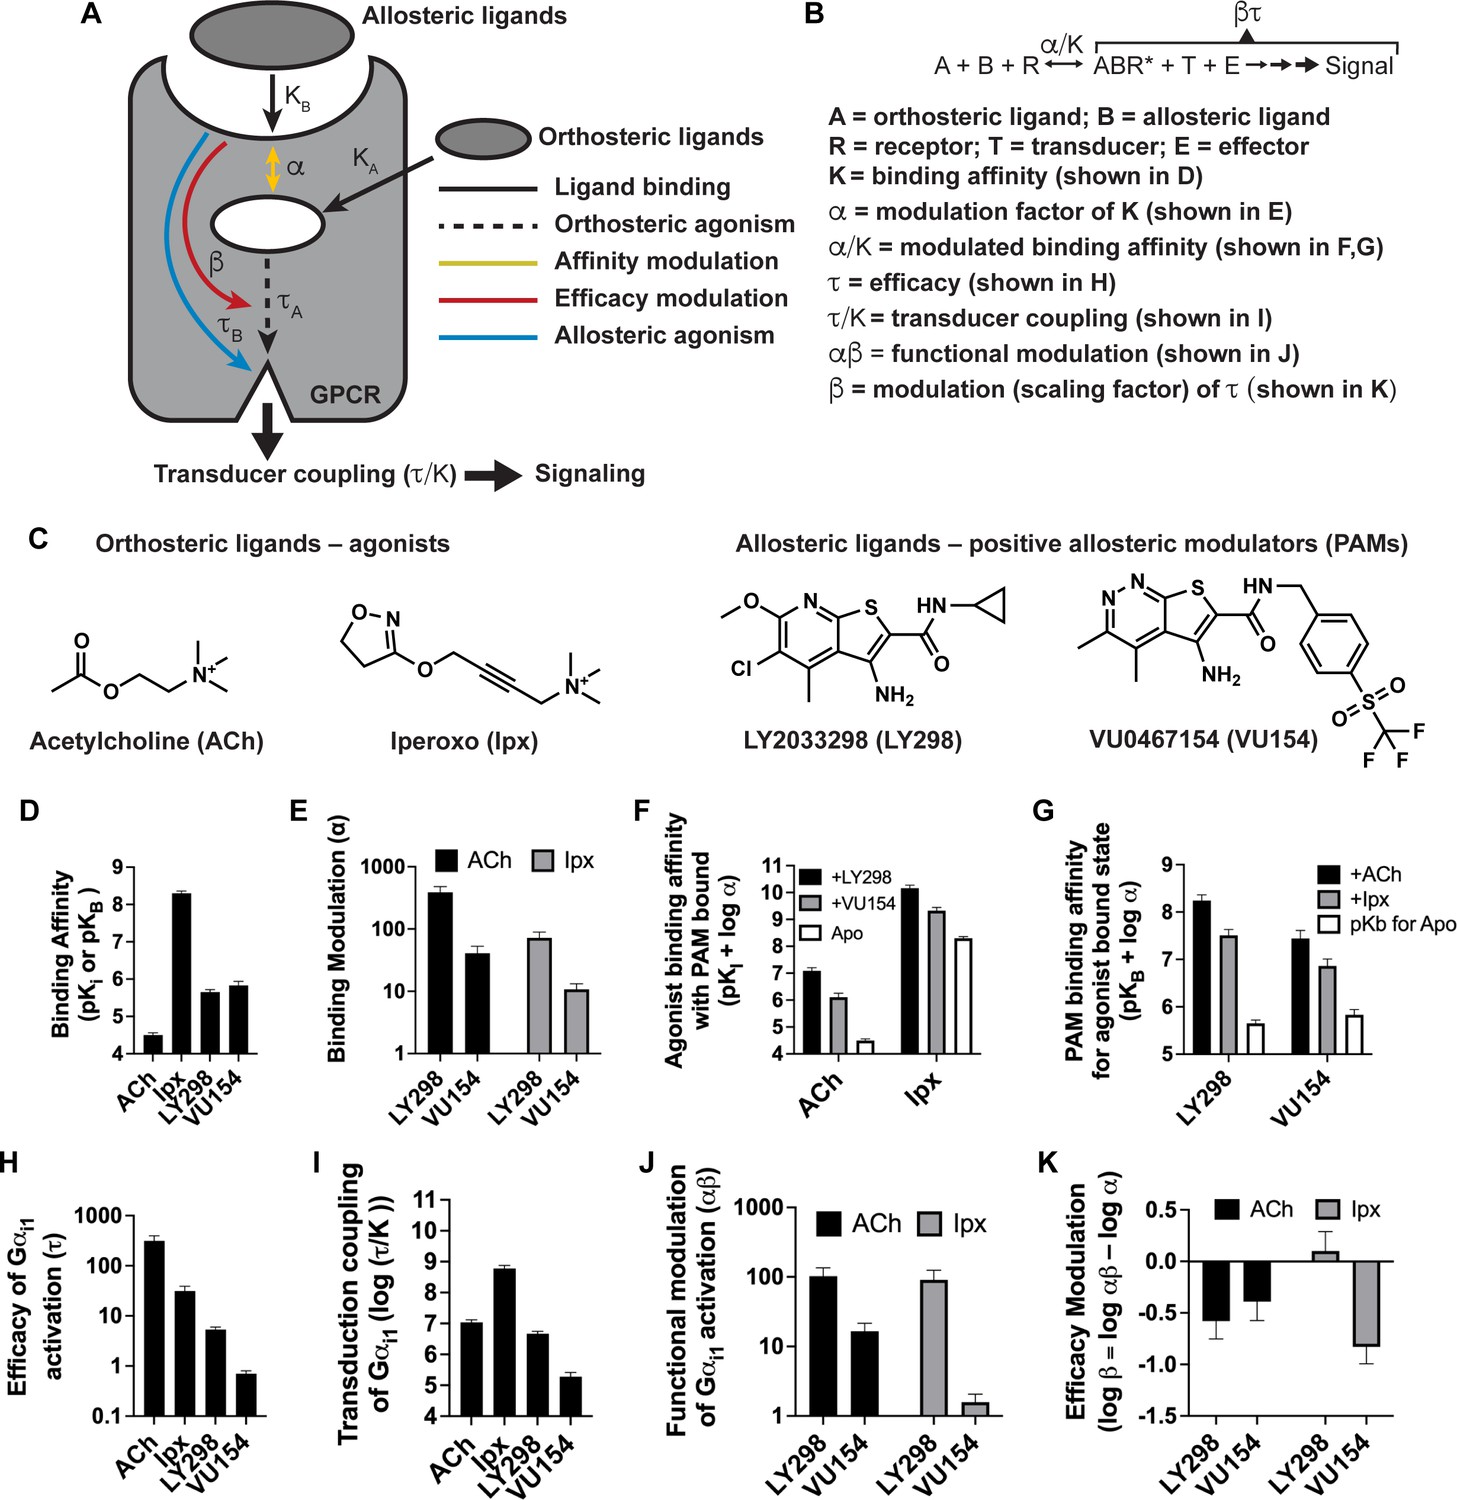
Pharmacological characterization of the positive allosteric modulators (PAMs), LY298 and VU154, with acetylcholine (ACh) and iperoxo (Ipx) at the human M4 muscarinic acetylcholine receptor (mAChR).
(A) Schematic of the pharmacological parameters that define effects of orthosteric and allosteric ligands on a G protein-coupled receptor (GPCR). (B) A simplified schematic diagram of the Black–Leff operational model to quantify agonism, allosteric modulation, and agonist bias with pharmacological parameters defined (Black and Leff, 1983). (C) 2D chemical structures of the orthosteric and allosteric ligands used in this study. (D–G) Key pharmacological parameters for interactions between orthosteric and allosteric ligands in [3H]-N-methylscopolamine ([3H]-NMS) binding assays. (D) Equilibrium binding affinities (pKi and pKB) and (E) the degree of binding modulation (α) between the agonists and PAMs resulting in the modified binding affinities (F) α/KA and (G) α/KB. (H–K) Key pharmacological parameters relating to Gαi1 activation for interactions between orthosteric and allosteric ligands measured with the TruPath assay (Figure 1—figure supplement 1). (H) The signaling efficacy (τA and τB) and (I) transduction coupling coefficients (log (τ/K)) of each ligand. (J) The functional cooperativity (αβ) between ligands and (K) the efficacy modulation (β) between ligands. All data are mean ± SEM of three or more independent experiments performed in duplicate or triplicate with the pharmacological parameters determined using a global fit of the data. The error in (F, G, K) was propagated using the square root of the sum of the squares. See Table 1. Concentration–response curves are shown in Figure 1—figure supplement 1.
-
Figure 1—source data 1
Related to Figure 1D–K.
- https://cdn.elifesciences.org/articles/83477/elife-83477-fig1-data1-v1.xlsx
Figure 1—figure supplement 1
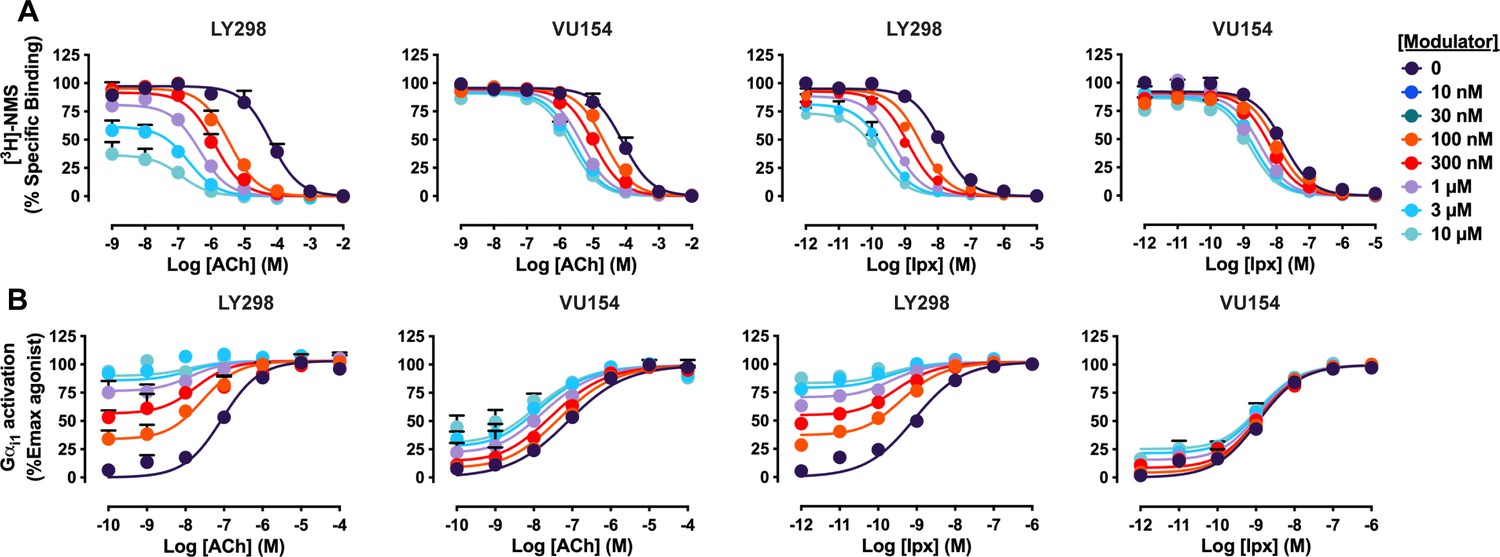
Concentration–response curves of interactions between the orthosteric ligands (acetylcholine [ACh], iperoxo [Ipx]) and the allosteric ligands (LY298, VU154) at the human M4 muscarinic acetylcholine receptor (mAChR).
(A) [3H]-N-methylscopolamine ([3H]-NMS) binding assays. (B) Gαi1 activation using the TruPath assay. All data points are mean ± SEM of three or more independent experiments performed in duplicate or triplicate with the pharmacological parameters determined from a global fit of the data. Parameters quantifying the data are shown in Figure 1 and Table 1.
-
Figure 1—figure supplement 1—source data 1
Related to Figure 1—figure supplement 1.
- https://cdn.elifesciences.org/articles/83477/elife-83477-fig1-figsupp1-data1-v1.xlsx
Figure 1—figure supplement 2
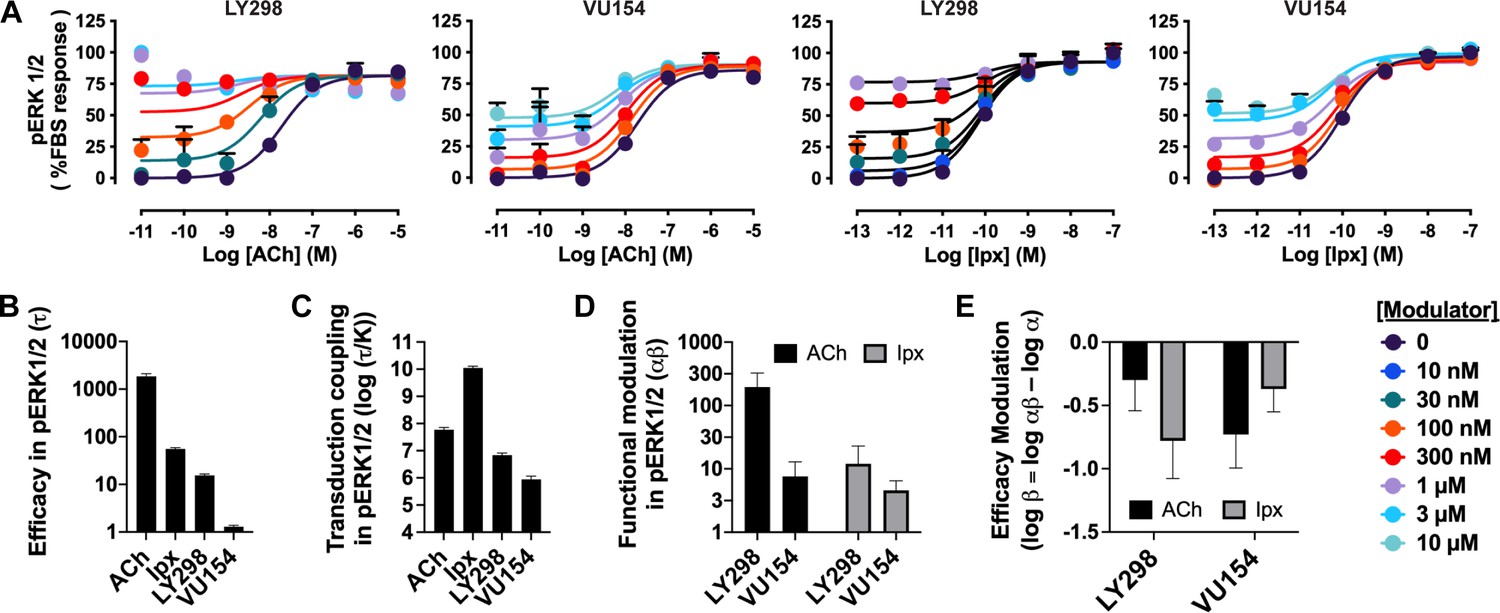
Pharmacological characterization of the positive allosteric modulators (PAMs), LY298 and VU154, with acetylcholine (ACh) and iperoxo (Ipx) in pERK1/2 signaling assays.
(A) Concentration–response curves of interactions between the orthosteric and allosteric ligands at the human M4 mAChR in the pERK1/2 signaling assay. (B–E) Quantification of data from (A) to calculate (B) the signaling efficacy (τA and τB), (C) the transduction coupling coefficients (log (τ/K)) of each ligand, (D) the functional cooperativity (αβ) between ligands, and (E) the efficacy modulation (β) between ligands. All data are mean ± SEM of three or more independent experiments performed in duplicate or triplicate with the pharmacological parameters determined from a global fit of the data. The error in (E) was propagated using the square root of the sum of the squares. Pharmacological parameters are reported in Table 1.
-
Figure 1—figure supplement 2—source data 1
Related to Figure 1—figure supplement 2.
- https://cdn.elifesciences.org/articles/83477/elife-83477-fig1-figsupp2-data1-v1.xlsx
Figure 2 with 5 supplements
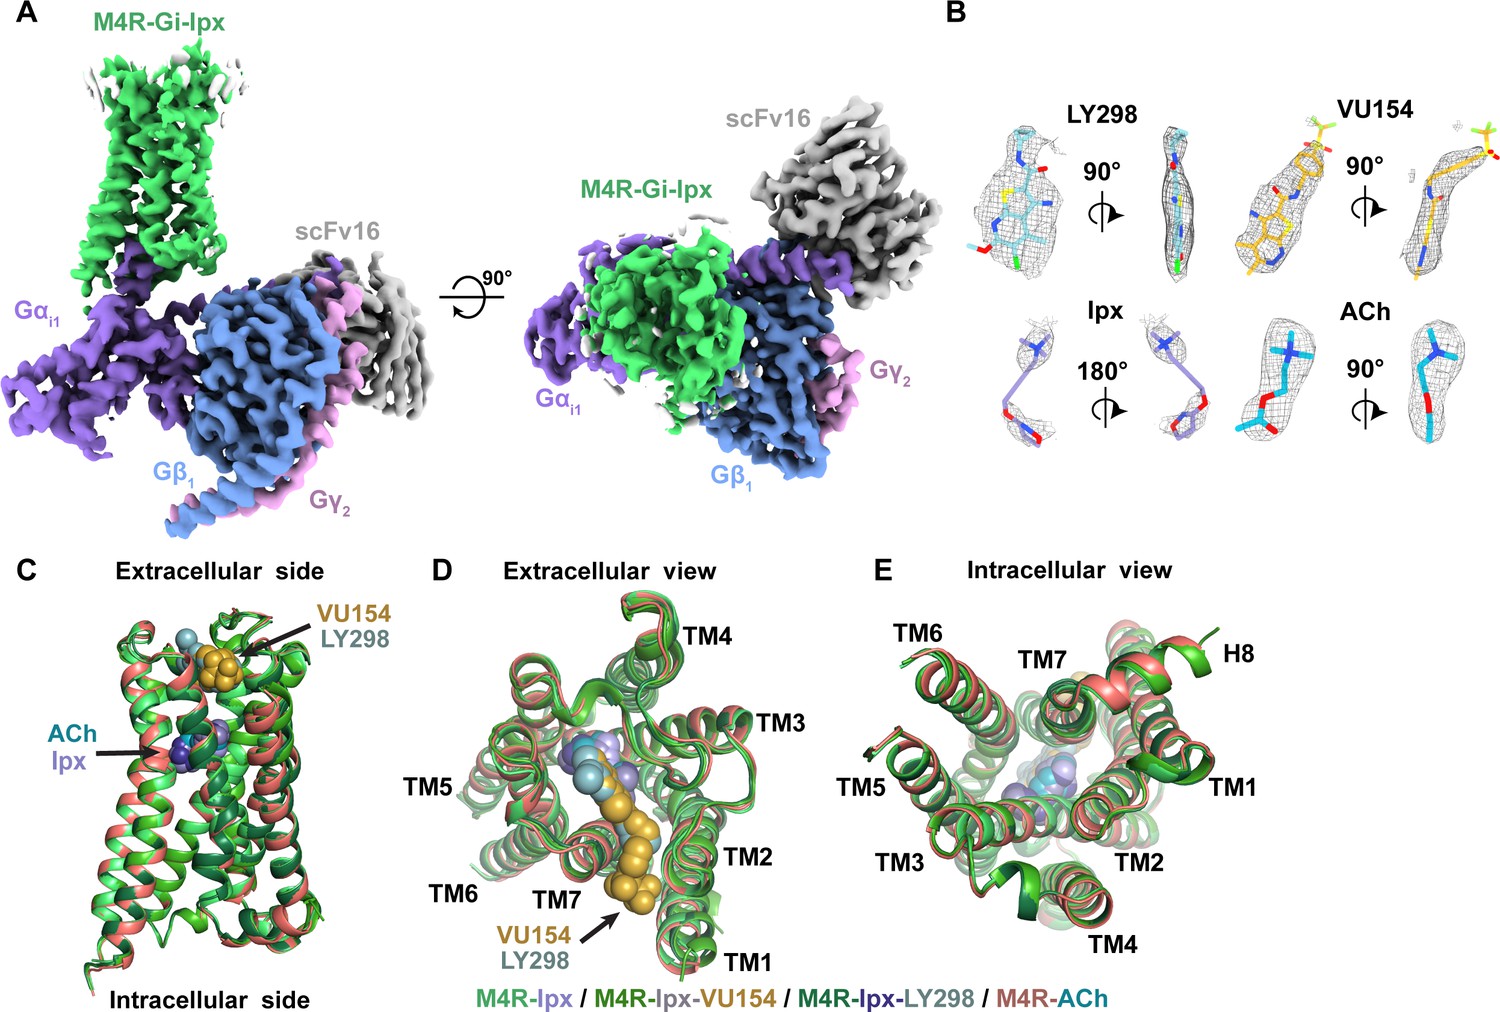
Cryo-electron microscopy (cryo-EM) structures of the M4R-Gi1-scFv16 complexes.
(A) Cryo-EM maps of Ipx-bound M4R-Gi1-scFv16 complex with views from the membrane and the extracellular surface. Cryo-EM maps of the other ligand-bound structures are shown in Figure 2—figure supplement 1. (B) Representative EM density around the ligands in this study. EM-maps of Ipx-, LY298-Ipx-, and VU154-Ipx were set to a contour level of 0.011 and the receptor-focused map of ACh- was set to 0.32. (C–E) Comparison of the receptor models with bound ligands and views from the (C) membrane, (D) extracellular surface, and (E) intracellular surface.
Figure 2—figure supplement 1
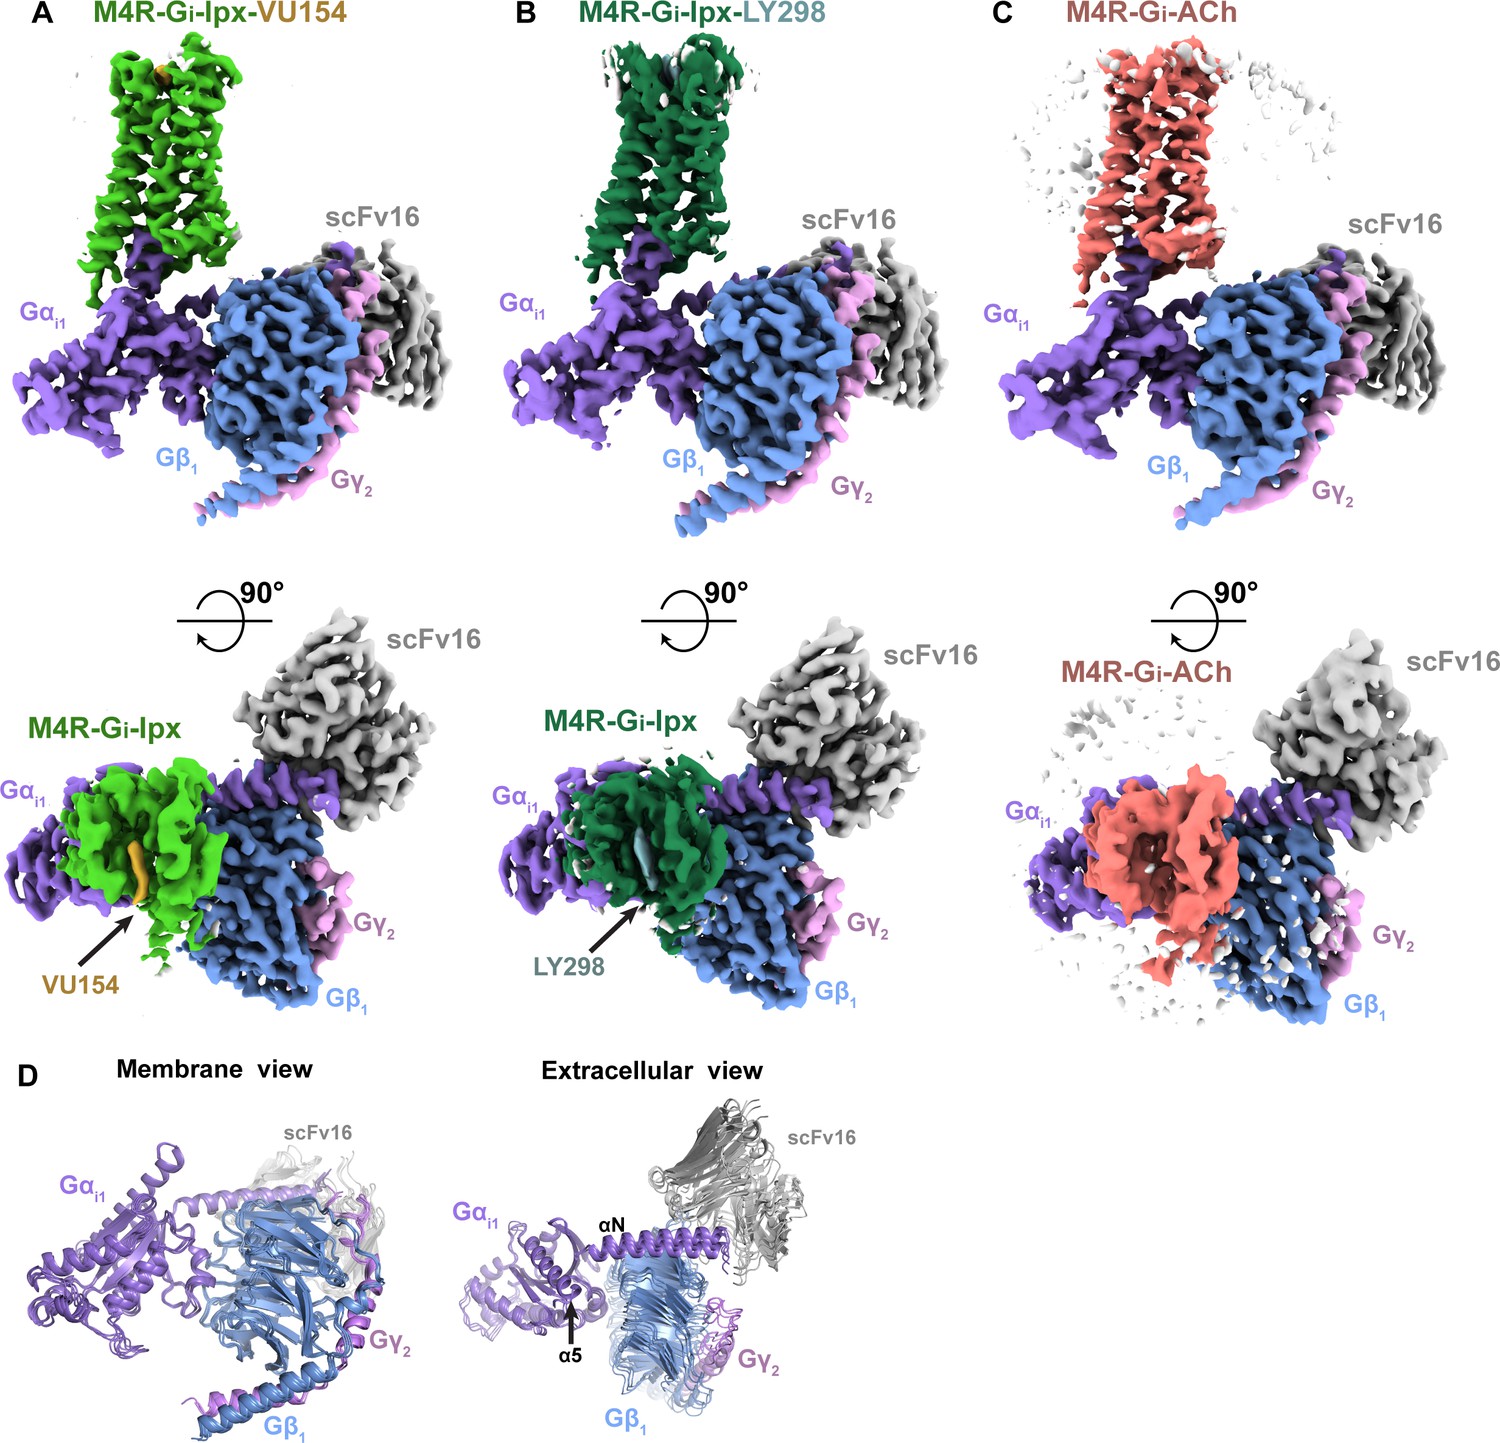
Cryo-electron microscopy (cryo-EM) structures of the M4R-Gi1-scFv16 complexes.
(A–C) Cryo-EM maps of (A) VU154-Ipx, (B) LY298-Ipx-, and (C) ACh-bound M4R-Gi1-scFv16 complex with views from the membrane and the extracellular surface. The comparison of receptor models is shown in Figure 2. (D) Comparison of the positions of Gαi1Gβ1Gγ2-scFv16 from all four cryo-EM structures with views from the membrane and extracellular surface.
Figure 2—figure supplement 2
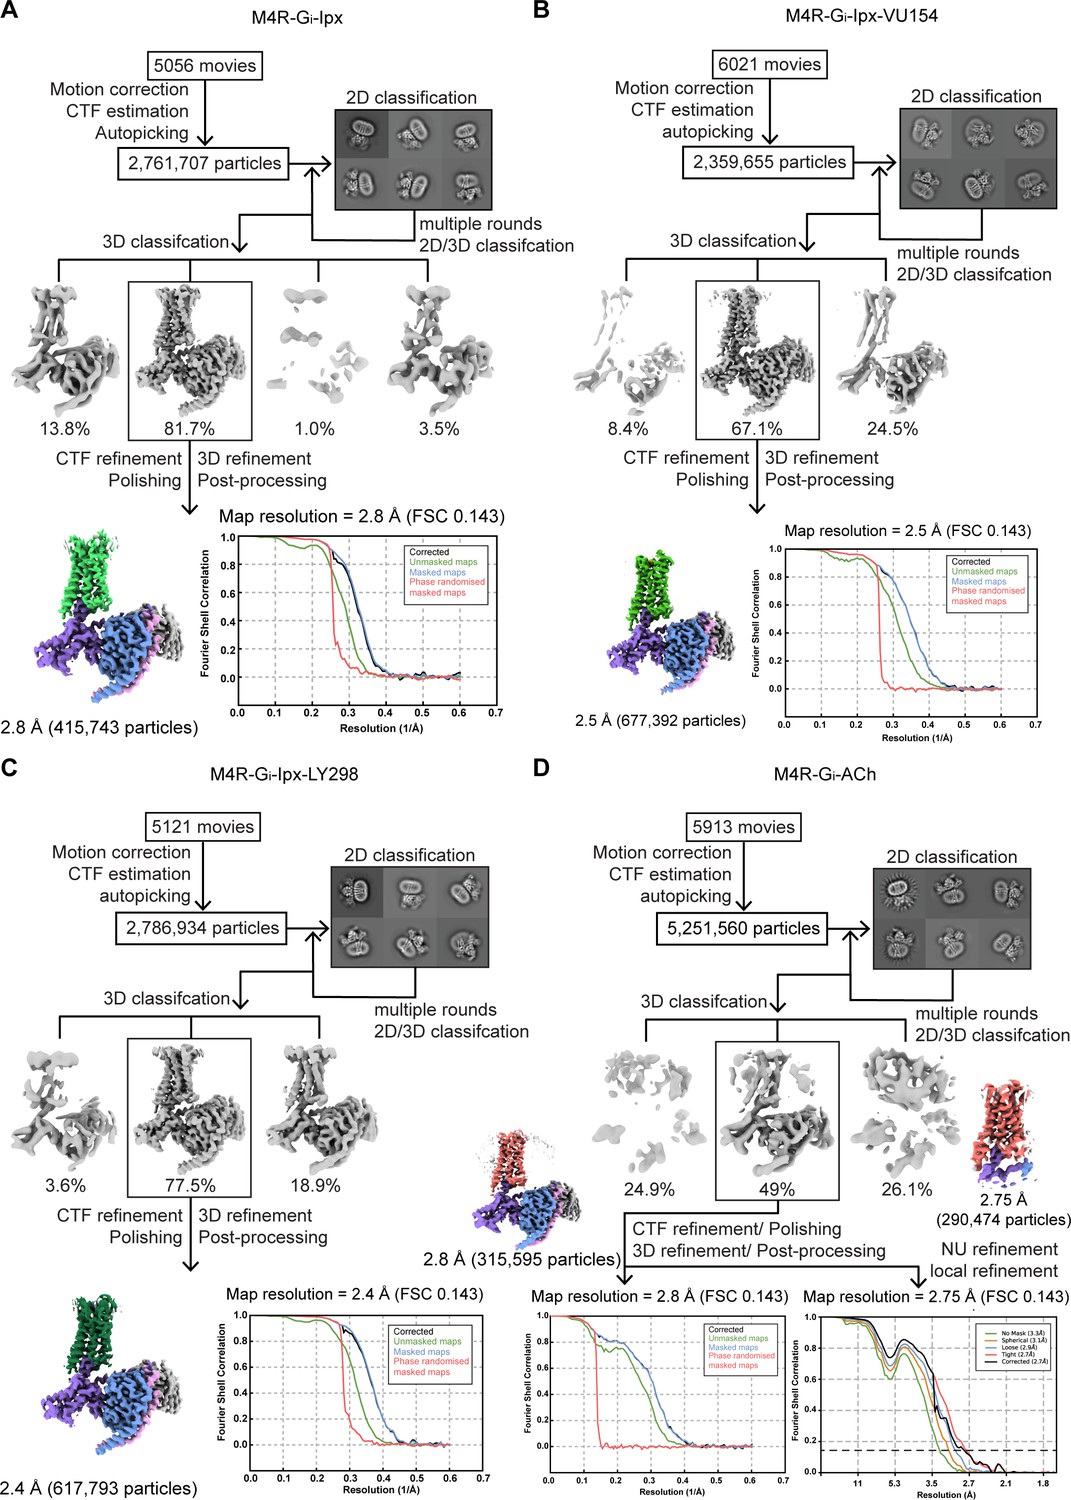
Cryo-electron microscopy (cryo-EM) data processing and analysis.
(A–D) Flowchart of cryo-EM data processing of the (A) Ipx-, (B) VU154-Ipx-, (C) LY298-Ipx-, and (D) ACh-bound M4 muscarinic acetylcholine receptor (mAChR) complexes with Gi1-scFv16 including particle selections, 2D and 3D classifications, EM density map, and the Fourier shell correlation (FSC) curves.
Figure 2—figure supplement 3
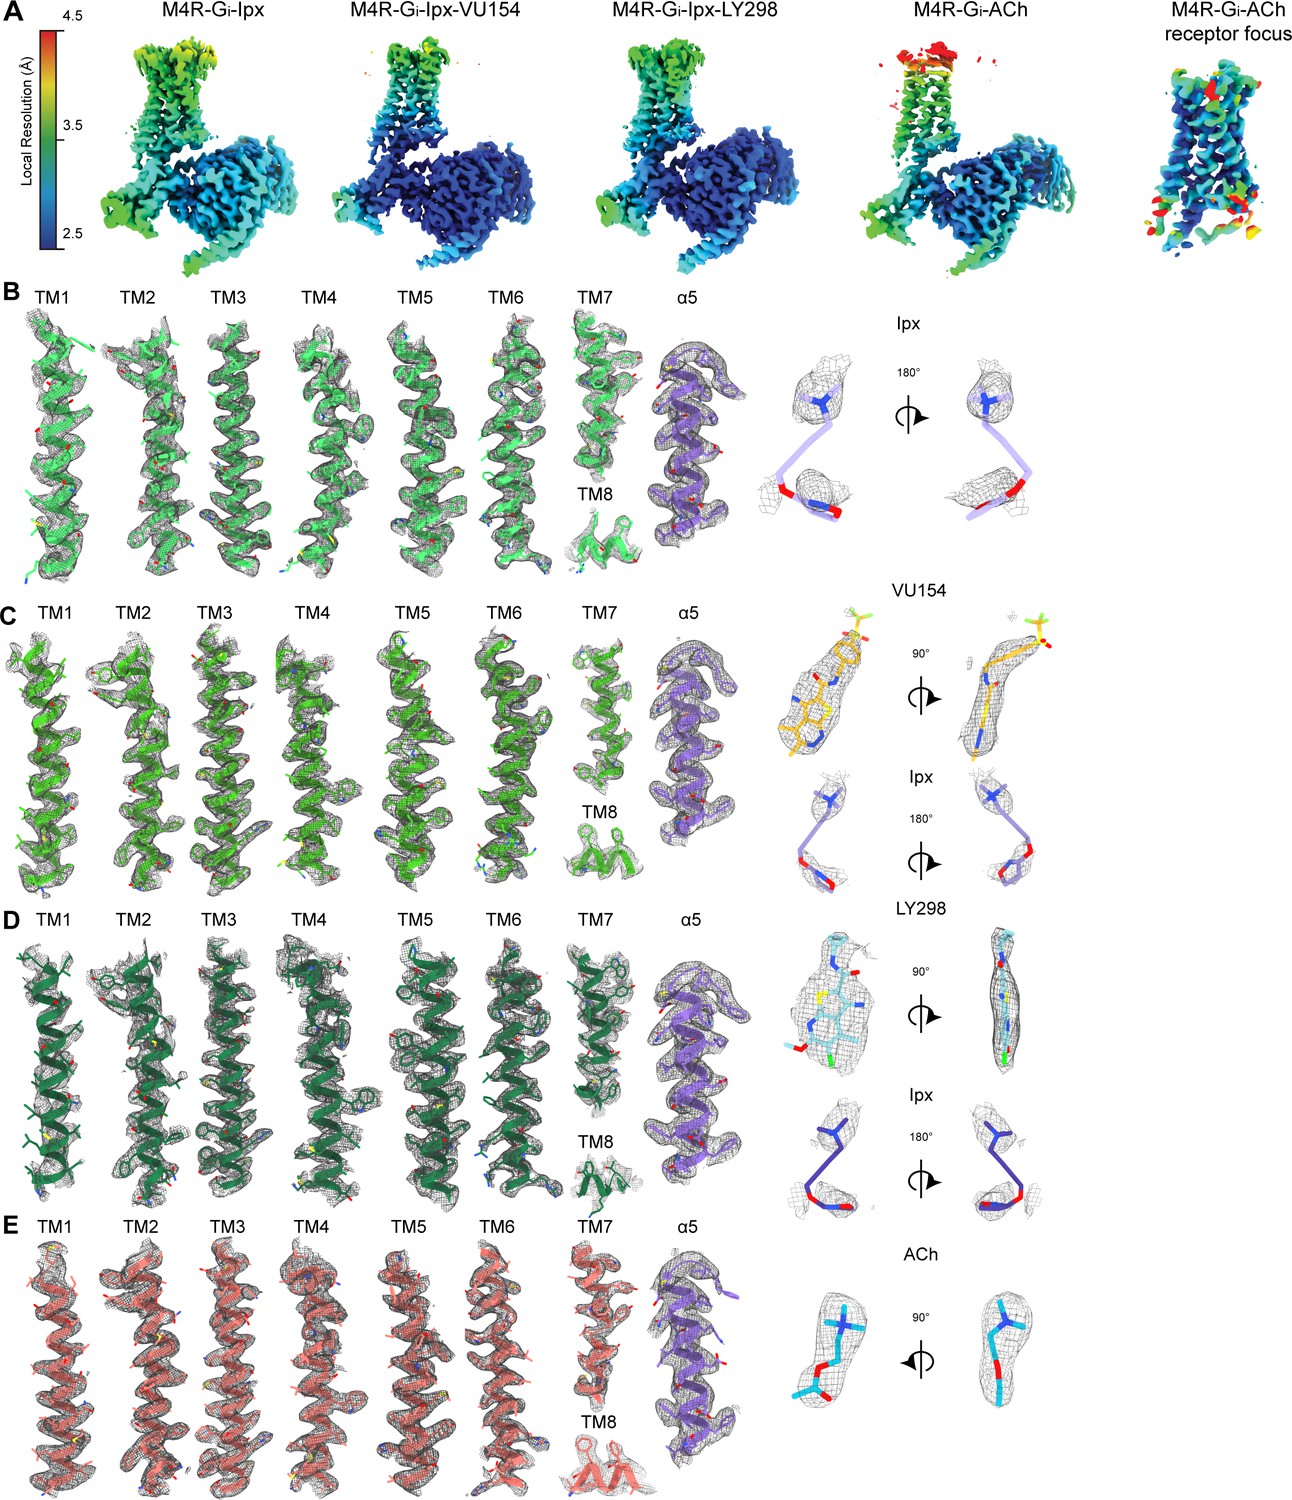
Cryo-electron microscopy (cryo-EM) density maps.
(A) EM maps colored by local resolution. (B–E) Representative EM density and modeling for the 7 transmembrane (TM) helices, the C-terminus of Gαi1, and ligands for the (B) Ipx-, (C) VU154-Ipx-, (D) LY298-Ipx-, and (E) ACh-bound M4 muscarinic acetylcholine receptor (mAChR) complexes. EM-maps of Ipx-, LY298-Ipx-, and VU154-Ipx were set to a contour level of 0.011 and the receptor-focused map of ACh- was set to 0.32.
Figure 2—figure supplement 4
Comparison of active state muscarinic acetylcholine receptor (mAChR) structures.
(A) Comparison of the Ipx- and LY298-Ipx-bound M4 mAChR structures to the prior structures of Ipx-bound M1 mAChR and LY2119620-Ipx-bound M2 mAChR cryo-EM structures. Protein Data Bank (PDB) accession codes for the M1 mAChR (PDB: 6OIJ) and the M2 mAChR (PDB: 6OIK). (B, C) Views from the (B) extracellular and (C) intracellular surfaces. (D) Comparison of the binding pose of LY2119620 at the M2 mAChR and LY2033298 at the M4 mAChR. (E) Comparison of the Ipx binding site residues.
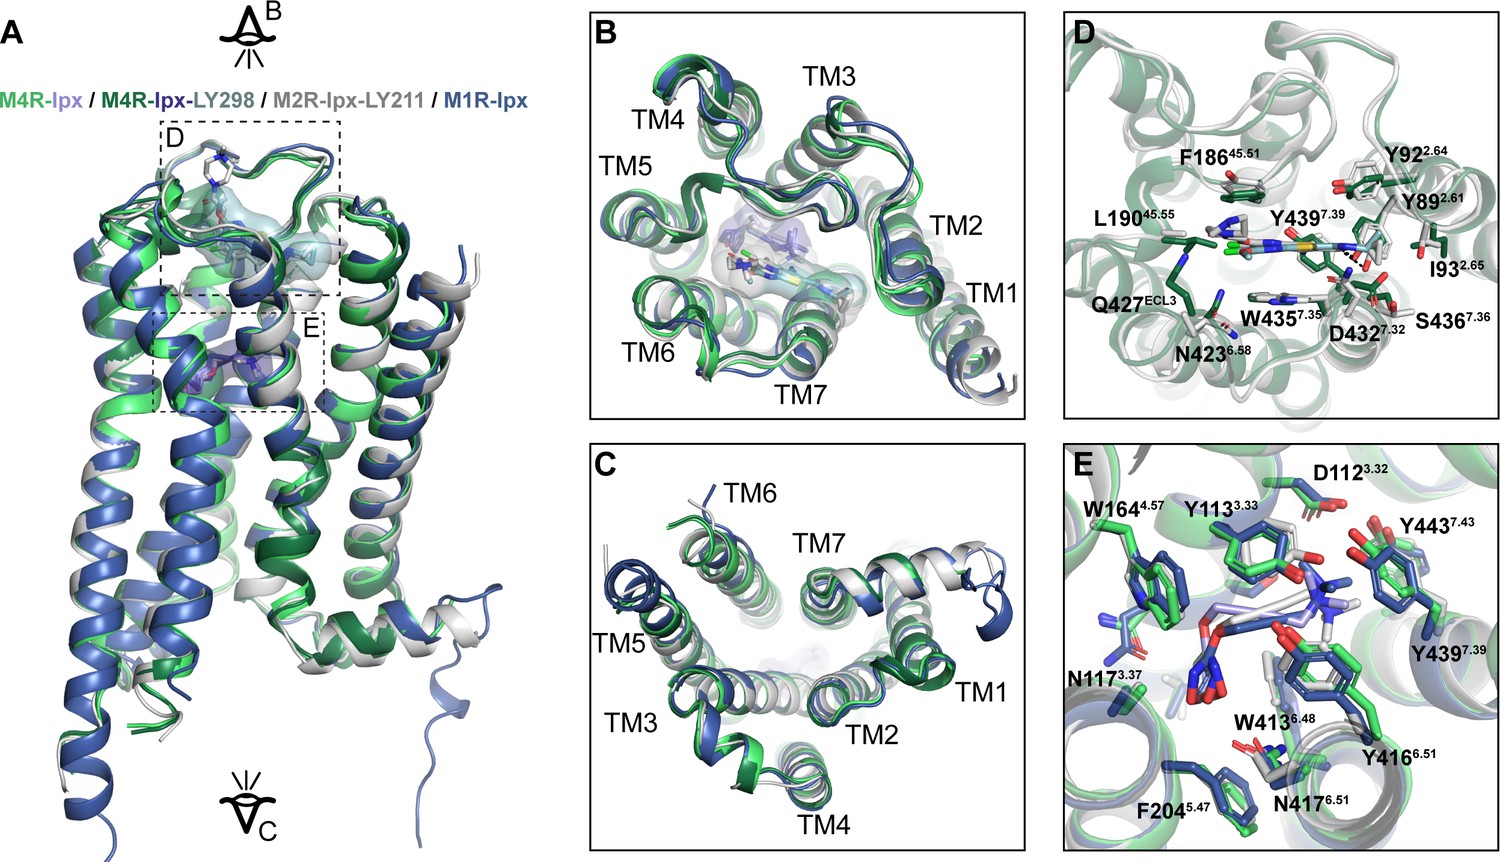
Figure 2—figure supplement 5
Comparison of active state M4 muscarinic acetylcholine receptor (mAChR) structures.
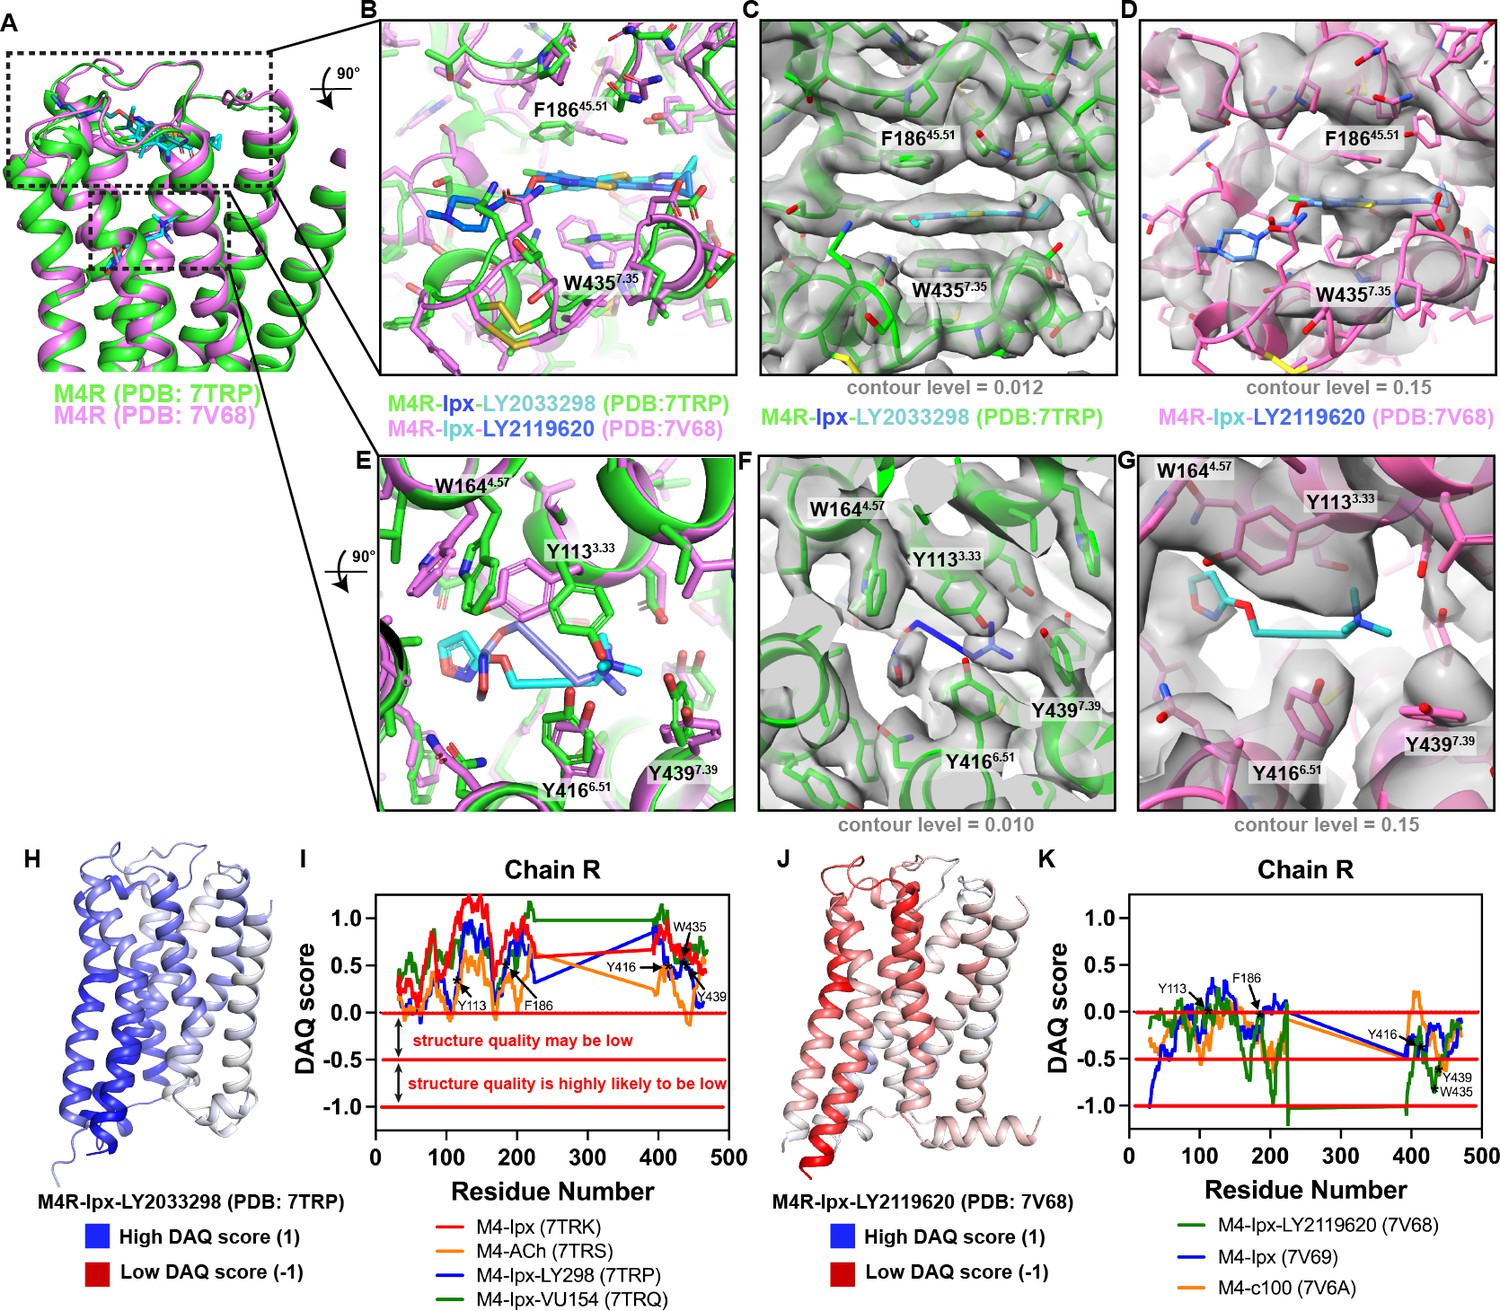
(A) Comparison of LY298-Ipx bound M4 mAChR structure (PDB: 7TRP, receptor colored green, Ipx blue, and LY298 cyan) to the LY2119620-Ipx bound M4 mAChR structure (PDB: 7V68, receptor colored pink, Ipx cyan, and LY2119620 blue) (Wang et al., 2022). (B–D) View of the allosteric binding site from the top of the receptor. (B) Comparison of key allosteric residues F18645.51 and W4357.35 showing different positions of the residues between M4 mAChR structures. (C) Overlay of the EM map (EMD-26100, colored gray) onto the LY298-Ipx bound M4 mAChR structure contoured at 0.012. (D) Overlay of the EM map (EMD-31738, colored gray) onto the LY2119620-Ipx bound M4 mAChR structure contoured at 0.15. There is a lack of EM density surrounding the allosteric residues F18645.51 and W4357.35 at this level of contour and all others. (E–G) View of the orthosteric binding site from the top of the receptor. (E) Comparison of key orthosteric binding site residues. (F) Related to (C) with view from orthosteric site and the EM-map contoured at 0.010. (G) Related to (D) with view from the orthosteric site with mismodeled residues. (H–K) DAQ scores provide an estimation of the local quality of protein models from cryo-electron microscopy (cryo-EM) maps on a per residue basis. DAQ scores were determined from the DAQ web server using the recommended default settings (Terashi et al., 2022). (H, J) DAQ scores from the analysis of (H) the LY298-Ipx-M4R-Gi1 complex and (J) the LY2119620-Ipx-M4R-Gi1 complex mapped onto the cartoon of the receptor chain and color coded by score. A DAQ score that is positive (colored blue at values of 1) indicates a correct assignment. A DAQ score near 0 (colored white) indicates a position in the map that lacks a distinct density pattern for the assigned amino acid. DAQ scores less than 0 (colored red at –1) indicate a position that could be misassigned or poorly fit. (I) DAQ scores for all four M4 mAChR structures reported in this article with DAQ scores of each Cα atom plotted for each residue. Key orthosteric and allosteric residues are denoted by asterisks. Nearly every residue has a value above 0. (K) Similar to (I), but for all three M4 mAChR structures reported in Wang et al., 2022. Very few residues have a score above 0, indicating potential issues with the model and maps.
Figure 3 with 1 supplement
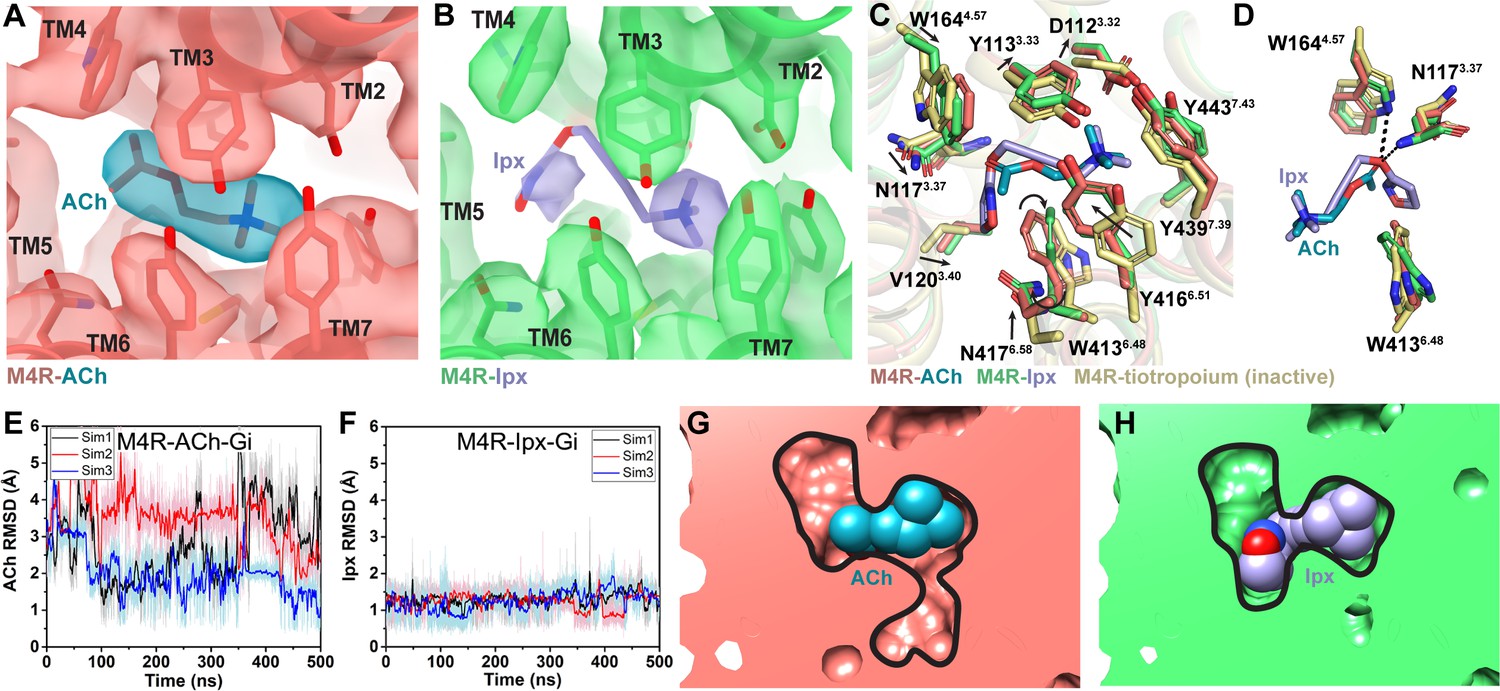
Interactions of acetylcholine (ACh) and iperoxo (Ipx) with the receptor.
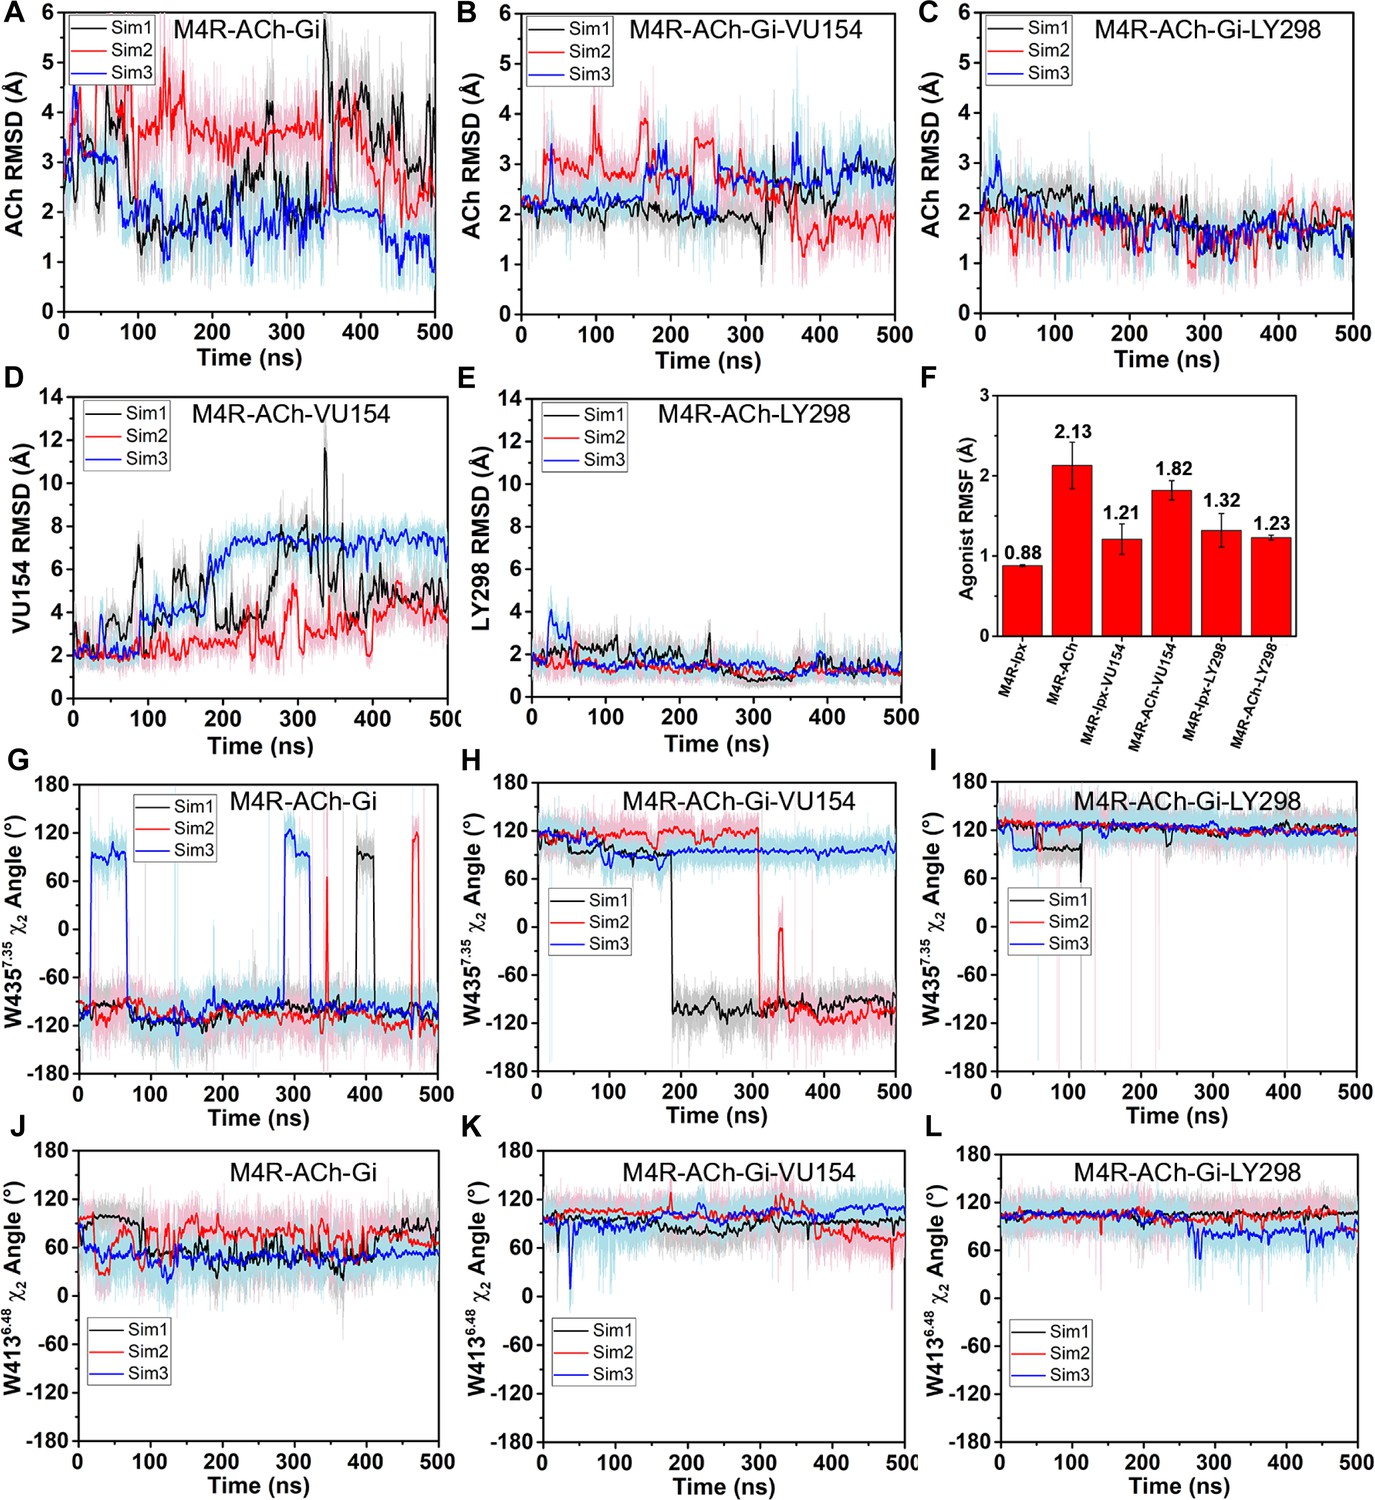
(A, B) Cryo-electron microscopy (cryo-EM) density of the (A) ACh- and (B) Ipx-bound structures. (C, D) Interactions at the orthosteric binding site comparing the active state ACh- and Ipx-bound structures with the inactive state tiotropium-bound structure (PDB: 5DSG). Arrows denote relative movement of residues between the inactive and active states. (D) Detailed interactions of ACh and Ipx. Hydrogen bonds are shown as black dashed lines. (E, F) Time courses from Gaussian accelerated molecular dynamics (GaMD) simulations of the ACh- and Ipx- bound M4R-Gi1 cryo-EM structures, each performed with three separate replicates. Individual replicate simulations are illustrated with different colors. The heading of each plot refers to the specific model used in the simulations. Root mean square deviations (RMSDs) of (E) ACh and (F) Ipx from simulations of the cryo-EM structures. (G, H) Cross-sections through the ACh- and Ipx-bound structures denoting the relative size of the binding pockets outlined in black.
Figure 3—figure supplement 1
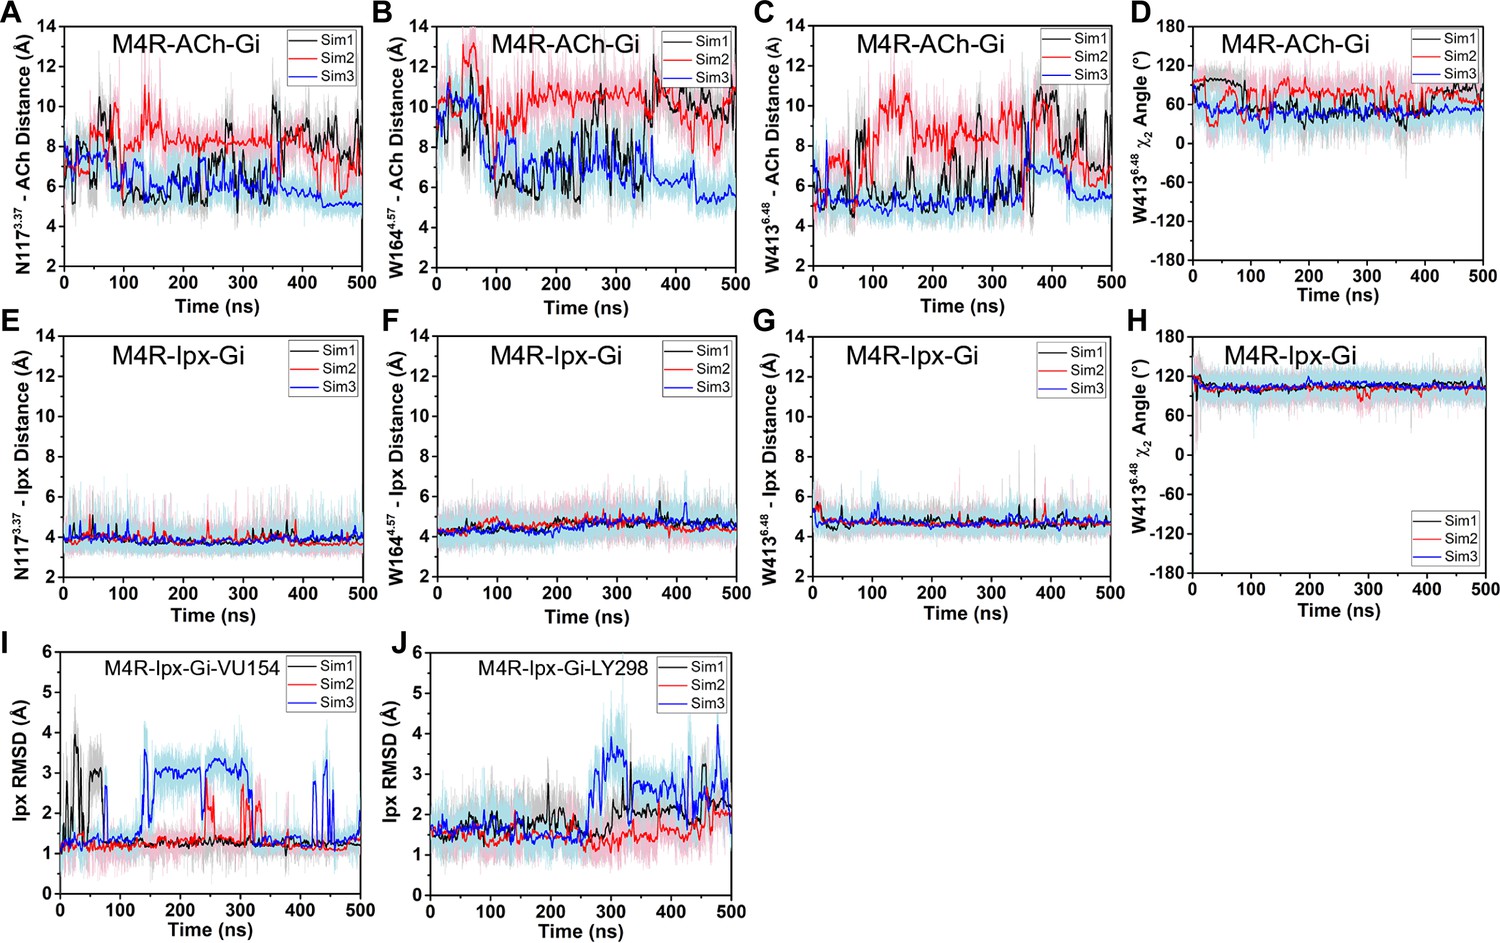
Interactions of acetylcholine (ACh) and iperoxo (Ipx) with the receptor measured during Gaussian accelerated molecular dynamics (GaMD) simulations.
(A–H) Time courses from GaMD simulations of the ACh- and Ipx- bound M4R-Gi1 cryo-electron microscopy (cryo-EM) structures, each performed with three separate replicates. Individual replicate simulations are illustrated with different colors. The heading of each plot refers to the specific model used in the simulations. The distances of interactions between ACh and Ipx with residues (A, E) N1173.37, (B, F) W1644.67, and (C, G) W4136.48, and (D, H) the χ2 angle of W4136.48. (I, J) Root mean square deviations (RMSDs) of Ipx from GaMD simulations of the PAM-Ipx-bound cryo-EM structures. See Table 3.
Figure 4 with 3 supplements
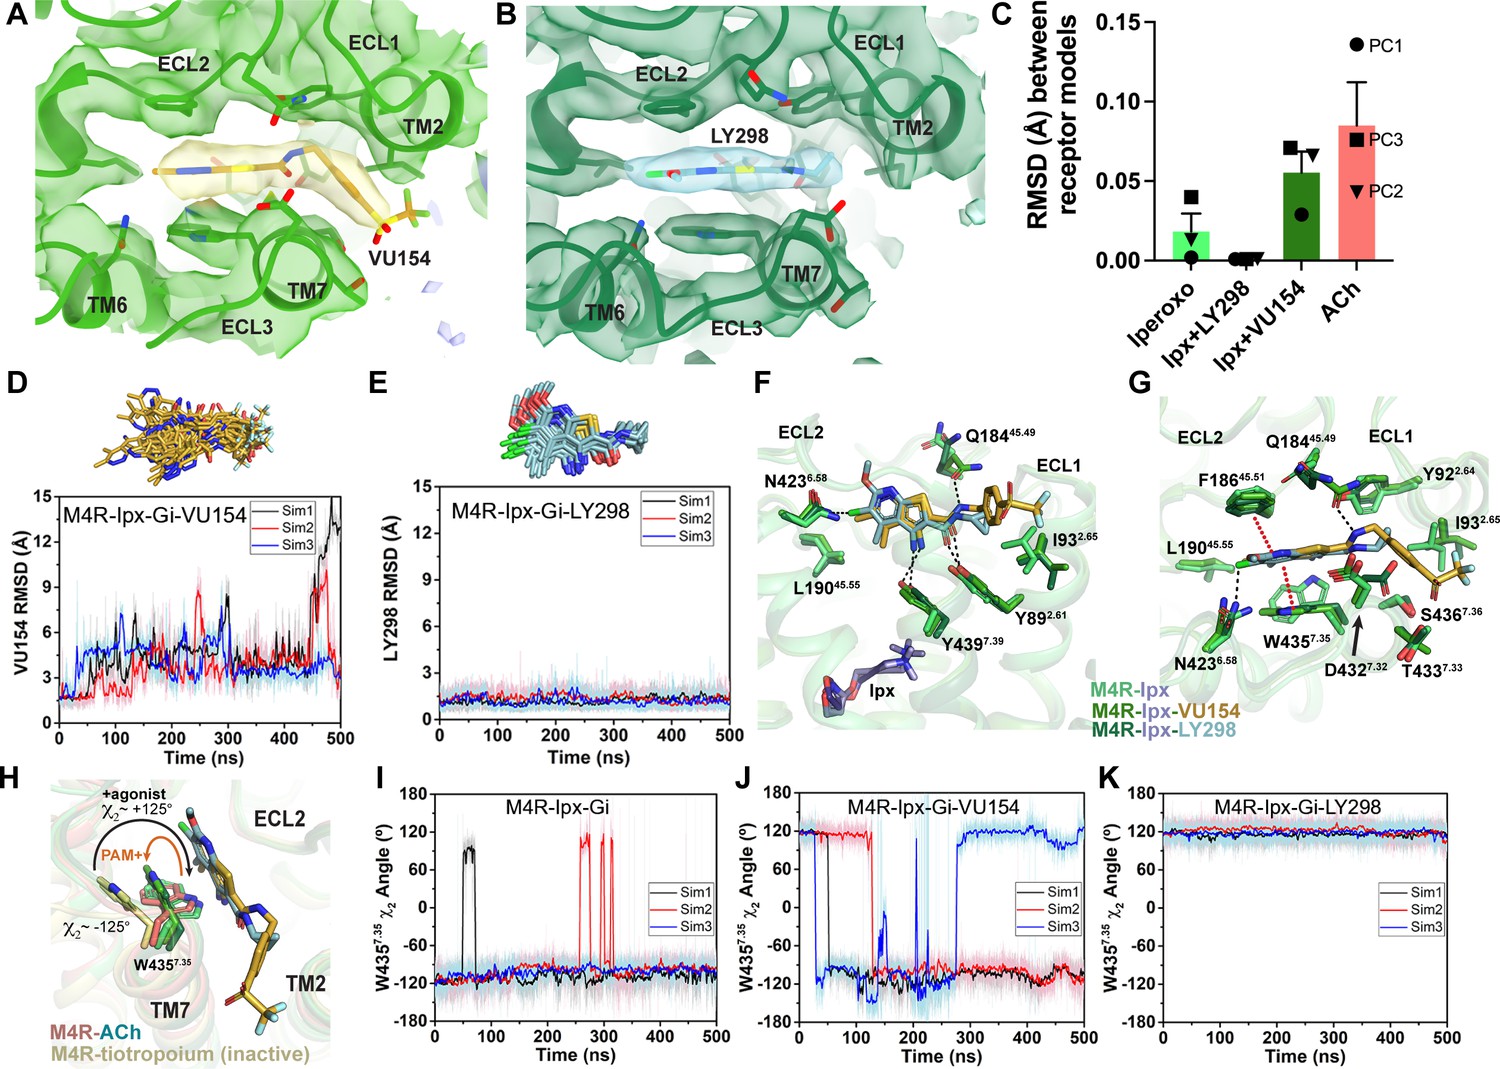
Binding and dynamics of LY298 and VU154.
(A, B) Cryo-electron microscopy (cryo-EM) density of the (A) VU154- and (B) LY298-binding sites. (C) The root mean square deviations (RMSDs) between receptor models of the respective cryo-EM structures that were refined into the first and last frames of the EM maps from each principal component (PC1-PC3) of the 3D variability analysis. Values shown are mean ± SEM. (D, E) Top representative binding conformations of (D) VU154 and (E) LY298 obtained from structural clustering with frame populations ≥1% and time courses of the RMSDs of each positive allosteric modulator (PAM) relative to the cryo-EM structures. (F, G) Binding interactions of VU154 and LY298 with views from the (F) membrane and (G) extracellular surface. (H) Position and χ2 angle of W4357.35 in the tiotropium-, ACh-, Ipx-, VU154-Ipx-, and LY298-Ipx bound structures. (I–K) Time courses of the W4357.35 χ2 angle obtained from Gaussian accelerated molecular dynamics (GaMD) simulations on the (I) Ipx-, (J) VU154-Ipx-, and (K) LY298-Ipx-bound cryo-EM structures. See Table 3.
Figure 4—figure supplement 1
Gaussian accelerated molecular dynamics (GaMD) simulations of LY293 and VU154 binding.
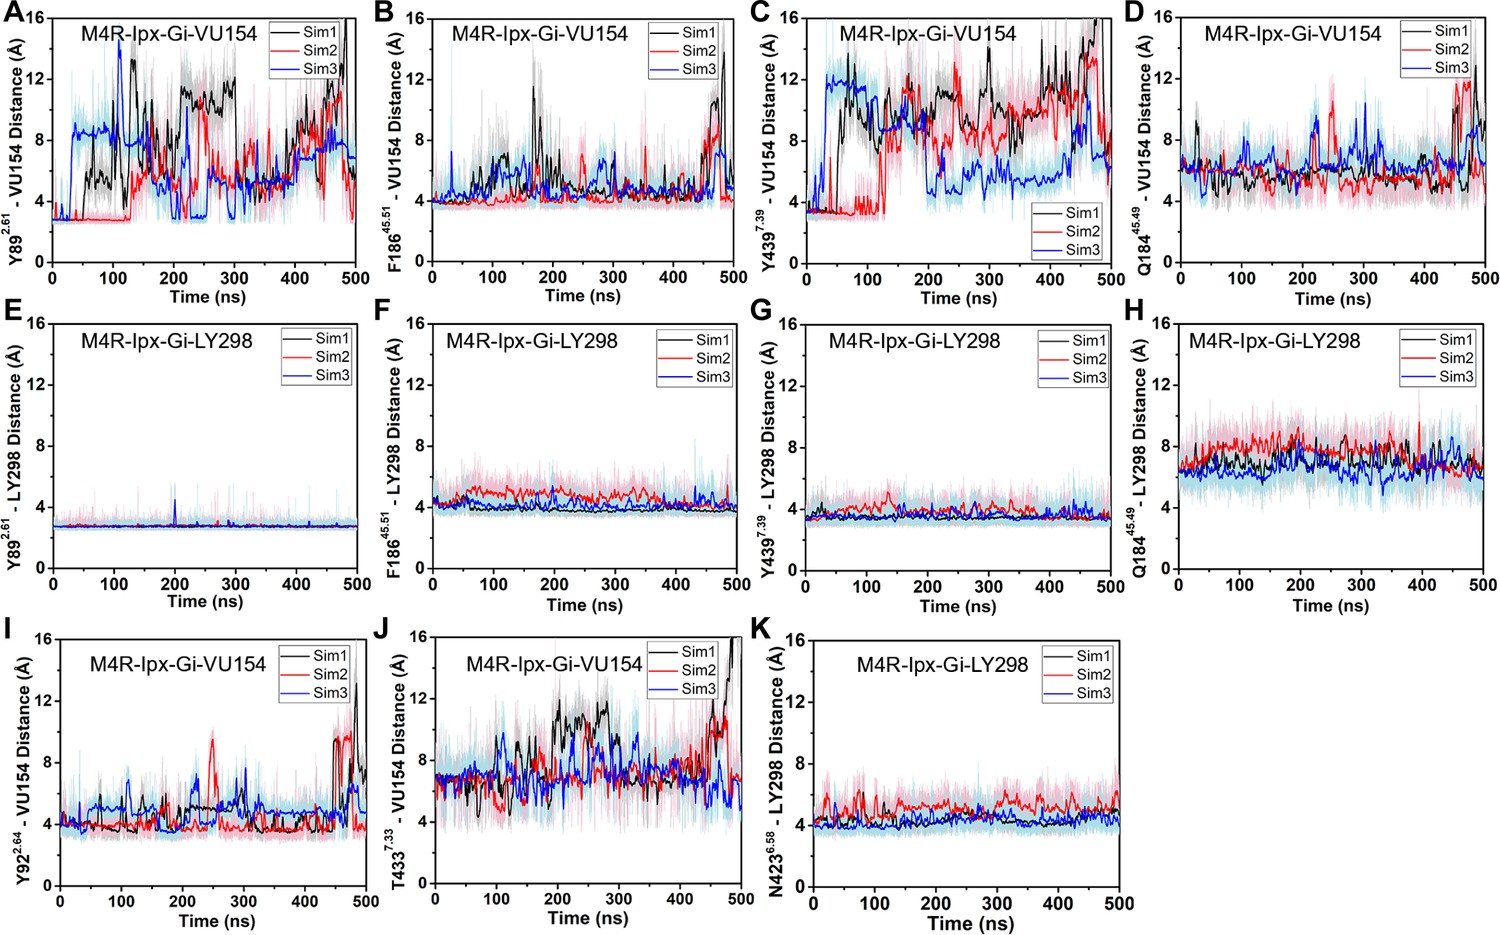
(A–K) Time courses from three 500 ns GaMD simulations using the (A–D) VU154-Ipx- and (E–H) LY298-Ipx-bound cryo-electron microscopy (cryo-EM) structures. Distances between the interactions of VU154 and LY298 with residues (A, E) Y897.39, (B, F) F18645.51, (C, G) Y4397.39, and (D, H) Q18445.49. (I, J) Distance between (I) Y922.64 and (J) T4337.33 to VU154 from GaMD simulations of the VU154-Ipx-M4R-Gi1 structure. (K) Distance between N4236.58 and the fluorine atom of LY298 from GaMD simulations of the LY298-Ipx-M4R-Gi1 structure. See Table 3.
Figure 4—figure supplement 2
Key residues for the binding of LY298 and VU154 at the human M4 muscarinic acetylcholine receptor (mAChR).
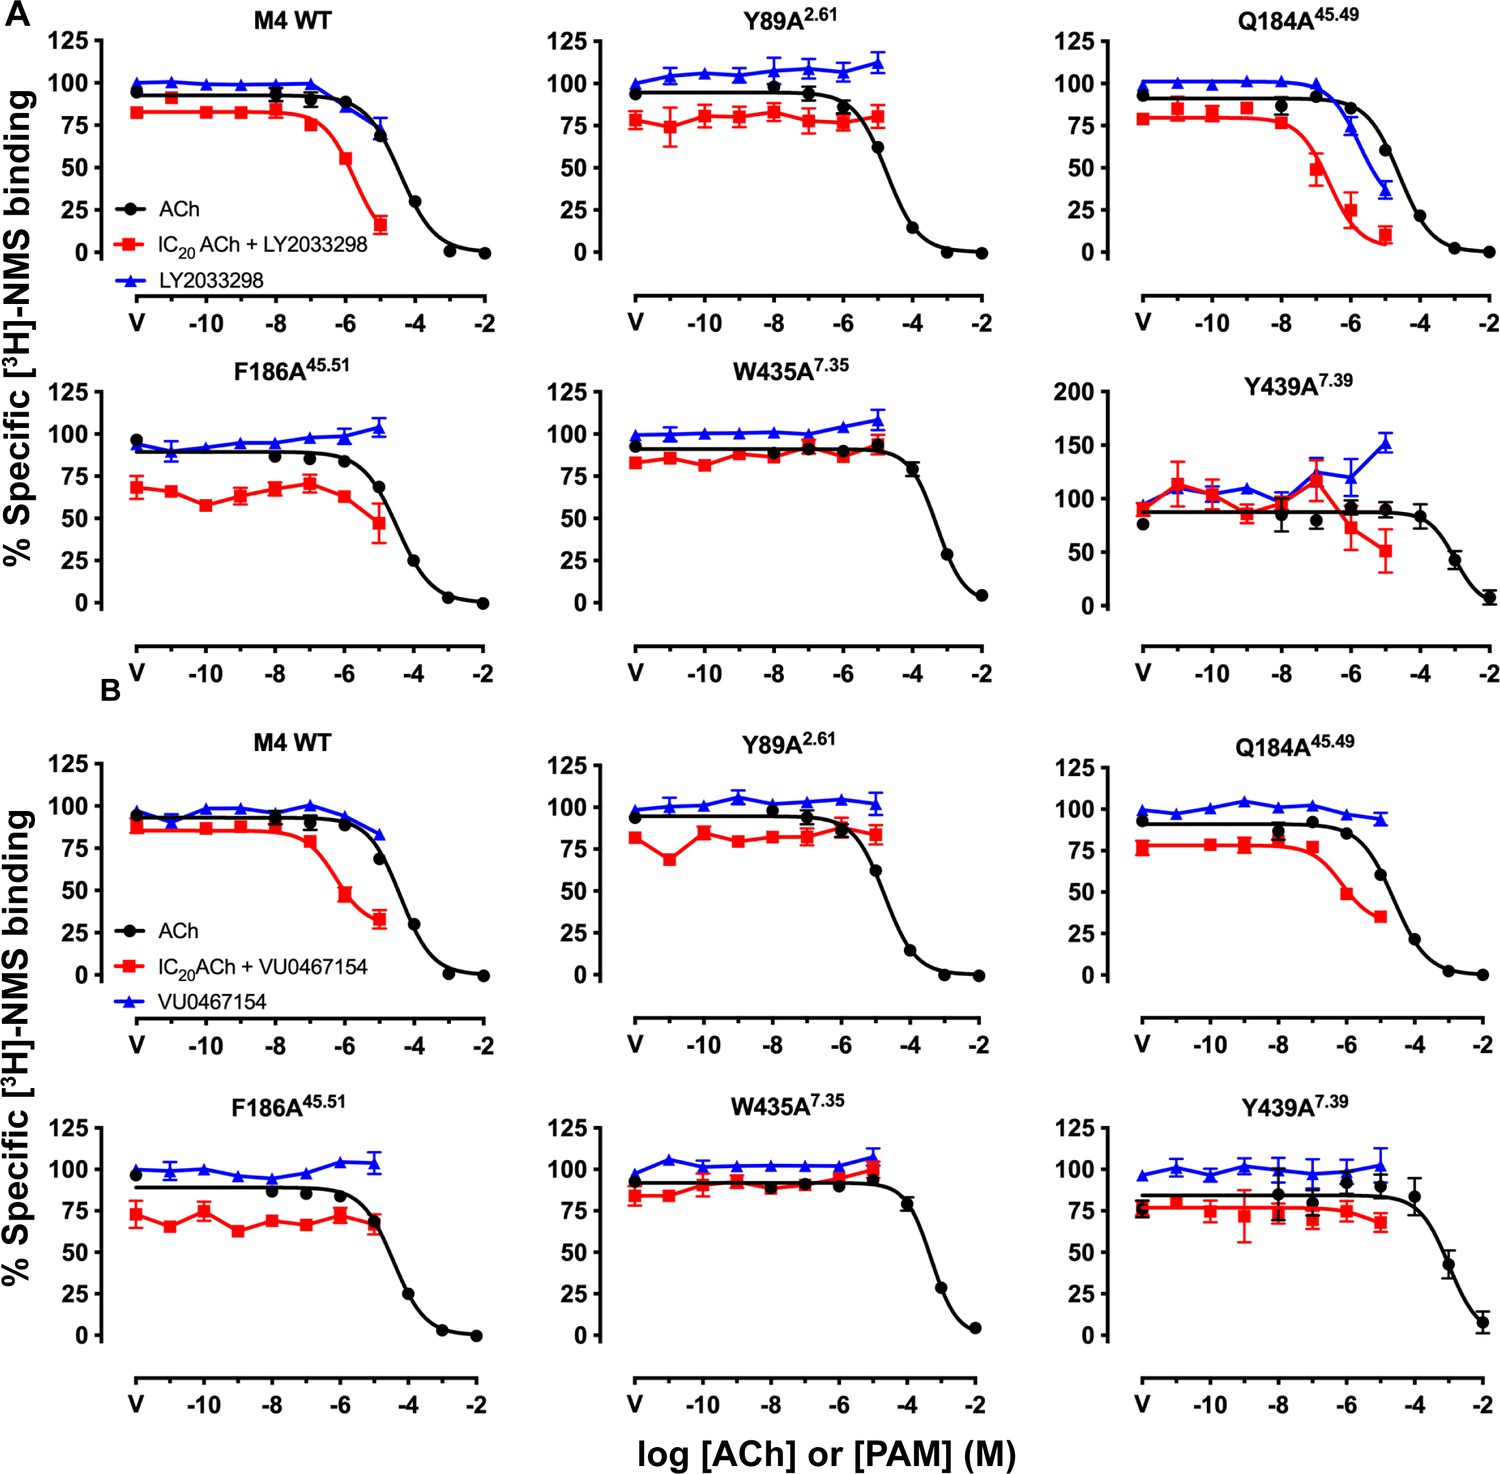
(A, B) Competition binding with a fixed concentration of [3H]-NMS and increasing concentrations of acetylcholine (ACh) (black circles), (A) LY298 or (B) VU154 (blue circles), and LY298 or VU154 in the presence of an IC20 concentration of ACh (red squares). Curves drawn through the points represent a global fit of an extended ternary complex model. Data points represent the mean ± SEM of three or more independent experiments performed in duplicate. Similar data were observed for competition binding with iperoxo (Ipx) instead of ACh. See Table 4.
-
Figure 4—figure supplement 2—source data 1
Related to Figure 4—figure supplement 2.
- https://cdn.elifesciences.org/articles/83477/elife-83477-fig4-figsupp2-data1-v1.xlsx
Figure 4—figure supplement 3
Gaussian accelerated molecular dynamics (GaMD) simulations of M4R complexes with acetylcholine (ACh).
(A–L) Time courses from GaMD simulations, each performed with three separate replicates. Individual replicate simulations are illustrated with different colors. The heading of each plot refers to the specific model used in the simulations. See Table 3. (A–C) Root mean square deviations (RMSDs) of ACh from simulations of the (A) cryo-electron microscopy (cryo-EM) structure or (B, C) positive allosteric modulator (PAM) docked models. (D, E) RMSDs of VU154 and LY298 from the ACh-bound M4 mAChR simulations. (F) Bar graph of the root mean fluctuations of the agonists iperoxo (Ipx) or ACh across the GaMD simulations of the M4-Gi1 complexes with or without the PAMs. Values shown are mean ± SEM, n = 3. (G–L) Time course of the ACh-bound M4-Gi1 simulations illustrating variances in the (G–I) W4357.35 χ2 angle and (J–L) the W4136.48 χ2 angle.
Figure 5
Structural and dynamic insights into orthosteric and allosteric agonism.
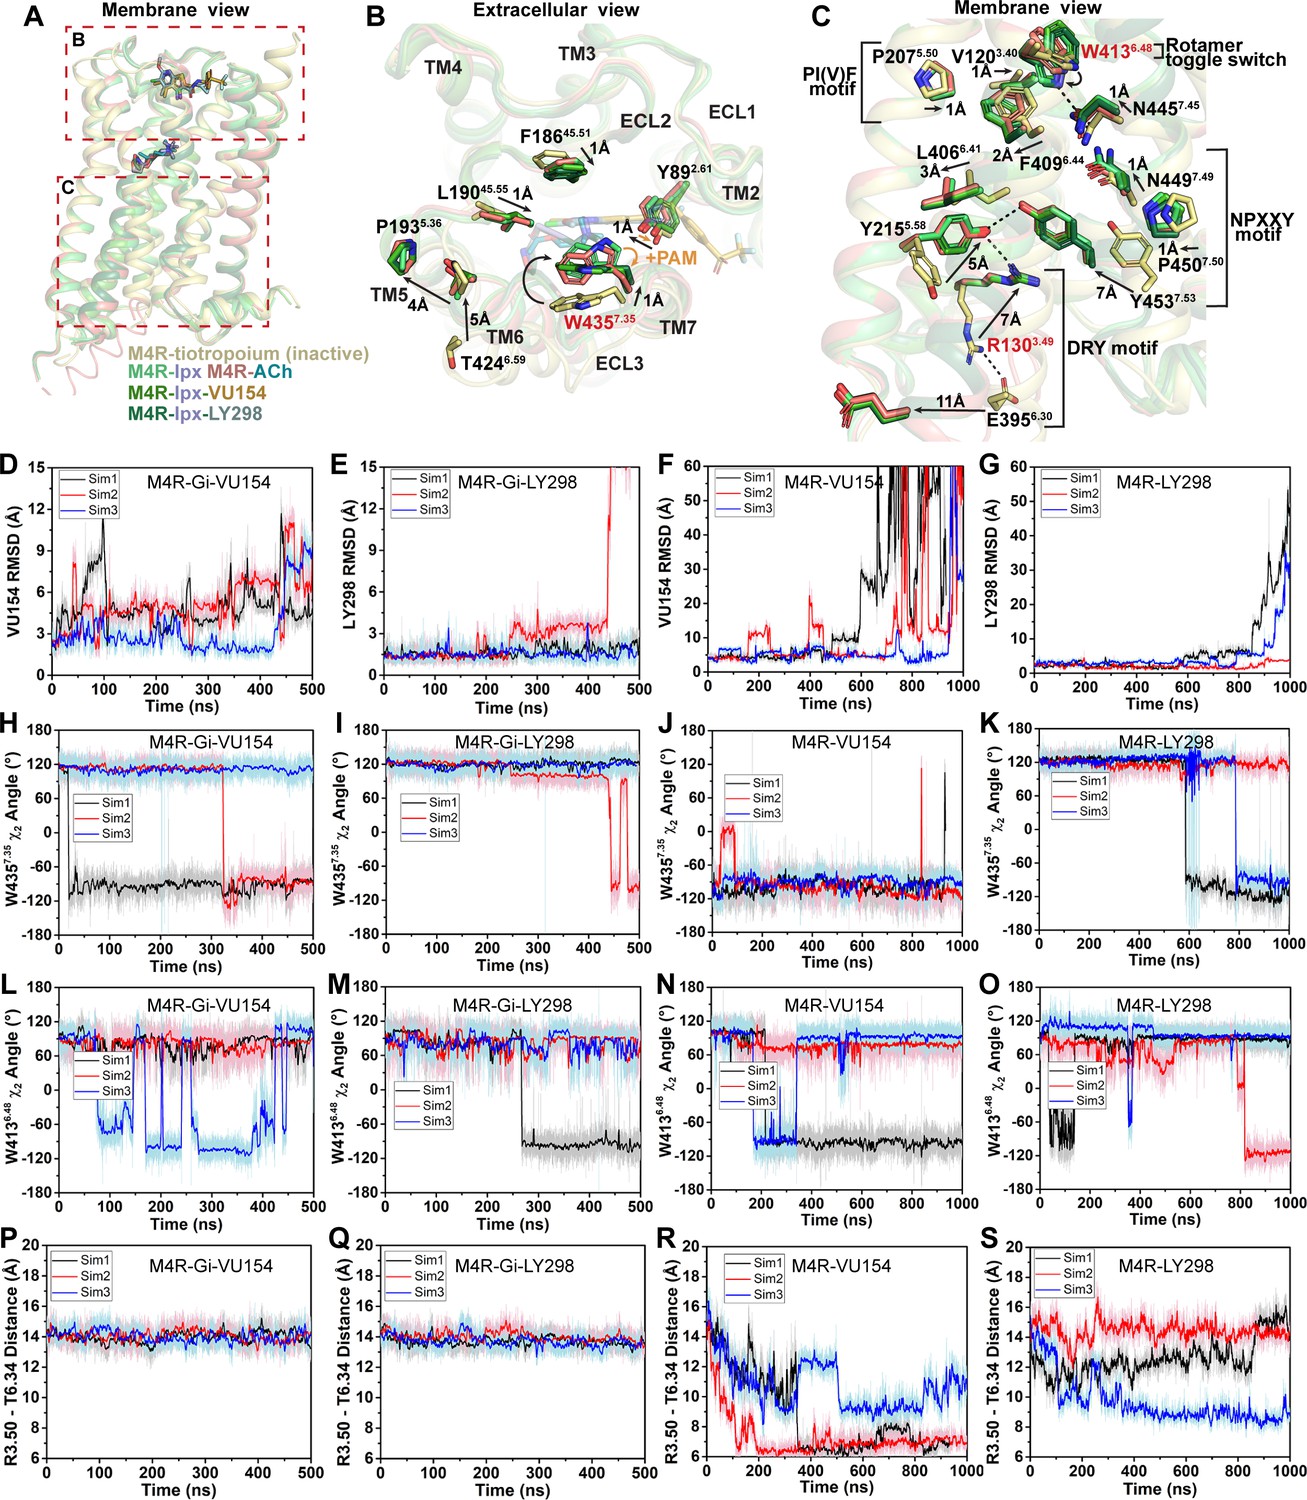
(A) Cartoon of the receptor models indicating regions of interest for panels (B, C) shown within the red boxes. (B) View of the tiotropium-bound, agonist-bound, and positive allosteric modulator (PAM)-agonist-bound conformations from the extracellular surface. (C) Membrane view of residues and activation motifs involved in signaling. Residues colored red in (B, C) indicate residues of investigated in Gaussian accelerated molecular dynamics (GaMD) simulations. (D–G) Time course of the root mean square deviations (RMSDs) of the PAMs (D, E) from GaMD simulations of the M4R bound to G protein and no orthosteric agonist, (F, G) and in the absence of both G protein and agonist. (H–K) Similar to (D–G) the time courses of (H–K) the W4357.35 χ2 angle, (L–O) the W4136.48 χ2 angle, and (P–S) the TM3-TM6 distance measured by distance between R1303.50 and T3996.34. See Table 3.
Figure 6 with 2 supplements
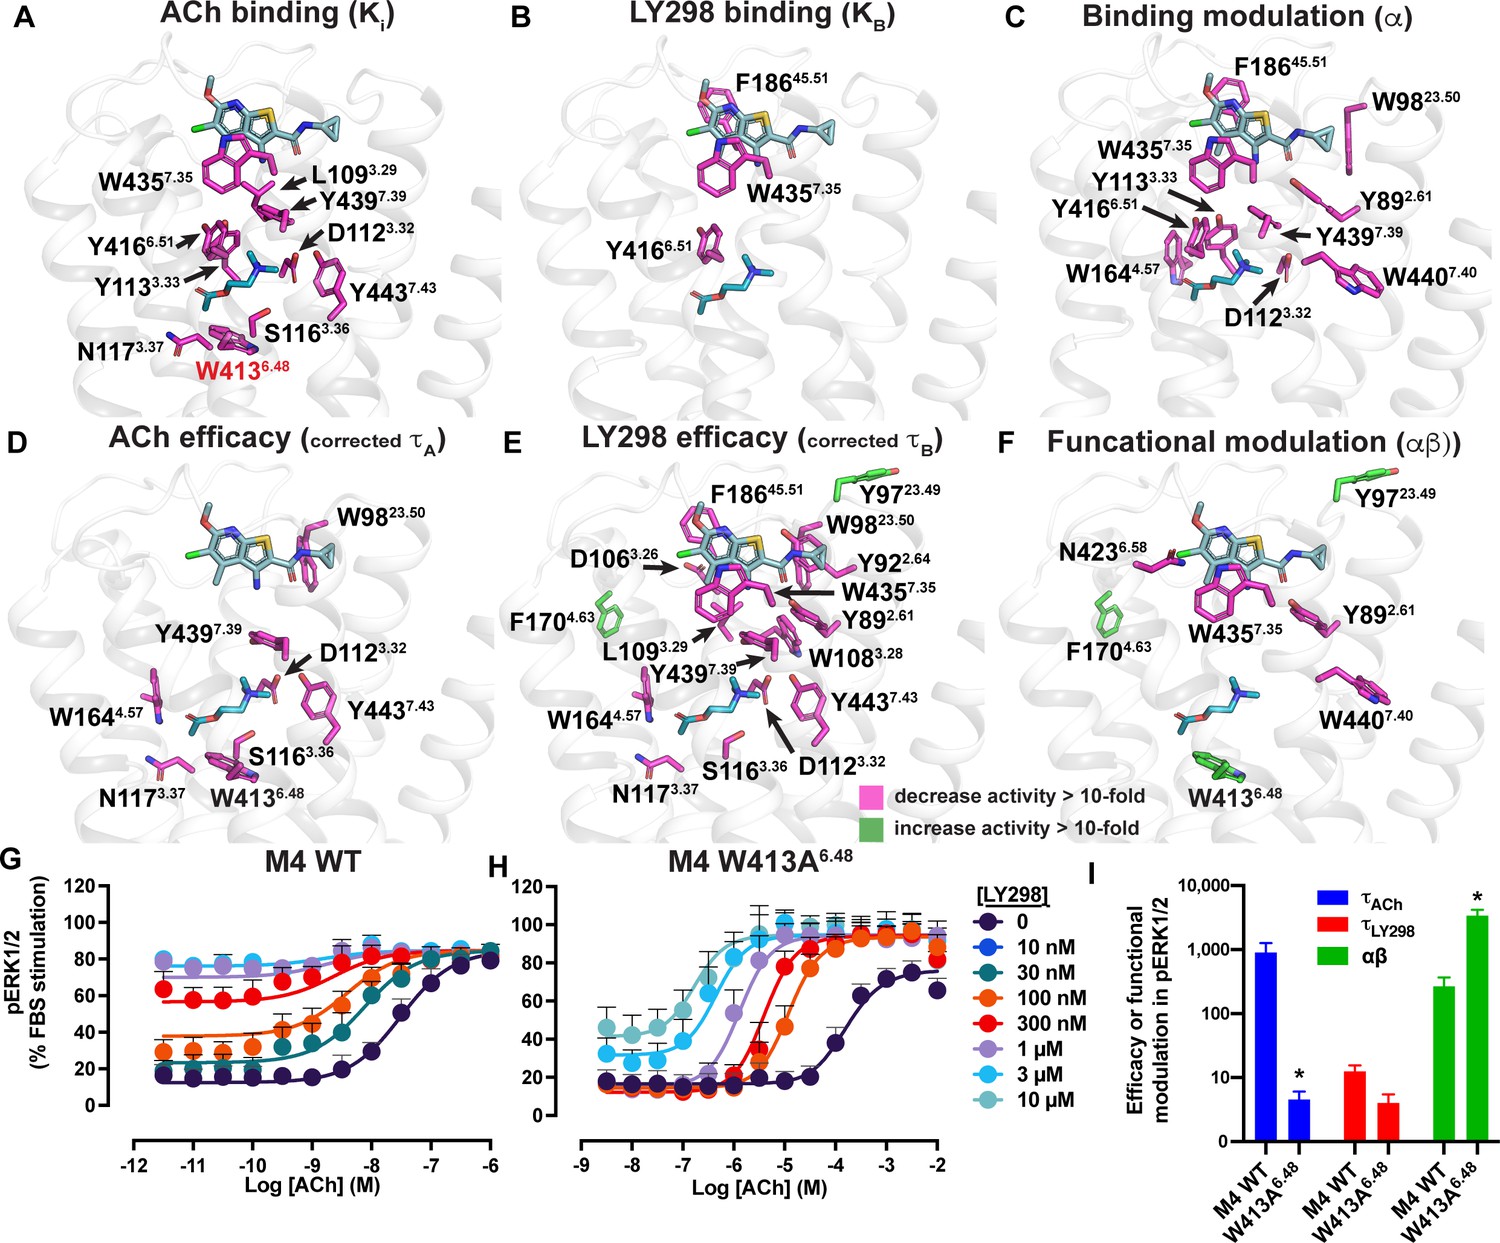
Residues involved in binding, agonism, and modulation of acetylcholine (ACh) and LY298.
(A–F) M4 muscarinic acetylcholine receptor (mAChR) alanine point mutations that increase (green colored sticks) or decrease (pink colored sticks) (A) ACh binding, (B) LY298 binding, (C) binding modulation between ACh and LY298, (D) ACh efficacy, (E) LY298 efficacy, (F) and functional modulation by values more than tenfold. Efficacy values are corrected for receptor expression (Gregory et al., 2010) using receptor expression data from Thal et al., 2016. Quantitative data used to identify key residues are from both the current study and previous studies as summarized in Table 5 (Leach et al., 2011; Nawaratne et al., 2010; Thal et al., 2016). (G–I) pERK1/2 concentration response curves for interaction of ACh and LY298 at (G) WT and (H) W413A6.48 M4 mAChR with (I) values of efficacy and functional modulation. *Indicates statistical significance (p<0.05) relative to WT as determined by a one-way ANOVA with a Dunnett’s post-hoc test that includes the other M4 mAChR mutants. Data shown are mean ± SEM from three or more experiments performed in duplicate with the pharmacological parameters determined from a global fit of the data.
Figure 6—figure supplement 1
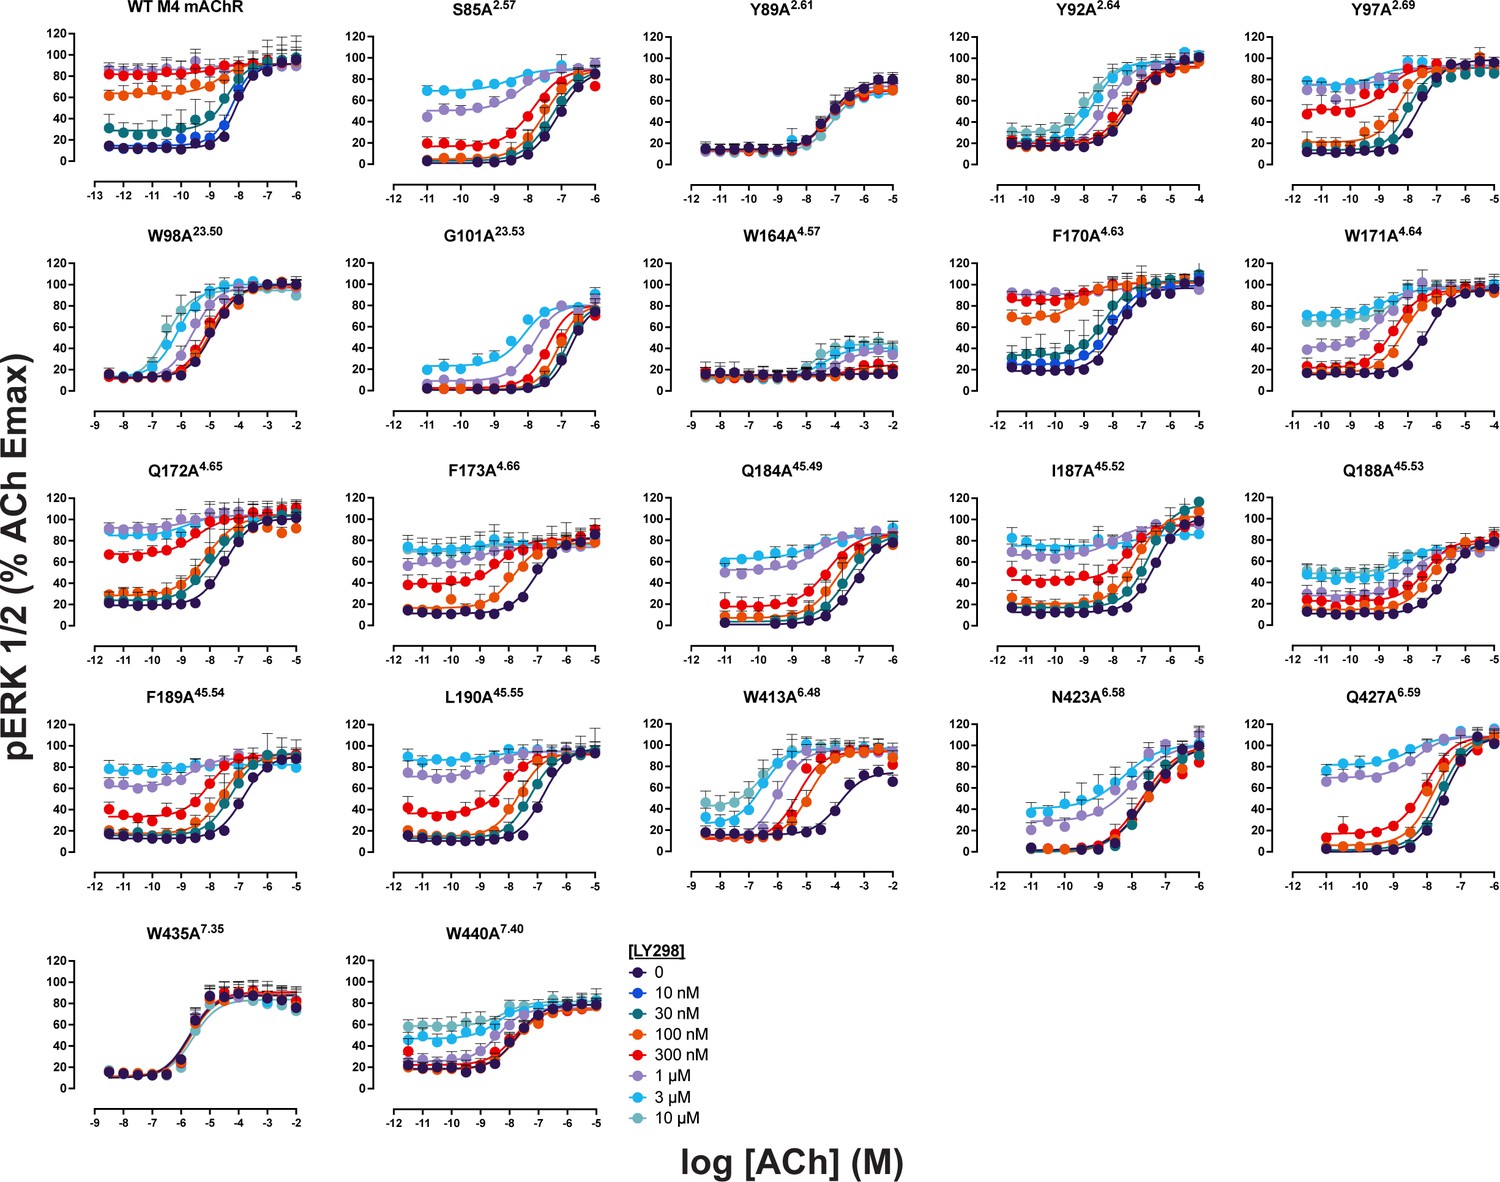
Concentration–response curves between acetylcholine (ACh) and LY298 at M4 muscarinic acetylcholine receptor (mAChR) mutants.
Concentration–response curves of an interaction between ACh and LY298 in pERK1/2 at the WT human M4 mAChR and mutants characterized in this study. Parameters of curve fits are in Table 5. Data are the mean ± SEM from three or more experiments performed in duplicate with the pharmacological parameters determined from a global fit of the data.
Figure 6—figure supplement 2
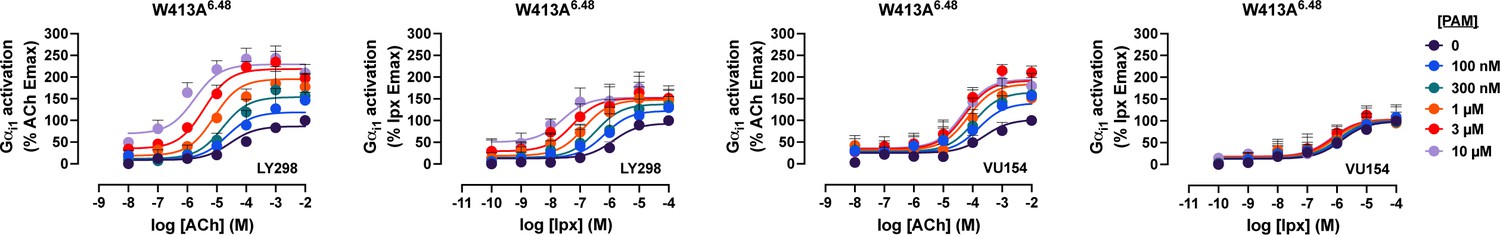
Interaction assays of agonists and positive allosteric modulators (PAMs) at the W413A6.48 M4 muscarinic acetylcholine receptor (mAChR) in a TruPath assay.
Concentration–response curves of an interaction between the agonists acetylcholine (ACh) or iperoxo (Ipx) with the PAMs LY298 or VU154 at the W413A6.48 M4 mAChR in a TruPath assay. Parameters of curve fits are in Table 5. Data are the mean ± SEM from three or more experiments performed in duplicate with the pharmacological parameters determined from a global fit of the data.
Figure 7 with 3 supplements
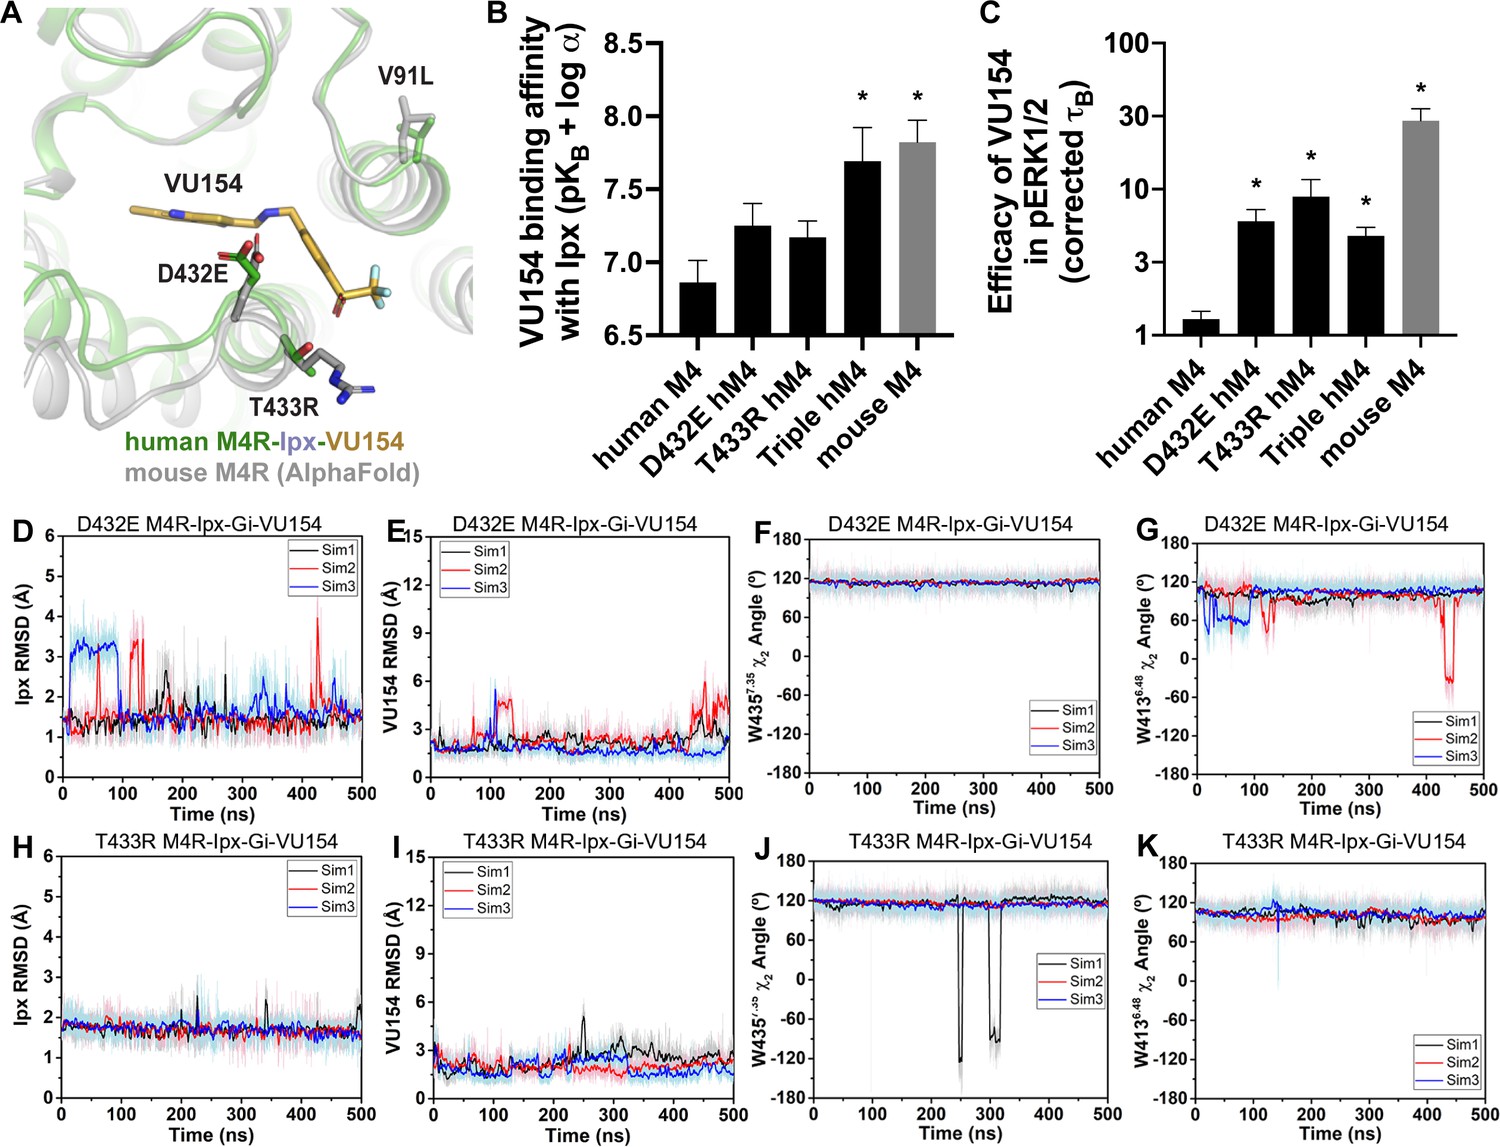
A molecular mechanism for the species selectivity for VU154.
(A) Comparison of the cryo-electron microscopy (cryo-EM) structure of the human M4 muscarinic acetylcholine receptor (mAChR) bound to Ipx-VU154 with the AlphaFold model of the mouse M4 mAChR (Jumper et al., 2021; Varadi et al., 2022). The three residues that differ between species and within the core 7TM bundle from the human receptor (V91, D432, and T433) are shown as sticks along with the corresponding residues from the mouse receptor. (B) The binding affinity of VU154 for the Ipx-bound conformation (pKB-Ipx = pKB + α) determined from [3H]-NMS binding experiments. Values calculated with data from Figure 7—figure supplement 1 with propagated error. (C) Efficacy of VU154 (τB – corrected for receptor expression) of pERK1/2 signaling from data in Figure 7—figure supplement 2. (D–K) Time courses of obtained from Gaussian accelerated molecular dynamics (GaMD) simulations of the (D–G) D432E and (H–K) T433R mutant M4R-Ipx-Gi1-VU154 systems with (D, H) Ipx RMSDs, (E, I), VU154 root mean square deviations (RMSDs), (F, J) W4357.35 χ2 angle, and (G, K) W4136.48 χ2 angle. Data shown are mean ± SEM from three or more experiments performed in duplicate with the pharmacological parameters determined from a global fit of the data. *Indicates statistical significance (p<0.05) relative to WT as determined by a one-way ANOVA with a Dunnett’s post-hoc test.
-
Figure 7—source data 1
Related to Figure 7.
- https://cdn.elifesciences.org/articles/83477/elife-83477-fig7-data1-v1.xlsx
Figure 7—figure supplement 1
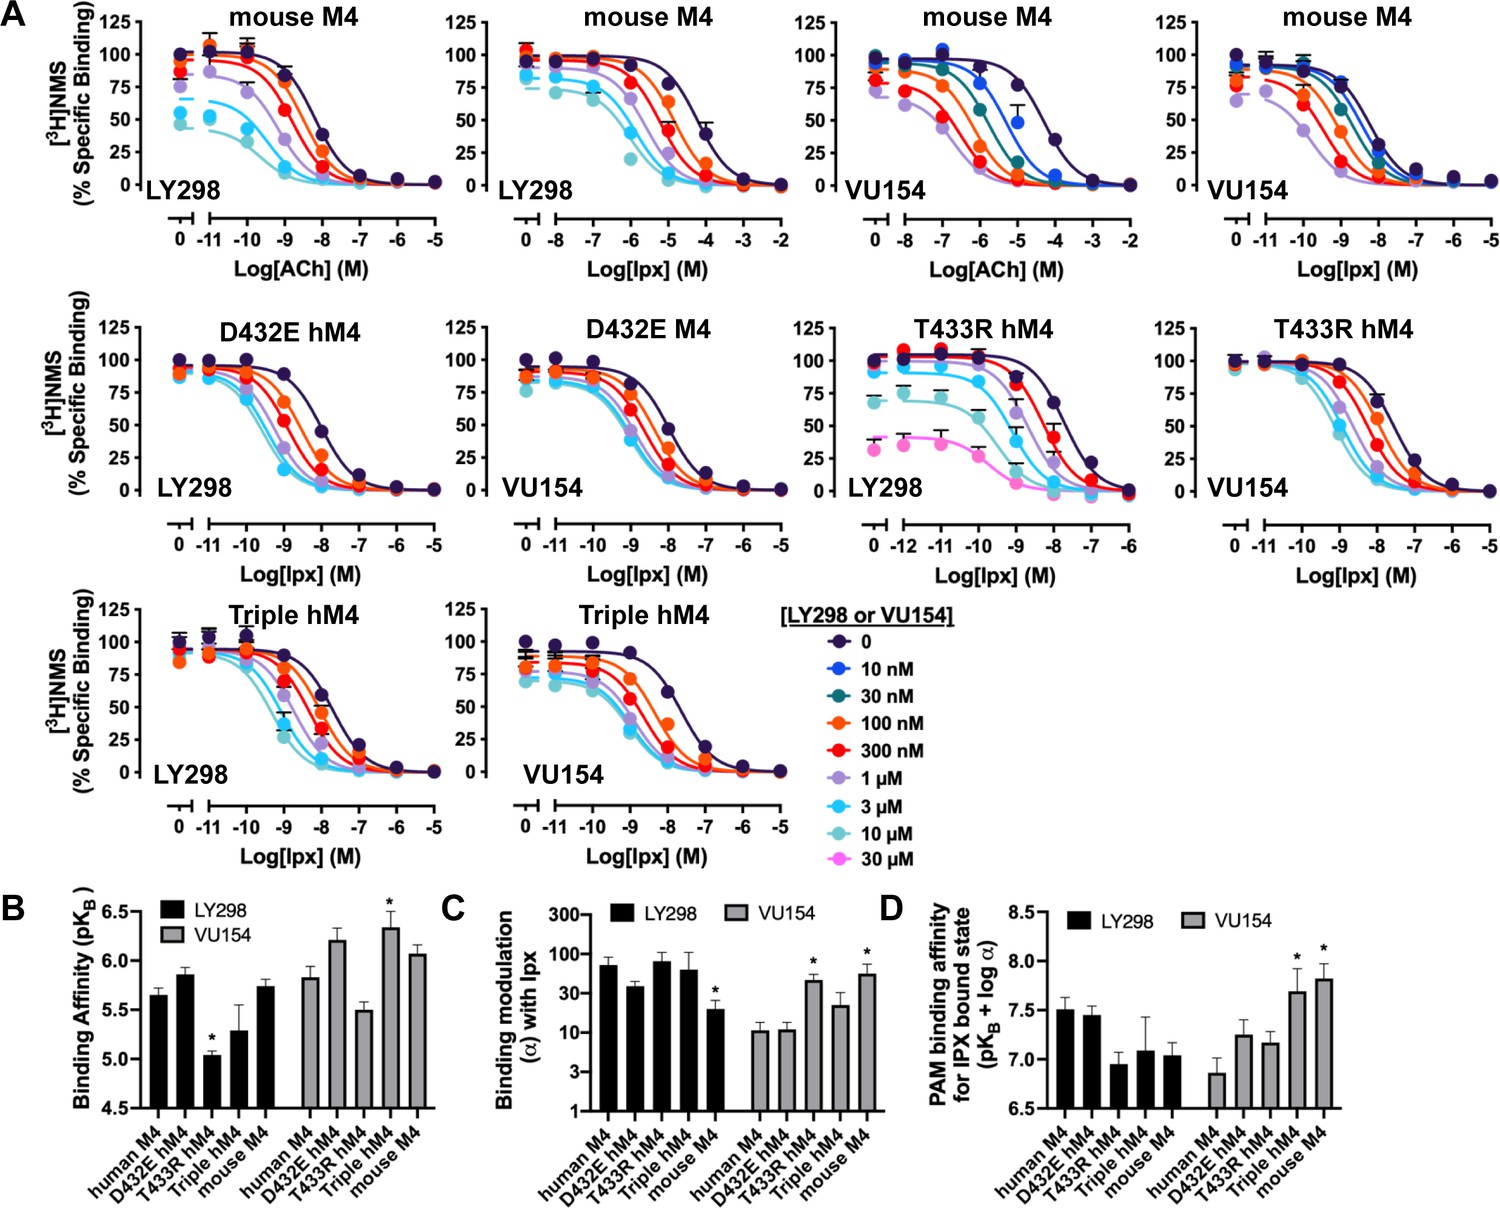
Binding parameters of positive allosteric modulators (PAMs) at the human and mouse M4 muscarinic acetylcholine receptors (mAChRs).
(A) Concentration–response curves of the orthosteric and allosteric ligands in [3H]-NMS binding assays at the mouse M4 mAChR, D432E, T433R, and the V91L, D432E, T433R triple mutant of the human M4 mAChR. (B–D) Quantification of data from (A) to calculate (B) equilibrium binding affinities (pKB) of the PAMs, (C) the degree of binding modulation (α) between iperoxo (Ipx) and PAMs, and the modified affinities (D) α/KB. See Table 1. All data are mean ± SEM of three or more independent experiments performed in duplicate or triplicate with the pharmacological parameters determined from a global fit of the data. The error in (D) was propagated using the square root of the sum of the squares. *Indicates statistical significance (p<0.05) relative to WT as determined by a one-way ANOVA with a Dunnett’s post-hoc test.
-
Figure 7—figure supplement 1—source data 1
Related to Figure 7—figure supplement 1.
- https://cdn.elifesciences.org/articles/83477/elife-83477-fig7-figsupp1-data1-v1.xlsx
Figure 7—figure supplement 2
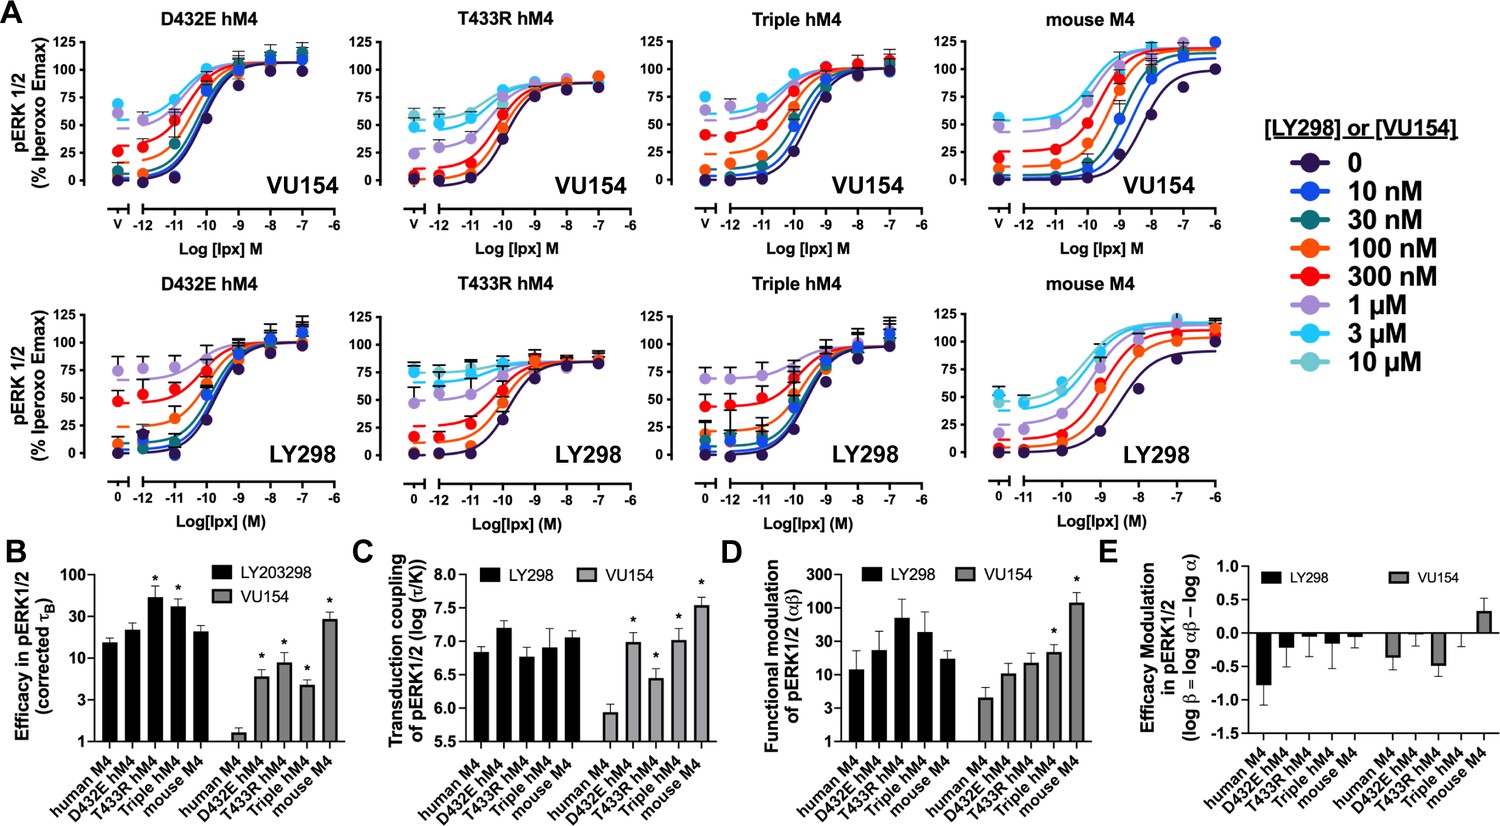
Functional parameters of the positive allosteric modulators (PAMs) at the human and mouse M4 muscarinic acetylcholine receptors (mAChRs) in pERK1/2 signaling assays.
(A) Concentration–response curves of an interaction between iperoxo (Ipx) and the PAMS VU154 and LY298 in pERK1/2 at the mouse M4 mAChR, D432E, T433R, and the V91L, D432E, T433R triple mutant of the human M4 mAChR. (B–E) Quantification of data from (A) to calculate (B) the signaling efficacy (τA and τB) and (C) the transduction coupling coefficients (log (τ/K)) of each ligand, (D) the functional cooperativity (αβ) between ligands, and (E) the efficacy modulation (β) between ligands. See Table 1.
-
Figure 7—figure supplement 2—source data 1
Related to Figure 7—figure supplement 2.
- https://cdn.elifesciences.org/articles/83477/elife-83477-fig7-figsupp2-data1-v1.xlsx
Figure 7—figure supplement 3
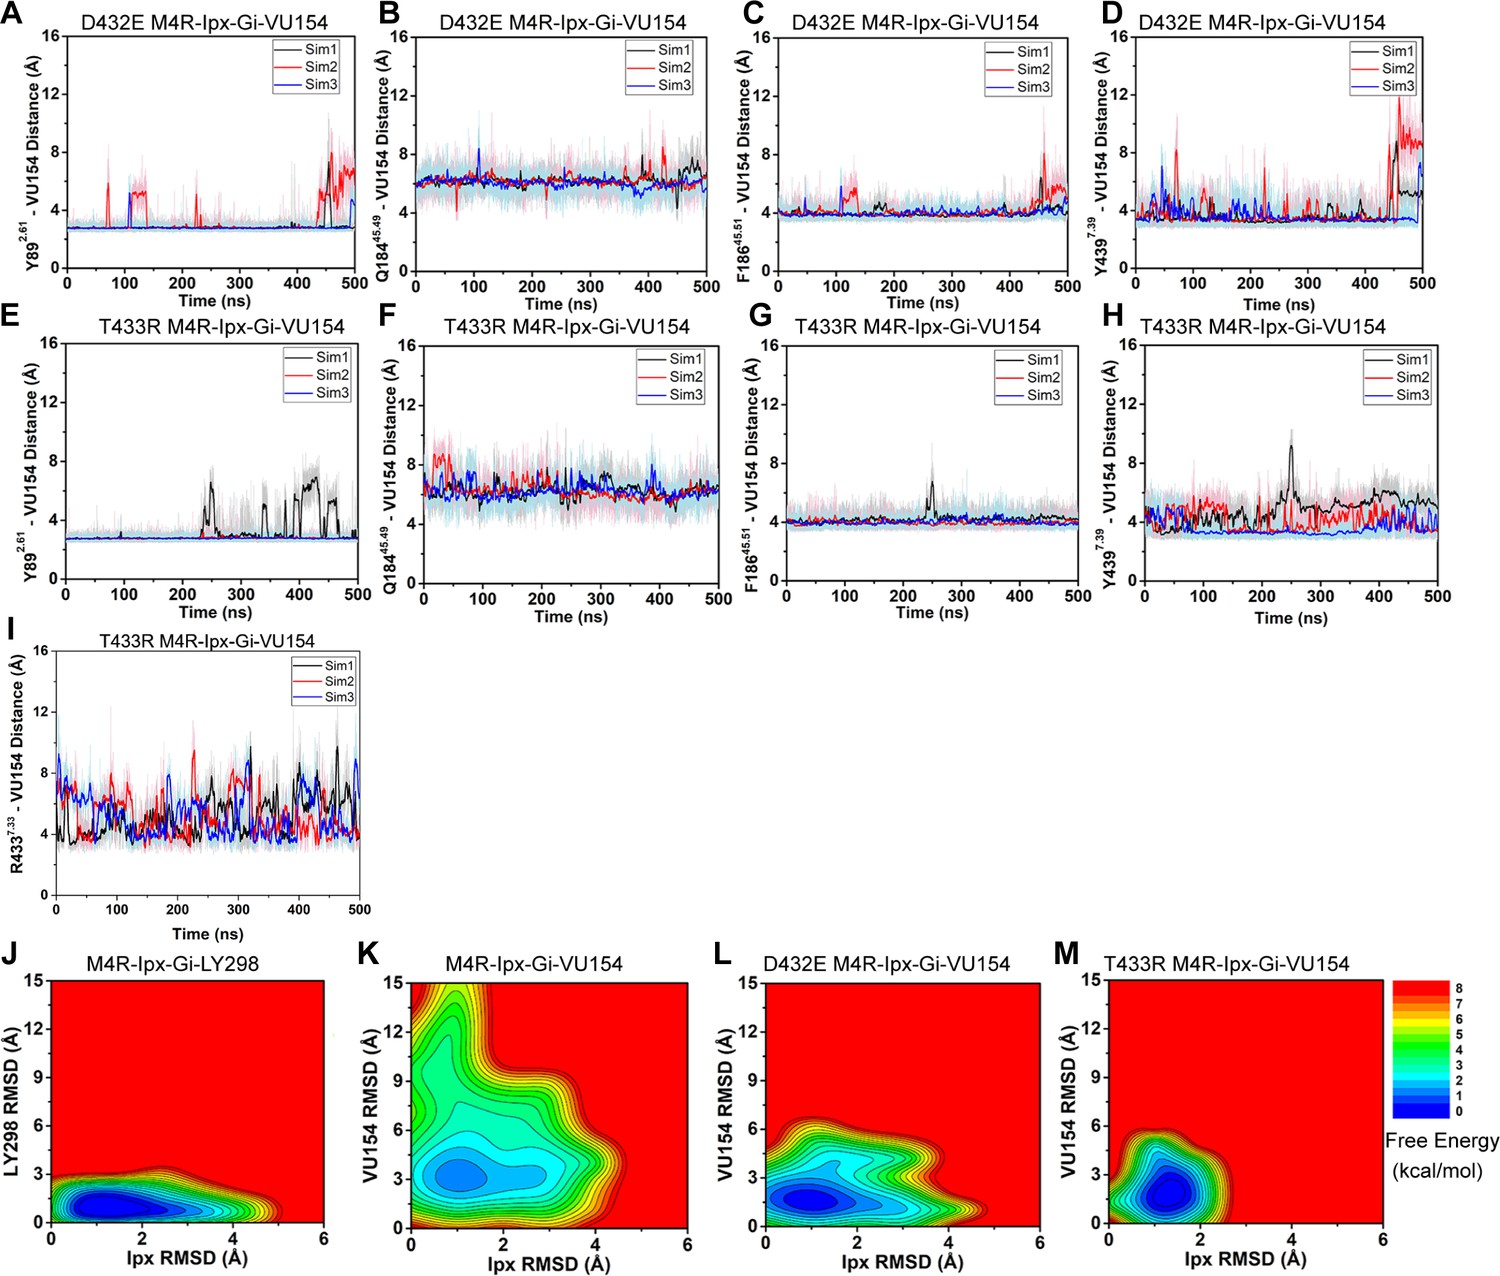
Gaussian accelerated molecular dynamics (GaMD) simulations of D432E and T433R human M4 muscarinic acetylcholine receptor (mAChR) mutants.
(A–H) Time courses obtained from GaMD simulations of the (A–D) D432E and (E–H) T433R mutant M4R-Ipx-Gi1-VU154 systems with (A, E) Y892.61 – VU154 distance, (B, F) Q18445.49 – VU154 distance, (C, G) F18645.51 – VU154 distance, and (D, H) Y4397.39 – VU154 distance. with residues (A, E) Y897.39, (B, F) F18645.51, (C, G) Y4397.39, and (D, H) Q18445.49. (I) Distance between R4337.33 to the sulfoxide group of VU154 from GaMD simulations of the T433R M4R-Ipx-Gi1-VU154 mutant. (J–M) 2D free energy profile of the root mean square deviations (RMSDs) of LY298 and VU154 with Ipx. See Table 3.
Figure 8
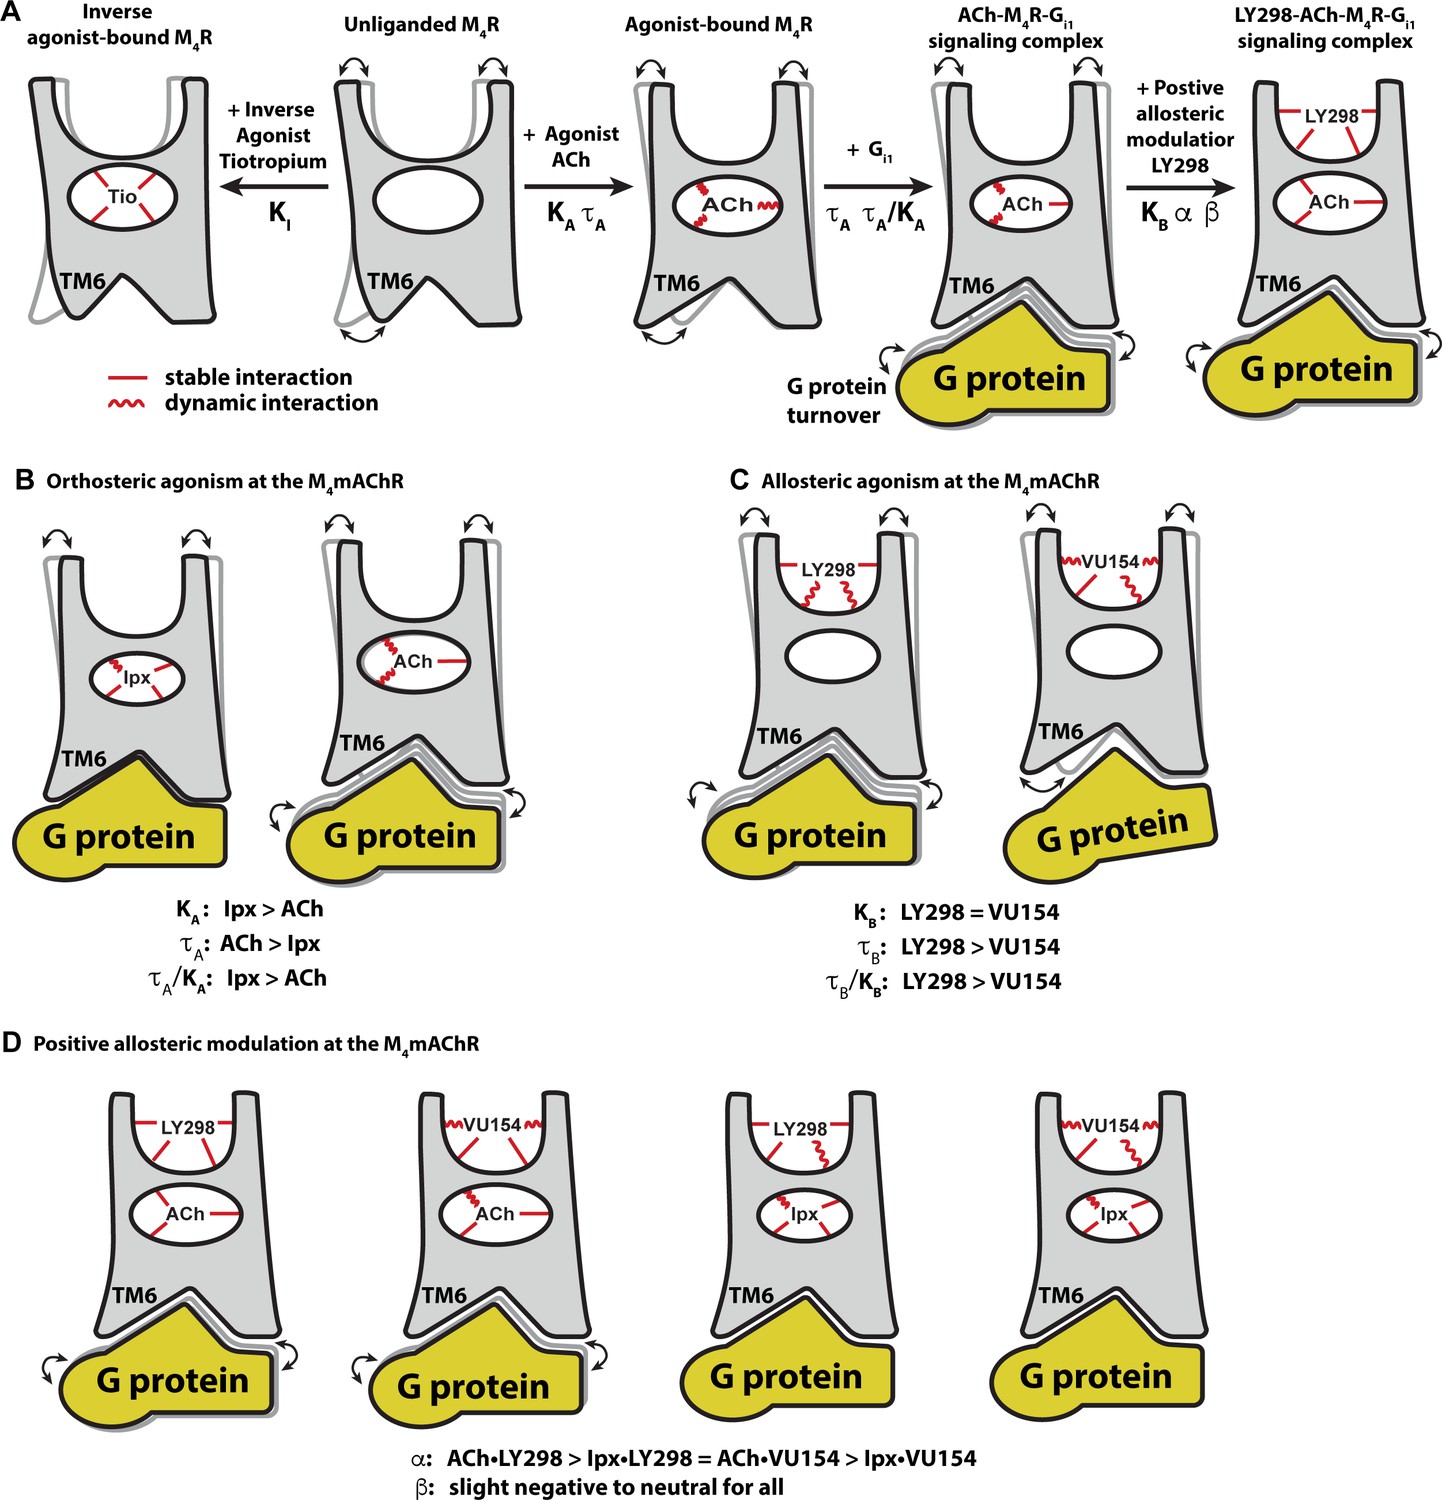
Conformational dynamics of the allostery at M4 muscarinic acetylcholine receptor (mAChR) signaling complexes.
(A) A schematic cartoon illustrating the conformational states of the ligands and the M4 mAChR when bound to different types of ligands and transducer, along with the resulting dynamic profiles. Pharmacological parameters related to each conformational change are shown. Stable ligand–receptor interactions are denoted by a straight line and less-stable (more dynamic) interactions are denoted by a wavy line. (B) Iperoxo (Ipx) bound the M4 mAChR with a higher affinity and more stability than ACh but had lower efficacy. ACh being more loosely bound and coupled to G protein may facilitate more G protein turnover accounting for its higher efficacy. (C) LY298 and VU154 bound to the M4 mAChR with similar affinity for the receptor, but LY298 was found to bind more stably. LY298 had a higher efficacy than VU154, suggesting that allosteric agonism at the M4 mAChR is mediated by stabilization of the extracellular vestibule (ECV). (D) The positive allosteric modulators (PAMs) LY298 and VU154 display robust binding modulation at the M4 mAChR with LY298 having a stronger allosteric effect. Both PAMs displayed stronger binding modulation with the agonist ACh versus Ipx, an example of probe dependence. Both PAMs also displayed a slight negative to neutral effect on the efficacy of the agonists, suggesting that their mechanism of action is largely through binding.
Videos
Video 1
Movie from one Ipx-M4R-Gi1 Gaussian accelerated molecular dynamics (GaMD) simulation.
Video 2
Movie from one ACh-M4R-Gi1 Gaussian accelerated molecular dynamics (GaMD) simulation.
Video 3
3D variability analysis of the Ipx-M4R-Gi1 cryo-electron microscopy (cryo-EM) structure.
Video 4
3D variability analysis of the ACh-M4R- Gi1 cryo-electron microscopy (cryo-EM) structure.
Video 5
3D variability analysis of the LY298-Ipx-M4R- Gi1 cryo-electron microscopy (cryo-EM) structure.
Video 6
3D variability analysis of the VU154-Ipx-M4R- Gi1 cryo-electron microscopy (cryo-EM) structure.
Video 7
Movie from one VU154-Ipx-M4R-Gi1 Gaussian accelerated molecular dynamics (GaMD) simulation.
Video 8
Movie from one LY298-Ipx-M4R-Gi1 Gaussian accelerated molecular dynamics (GaMD) simulation.
Video 9
Movie from one VU154-Ipx-M4R(D432E)-Gi1 Gaussian accelerated molecular dynamics (GaMD) simulation.
Video 10
Movie from one VU154-Ipx-M4R(T433R)-Gi1 Gaussian accelerated molecular dynamics (GaMD) simulation.
Tables
Table 1
Pharmacological parameters from radioligand binding and functional experiments.
| [3H]-NMS saturation binding on stable M4 mAChR CHO cells | |||||||
|---|---|---|---|---|---|---|---|
| Constructs | Sites per cell* | pKD† | |||||
| Human WT M4 mAChR | 598,111 ± 43,067 (7) | 9.76 ± 0.05 (7) | |||||
| Mouse WT M4 mAChR | 21,027 ± 2188 (3) | 9.76 ± 0.05 (3) | |||||
| Human D432E M4 mAChR | 126,377 ± 10,066 (3) | 9.60 ± 0.07 (3) | |||||
| Human T433R M4 mAChR | 157,442 ± 36,658 (6) | 9.64 ± 0.09 (6) | |||||
| Human V91L, D432E, T433R M4 mAChR | 205,771 ± 20,975 (4) | 9.58 ± 0.08 (4) | |||||
| [3H]-NMS interaction binding assays between ACh or Ipx and LY298 or VU154 on stable M4 mAChR constructs in Flp-In CHO cells | |||||||
| Constructs | PAM | pKi ACh ‡ | pKi Ipx ‡ | pKB PAM ‡ | log αACh § | log αIpx § | |
| Human WT M4 mAChR | LY298 | 4.50 ± 0.06 (4) | 8.30 ± 0.06 (4) | 5.65 ± 0.07 (8) ¶ | 2.59 ± 0.10 (4) | 1.86 ± 0.10 (4) | |
| VU154 | 4.40 ± 0.09 (4) | 8.19 ± 0.06 (8) | 5.83 ± 0.11 (12) ¶ | 1.61 ± 0.13 (4) | 1.03 ± 0.10 (8) | ||
| Mouse WT M4 mAChR | LY298 | 4.52 ± 0.07 (4) | 8.55 ± 0.06 (4) | 5.74 ± 0.07 (8) ¶ | 1.78 ± 0.10 (4) | 1.30 ± 0.11 (4)* | |
| VU154 | 4.59 ± 0.06 (4) | 8.57 ± 0.06 (3) | 6.07 ± 0.09 (7) ¶ | 2.43 ± 0.10 (4) | 1.75 ± 0.12 (3)* | ||
| Human D432E M4 mAChR | LY298 | N.T. | 8.28 ± 0.04 (5) | 5.86 ± 0.07 (5) | N.T. | 1.59 ± 0.06 (5) | |
| VU154 | N.T. | 8.27 ± 0.06 (6) | 6.21 ± 0.12 (6) | N.T. | 1.04 ± 0.09 (6) | ||
| Human T433R M4 mAChR | LY298 | N.T. | 8.05 ± 0.08 (5) | 5.04 ± 0.04 (5)* | N.T. | 1.91 ± 0.11 (5) | |
| VU154 | N.T. | 7.88 ± 0.04 (5) | 5.50 ± 0.08 (5) | N.T. | 1.67 ± 0.07 (5)* | ||
| Human V91L, D432E, T433R M4 mAChR | LY298 | N.T. | 7.95 ± 0.10 (4) | 5.29 ± 0.26 (4) | N.T. | 1.80 ± 0.22 (4) | |
| VU154 | N.T. | 7.89 ± 0.12 (4) | 6.34 ± 0.16 (4)* | N.T. | 1.35 ± 0.16 (4) | ||
| Gαi1 activation (TruPath) interaction assays between ACh or Ipx and LY298 or VU154 on transiently expressed M4 mAChR constructs in HEK293A cells | |||||||
| Constructs | PAM | log τ ACh** | log τ Ipx** | pKB PAM ‡ | log τ PAM** | log αβACh†† | log αβIpx†† |
| Human WT M4 mAChR | LY298 | 2.71 ± 0.14 (4) | 1.49 ± 0.12 (4) | = 5.65 | 1.02 ± 0.03 (8) ¶ | 2.01 ± 0.14 (4) | 1.96 ± 0.16 (4) |
| VU154 | = 5.83 | –0.55 ± 0.08 (8) ¶ | 1.22 ± 0.13 (4) | 0.20 ± 0.13 (4) | |||
| pERK1/2 interaction assays between ACh or Ipx and LY298 or VU154 on stable M4 mAChR constructs in Flp-In CHO cells | |||||||
| Constructs | PAM | log τ ACh** | log τ Ipx** | pKB PAM ‡ | log τC PAM ‡ ‡ | log αβACh†† | log αβIpx†† |
| Human WT M4 mAChR | LY298 | 3.27 ± 0.06 (8) ¶ | 1.74 ± 0.03 (16) ¶ | = 5.65 | 1.19 ± 0.05 (12)** | 2.29 ± 0.22 (4) | 1.08 ± 0.28 (8) |
| VU154 | = 5.83 | 0.11 ± 0.05 (12)** | 0.88 ± 0.23 (4) | 0.66 ± 0.15 (8) | |||
| Mouse WT M4 mAChR | LY298 | N.T. | N.D. | = 5.74 | 1.32 ± 0.07 (5) | N.T. | 1.24 ± 0.12 (4) |
| VU154 | N.T. | N.D. | = 6.07 | 1.47 ± 0.08 (5) § § | N.T. | 2.08 ± 0.15 (5) § § | |
| Human D432E M4 mAChR | LY298 | N.T. | N.D. | = 5.86 | 1.34 ± 0.08 (5) | N.T. | 1.37 ± 0.28 (5) |
| VU154 | N.T. | N.D. | = 6.21 | 0.78 ± 0.08 (5) § § | N.T. | 1.02 ± 0.15 (5) | |
| Human T433R M4 mAChR | LY298 | N.T. | N.D. | = 5.04 | 1.73 ± 0.13 (5) § § | N.T. | 1.85 ± 0.28 (5) |
| VU154 | N.T. | N.D. | = 5.50 | 0.95 ± 0.12 (5) § § | N.T. | 1.18 ± 0.14 (5) | |
| Human V91L, D432E, T433R M4 mAChR | LY298 | N.T. | N.D. | = 5.29 | 1.62 ± 0.09 (5) § § | N.T. | 1.64 ± 0.30 (5) |
| VU154 | N.T. | N.D. | = 6.34 | 0.68 ± 0.06 (5) § § | N.T. | 1.34 ± 0.11 (5) § § | |
-
Values represent the mean ± SEM with the number of independent experiments shown in parenthesis.
-
N.T.: not tested; N.D.: not determined; Ach, acetylcholine; Ipx: iperoxo; PAM: positive allosteric modulator.
-
*
Number of [3H]-NMS binding sites per cell.
-
†
Negative logarithm of the radioligand equilibrium dissociation constant.
-
‡
Negative logarithm of the orthosteric (pKi) or allosteric (pKB) equilibrium dissociation constant.
-
§
Logarithm of the binding cooperativity factor between the agonist (ACh or Ipx) and the PAM (LY298 or VU154).
-
¶
Parameter was determined in a shared global analysis between agonists.
-
**
Logarithm of the operational efficacy parameter determined using the Operational Model of Agonism.
-
††
Logarithm of the functional cooperativity factor between the agonist (ACh or Ipx) and the PAM (LY298 or VU154).
-
‡ ‡
logτC = logarithm of the operational efficacy parameter corrected for receptor expression (methods in Appendix 1).
-
§ §
Values from pKB PAM, log αIpx, log τC PAM, and log αβIpx that are significantly different from human WT M4 mAChR (p<0.05) calculated by a one-way ANOVA with a Dunnett’s post-hoc test.
Table 2
Cryo-electron microscopy (cryo-EM) data collection, refinement, and validation statistics.
| M4R-Gi1-Ipx | M4R-Gi1-Ipx-LY298 | M4R-Gi1-Ipx-VU154 | M4R-Gi1-ACh | |
|---|---|---|---|---|
| Data collection & refinement | ||||
| EMD code | 26,099 | 26,100 | 26,101 | 26,102 |
| Micrographs | 5056 | 5121 | 6021 | 5913 |
| Electron dose (e-/A2) | 66 | 66 | 59.5 | 53.6 |
| Voltage (kV) | 300 | 300 | 300 | 300 |
| Pixel size (Å) | 0.83 | 0.83 | 0.83 | 0.83 |
| Spot size | ||||
| Exposure time | 4 | 4 | 3 | 5 |
| Movie frames | 76 | 76 | 75 | 71 |
| K3 CDS mode | No | No | No | Yes |
| Defocus range (µm) | 0.5–1.5 | 0.5–1.5 | 0.5–1.5 | 0.5–1.5 |
| Symmetry imposed | C1 | C1 | C1 | C1 |
| Particles (final map) | 415,743 | 617,793 | 677,392 | 315,595 |
| Resolution @0.143 FSC (Å) | 2.8 | 2.4 | 2.5 | 2.8 |
| Refinement | ||||
| CCmap–model | 0.87 | 0.87 | 0.88 | 0.82 |
| Map sharpening B factor (Å2) | –80.9 | –60.8 | –46.6 | –85.1 |
| Model quality | ||||
| PDB code | 7TRK | 7TRP | 7TRQ | 7TRS |
| R.M.S. deviations | ||||
| Bond length (Å) | 0.004 | 0.004 | 0.005 | 0.006 |
| Bond angles (o) | 0.849 | 0.811 | 0.826 | 0.773 |
| Ramachandran | ||||
| Favored (%) | 98.38 | 99.14 | 98.02 | 98.10 |
| Outliers (%) | 0 | 0 | 0 | 0 |
| Rotamer outliers (%) | 0.11 | 0.21 | 0 | 0 |
| C-beta deviations (%) | 0 | 0 | 0 | 0 |
| Clashscore | 2.69 | 2.62 | 2.26 | 4.08 |
| MolProbity score | 1.06 | 1.05 | 1.00 | 1.19 |
-
mAChR: muscarinic acetylcholine receptor; ACh: acetylcholine; Ipx: iperoxo; FSC: Fourier shell correlation.
Table 3
Gaussian accelerated molecular dynamics (GaMD) simulations of the M4 muscarinic acetylcholine receptor (mAChR).
| System | Method |
|---|---|
| M4-Gi1-Ipx (cryo-EM structure) | GaMD (3 × 500 ns) |
| M4-Gi1-Ipx-VU154 (cryo-EM structure) | GaMD (3 × 500 ns) |
| M4-Gi1-Ipx-LY298 (cryo-EM structure) | GaMD (3 × 500 ns) |
| M4-Gi1-ACh (cryo-EM structure) | GaMD (3 × 500 ns) |
| M4-D432E-Gi1-Ipx-VU154 | GaMD (3 × 500 ns) |
| M4-T433R-Gi1-Ipx-VU154 | GaMD (3 × 500 ns) |
| M4-Gi1-ACh-VU154 | GaMD (3 × 500 ns) |
| M4-Gi1-ACh-LY298 | GaMD (3 × 500 ns) |
| M4-Gi1-VU154 | GaMD (3 × 500 ns) |
| M4-Gi1-LY298 | GaMD (3 × 500 ns) |
| M4-VU154 | GaMD (3 × 1000 ns) |
| M4-LY298 | GaMD (3 ×1000 ns) |
Table 4
Pharmacological parameters of LY298 and VU154 at key M4 muscarinic acetylcholine receptor (mAChR) mutants.
| [3H]-NMS saturation binding on stable M4 mAChR Flp-In CHO cells | |||||||||
|---|---|---|---|---|---|---|---|---|---|
| Constructs | Sites per cell* | pKD† | |||||||
| Human WT M4 mAChR (from Table 1) | 598,111 ± 43,067 (7) | 9.76 ± 0.05 (7) | |||||||
| Y89A2.61 | 32,674 ± 4174 (4) | 9.88 ± 0.06 (4) | |||||||
| Q184A45.49 | 88,728 ± 3056 (3) | 9.99 ± 0.06 (3) | |||||||
| F186A45.51 | 36,907 ± 4170 (4) | 9.75 ± 0.16 (4) | |||||||
| W435A7.35 | 34,861 ± 3510 (3) | 9.81 ± 0.22 (3) | |||||||
| Y439A7.39 | 42,690 ± 4547 (3) | 8.31 ± 0.14 (3) | |||||||
| [3H]-NMS interaction binding assays between ACh or Ipx and LY298 or VU154 on stable M4 mAChR constructs in Flp-In CHO cells | |||||||||
| Constructs | PAM | pKi ACh‡ | pKi Ipx‡ | pKB PAM‡ | log αACh§ | log αIpx§ | log αNMS¶ | ||
| Human WT M4 | LY298 | 5.09 ± 0.07 (7) | 8.54 ± 0.04 (11) | = 5.65 | 1.57 ± 0.11 | 1.71 ± 0.09 | = 0 | ||
| VU154 | 5.06 ± 0.05 (7) | 8.54 ± 0.03 (11) | = 5.83 | 1.44 ± 0.07 | 1.11 ± 0.06 | = 0 | |||
| Y89A2.61 | LY298 | 5.25 ± 0.05 (6) | 8.48 ± 0.05 (6) | N.D. | N.D. | N.D. | N.D. | ||
| VU154 | 5.27 ± 0.05 (6) | 8.47 ± 0.05 (6) | N.D. | N.D. | N.D. | N.D. | |||
| Q184A45.49 | LY298 | 5.24 ± 0.06 (6) | 8.74 ± 0.04 (10) | 6.23 ± 0.06 | 1.28 ± 0.13 | 1.27 ± 0.11 | –1.10 ± 0.07 | ||
| VU154 | 5.28 ± 0.05 (6) | 8.69 ± 0.04 (10) | 5.87 ± 0.17 | 1.07 ± 0.09 | 0.81 ± 0.07 | = 0 | |||
| F186A45.51 | LY298 | 4.91 ± 0.05 (6) | 8.12 ± 0.05 (8) | N.D. | N.D. | N.D. | N.D. | ||
| VU154 | 4.91 ± 0.05 (6) | 8.12 ± 0.05 (8) | N.D. | N.D. | N.D. | N.D. | |||
| W4357.35 | LY298 | 3.79 ± 0.07 (7) | 6.88 ± 0.07 (7) | N.D. | N.D. | N.D. | N.D. | ||
| VU154 | 3.79 ± 0.07 (7) | 6.88 ± 0.07 (7) | N.D. | N.D. | N.D. | N.D. | |||
| Y439A7.39 | LY298 | 3.23 ± 0.22 (8) | 5.36 ± 0.25 (8) | N.D. | N.D. | N.D. | N.D. | ||
| VU154 | 3.23 ± 0.22 (8) | 5.36 ± 0.25 (8) | N.D. | N.D. | N.D. | N.D. | |||
-
Values represent the mean ± SEM with the number of independent experiments shown in parenthesis.
-
N.D.: not determined; ACh: acetylcholine; Ipx: iperoxo; PAM: positive allosteric modulator.
-
*
Number of [3H]-NMS binding sites per cell.
-
†
Negative logarithm of the radioligand equilibrium dissociation constant.
-
‡
Negative logarithm of the orthosteric (pKi) or allosteric (pKB) equilibrium dissociation constant. pKi values for ACh and Ipx are shared at each M4 mAChR construct. pKB values for the PAMs at Q184A are shared across the agonist data sets.
-
§
Logarithm of the binding cooperativity factor between the agonist (ACh or Ipx) and the PAM (LY298 or VU154).
-
¶
Logarithm of the binding cooperativity factor between the [3H]-NMS and the PAM (LY298 or VU154).
Table 5
Pharmacological parameters of M4 muscarinic acetylcholine receptor (mAChR) mutants.
| pERK1/2 interaction assays* | [3H]-QNB interaction binding assays† | Study | |||||
|---|---|---|---|---|---|---|---|
| Constructs | log τC ACh ‡ | log τC LY298 ‡ | log αβ § | pKi ACh ¶ | pKB LY298 ¶ | log α** | |
| WT M4 mAChR | 2.96 ± 0.14 (4) | 1.10 ± 0.09 | 2.43 ± 0.14 | 4.51 ± 0.15 | 4.89 ± 0.12 | 1.97 ± 0.11 | Current/Thal†† |
| S85A2.57 | 3.15 ± 0.11(4) | 0.91 ± 0.07 | 1.75 ± 0.09 | 4.09 ± 0.11 | 5.44 ± 0.14 | 1.43 ± 0.06 | Current/Thal |
| Y89A2.61 | 2.53 ± 0.17 (5) | = –3 | –0.43 ± 0.27* | 5.07 ± 0.45 | 5.36 ± 0.03 | –0.13 ± 0.08 ‡ ‡ | Current/Thal |
| Y92A2.64 | 2.26 ± 0.15 (4) | –0.06 ± 0.16* | 2.25 ± 0.11 | 4.15 ± 0.25 | 4.53 ± 0.15 | 1.2 ± 0.19 ‡ ‡ | Current/Thal |
| I93T, I94V, K95I | 2.57 ± 0.11 | 2.27 ± 0.19 ‡ ‡ | N.T. | 4.69 ± 0.11 | 4.82 ± 0.36 | 2.14 ± 0.17 ‡ ‡ | Nawaratne § § |
| I93T2.65 | 2.34 ± 0.09 | 2.38 ± 0.22 ‡ ‡ | N.T. | 4.97 ± 0.04 | 5.36 ± 0.09 | 2.42 ± 0.16 ‡ ‡ | Nawaratne |
| I94V2.66 | 2.34 ± 0.09 | 1.24 ± 0.09 | N.T. | 4.71 ± 0.06 | 5.17 ± 0.08 | 1.74 ± 0.07 | Nawaratne |
| K95I2.67 | 2.00 ± 0.07 | 0.61 ± 0.09 ‡ ‡ | N.T. | 4.86 ± 0.05 | 5.20 ± 0.14 | 1.24 ± 0.04 ‡ ‡ | Nawaratne |
| Y97A23.49 | 2.94 ± 0.11 (4) | 2.19 ± 0.07* | 3.43 ± 0.12* | 4.69 ± 0.17 | 4.25 ± 0.10 ‡ ‡ | 2.33 ± 0.12 | Current/Thal |
| W98A23.50 | 1.45 ± 0.15* (5) | = –3 | 2.29 ± 0.10 | 3.65 ± 0.11 ‡ ‡ | 4.39 ± 0.04 | 0.73 ± 0.07 ‡ ‡ | Current/Thal |
| G101A23.53 | 2.58 ± 0.09 (4) | 0.43 ± 0.08* | 2.10 ± 0.07 | 4.37 ± 0.19 | 5.03 ± 0.17 | 1.47 ± 0.01 | Current/Thal |
| D106A3.26 | 1.24 ± 0.11 | = –3 | N.T. | 3.95 ± 0.09 ‡ ‡ | 5.29 ± 0.11 | 1.51 ± 0.15 | Leach ¶ ¶ |
| W108A3.28 | 1.49 ± 0.17 | = –3 | N.T. | 4.01 ± 0.06 ‡ ‡ | 4.24 ± 0.07 ‡ ‡ | 1.23 ± 0.01 ‡ ‡ | Leach |
| L109A3.29 | 1.17 ± 0.14 | = –3 | N.T. | 3.11 ± 0.09 ‡ ‡ | 4.28 ± 0.14 ‡ ‡ | 2.54 ± 0.10 ‡ ‡ | Leach |
| D112E3.32 | –0.80 ± 0.16 ‡ ‡ | = –3 | N.T. | <2 | 5.56 ± 0.13 | 0.39 ± 0.11 ‡ ‡ | Leach |
| D112N3.32 | N.D. | N.D. | N.T. | 3.19 ± 0.02 ‡ ‡ | 5.79 ± 0.2 ‡ ‡ | 0.74 ± 0.08 | Leach |
| Y113A3.33 | N.T. | N.T. | N.T. | 2.98 ± 0.12 ‡ ‡ | 4.97 ± 0.15 | 0.80 ± 0.10 ‡ ‡ | Leach |
| S116A3.36 | 0.82 ± 0.17 ‡ ‡ | –0.35 ± 0.45 ‡ ‡ | N.T. | 3.61 ± 0.10 ‡ ‡ | 5.12 ± 0.08 | 1.54 ± 0.05 | Leach |
| N117A3.37 | 0.80 ± 0.27 ‡ ‡ | –0.27 ± 0.16 ‡ ‡ | N.T. | 3.64 ± 0.04 ‡ ‡ | 5.30 ± 0.15 | 1.57 ± 0.13 | Leach |
| V120A3.40 | 1.47 ± 0.11 | 1.20 ± 0.19 | N.T. | 5.63 ± 0.05 ‡ ‡ | 5.41 ± 0.10 | 1.83 ± 0.11 | Leach |
| D129E3.49 | 1.45 ± 0.24 | 0.78 ± 0.16 | N.T. | 5.04 ± 0.07 | 5.59 ± 0.12 | 1.61 ± 0.16 | Leach |
| D129N3.49 | 2.56 ± 0.39 | 1.86 ± 0.12 | N.T. | 5.54 ± 0.10 ‡ ‡ | 5.37 ± 0.20 | 1.86 ± 0.22 | Leach |
| W164A4.57 | N.D. (3) | = –3 | 2.17 ± 0.64*** | 3.95 ± 0.24 | 5.15 ± 0.28 | ND | Current/Thal |
| F170A4.63 | 3.13 ± 0.17 (5) | 2.66 ± 0.12* | 3.58 ± 0.17* | 4.77 ± 0.2 | 4.53 ± 0.06 | 2.23 ± 0.13 | Current/Thal |
| W171A4.64 | 2.59 ± 0.17 (5) | 1.31 ± 0.11 | 3.11 ± 0.13 | 3.91 ± 0.21 | 4.56 ± 0.15 | 2.00 ± 0.09 | Current/Thal |
| Q172A4.65 | 3.05 ± 0.33 (5) | 1.18 ± 0.31 | 2.71 ± 0.16 | 4.02 ± 0.09 | 4.99 ± 0.03 | 1.54 ± 0.08 | Current/Thal |
| F173A4.66 | 3.39 ± 0.11(4) | 2.03 ± 0.10* | 3.31 ± 0.23* | 4.09 ± 0.01 | 4.78 ± 0.19 | 1.90 ± 0.14 | Current/Thal |
| Q184A45.49 | 3.01 ± 0.10 (4) | 1.05 ± 0.08 | 2.08 ± 0.12 | 4.25 ± 0.12 | 5.36 ± 0.04 | 1.70 ± 0.05 | Current/Thal |
| F186A45.51 | 1.99 ± 0.11 | N.D. | N.T. | 4.85 ± 0.06 | NR | NR | Nawaratne |
| I187A45.52 | 2.57 ± 0.10 | 0.62 ± 0.09 | 2.07 ± 0.15 | 3.71 ± 0.12 | 5.46 ± 0.29 | 1.07 ± 0.29 ‡ ‡ | Current/Thal |
| Q188A45.53 | 2.48 ± 0.15 | 0.99 ± 0.11 | 2.35 ± 0.16 | 4.6 ± 0.22 | 4.94 ± 0.08 | 1.49 ± 0.04 | Current/Thal |
| F189A45.54 | 2.28 ± 0.11 | 1.25 ± 0.09 | 2.67 ± 0.11 | 4.65 ± 0.02 | 5.09 ± 0.13 | 1.99 ± 0.08 | Current/Thal |
| L190A45.55 | 2.50 ± 0.14 | 1.32 ± 0.12 | 2.81 ± 0.12 | 4.20 ± 0.06 | 4.92 ± 0.1 | 2.06 ± 0.09 | Current/Thal |
| W413A6.48 | 0.66 ± 0.12***,* (4) | 0.61 ± 0.13*** | 3.54 ± 0.09***,* | 3.47 ± 0.06 ‡ ‡ | 4.51 ± 0.37 | 2.45 ± 0.36 | Current/Thal |
| Y416A6.51 | N.T. | N.T. | N.T. | 2.85 ± 0.10 ‡ ‡ | NR | NR | Thal |
| N423A6.58 | 3.44 ± 0.15 (3) | 0.82 ± 0.10 | 1.43 ± 0.19* | 4.41 ± 0.15 | 5.02 ± 0.06 | 1.18 ± 0.08 ‡ ‡ | Current/Thal |
| Q427A6.62 | 3.15 ± 0.14 (3) | 0.99 ± 0.12 | 1.64 ± 0.12 | 4.46 ± 0.03 | 5.43 ± 0.06 | 1.36 ± 0.04 | Current/Thal |
| S428P6.63 | 1.99 ± 0.09 | 1.40 ± 0.19 | N.T. | 5.14 ± 0.03 ‡ ‡ | 5.17 ± 0.15 | 1.81 ± 0.11 | Nawaratne |
| D432N7.32 | 2.26 ± 0.12 | 1.25 ± 0.18 | N.T. | 5.19 ± 0.04 ‡ ‡ | 5.21 ± 0.2 | 1.37 ± 0.04 | Nawaratne |
| W435A7.35 | 2.58 ± 0.17 (4) | = –3 | N.R | 3.37 ± 0.08 ‡ ‡ | NR | NR | Current/Thal |
| Y439A7.39 | 0.60 ± 0.18 ‡ ‡ | N.D. | N.T. | 3.33 ± 0.10 ‡ ‡ | 5.84 ± 0.12 | 0.49 ± 0.03 ‡ ‡ | Nawaratne |
| W440A7.40 | 3.69 ± 0.17†††(4) | 0.84 ± 0.11 | 1.52 ± 0.20††† | 4.29 ± 0.24 | 4.94 ± 0.06 | 0.96 ± 0.04 ‡ ‡ | Current/Thal |
| C442A7.42 | 1.49 ± 0.16 ‡ ‡ | 0.82 ± 0.31 | N.T. | 4.04 ± 0.07 ‡ ‡ | 5.35 ± 0.06 | 1.81 ± 0.03 | Nawaratne |
| Y443A7.43 | 0.50 ± 0.16 ‡ ‡ | N.D. | N.T. | 3.36 ± 0.01 ‡ ‡ | 6.22 ± 0.05 ‡ ‡ | 1.16 ± 0.01 ‡ ‡ | Nawaratne |
-
Values represent the mean ± SEM from three or more independent experiments with the number of individual experimental replicates from the current study shown in parenthesis.
-
N.T.: not tested; N.D.: not determined; N.R.: no response; ACh, acetylcholine.
-
*
Data and analysis from pERK1/2 assays were generated in the current study, Nawaratne et al, J. Bio. Chem. 2010, and Leach et al, Mol. Pharm. 2011. logτ ACh were calculated from the operational model of agonism. log τ LY298 and log αβ were calculated using a simplified operational model of allosterism.
-
†
Data and analysis from [3H]-QNB interaction binding assays were generated in Nawaratne et al, J. Bio. Chem. 2010, Leach et al, Mol. Pharm., and Thal et al, Nature 2016.
-
‡
logτC = logarithm of the operational efficacy parameter corrected for receptor expression using the maximum number of receptor binding sites as previously determined from Nawaratne et al, J. Bio. Chem. 2010, Leach et al, Mol. Pharm., and Thal et al, Nature 2016.
-
§
Logarithm of the functional cooperativity factor between ACh and LY298.
-
¶
Negative logarithm of the orthosteric (pKi) or allosteric (pKB) equilibrium dissociation constant.
-
**
Logarithm of the binding cooperativity factor between ACh and LY298.
-
††
Values of logτC ACh, log τC LY298, and log αβ that were calculated in this study. Other parameters are from Thal et al., 2016.
-
‡ ‡
Values are significantly different from WT M4 mAChR as determined in previous studies.
-
§ §
All values are from Nawaratne et al, J. Bio. Chem. 2010 with logτ corrected for receptor expression.
-
¶ ¶
All values are from Leach et al, Mol. Pharm. 2011.
-
***
Parameters determined from the full Operational Model of Allosterism.
-
†††
Values are significantly different from WT M4 mAChR (p<0.05) calculated by a one-way ANOVA with a Dunnett’s post-hoc test.
Appendix 1—key resources table
| Reagent type (species) or resource | Designation | Source or reference | Identifiers | Additional information |
|---|---|---|---|---|
| Antibody | Anti-FLAG M1 (mouse polyclonal IgG2a) | Gift from Prof. Brian Kobilka (PMID::17962520) | Antibody was used to make anti-FLAG mAb resin that was used for the purification of FLAG-tagged M4 mAChR | |
| Strain, strain background (Escherichia coli) | DH5α | New England Biolabs | C2987H | |
| Strain, strain background (E. coli) | DH10bac | Thermo Fisher Scientific | 10361012 | |
| Cell line (Spodoptera frugiperda) | Sf9 | Expression Systems | 94-001S | |
| Cell line (Trichoplusia ni) | Tni | Expression Systems | 94-002S | |
| Cell line (Chinese hamster ovary) | Flp-In CHO human M4 mAChR WT | PMID:26958838 | ||
| Cell line (Chinese hamster ovary) | CHO K1 mouse M4 mAChR WT | PMID:21198541 | ||
| Cell line (Chinese hamster ovary) | Flp-In CHO human M4 mAChR D432E | This study | pEF5-FRT-V5-DEST plasmid | |
| Cell line (Chinese hamster ovary) | Flp-In CHO human M4 mAChR T433R | This study | pEF5-FRT-V5-DEST plasmid | |
| Cell line (Chinese hamster ovary) | Flp-In CHO human M4 mAChR V91L, D432E, T433R | This study | pEF5-FRT-V5-DEST plasmid | |
| Cell line (Chinese hamster ovary) | Flp-In CHO human M4 mAChR Y89A | PMID:26958838 | ||
| Cell line (Chinese hamster ovary) | Flp-In CHO human M4 mAChR Q184A | PMID:26958838 | ||
| Cell line (Chinese hamster ovary) | Flp-In CHO human M4 mAChR F186A | PMID:20406819 | ||
| Cell line (Chinese hamster ovary) | Flp-In CHO human M4 mAChR W435A | PMID:26958838 | ||
| Cell line (Chinese hamster ovary) | Flp-In CHO human M4 mAChR W439A | PMID:20406819 | ||
| Cell line (Chinese hamster ovary) | Flp-In CHO human M4 mAChR S85A | PMID:26958838 | ||
| Cell line (Chinese hamster ovary) | Flp-In CHO human M4 mAChR Y89A | PMID:26958838 | ||
| Cell line (Chinese hamster ovary) | Flp-In CHO human M4 mAChR Y92A | PMID:26958838 | ||
| Cell line (Chinese hamster ovary) | Flp-In CHO human M4 mAChR I93T, I94V, K95I | PMID:20406819 | ||
| Cell line (Chinese hamster ovary) | Flp-In CHO human M4 mAChR I93T | PMID:20406819 | ||
| Cell line (Chinese hamster ovary) | Flp-In CHO human M4 mAChR I94V | PMID:20406819 | ||
| Cell line (Chinese hamster ovary) | Flp-In CHO human M4 mAChR K95I | PMID:20406819 | ||
| Cell line (Chinese hamster ovary) | Flp-In CHO human M4 mAChR Y97A | PMID:26958838 | ||
| Cell line (Chinese hamster ovary) | Flp-In CHO human M4 mAChR W98A | PMID:26958838 | ||
| Cell line (Chinese hamster ovary) | Flp-In CHO human M4 mAChR G101A | PMID:26958838 | ||
| Cell line (Chinese hamster ovary) | Flp-In CHO human M4 mAChR D106A | PMID:21300722 | ||
| Cell line (Chinese hamster ovary) | Flp-In CHO human M4 mAChR W108A | PMID:21300722 | ||
| Cell line (Chinese hamster ovary) | Flp-In CHO human M4 mAChR L109A | PMID:21300722 | ||
| Cell line (Chinese hamster ovary) | Flp-In CHO human M4 mAChR D112E | PMID:21300722 | ||
| Cell line (Chinese hamster ovary) | Flp-In CHO human M4 mAChR D112N | PMID:21300722 | ||
| Cell line (Chinese hamster ovary) | Flp-In CHO human M4 mAChR S116A | PMID:21300722 | ||
| Cell line (Chinese hamster ovary) | Flp-In CHO human M4 mAChR N117A | PMID:21300722 | ||
| Cell line (Chinese hamster ovary) | Flp-In CHO human M4 mAChR V120A | PMID:21300722 | ||
| Cell line (Chinese hamster ovary) | Flp-In CHO human M4 mAChR D129E | PMID:21300722 | ||
| Cell line (Chinese hamster ovary) | Flp-In CHO human M4 mAChR D129N | PMID:21300722 | ||
| Cell line (Chinese hamster ovary) | Flp-In CHO human M4 mAChR W164A | PMID:26958838 | ||
| Cell line (Chinese hamster ovary) | Flp-In CHO human M4 mAChR F170A | PMID:26958838 | ||
| Cell line (Chinese hamster ovary) | Flp-In CHO human M4 mAChR W171A | PMID:26958838 | ||
| Cell line (Chinese hamster ovary) | Flp-In CHO human M4 mAChR Q172A | PMID:26958838 | ||
| Cell line (Chinese hamster ovary) | Flp-In CHO human M4 mAChR F173A | PMID:26958838 | ||
| Cell line (Chinese hamster ovary) | Flp-In CHO human M4 mAChR Q184A | PMID:26958838 | ||
| Cell line (Chinese hamster ovary) | Flp-In CHO human M4 mAChR F186A | PMID:20406819 | ||
| Cell line (Chinese hamster ovary) | Flp-In CHO human M4 mAChR I187A | PMID:26958838 | ||
| Cell line (Chinese hamster ovary) | Flp-In CHO human M4 mAChR Q188A | PMID:26958838 | ||
| Cell line (Chinese hamster ovary) | Flp-In CHO human M4 mAChR F189A | PMID:26958838 | ||
| Cell line (Chinese hamster ovary) | Flp-In CHO human M4 mAChR L190A | PMID:26958838 | ||
| Cell line (Chinese hamster ovary) | Flp-In CHO human M4 mAChR W413A | PMID:26958838 | ||
| Cell line (Chinese hamster ovary) | Flp-In CHO human M4 mAChR Y416A | PMID:26958838 | ||
| Cell line (Chinese hamster ovary) | Flp-In CHO human M4 mAChR N423A | PMID:26958838 | ||
| Cell line (Chinese hamster ovary) | Flp-In CHO human M4 mAChR Q427A | PMID:26958838 | ||
| Cell line (Chinese hamster ovary) | Flp-In CHO human M4 mAChR S428P | PMID:20406819 | ||
| Cell line (Chinese hamster ovary) | Flp-In CHO human M4 mAChR D432N | PMID:20406819 | ||
| Cell line (Chinese hamster ovary) | Flp-In CHO human M4 mAChR W435A | PMID:26958838 | ||
| Cell line (Chinese hamster ovary) | Flp-In CHO human M4 mAChR Y439A | PMID:20406819 | ||
| Cell line (Chinese hamster ovary) | Flp-In CHO human M4 mAChR Y440A | PMID:26958838 | ||
| Cell line (Chinese hamster ovary) | Flp-In CHO human M4 mAChR C442A | PMID:20406819 | ||
| Cell line (Chinese hamster ovary) | Flp-In CHO human M4 mAChR Y443A | PMID:20406819 | ||
| Cell line (Chinese hamster ovary) | Flp-In CHO cell line | Thermo Fisher Scientific | R75807 | |
| Cell line (Homo sapiens) | 293A cell line | Thermo Fisher Scientific | R70507 | |
| Recombinant DNA reagent | Human FLAG-M4∆i3-His | This study | pVL1392 vector | |
| Recombinant DNA reagent | Human Gαi1 dominant negative mutant | PMID:32193322 | pFastBac vector | |
| Recombinant DNA reagent | Human Gβ1γ2 | Gift from Prof. Brian Kobilka (PMID:24256733) | pVL1392 vector | |
| Recombinant DNA reagent | scFv16 | PMID:30213947 | pFastBac vector | |
| Recombinant DNA reagent | pcDNA5/FRT/TO-GAlphai1-RLuc8 | Gift from Prof. Bryan Roth (PMID:32367019) | TRUPATH assay | |
| Recombinant DNA reagent | pcDNA3.1-Beta3 | Gift from Prof. Bryan Roth (PMID:32367019) | TRUPATH assay | |
| Recombinant DNA reagent | pcDNA3.1-GGamma9-GFP2 | Gift from Prof. Bryan Roth (PMID:32367019) | TRUPATH assay | |
| Chemical compound, drug | Acetylcholine | Sigma-Aldrich | ||
| Chemical compound, drug | Iperoxo | Sigma-Aldrich | ||
| Chemical compound, drug | LY2033298 | Sigma-Aldrich | ||
| Chemical compound, drug | VU0467154 | Gift from Prof. Craig Lindsley (PMID:25137629) | PMID:25137629 | |
| Chemical compound, drug | Prolume Purple | Nanolight Technology | ||
| Chemical compound, drug | [3H]-NMS | PerkinElmer | ||
| Chemical compound, drug | Polyethylenimine (PEI) | Sigma-Aldrich | ||
| Chemical compound, drug | Atropine | Sigma-Aldrich | ||
| Commercial assay or kit | AlphaScreen SureFire pERK 1/2 (Thr202/Tyr204) Assay Kits | PerkinElmer | ||
| Software, algorithm | Prism 8.0 | GraphPad | ||
| Software, algorithm | PyMOL | Schrödinger | ||
| Software, algorithm | GaMD | PMID:26300708 | ||
| Software, algorithm | AMBER20 | https://ambermd.org | ||
| Software, algorithm | CPPTRAJ | PMID:26300708 | ||
| Software, algorithm | PyReweighting | PMID:25061441 | ||
| Software, algorithm | Phenix suite | PMID:20124702 | ||
| Software, algorithm | Coot | PMID:31730249 | ||
| Software, algorithm | Chimera | PMID:15264254 | ||
| Software, algorithm | Chimera X | PMID:32881101 | ||
| Software, algorithm | cryoSPARC | PMID:28165473 | ||
| Software, algorithm | Relion 3.1 | PMID:30412051 | ||
| Software, algorithm | Motioncor2 | PMID:28250466 | ||
| Software, algorithm | GCTF | PMID:26592709 | ||
| Software, algorithm | crYOLO | PMID:31240256 | ||
| Software, algorithm | ISOLDE | PMID:29872003 | ||
| Software, algorithm | MolProbity | PMID:29067766 | ||
| Software, algorithm | DAQ score | PMID:35953671 |
Additional files
Download links
A two-part list of links to download the article, or parts of the article, in various formats.
Downloads (link to download the article as PDF)
Open citations (links to open the citations from this article in various online reference manager services)
Cite this article (links to download the citations from this article in formats compatible with various reference manager tools)
Pharmacological hallmarks of allostery at the M4 muscarinic receptor elucidated through structure and dynamics
eLife 12:e83477.
https://doi.org/10.7554/eLife.83477


