Histological E-data Registration in rodent Brain Spaces
- Kavli Institute for Systems Neuroscience, Norwegian University of Science and Technology (NTNU), Norway
Figures
Figure 1
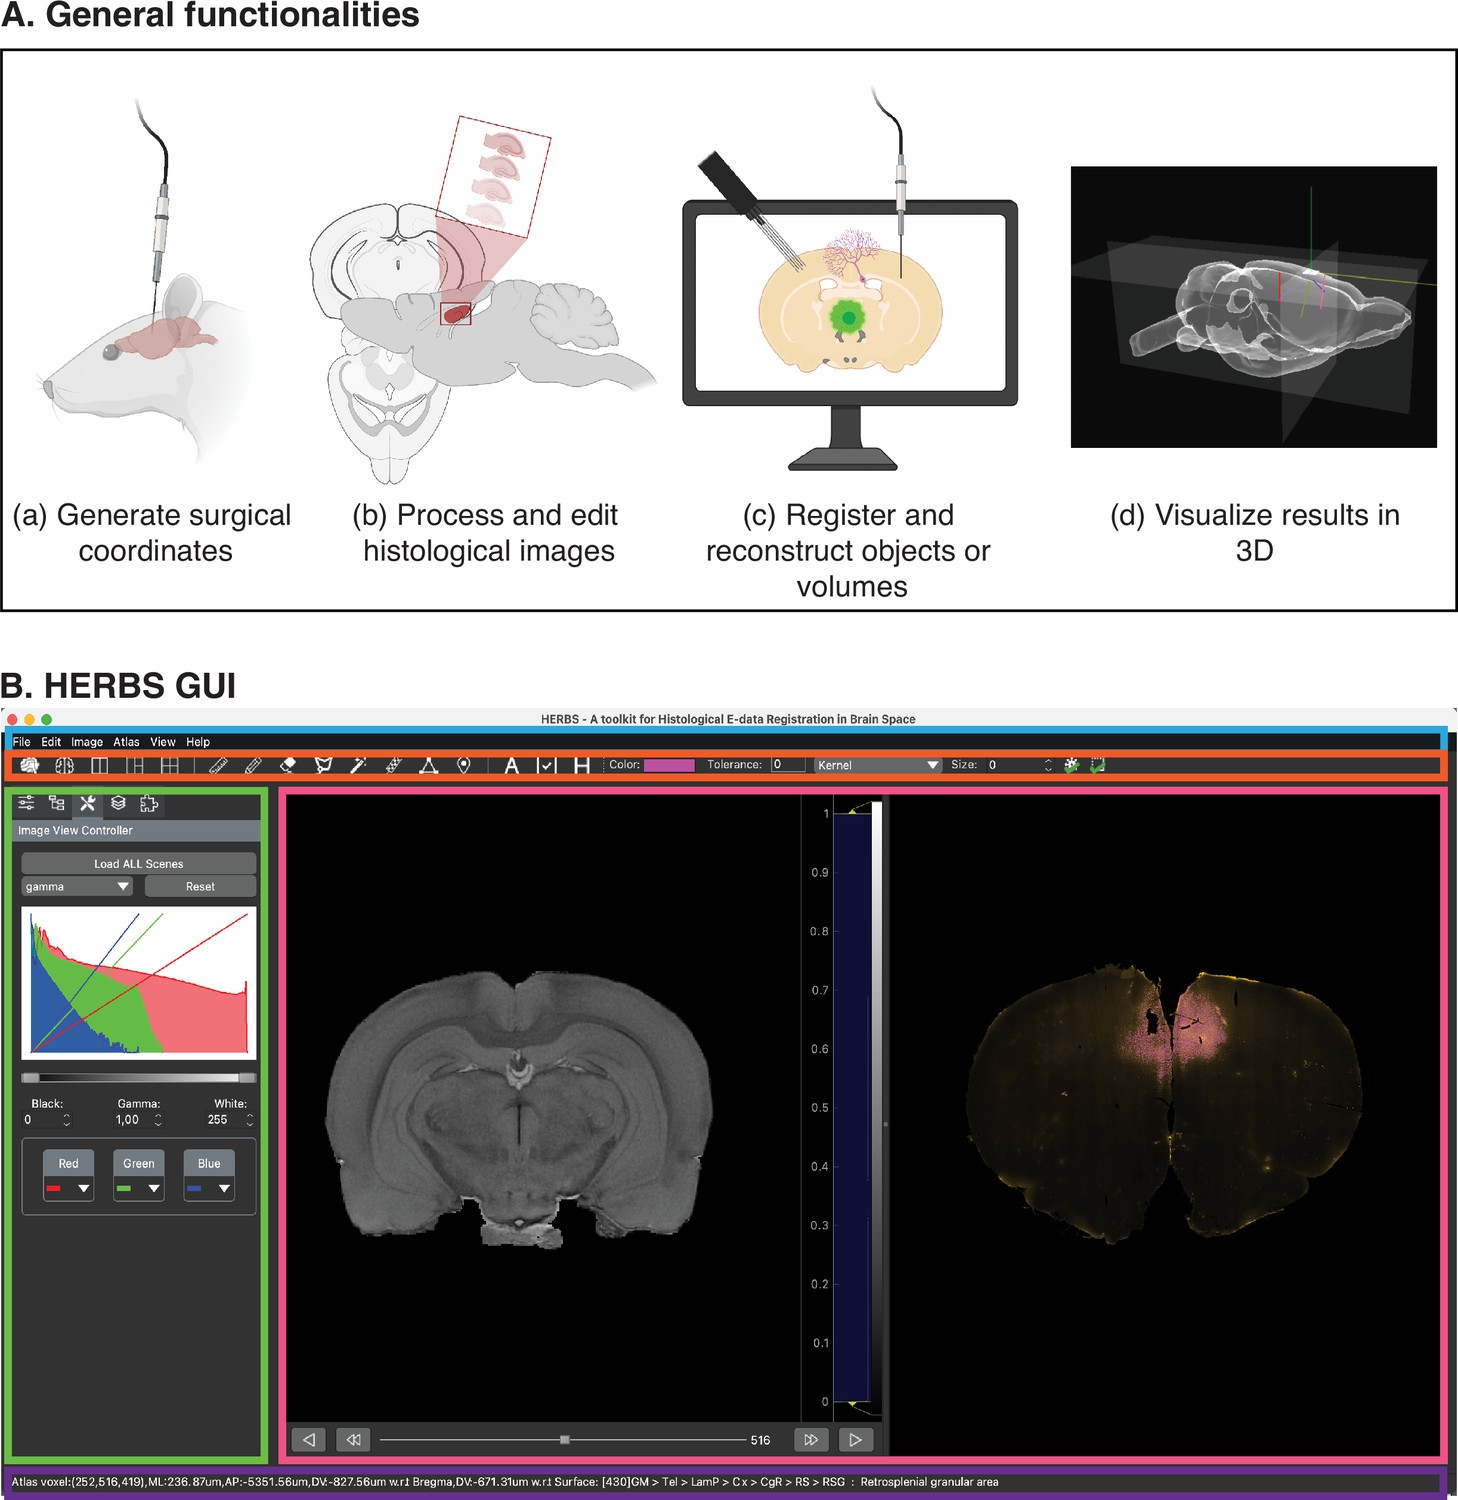
The core functionalities and user interface of HERBS.
(A) HERBS can be used to (a) plan electrode insertions or viral injections before surgery, (b) process and edit histological images, (c) register objects such as probes, virus, cells, and slice boundaries from histological images, and (d) visualize the brain in 3D with defined functions. (B) The user interface of HERBS consists of the Menu Bar (outlined in blue) for navigating through the functions, the Tool Bar (outlined in red) from which users select actions to perform in the Plot Window (magenta), such as registering or reconstruct objects. The Side Bar (geen) provides tools for visually editing objects or layers. The Status Bar (in purple at bottom) shows the brain regions and coordinates displayed in the Plot Window. The WHS or Allen Mouse Brain atlases can be downloaded and loaded directly through HERBS from the Menu Bar with a click of a button.
Figure 2
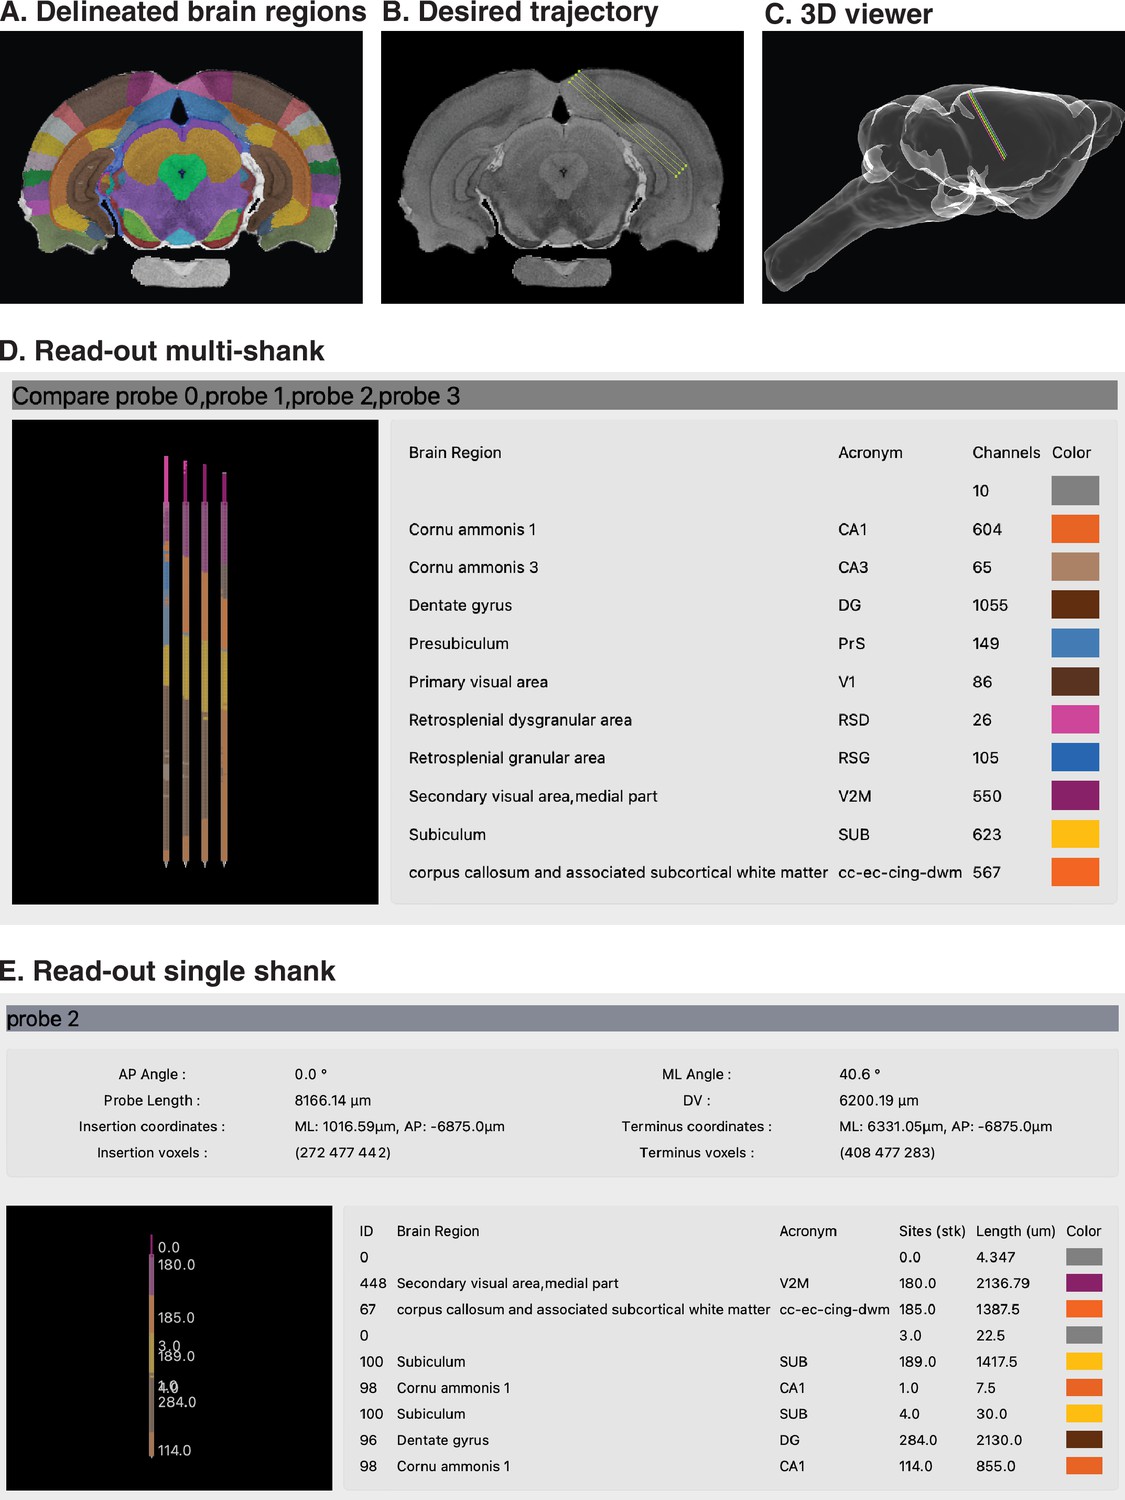
Using HERBS to plan a Neuropixels 2.0 probe implant before surgery.
(A) Once the plane of choice is set (coronal in this example), 2D atlas brain sections with regional delineations appear and the user scrolls to the slice with the region(s) they wish to target. (B) The user defines the trajectory of the probe by clicking the desired start and end-points (the insertion angle here is 40.8° lateral tilt at Bremga –6.8 mm). (C) A linear probe trajectory is projected into the Waxholm Space in 3D. (D) A read-out table for all four probes shows the regions the probe has traversed and the number of channels in each region. (E) A detailed read-out for a single probe provides the entry position, probe angle, and insertion length to reach the target regions, as well as an estimation of the number of recording channels in each region in the experiments.
Figure 3 with 1 supplement
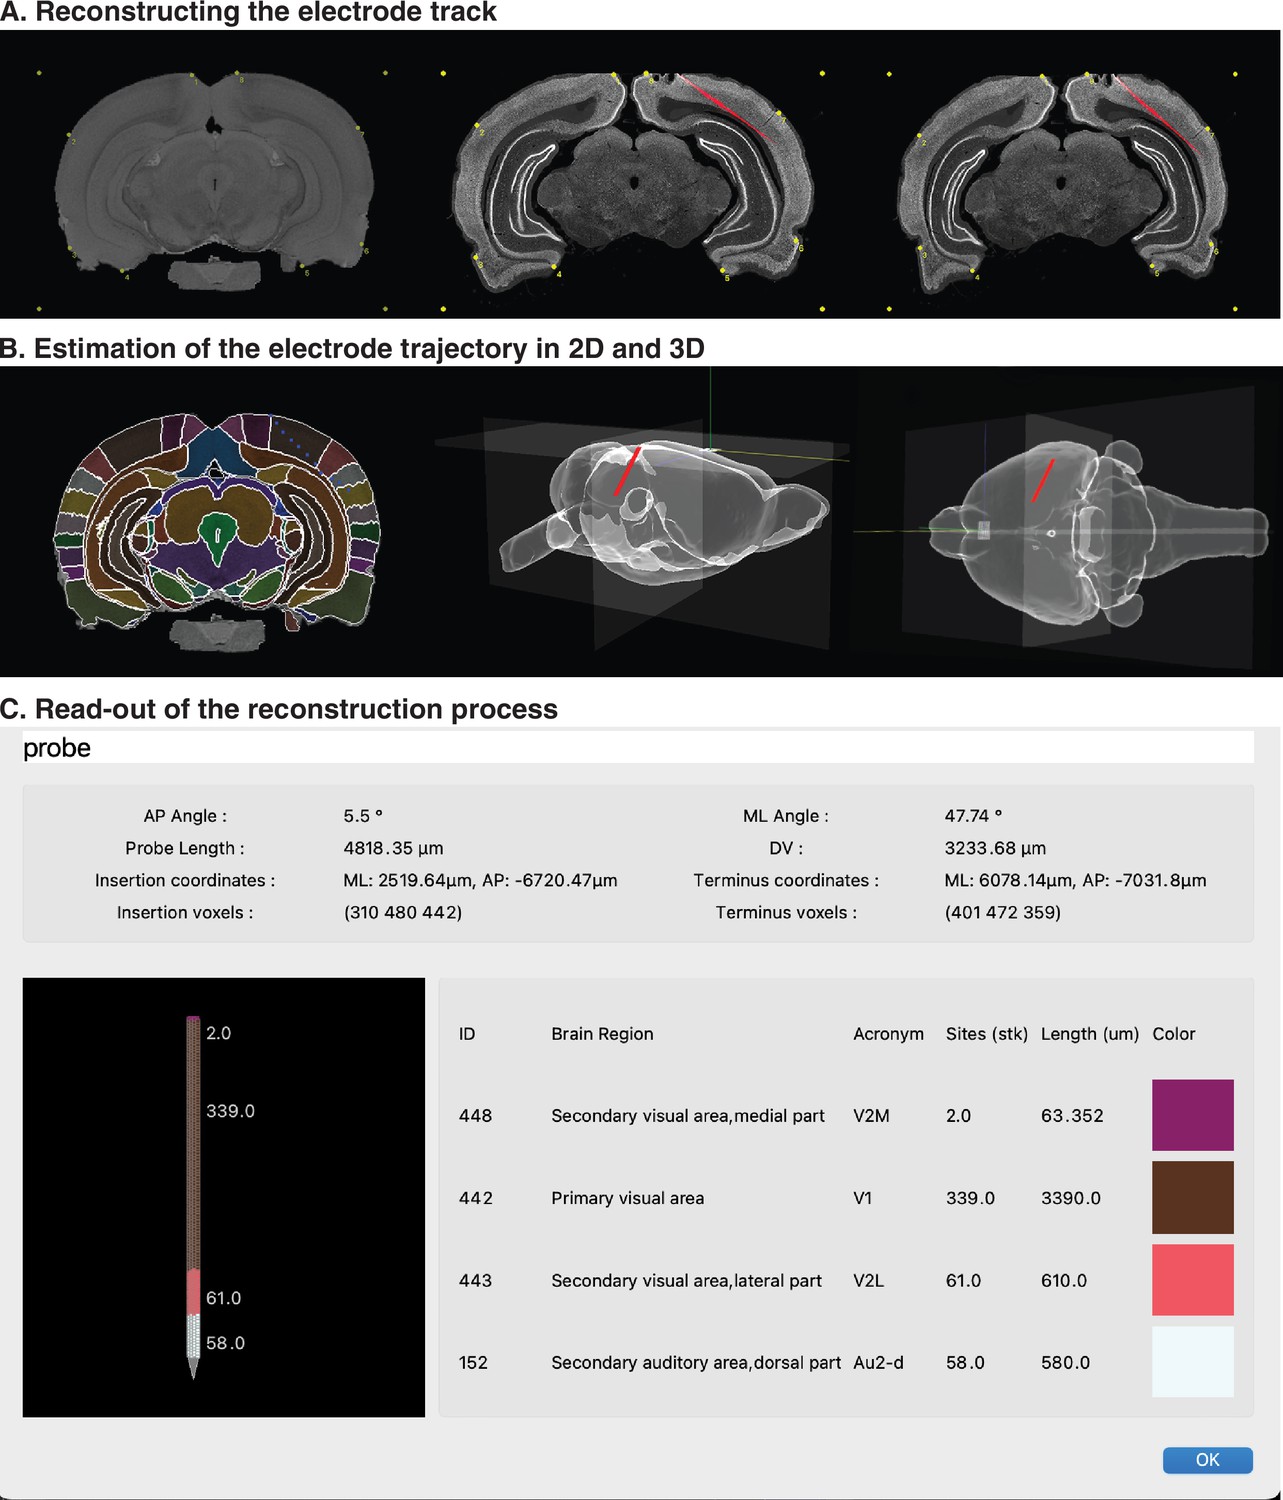
Reconstructing a recording probe trajectory from histological sections.
(A) The initial steps include scrolling to the atlas brain slice (left) that best matches the user’s histological section (middle). User-defined anchor points are then used to stretch and conform the histological section onto the atlas section; once they are merged a new image is generated with the histology warped to overlay the atlas slice (right panel). (B) The user then generates an estimate of probe placement and length by clicking at least four points spanning from the entry of the probe in the brain to the distal tip (left). The 3D reconstructed placement of the probe is shown in the sagittal plane (middle panel) and viewed from the top (right panel) in the WHS volume. (C) A read-out from the merged probe shows details of the probe insertion, the coordinates, as well as the brain regions the probe traversed in different colors. WHS, Waxholm Space.
Figure 3—figure supplement 1

An example image for learning to use the probe reconstruction functionality, as shown in Figure 3.
Figure 4 with 1 supplement
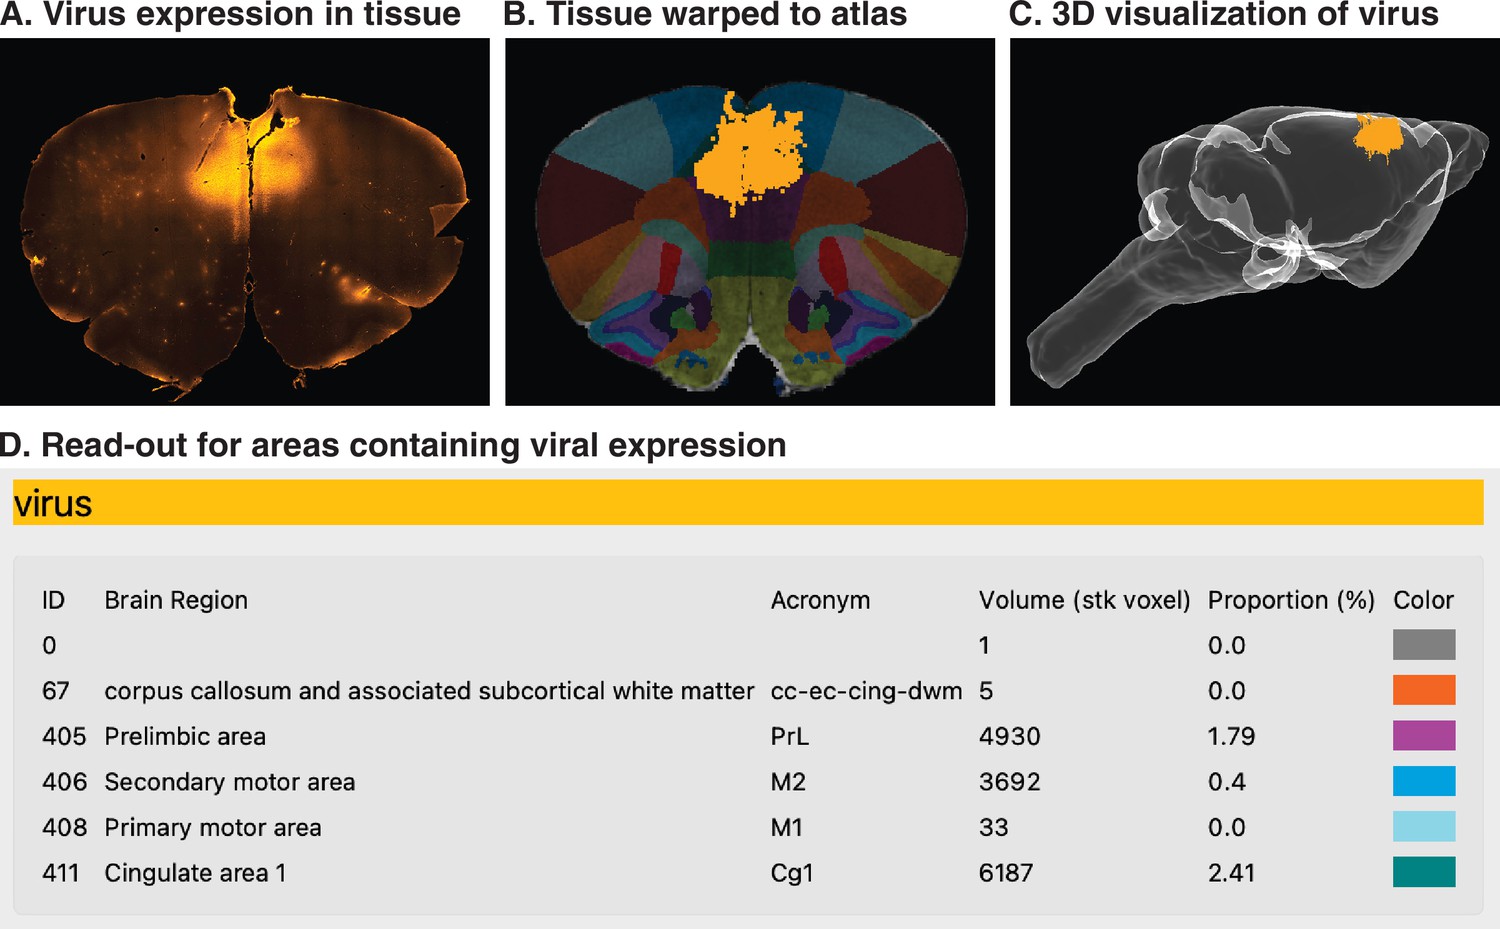
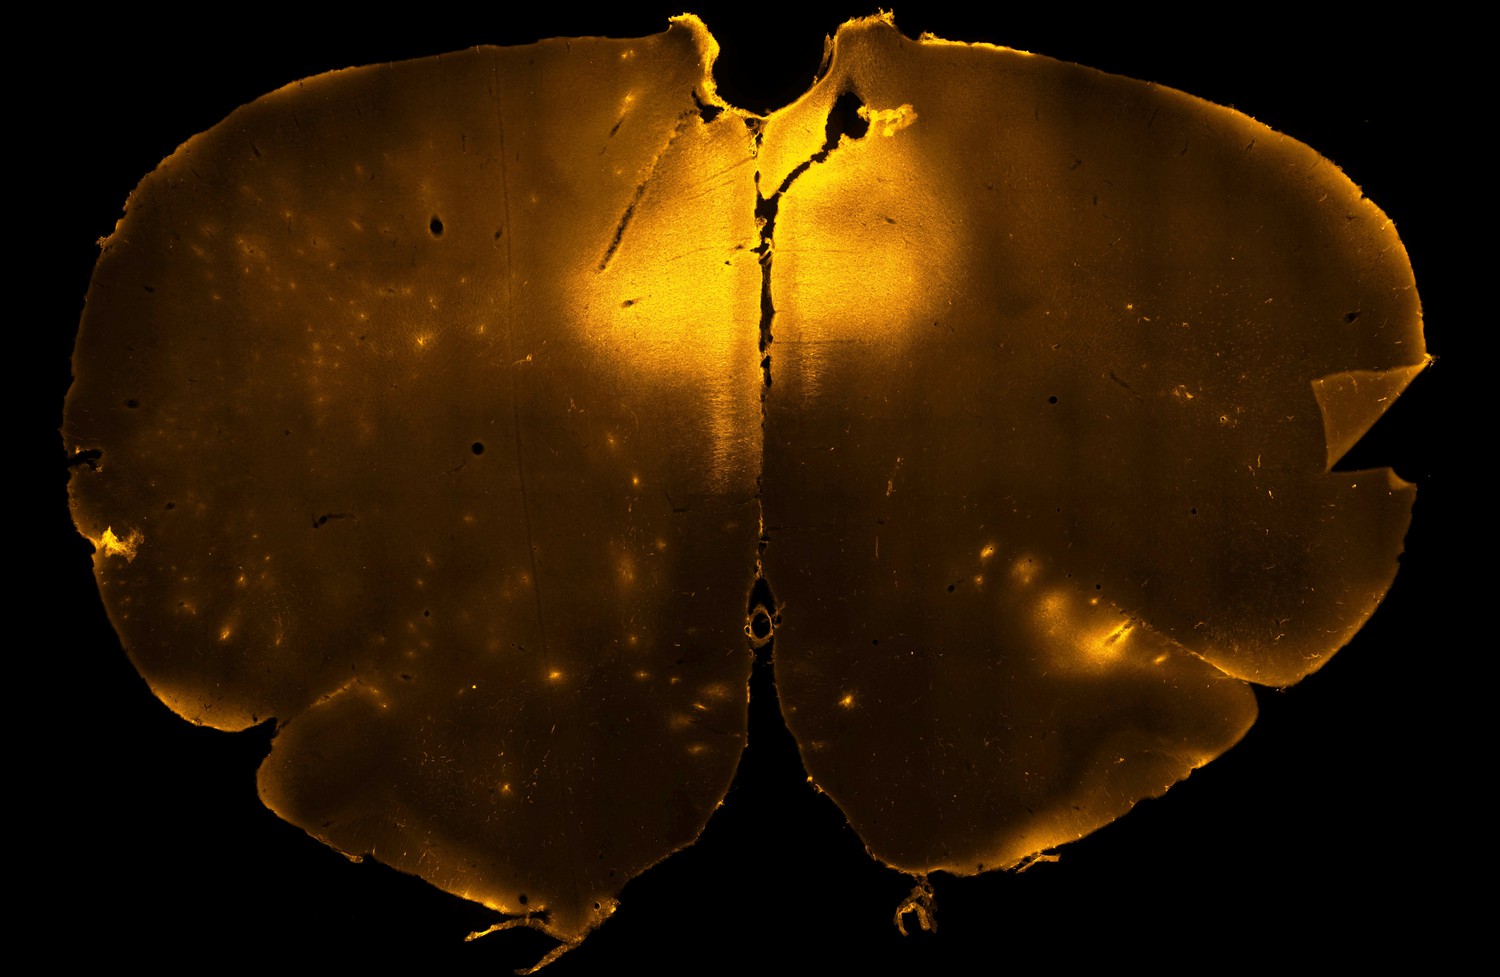
3D visualization of virus expression across multiple tissue sections.
(A) Shows the spatial extent of AAV-mediated mCherry expression in a coronal section from the frontal cortex of an adult rat. (B) The region of viral expression is defined by clicking the fluorescent region of tissue with the magic wand tool; areal boundaries are included at this stage. (C) A volumetric rendering of the brain shows the extent of viral expression in cingulate cortex and surrounding areas, with the volume of virus spread (based on the 11 slices used here) expressed in voxels, and the proportion of each region expressing the virus show as a percentage. (D) A read-out of the regions in which the virus was expressed.
Figure 4—figure supplement 1
An example image for learning to reconstruct viral expression in a single brain slice, as shown in Figure 4.
Tables
Key resources table
| Reagent type (species) or resource | Designation | Source or reference | Identifiers | Additional information |
|---|---|---|---|---|
| Software, algorithm | Numpy | Harris et al., 2020 | RRID:SCR_008633 | |
| Software, algorithm | Scipy | Virtanen et al., 2020 | RRID:SCR_008058 | |
| Software, algorithm | OpenCV | Bradski, 2000 | RRID:SCR_01552 | |
| Software, algorithm | PyOpenGL | Woo et al., 1999 | ||
| Software, algorithm | PyQT5 | PyQT, 2012 |
Additional files
-
MDAR checklist
- https://cdn.elifesciences.org/articles/83496/elife-83496-mdarchecklist1-v2.docx
-
Supplementary file 1
Table summarizing the currently available anatomical tool kits for use with rodents.
The name and year of publication for each tool kit are shown at top, and the functionalities of each tool kit are listed below.
- https://cdn.elifesciences.org/articles/83496/elife-83496-supp1-v2.docx
Download links
A two-part list of links to download the article, or parts of the article, in various formats.
Downloads (link to download the article as PDF)
Open citations (links to open the citations from this article in various online reference manager services)
Cite this article (links to download the citations from this article in formats compatible with various reference manager tools)
Histological E-data Registration in rodent Brain Spaces
eLife 12:e83496.
https://doi.org/10.7554/eLife.83496


