Cell circuits between leukemic cells and mesenchymal stem cells block lymphopoiesis by activating lymphotoxin beta receptor signaling
- Department of Immunobiology and Yale Stem Cell Center, Yale University School of Medicine, United States
- Center of Molecular and Cellular Oncology and Department of Immunobiology, Yale University, United States
- Department of Biomedical Sciences, Korea University College of Medicine, Republic of Korea
- Department of Cell Biology and Yale Stem Cell Center, Yale University, United States
- Department of Laboratory Medicine, University of California, San Francisco, United States
- Department of Genetics, School of Medicine, Yale University, United States
Figures
Figure 1

Kinetics of B-ALL growth and impact on hematopoiesis.
(A) B-ALL number. (B) Number of non-malignant developing B cell subsets. (C) Inflammatory monocytes. (D) Neutrophils. (E) Immature (Ter119+CD71+) and mature (Ter119+CD71-) red blood cells. Data in all panels show bone marrow cell numbers obtained from wild-type (WT) mice transplanted with 3×10⁶ BCR-ABL-expressing B-ALL cells. In all panels, X-axis indicates time (days) after B-ALL transplantation. Bars indicate mean, circles depict individual mice. Data are representative of two independent experiments. **p<0.005; ***p<0.0005 unpaired, two-sided, Student’s t test. ###p<0.0005 Mann–Whitney test. ALL, acute lymphoblastic leukemia.
Figure 2 with 1 supplement
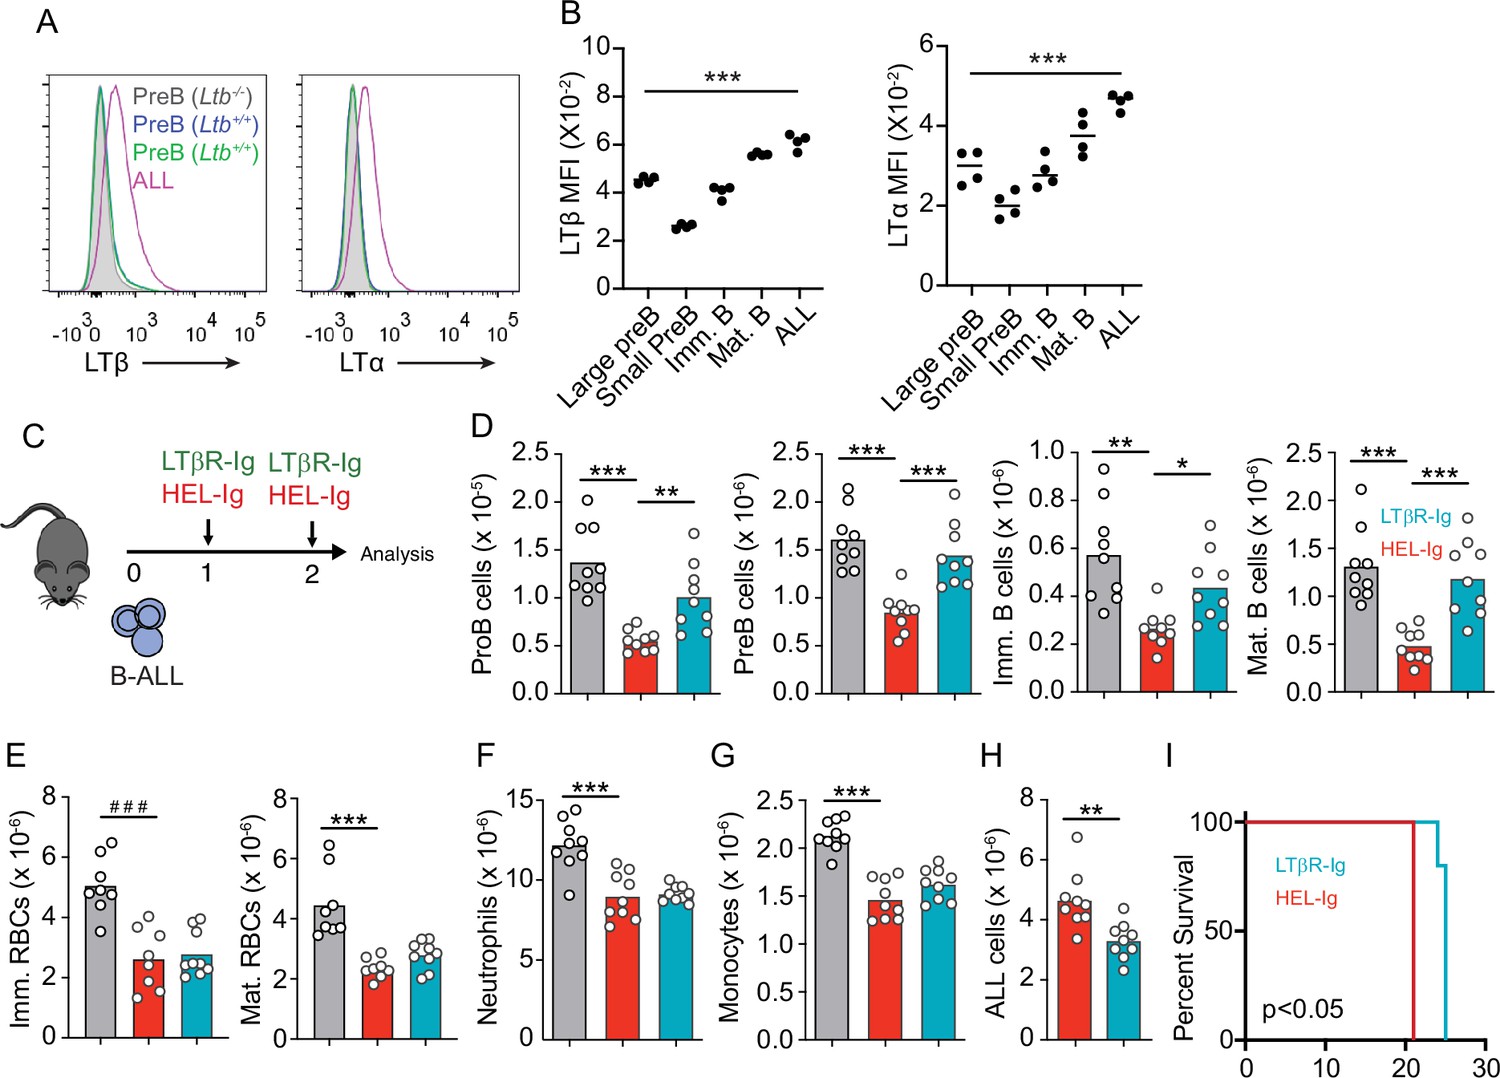
Lymphotoxin α1β2 expression in B-ALL cells and therapeutic effect of lymphotoxin beta receptor (LTβR) blocking.
(A) Histograms of LTα and LTβ expression in B-ALL cells and in pre-B cells. Purple, B-ALL; green, non-malignant pre-B cells (CD19+CD93+IgM-cKit-) in bone marrow (BM) of wild-type (WT) mice transplanted with B-ALL cells; blue, non-malignant pre-B cells in BM of WT mice (no B-ALL); filled gray, non-malignant Ltb-deficient pre-B cells in BM of Ltb-/- mice. (B) LTα and LTβ mean fluorescence intensity (MFI) in developing B cells and ALLs isolated from BM of ALL transplanted mice. (C) Experimental design of data described in panels D–H. (D) Number of non-malignant developing B cell subsets in BM. (E) Immature and mature erythrocyte number. (F) Neutrophils. (G) Monocytes. (H) B-ALL number. Data in panels D–H show BM numbers from WT mice transplanted with 3×10⁶ BCR-ABL-expressing B-ALL cells and treated with HEL-Ig or LTβR-Ig (150 µg/mouse) on day 0 and day 5; mice were analyzed on day 8 post ALL transplantation. (I) Frequency of mouse survival after B-ALL transplantation following pre-treatment with either HEL-Ig or LTβR-Ig (n=5 per group). Mice were treated with HEL-Ig or LTβR-Ig (150 µg/mouse) every 5 days until endpoint. Bars indicate mean, circles depict individual mice. Data are representative of two independent experiments. *p<0.05; **p<0.005; ***p<0.0005 unpaired, two-sided, Student’s t test. ###p<0.0005 Mann–Whitney test.
Figure 2—figure supplement 1
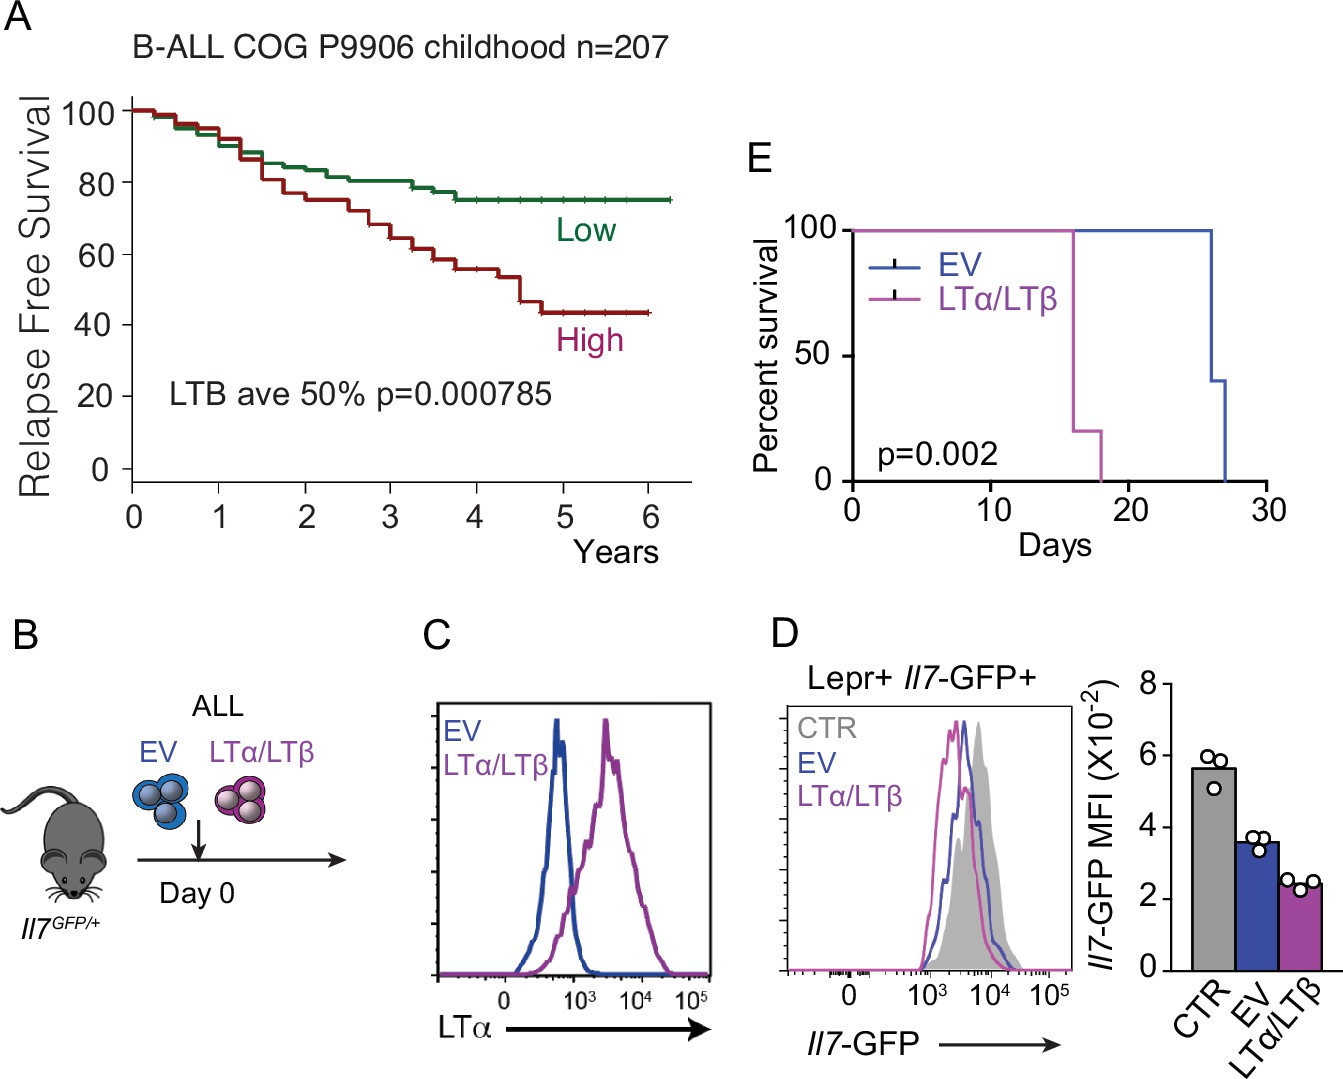
Relationship between lymphotoxin α1β2 abundance and acute lymphoblastic leukemia (ALL) lethality.
(A) mRNA levels of LTB were analyzed in microarray datasets (COG P9906) and associated with clinical outcome. Patients in each group were segregated into higher- versus lower-than-median LTB mRNA levels. Kaplan–Meier plot shows relapse-free survival probability. Mantel–Cox log-rank tests (two-sided) were used to determine statistical significance. Y-axes indicate time (years). (B) Experimental design: impact of LTαβ over-expression in ALL lethality. (C) Histogram of LTα expression in empty vector (EV, blue) and LTαβ transduced (pink) ALL cells. (D) Il7-GFP expression in mesenchymal stem cells (MSCs) of mice engrafted with non-transduced (CTR, gray), empty vector (EV, blue), and LTαβ transduced (pink) ALL cells. (E) Survival frequency of mice engrafted with empty vector (EV, blue) or LTαβ transduced (pink) ALL cells (n=5 per group).
Figure 3 with 1 supplement
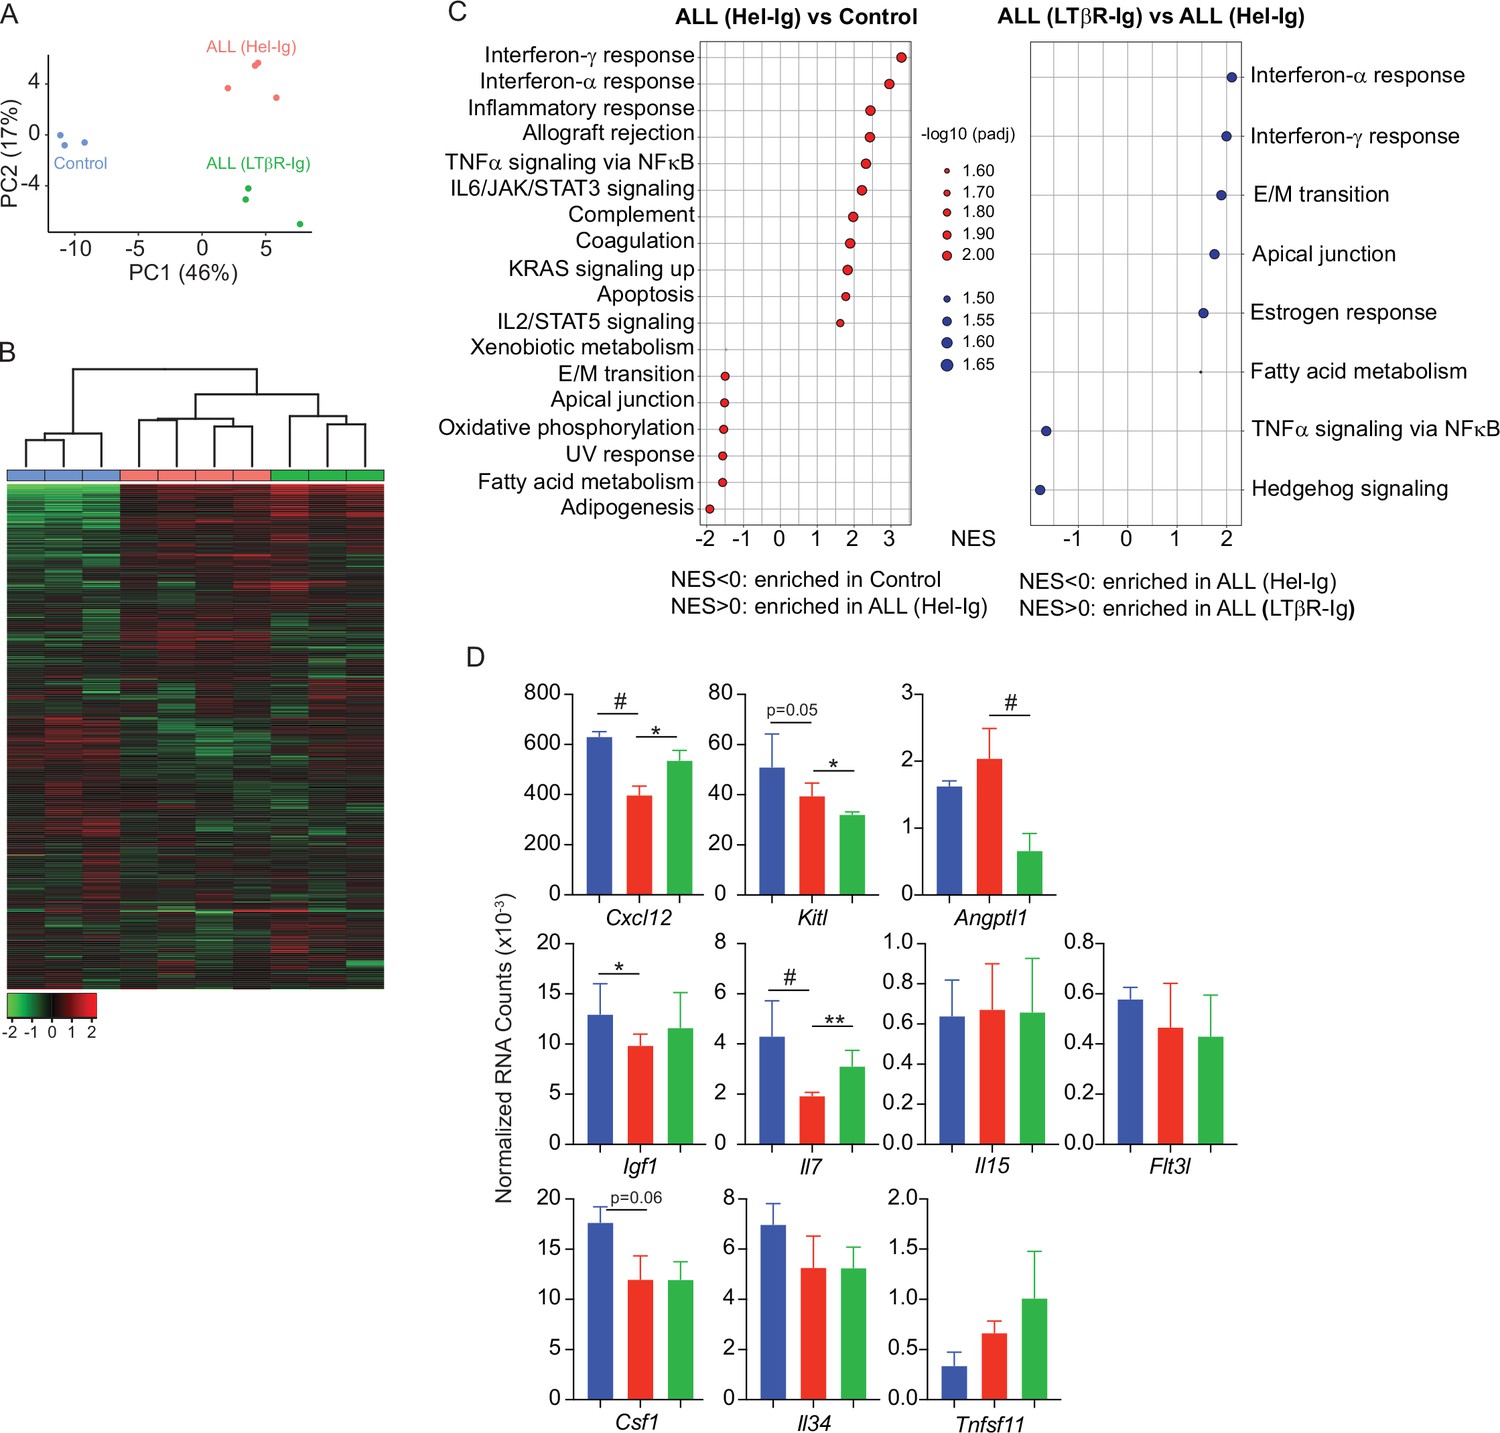
Lymphotoxin beta receptor (LTβR)-dependent and -independent transcriptomic changes in mesenchymal stem cells (MSCs) induced by B-ALL.
(A) Principal component analysis (PCA) distribution plot. (B) Unsupervised hierarchical clustering and heatmap representation of top 1000 differentially expressed genes. (C) GSEA-KEGG pathway alterations in MSCs. (D) Hematopoietic cytokines and chemokine mRNA expression. Data in all panels were generated from analyses of MSC bulk RNA sequencing. *p<0.05; **p<0.005; unpaired, two-sided, Student’s t test. ALL, acute lymphoblastic leukemia.
Figure 3—figure supplement 1
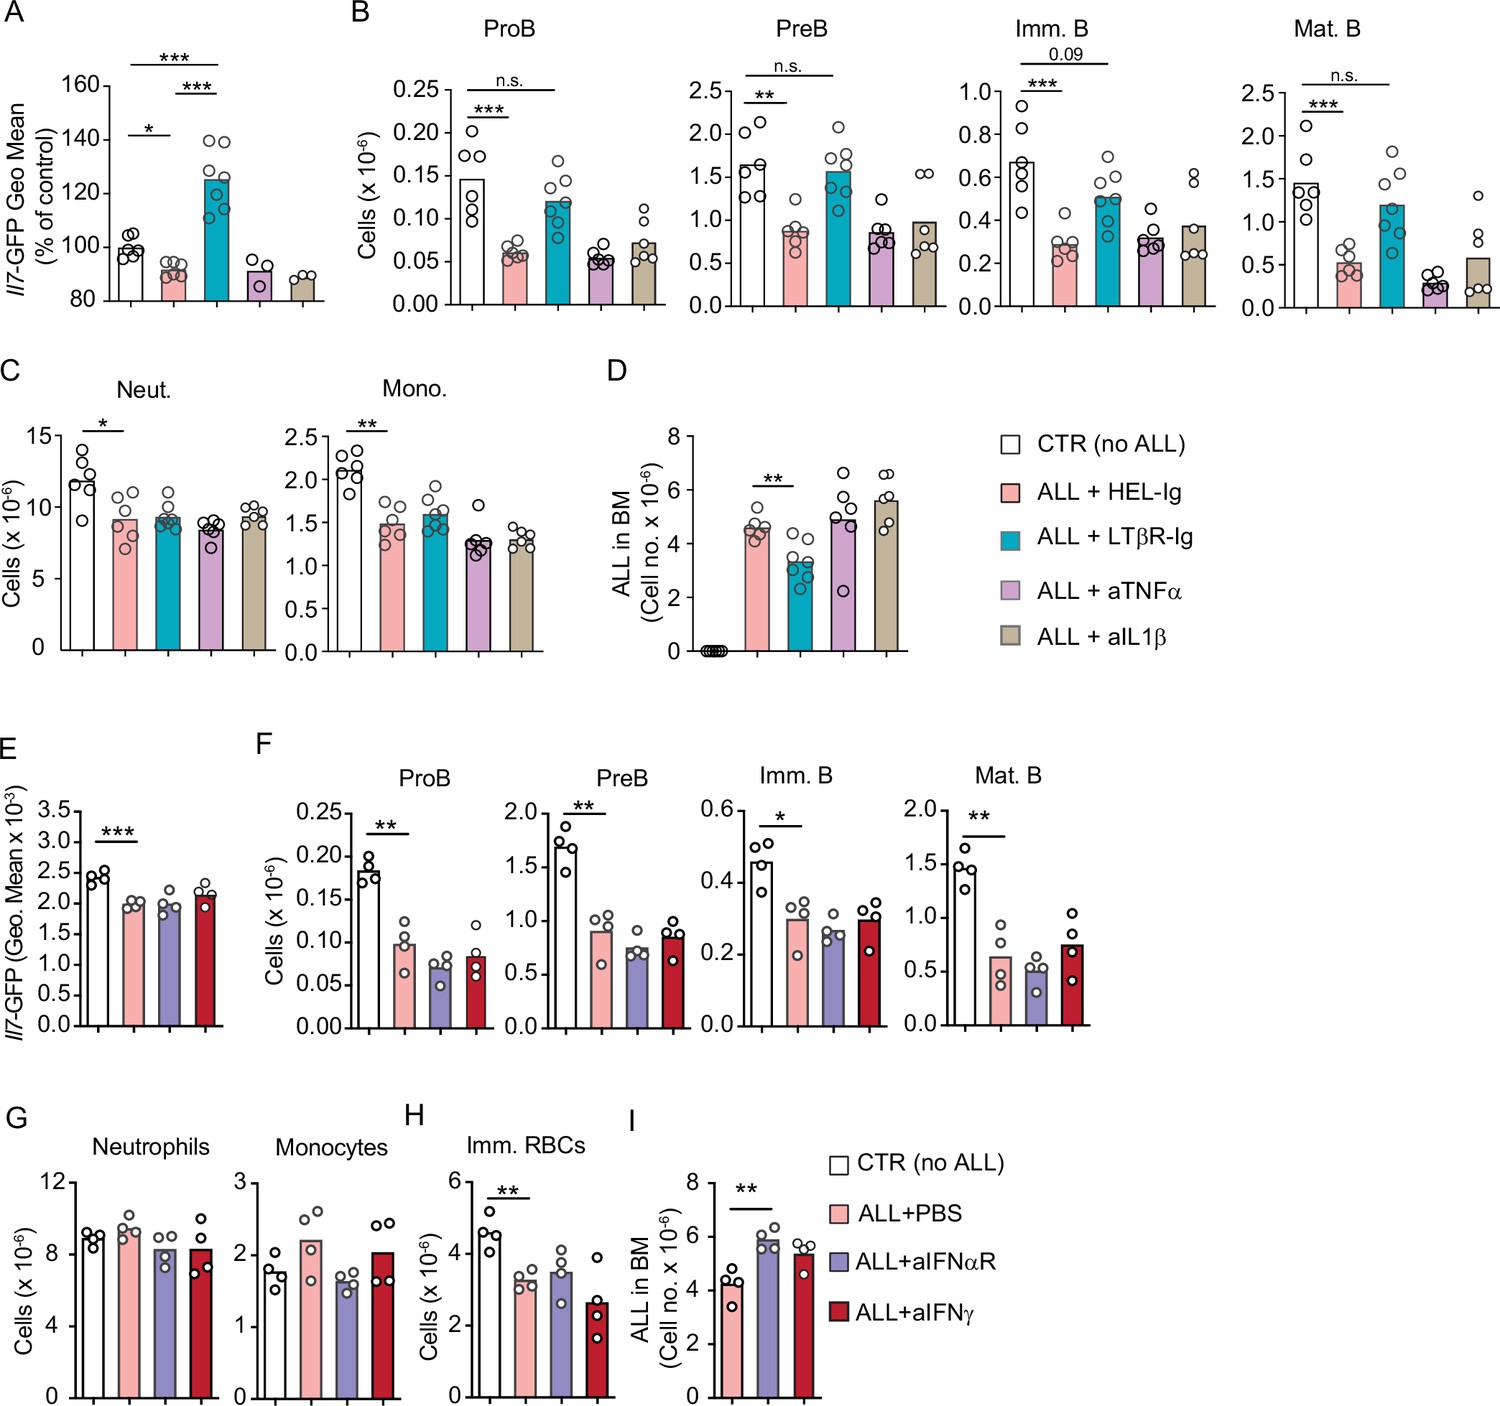
Effect of inflammatory cytokines in acute lymphoblastic leukemia (ALL) growth.
(A–D) Comparison between control (Hel-Ig), lymphotoxin beta receptor (LTβR), TNFα, and IL1β blocking in ALL and non-malignant hematopoiesis. (A) Il7-GFP expression in mesenchymal stem cells (MSCs). (B) Number of non-malignant developing B cell subsets in bone marrow. (C) Neutrophil and monocyte numbers. (D) ALL cell number in bone marrow. (E–I) Comparison between control (PBS), IFNαR, and IFNγ blocking in ALL and non-malignant hematopoiesis. (E) Il7-GFP expression in MSCs. (F) Number of non-malignant developing B cell subsets in bone marrow. (G) Neutrophil and monocyte numbers. (H) Ter119+CD71+ immature RBC numbers. (I) ALL cell number in bone marrow. Mice transplanted with 3×10⁶ BCR-ABL-expressing B-ALL cells and treated with the indicated reagents (150 µg/mouse) on day 0 and day 5; mice were analyzed on day 8. Bars indicate mean, circles depict individual mice. Data are representative of two independent experiments. *p<0.05; **p<0.005; ***p<0.0005 unpaired, two-sided, Student’s t test.
Figure 4 with 1 supplement
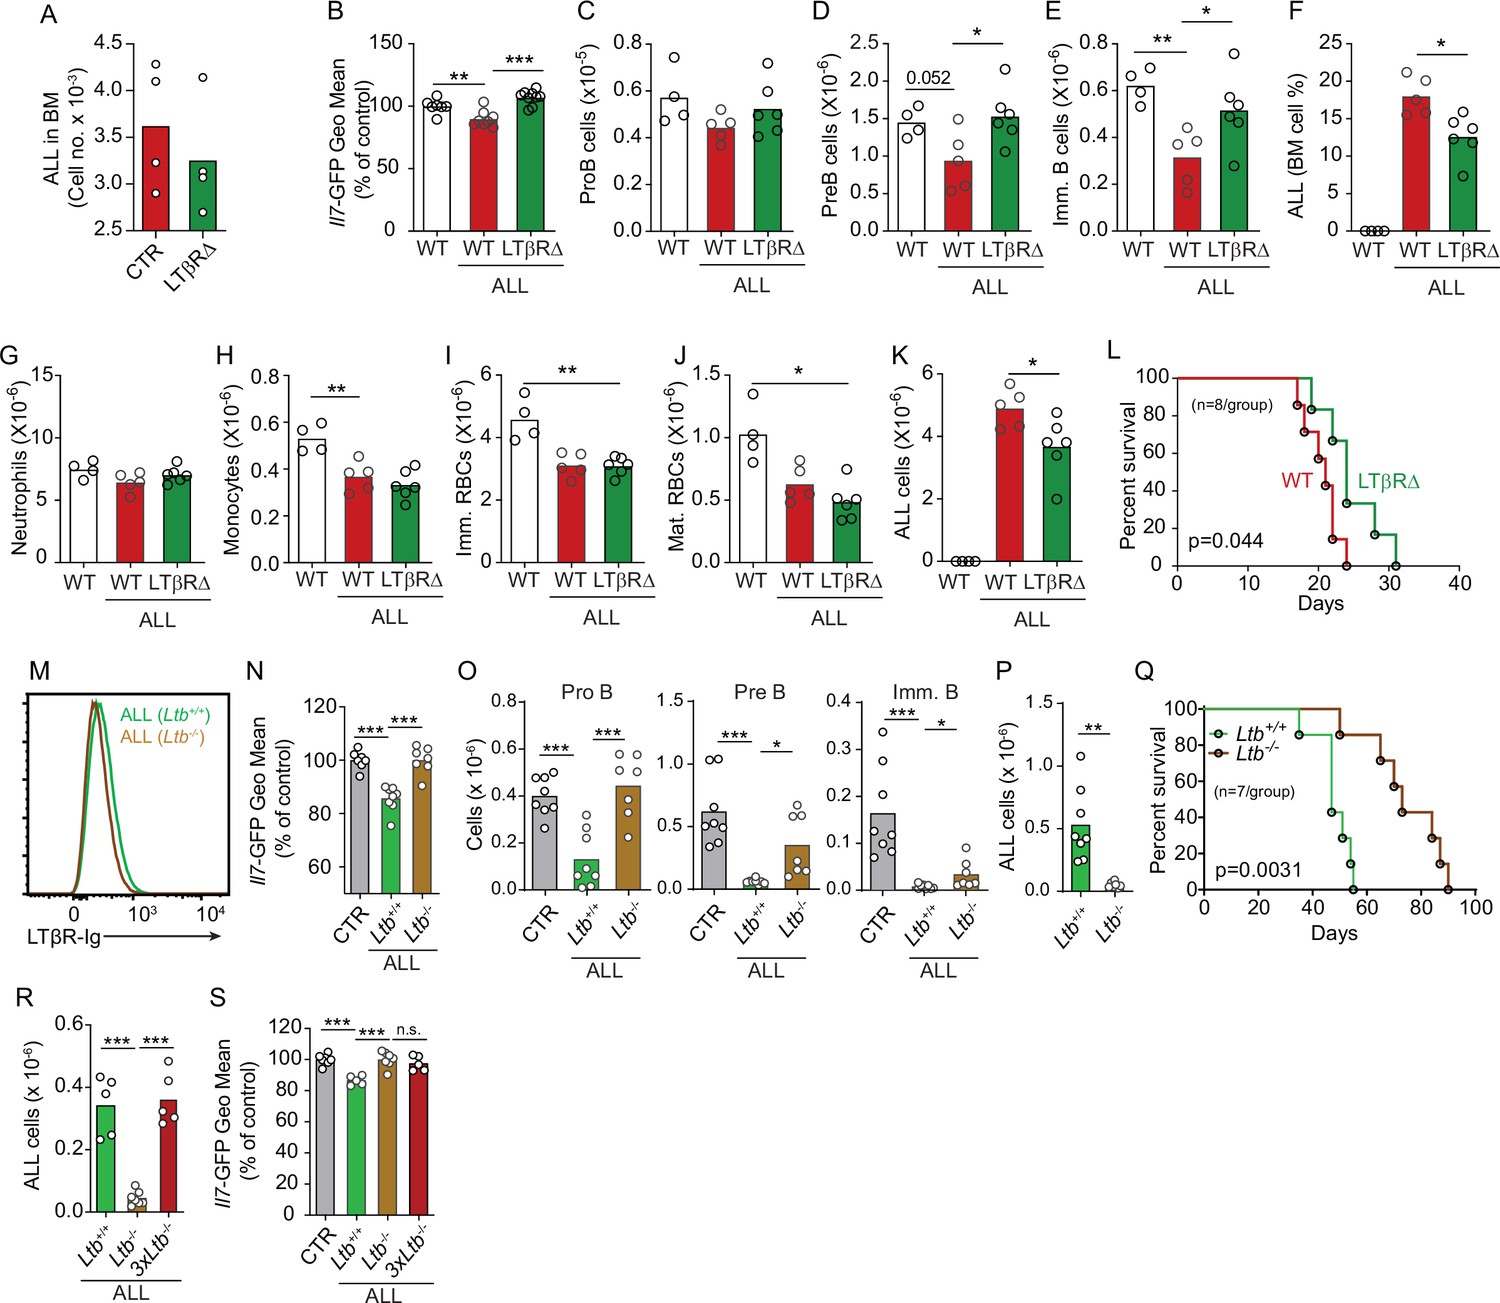
Effects of mesenchymal stem cell (MSC)-intrinsic lymphotoxin beta receptor (LTβR) signaling in lymphopoiesis and B-ALL growth.
(A) Measurements of ALL homing to the bone marrow (BM): 3×10⁶ BCR-ABL ALLs were transferred into control (red) or LTβR∆ (green) mice and allowed to home into the BM for 24 hr. (B) Il7-GFP expression in MSCs. (C–E) Number of non-malignant developing B cell subsets. (C) ProB cells. (D) Pre-B cells. (E) Immature B cells. (F) B-ALL frequency in BM. (G–K) Myeloid and erythroid cell numbers in BM. (G) Neutrophils. (H) Monocytes. (I) Immature RBCs. (J) Mature RBCs. (K) Total ALL number. (L) Probability of wild-type (WT) or LTβR∆ mouse survival after B-ALL transplantation (n=8 mice/group). Mice were transplanted with 3×10⁶ BCR-ABL-expressing B-ALL cells and analyzed on day 8 after transplantation. (M) Histogram of LTβR ligand expression in ALL cells. Green, Ltb-sufficient; brown, Ltb-deficient. (N) Il7-GFP expression in MSCs. (O) Number of non-malignant developing B cell subsets. (P) ALL number. (Q) Frequency of WT mouse survival after Ltb-deficient or Ltb-sufficient ALL transplantation (n=7/group). (R and S) Effects of Ltb-expressing ALLs in MSCs. (R) Ltb+/+ and Ltb-/- B-ALL numbers in BM 3 weeks after transplantation into Il7GFP/+ mice. (S) Il7-GFP expression in MSCs. Gray bar indicates control Il7GFP/+ mice (no ALL); green bar represents Il7GFP/+ mice recipient of 3×10⁶ Ltb+/+ ALLs; brown bar indicates Il7GFP/+ mice recipient of 3×10⁶ Ltb-/- ALLs; red bars depict Il7GFP/+ mice recipient of 9×10⁶ Ltb-/- ALLs (3×Ltb-/-). Bars indicate mean, circles depict individual mice. Data in all panels are representative of two independent experiments. *p<0.05; **p<0.005; ***p<0.0005 unpaired, two-sided, Student’s t test. ALL, acute lymphoblastic leukemia.
Figure 4—figure supplement 1
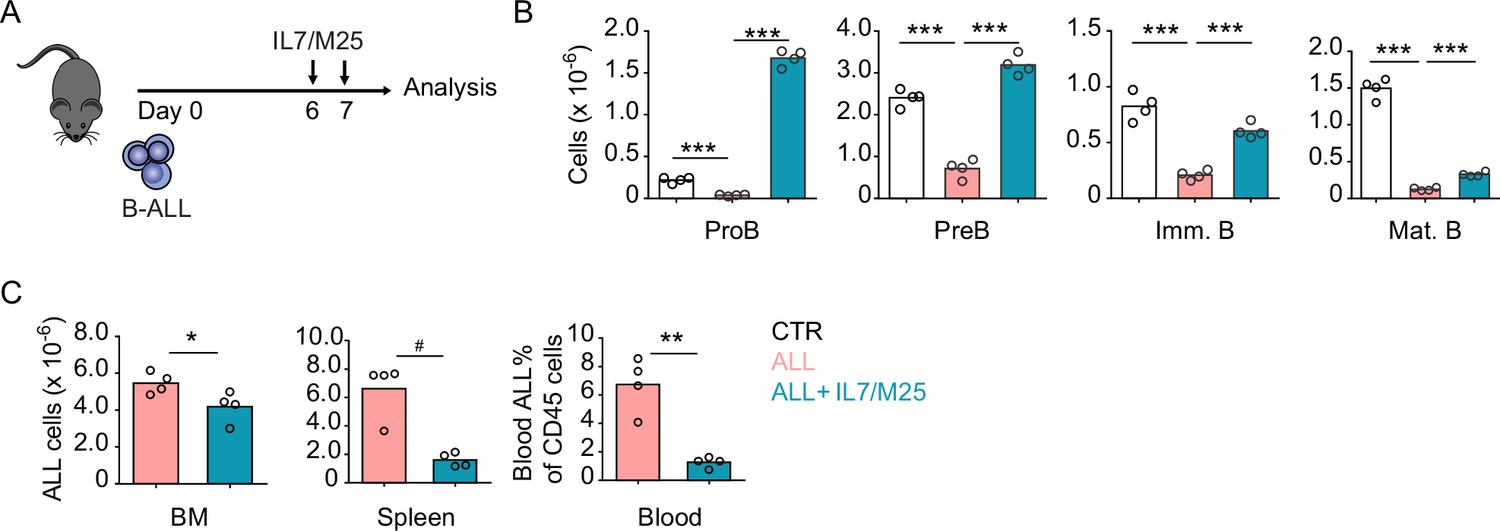
Effects of IL7 administration in acute lymphoblastic leukemia (ALL) and non-leukemic lymphopoiesis in vivo.
(A) Experimental design of data described in panels B–C. Mice were transplanted with 3×10⁶ ALLs and treated with IL7/aIL7 antibody complex (1.5 µg/15 µg, respectively) i.v. on days 6 and 7; mice were analyzed on day 9. (B) Number of non-malignant developing B cell subsets in bone marrow (BM). (C) Total ALL number in BM (left), spleen (middle), and B-ALL percentage in peripheral blood (right). Data are representative of two independent experiments. *p<0.05; **p<0.005; ***p<0.0005 unpaired, two-sided, Student’s t test. #p<0.05 Mann–Whitney test.
Figure 5 with 2 supplements
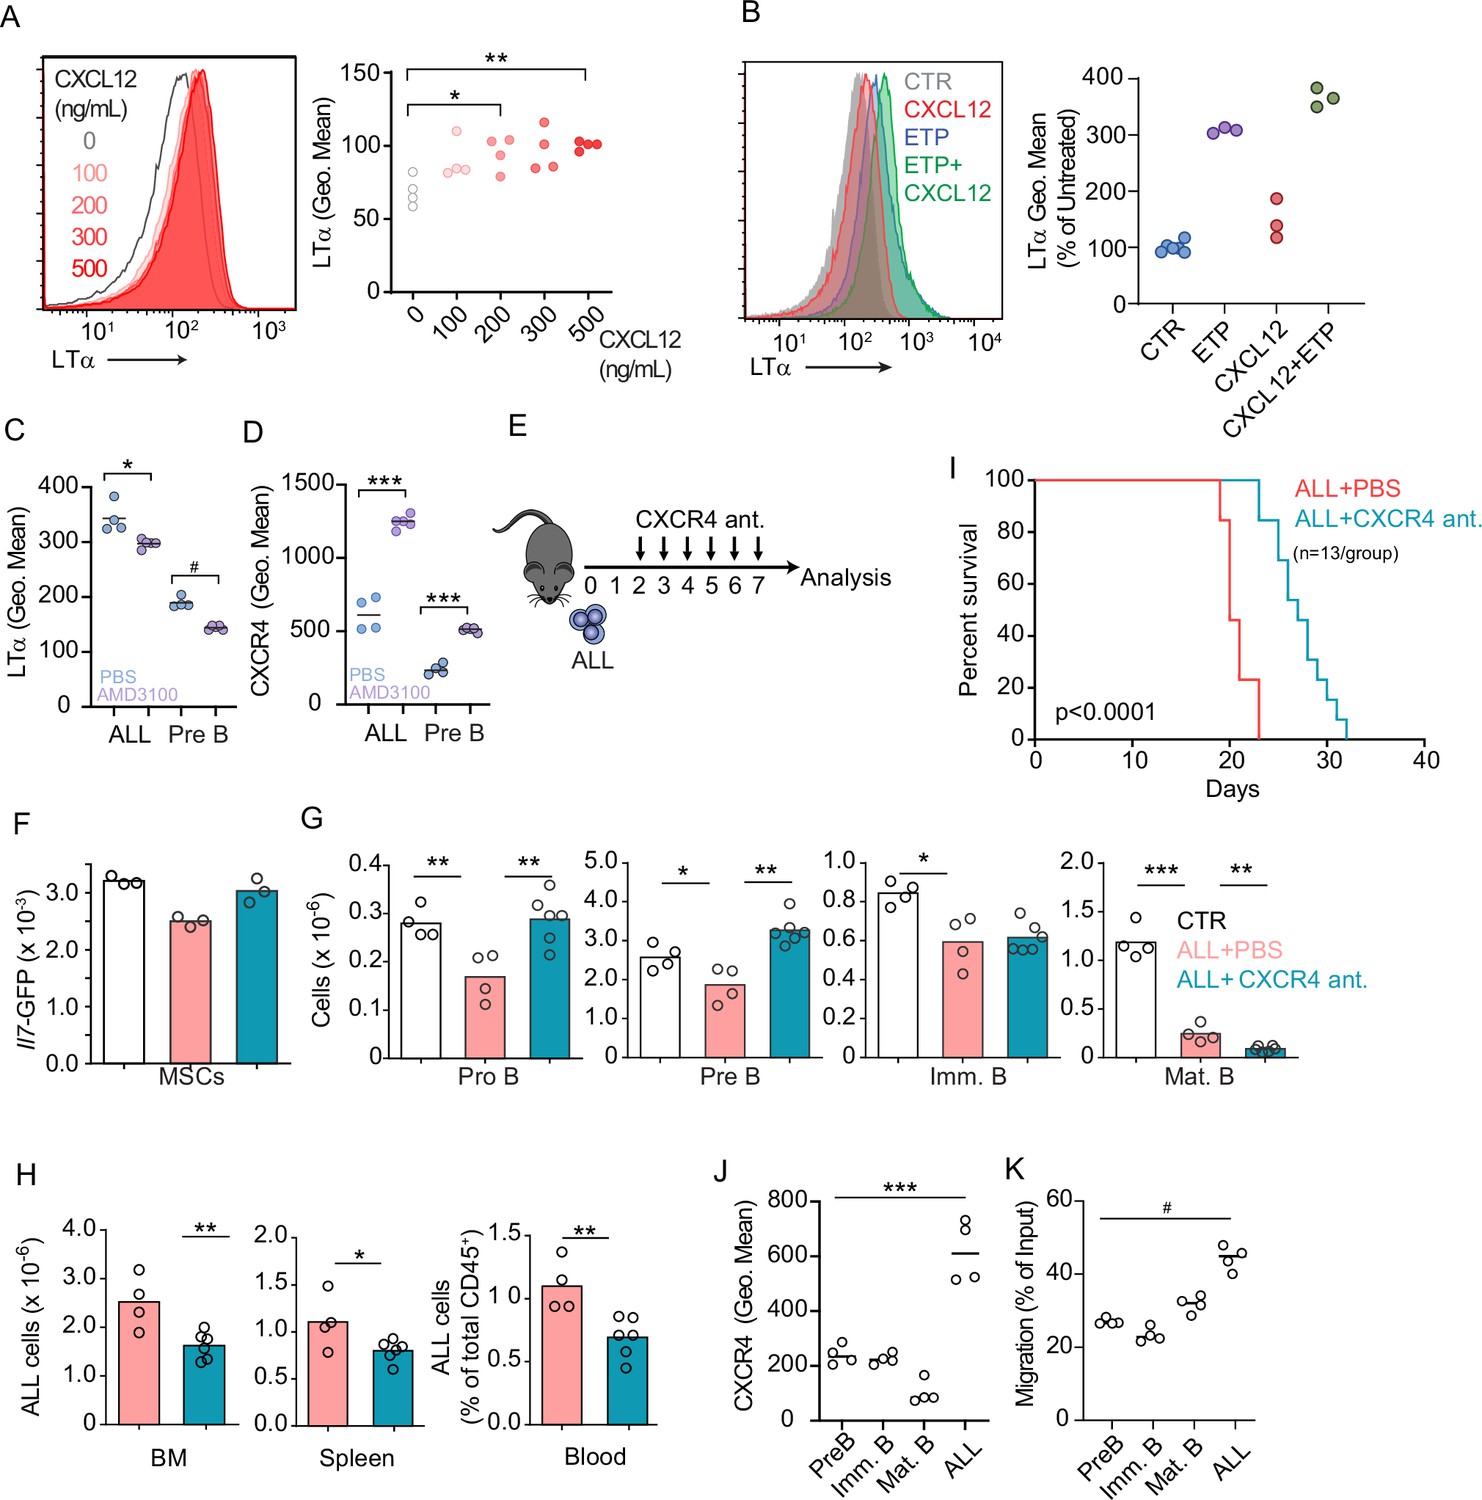
CXCR4 signaling and its impact on acute lymphoblastic leukemia (ALL) growth in vivo.
(A) Histograms of LTα expression in B-ALL cells treated for 16 hr with CXCL12 at the indicated concentrations in vitro. (B) Histograms of LTα expression and geometric mean intensity (plotted as percent of untreated cells) in B-ALL cells treated with Etoposide (ETP, 1 µM) alone or in combination with CXCL12 (500 ng/mL) in vitro. (C and D) LTα (C) and CXCR4 expression (D) in ALLs and non-leukemic pre-B cells in the bone marrow (BM) of mice transplanted with 3×10⁶ Ltb+/+ BCR ABL ALLs. ALLs were allowed to expand in vivo for 7 days. Mice were treated with saline or AMD3100 (80 µg/mouse/i.v.) 18 hr prior to sacrifice. (E) Experimental design of data described in panels F–H. Mice were transplanted with 3×10⁶ BCR-ABL-expressing B-ALL cells and treated daily with CXCR4 antagonist starting on day 2 and until day 7; mice were analyzed on day 8. (F) Il7-GFP expression in mesenchymal stem cells (MSCs). (G) Number of non-malignant developing B cell subsets. (H) Total ALL number in BM (left), spleen (middle), and B-ALL percentage in peripheral blood (right). (I) Frequency of mouse survival after B-ALL transplantation into mice treated with vehicle or CXCR4 antagonist (n=13/group). (J) CXCR4 expression on developing B cells and ALLs in BM. (K) In vitro chemotaxis of developing B cells and ALLs. Data in panels J and K are from BM of mice 1 week after ALL transplantation. Data are representative of two independent experiments. *p<0.05; **p<0.005; ***p<0.0005 unpaired, two-sided, Student’s t test. #p<0.05 Mann–Whitney test.
Figure 5—figure supplement 1
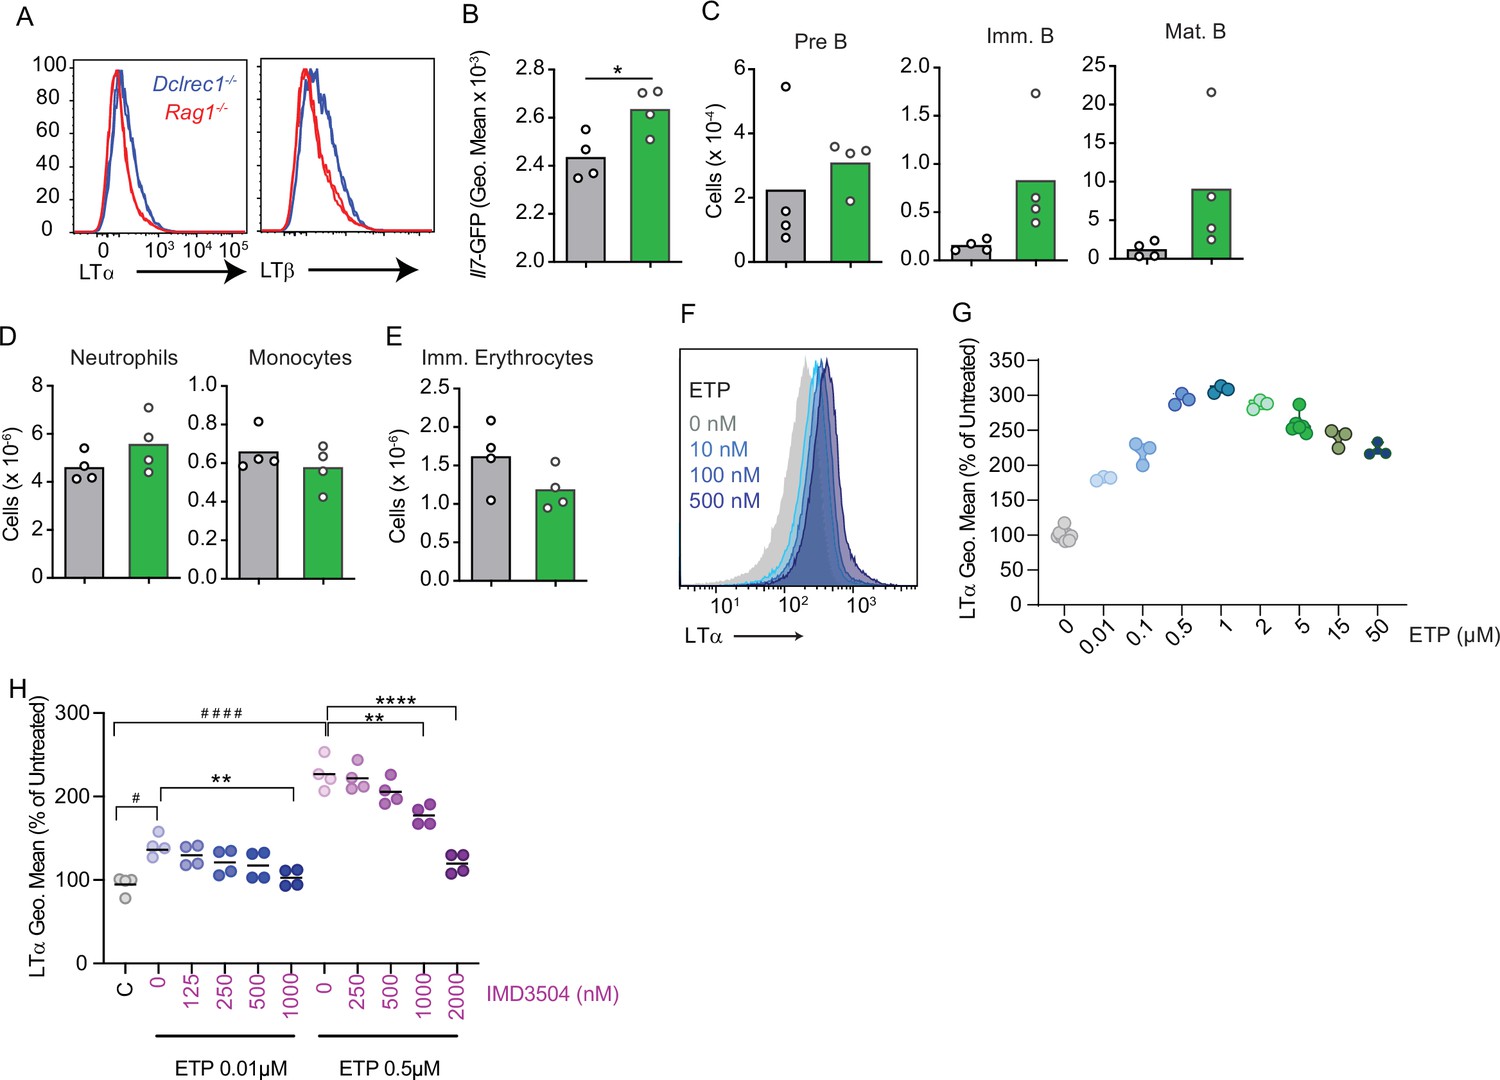
Regulation of Lymphotoxin α1β2 expression by the DNA damage response pathway.
(A) Lethally irradiated wild-type (WT) mice were reconstituted with Rag1-deficient Igh-tg (red) or Artemis (Dclrec1)-deficient Igh-tg bone marrow. Histograms of LTα and LTβ expression in Rag1-deficient Igh-tg pre-B (red) and Artemis (Dclrec1)-deficient Igh-tg pre-B cells (blue). (B–E) Lethally irradiated Il7GFP/+ LeprCreCre/+ Ltbrflfl/fl (green) and Il7GFP/+ Lepr+/+ Ltbrflfl/fl (gray) mice were reconstituted with bone marrow from Artemis (Dclrec1)-deficient Igh-tg mice. (B) Il7-GFP expression in MSCs. (C) Developing B cell numbers in bone marrow. (D) Neutrophil and monocyte numbers. (E) Ter119+CD71+ immature RBC numbers. Bars indicate mean, circles depict individual mice. (F) Histograms of LTα expression in B-ALL cells treated with Etoposide (ETP) at the indicated concentrations in vitro. (G) LTα geometric mean fluorescence in cells described in panel F plotted as percent of untreated cells. (H) Geo. mean intensity of LTα expression in acute lymphoblastic leukemias (ALLs) treated in vitro with and without Etoposide and IKKβ inhibitor IMD 3504 for 16 hr. Data are representative of two independent experiments. *p<0.05; **p<0.005; unpaired, two-sided, Student’s t test; panel H column A versus B Mann–Whitney test; #p<0.05; ####p<0.0001.
Figure 5—figure supplement 2
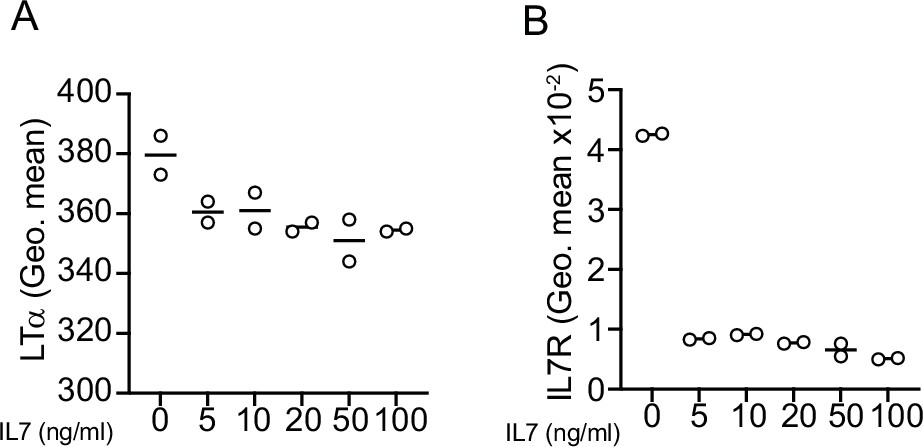
Effects of IL7 on lymphotoxin α1β2 expression.
(A) LTa expression on acute lymphoblastic leukemias (ALLs) treated with IL7 in vitro for 24 hr measured by flow cytometry. (B) IL7Ra expression on ALLs treated with IL7 in vitro for 24 hr measured by flow cytometry.
Figure 6 with 1 supplement
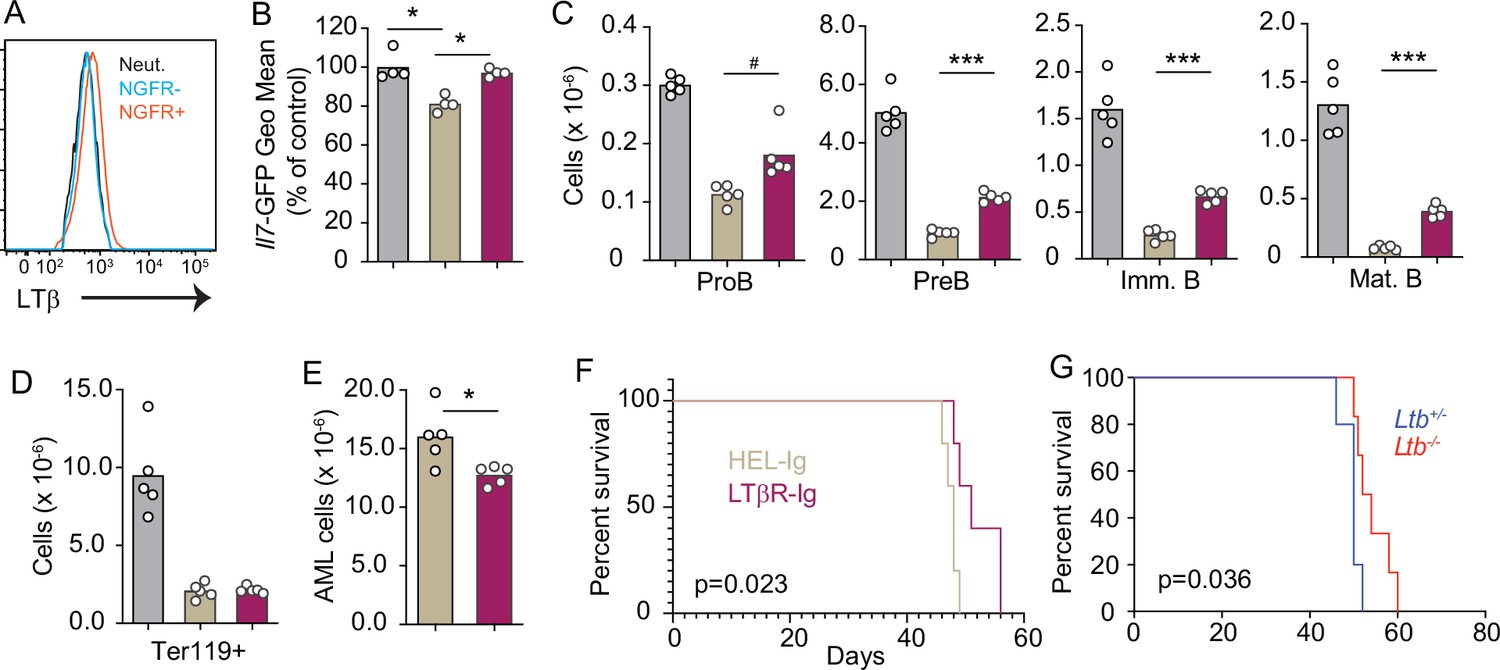
Lymphotoxin α1β2 expression in acute myeloblastic leukemias (AMLs) and therapeutic effect of lymphotoxin beta receptor (LTβR) blocking.
(A) Histograms of LTβ expression in AML cells (NGFR+, red), in non-malignant myeloid cells (NGFR-, blue) and in non-malignant neutrophils (Net., black). (B) Il7-GFP expression in mesenchymal stem cells (MSCs). (C) Number of non-malignant developing B cell subsets in bone marrow. (D) Ter119+ red blood cell number. (E) AML cell number in bone marrow. (F) Probability of mouse survival after AML transplantation following pre-treatment with either HEL-Ig or LTβR-Ig (n=5 per group). (G) Probability of mouse survival after Ltb-deficient or sufficient AML transplantation (n=10 per group). In panels B–G, comparisons between control (no AML, gray), AML treated with Hel-Ig (peach gray), and AML treated with LTβR-Ig (wine red). Bars indicate mean, circles depict individual mice. Data are representative of two independent experiments. *p<0.05; ***p<0.0005 unpaired, two-sided, Student’s t test. #p<0.05 Mann–Whitney test.
Figure 6—figure supplement 1
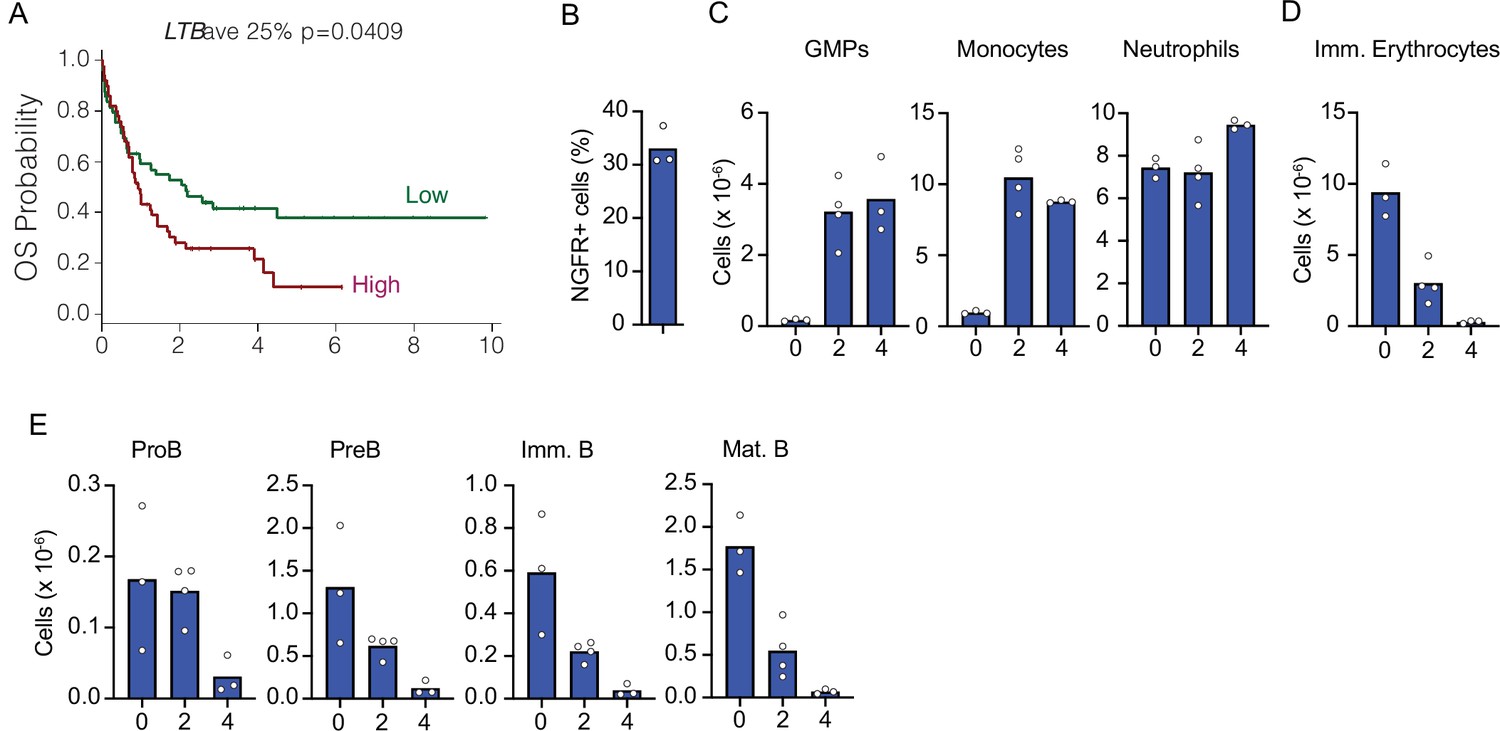
Kinetics of acute myeloblastic leukemia (AML) growth and disruption of non-malignant hematopoiesis.
(A) mRNA levels of LTB were analyzed in microarray datasets (COG P9906) and associated with clinical outcome. Patients in each group were segregated into higher- versus lower-than-median LTB mRNA levels. Kaplan–Meier plot shows relapse-free survival probability. Mantel–Cox log-rank tests (two-sided) were used to determine statistical significance. Y-axes indicate time in years. (B) Frequency of NGFR+AMLs in bone marrow 4 weeks after MLL-AF9 induction. (C–E) Changes in bone marrow hematopoiesis during AML growth. (C) Granulocyte/monocyte progenitors, monocytes, and neutrophils. (D) Ter119+CD71+ immature red blood cells. (E) Number of non-malignant developing B cell subsets in bone marrow. In panels C–E, X-axis indicates time in weeks. Bars indicate mean, circles depict individual mice. Data are representative of two independent experiments.
Additional files
-
Supplementary file 1
Acute lymphoblastic leukemia (ALL)-induced gene expression changes in Lepr+ mesenchymal stem cells (MSCs).
Differentially expressed genes analyzed by bulk RNA-sequencing of Lepr+ MSPCs isolated from resting wild-type (WT) mice or Hel-Ig treated WT mice transplanted with ALL cells for 2 weeks. Related to Figure 3.
- https://cdn.elifesciences.org/articles/83533/elife-83533-supp1-v2.xlsx
-
Supplementary file 2
Lymphotoxin beta receptor (LTβR)-regulated genes in Lepr+ MSPCs during acute lymphoblastic leukemia (ALL) progression.
Differentially expressed genes analyzed by bulk RNA-sequencing of Lepr+ MSPCs isolated from ALL transplanted wild-type mice treated with control or LTβR-Ig (100 µg/mouse/week) for 2 weeks. Related to Figure 3.
- https://cdn.elifesciences.org/articles/83533/elife-83533-supp2-v2.xlsx
-
Supplementary file 3
List of antibodies used in this study.
- https://cdn.elifesciences.org/articles/83533/elife-83533-supp3-v2.xlsx
-
Supplementary file 4
Shapiro–Wilk normality test of the experimental groups examined.
- https://cdn.elifesciences.org/articles/83533/elife-83533-supp4-v2.xlsx
-
MDAR checklist
- https://cdn.elifesciences.org/articles/83533/elife-83533-mdarchecklist1-v2.docx
Download links
A two-part list of links to download the article, or parts of the article, in various formats.
Downloads (link to download the article as PDF)
Open citations (links to open the citations from this article in various online reference manager services)
Cite this article (links to download the citations from this article in formats compatible with various reference manager tools)
Cell circuits between leukemic cells and mesenchymal stem cells block lymphopoiesis by activating lymphotoxin beta receptor signaling
eLife 12:e83533.
https://doi.org/10.7554/eLife.83533


