A concerted mechanism involving ACAT and SREBPs by which oxysterols deplete accessible cholesterol to restrict microbial infection
- Department of Microbiology, The University of Texas Southwestern Medical Center, United States
- Department of Molecular Genetics, The University of Texas Southwestern Medical Center, United States
Figures
Figure 1 with 5 supplements
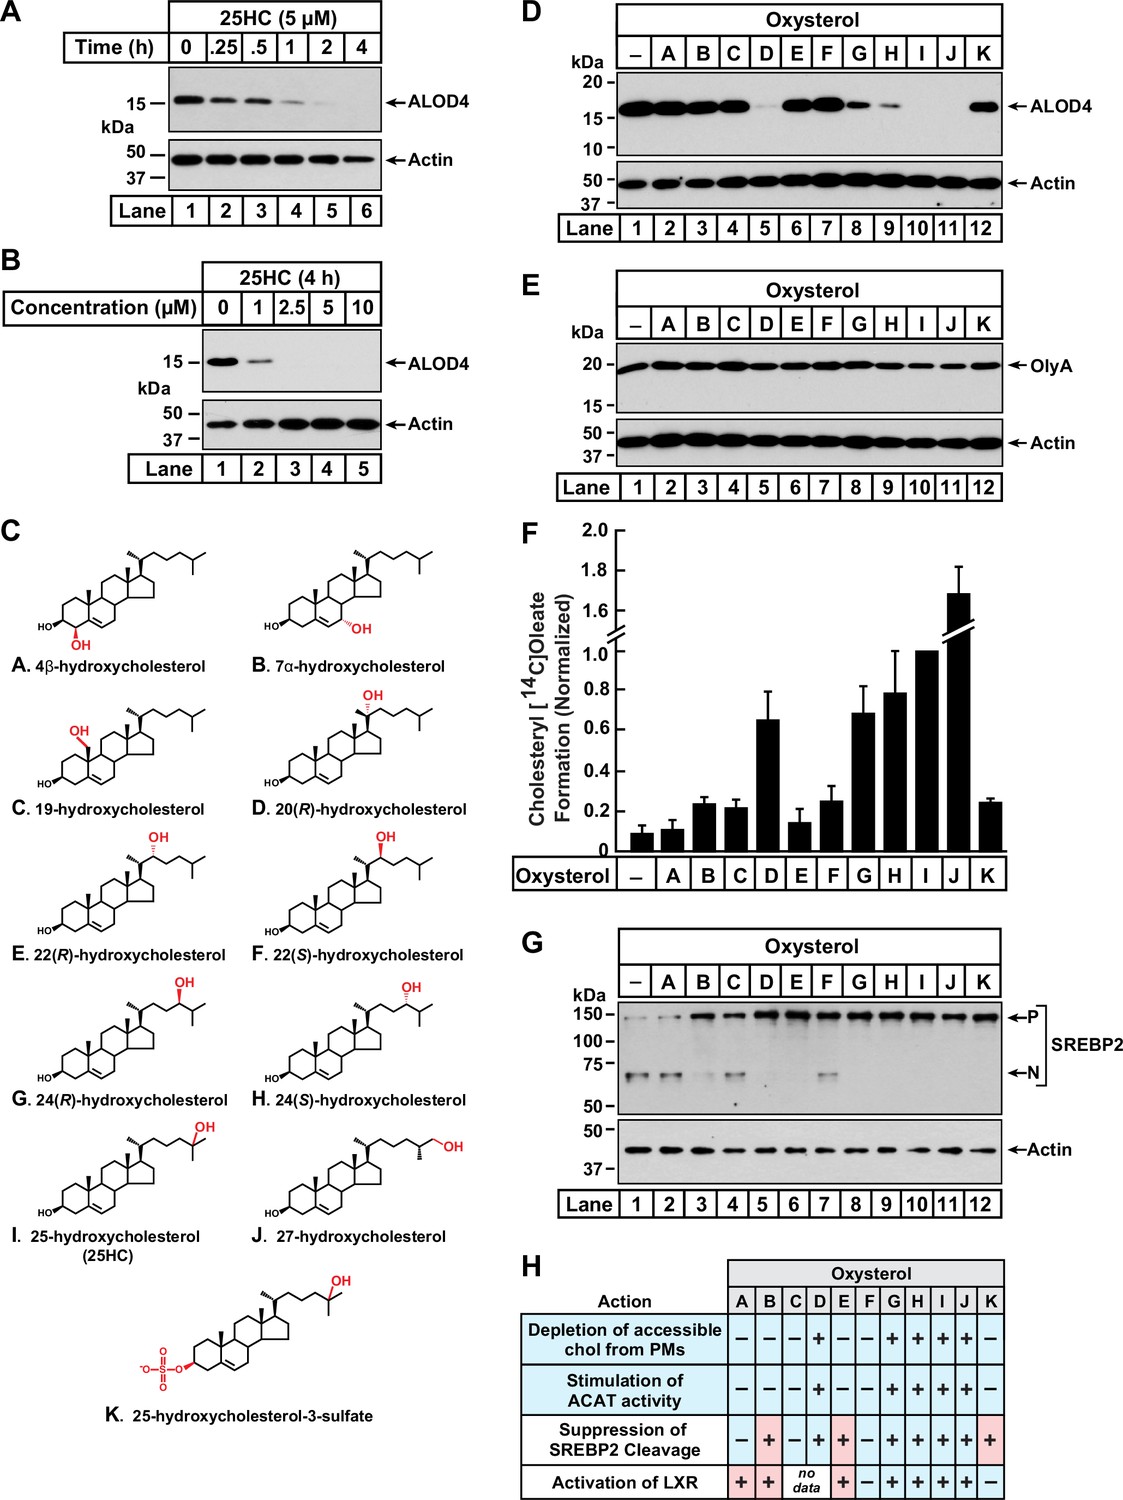
Comparison of oxysterol specificities for effects on PM cholesterol pools, stimulation of ACAT activity, and suppression of SREBP-2 cleavage.
(A, B) Time course and dose curve analysis of 25HC treatment. On day 0, CHO-K1 cells were set up in medium B at a density of 6x10⁴ cells per well of a 48-well plate. On day 1, media was removed, cells were washed twice with 500 µl of PBS followed by addition of 200 µl of medium B supplemented with either 5 µM of 25HC (A) or the indicated concentrations of 25HC (B). After incubation at 37 °C for either the indicated times (A) or 4 h (B), media was removed and replaced with 200 µl of medium B supplemented with 3 µM His6-Flag-ALOD4. After incubation at 37 °C for 30 min, cells were washed twice with 500 µl of PBS, harvested, and equal aliquots of cell lysates were subjected to immunoblot analysis as described in Materials and Methods. (C) Chemical structures of oxysterols tested in this study. Differences from cholesterol are highlighted in red. (D, E) Effects on PM cholesterol pools. On day 0, CHO-K1 cells were set up in medium B at a density of 6x10⁴ cells per well of a 48-well plate. On day 1, media was removed, cells were washed twice with 500 µl of PBS followed by addition of 200 µl of medium B supplemented with 5 µM of the indicated oxysterol. After incubation at 37 °C for 4 hr, media was removed and replaced with 200 µl of medium B supplemented with 3 µM of either His6-Flag-ALOD4 (D, top panel) or OlyA-His6 (E, top panel). After incubation at 37 °C for 30 min, cells were washed twice with 500 µl of PBS, harvested, and equal aliquots of cell lysates were subjected to immunoblot analysis as described in Materials and methods. Quantification of the immunoblots are shown in Figure 1—figure supplement 1. (F) ACAT activity. On day 0, CHO-K1 cells were set up in medium B at a density of 2.5x10⁵ cells per 60 mm dish. On day 2, media was removed, cells were washed twice with 1 ml of PBS followed by addition of 2 ml of cholesterol-depleting medium C. On day 3, media was removed, cells were washed with 1 ml of PBS followed by addition of 1 ml of medium C supplemented with 5 µM of the indicated oxysterol. After incubation at 37 °C for 1 hr, each dish was supplemented with 0.2 mM sodium [14C]oleate (6500 dpm/nmol) and incubated at 37 °C for an additional 2 hr, after which cells were harvested, and levels of cholesteryl [14C]oleate were measured as described in Materials and methods. Each column represents the mean of cholesterol esterification measurements from three or more independent experiments, and error bars show the standard error. The mean value for cholesterol esterification obtained after 25HC treatment (3.18 nmol/mg/h; n=6; standard error = ± 0.49 nmol/mg/h) was set to 1 and all other values were normalized relative to this set-point. (G) SREBP-2 cleavage. On day 0, CHO-K1 cells were set up in medium B at a density of 6x10⁴ cells per well of a 48-well plate. On day 1, media was removed, cells were washed twice with 500 µl of PBS followed by addition of 200 µl of cholesterol-depleting medium C supplemented with 1% (w/v) HPCD. After incubation at 37 °C for 1 hr, media was removed, cells were washed twice with 500 µl of PBS and then treated with 200 µl of medium C supplemented with 5 µM of the indicated oxysterol. After incubation at 37 °C for 4 hr, cells were washed twice with 500 µl of PBS, harvested, and equal aliquots of cell lysates were subjected to immunoblot analysis as described in Materials and Methods. P, precursor form of SREBP2; N, cleaved nuclear form of SREBP2. Quantification of the immunoblots are shown in Figure 1—figure supplement 5. (H) Summary of oxysterol specificities for depletion of accessible cholesterol from PMs, suppression of SREBP2 cleavage, activation of LXR transcription factors, and stimulation of ACAT activity. The degree of effect (maximal or minimal) is denoted by +and –, respectively. Specificities that are different from that for depletion of accessible cholesterol from PMs (first row) are shaded red.
-
Figure 1—source data 1
Western blots corresponding to Figure 1A, B, D, E and G.
- https://cdn.elifesciences.org/articles/83534/elife-83534-fig1-data1-v3.zip
-
Figure 1—source data 2
Data supporting Figure 1F and Figure 1—figure supplements 1B, C; 3A, B; 4B; and 5.
- https://cdn.elifesciences.org/articles/83534/elife-83534-fig1-data2-v3.zip
Figure 1—figure supplement 1
Comparison of effects of oxysterols on PM cholesterol pools – immunoblot analysis.
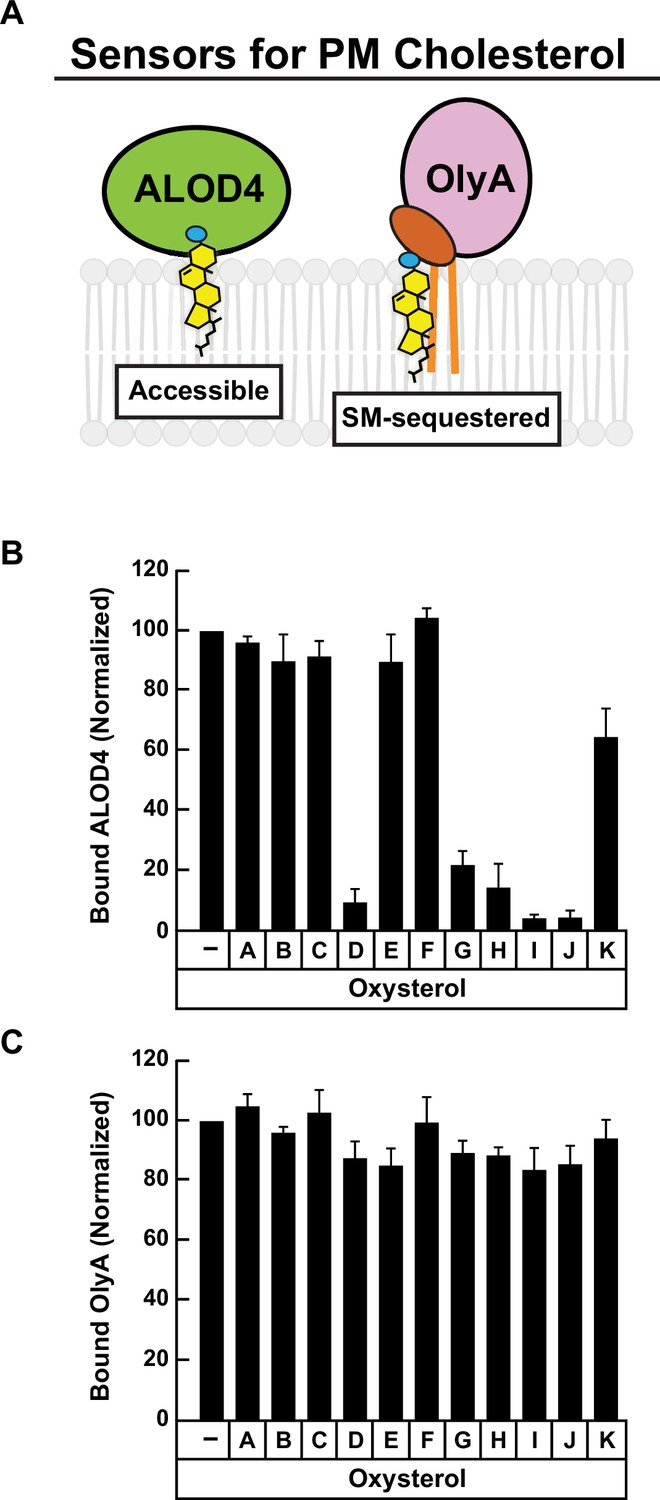
(A) Schematic of protein sensors used to monitor changes in PM cholesterol pools. (B, C) Quantification of immunoblot analysis shown in Figure 1D and E. The intensities of bands corresponding to bound His6-FLAG-ALOD4 (B) and bound OlyA-His6 (C) were quantified by densitometry and normalized to cellular actin levels as described in Materials and methods. The intensity values for ethanol (vehicle)-treated cells (lane 1 in Figure 1D and E) were set to 100 and all other values were normalized relative to this set-point. Each column represents the average values obtained from three independent experiments (the ones shown in Figure 1D and E along with two other experiments conducted in the same manner) and error bars indicate the standard error.
Figure 1—figure supplement 2
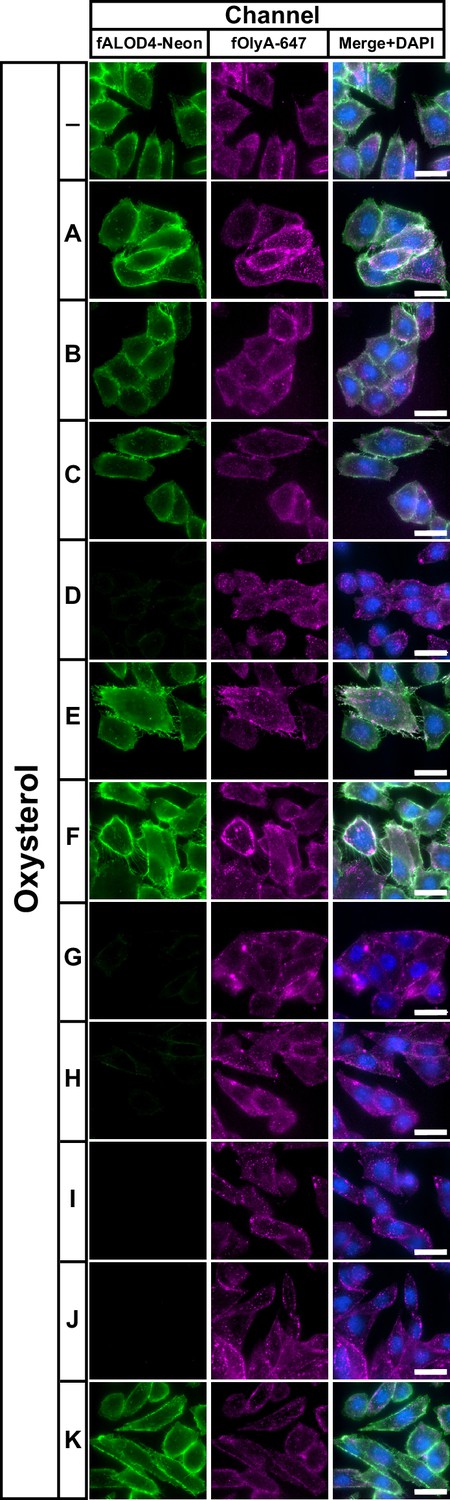
Comparison of effects of oxysterols on PM cholesterol pools – fluorescence microscopy analysis.
On day 0, CHO-K1 cells were set up in medium B at a density of 3x10⁴ cells per well of an 8-well Lab-Tek II chambered #1.5 coverglass dish. On day 1, media was removed, cells were washed twice with 500 µl of PBS followed by addition of 200 µl of medium B supplemented with 5 µM of the indicated oxysterol (listed in Figure 1C). After incubation at 37 °C for 4 hr, media was removed and replaced with 200 µl of medium B supplemented with 3 µM fALOD4-Neon and 3 µM fOlyA-647. After incubation at 37 °C for 30 min, media was removed, cells were washed twice with 500 µl of PBS, fixed, stained with DAPI, and imaged as described in Materials and methods. Scale bar, 25 µm.
Figure 1—figure supplement 3
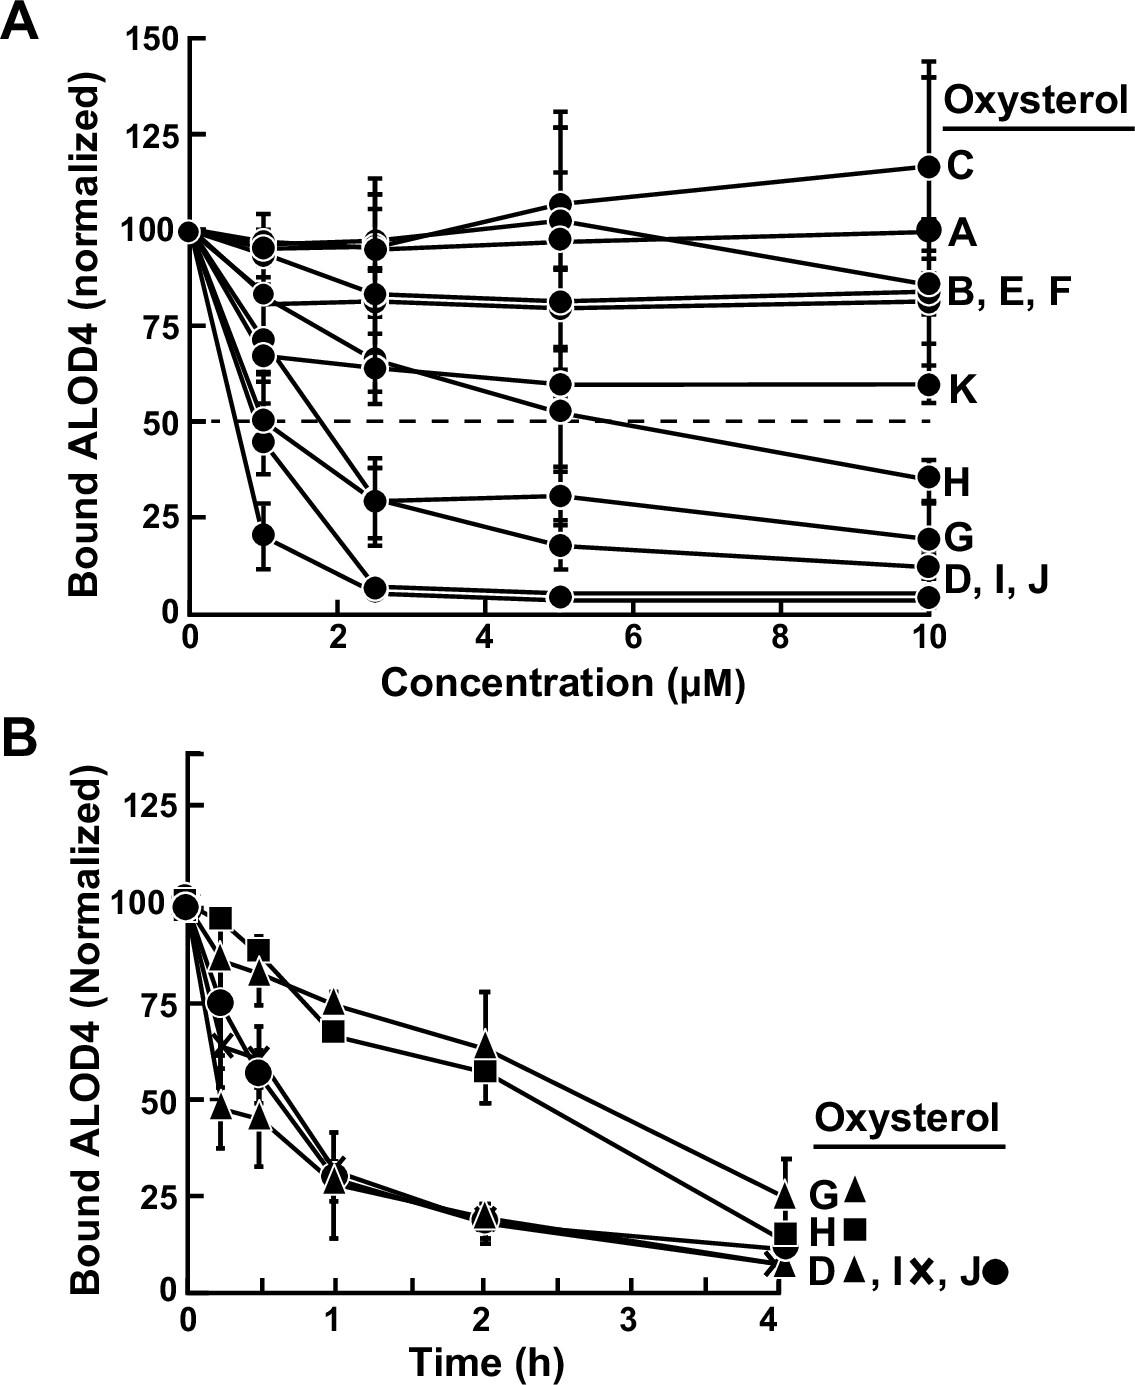
Comparison of effects of oxysterols on accessible PM cholesterol levels – immunoblot analysis.
On day 0, CHO-K1 cells were set up in medium B at a density of 6x10⁴ cells per well of a 48-well plate. On day 1, media was removed, cells were washed twice with 500 µl of PBS followed by addition of 200 µl of medium B supplemented with either varying concentrations (A) or 5 µM (B) of the indicated oxysterol (listed in Figure 1C). After incubation at 37 °C for either 4 hr (A) or for the indicated times (B), media was removed and replaced with 200 µl of medium B supplemented with 3 µM His6-Flag-ALOD4. After incubation at 37 °C for 30 min, cells were washed twice with 500 µl of PBS and harvested, after which equal aliquots of cell lysates were subjected to immunoblot analysis as described in Materials and methods. The immunoblot signals for bound ALOD4 and cellular actin after treatment with various oxysterols, examples of which are shown in Figure 1A and B for oxysterol (I), were then quantified as described in Materials and methods. Data points represent the mean of 3–6 experiments and error bars show the standard error.
Figure 1—figure supplement 4
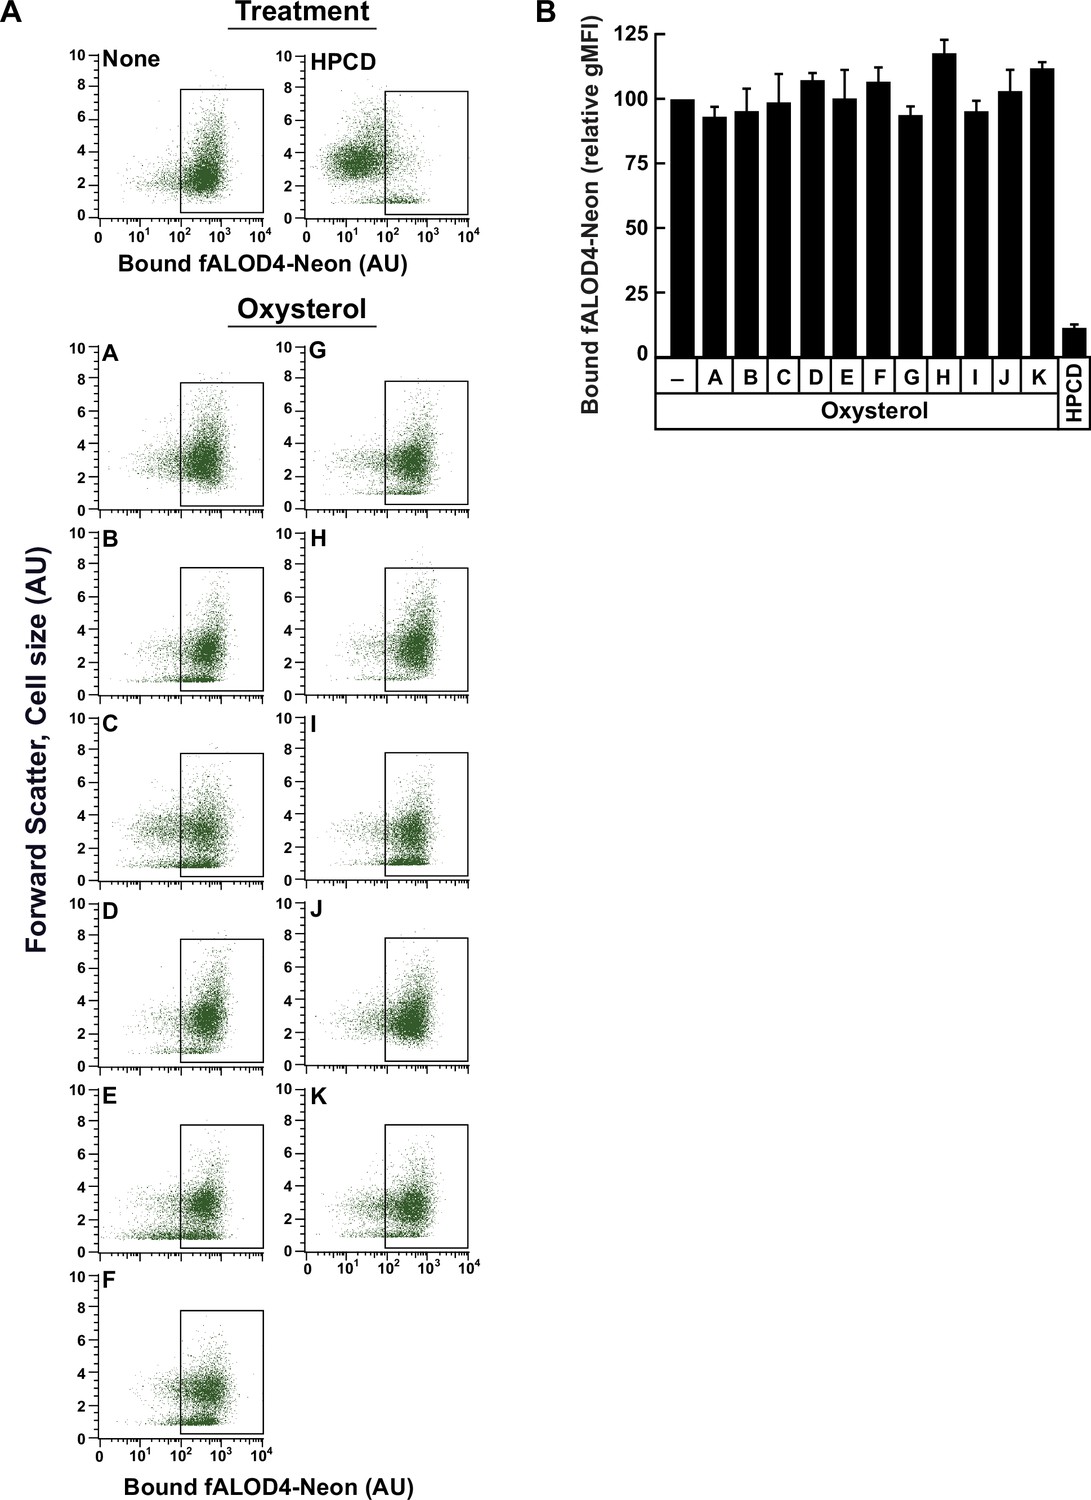
Treatment of red blood cells with oxysterols does not affect levels of accessible cholesterol in their membranes.
(A, B) Each binding assay contained 500 µl of rabbit red blood cells (RBCs) that had been washed and diluted as described in Materials and methods. RBCs were then subjected to one of the following treatments at room temperature (RT): (i) incubation for 4 hr without or with 5 µM of the indicated oxysterol (listed in Figure 1C); or (ii) incubation for 1 h with 1% (w/v) HPCD (in buffer F). After the indicated treatments, RBCs were incubated with 1 µM of fALOD4-Neon for 30 min at RT, following which FACS analysis was carried out as described in Materials and methods. Representative flow cytometry analysis of fALOD4-Neon binding to 10,000 RBCs are shown in (A) and the rectangular boxes represent fALOD4-Neon-bound RBCs. The geometric mean fluorescence intensity (gMFI) of Neon fluorescence from three independent experiments are shown in (B). Each column in (B) represents the mean of 3 independent experiments and error bars indicate the standard error. The mean gMFI value obtained for binding of fALOD4-Neon to RBCs in the absence of oxysterol treatment for each experiment (top left panel in A) was set to 100 and all other values were normalized to this set-point.
Figure 1—figure supplement 5
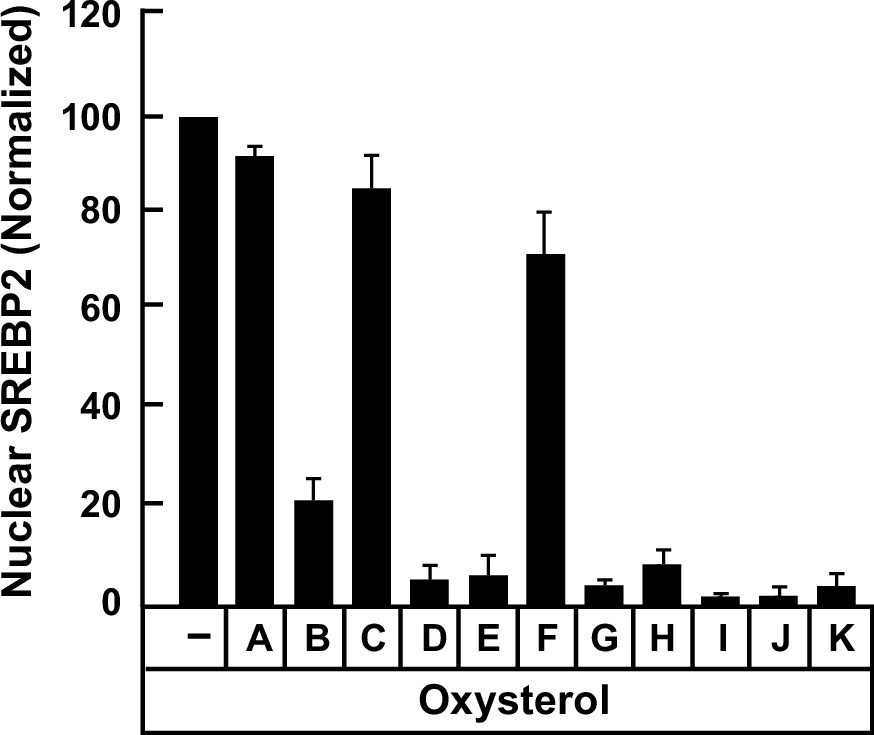
Quantification of immunoblot analysis shown in Figure 1G.
The intensities of bands corresponding to nuclear SREBP2 in Figure 1G were quantified by densitometry and normalized to cellular actin levels as described in Materials and methods. The intensity values for ethanol (vehicle)-treated cells (lane 1 in Figure 1G) were set to 100 and all other values were normalized relative to this set-point. Each column represents the average values obtained from three independent experiments (the one shown in Figure 1G along with two other experiments conducted in the same manner) and error bars indicate the standard error.
Figure 2 with 5 supplements
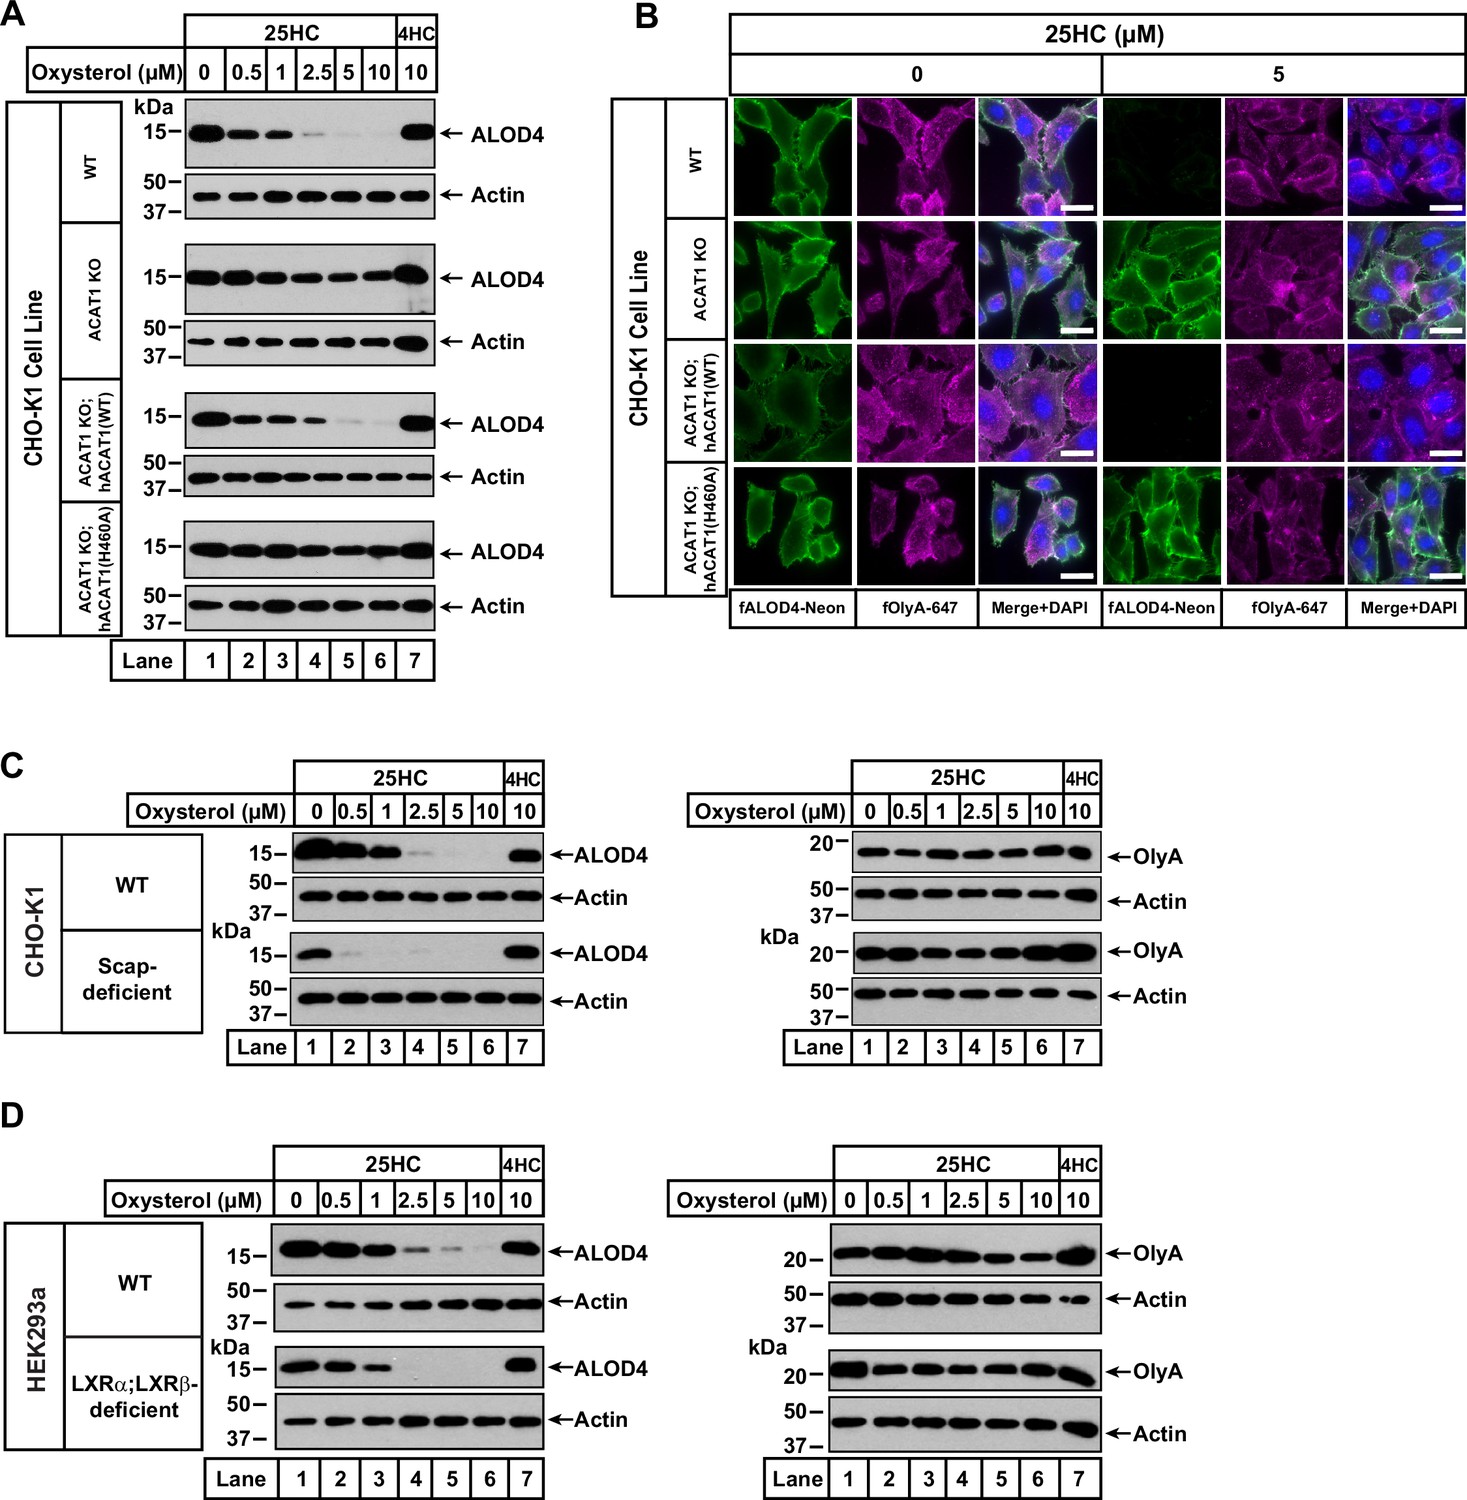
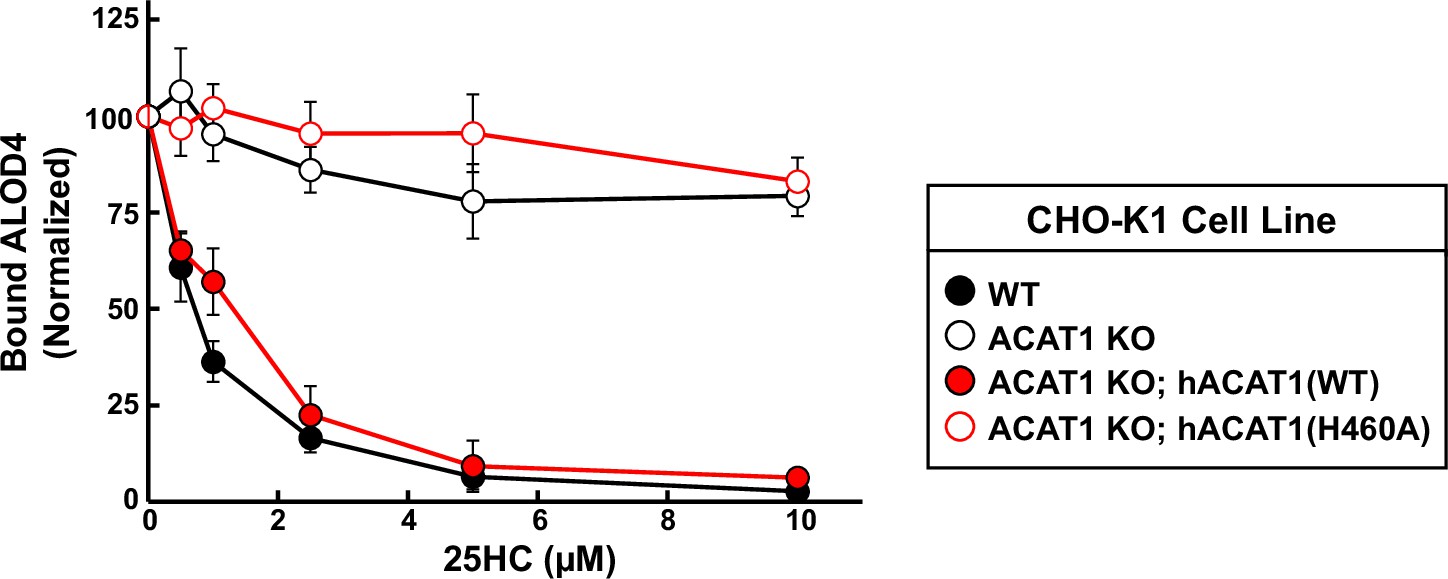
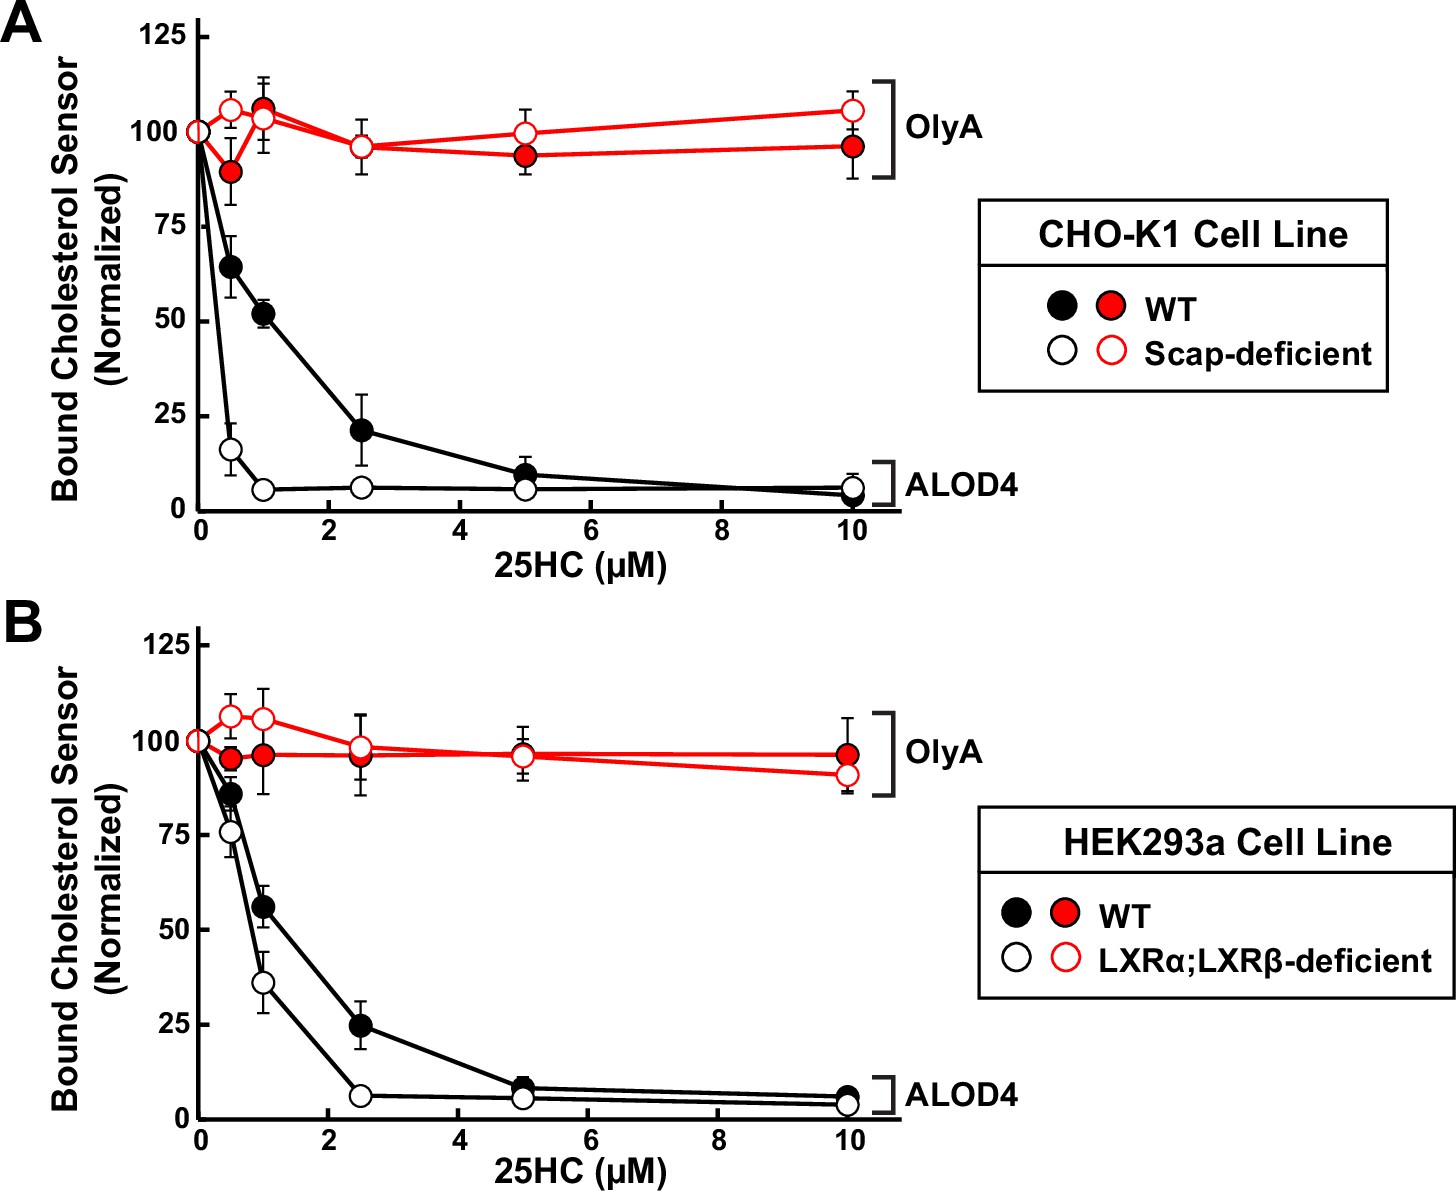
25HC fails to trigger rapid depletion of accessible cholesterol from PMs of ACAT-deficient cells.
(A) Immunoblot analysis of ALOD4 binding. On day 0, the indicated versions of CHO-K1 cells were set up in medium B at a density of 6x10⁴ cells per well of a 48-well plate. On day 1, media was removed, cells were washed twice with 500 µl of PBS followed by addition of 200 µl of medium B supplemented with the indicated concentrations of either 25HC or 4HC. After incubation at 37 °C for 4 hr, media was removed and replaced with 200 µl of medium B supplemented with 3 µM His6-Flag-ALOD4. After incubation at 37 °C for 30 min, cells were washed twice with 500 µl of PBS, harvested, and equal aliquots of cell lysates were subjected to immunoblot analysis as described in Materials and methods. Quantification of the immunoblots are shown in Figure 2—figure supplement 2. (B) Fluorescence microscopy analysis of ALOD4 and OlyA binding. On day 0, the indicated versions of CHO-K1 cells were set up in medium B at a density of 3x10⁴ cells per well of an eight-well Lab-Tek II chambered #1.5 coverglass dish. On day 1, media was removed, cells were washed twice with 500 µl of PBS followed by addition of 200 µl of medium B supplemented with the indicated concentration of 25HC. After incubation at 37 °C for 4 hr, media was removed and replaced with 200 µl of medium B supplemented with 3 µM of either fALOD4-Neon or fOlyA-647. After incubation at 37 °C for 30 min, media was removed, cells were washed twice with 500 µl of PBS, fixed, stained with DAPI, and imaged as described in Materials and methods. Scale bar, 25 µm. (C, D) Effects of 25HC on PM cholesterol pools in cells lacking Scap or LXR transcription factors. On day 0, the indicated cell lines were set up in either medium B (C) or medium D (D) at a density of 6x10⁴ cells per well of a 48-well plate. On day 1, media was removed, cells were washed twice with 500 µl of PBS followed by addition of 200 µl of media supplemented with the indicated concentrations of either 25HC (lanes 1–6) or 4HC (lane 7). After incubation at 37 °C for 4 hr, media was removed and replaced with 200 µl of media supplemented with 3 µM of either His6-Flag-ALOD4 (left panels) or OlyA-His6 (right panels). After incubation at 37 °C for 30 min, cells were washed twice with 500 µl of PBS, harvested, and equal aliquots of cell lysates were subjected to immunoblot analysis as described in Materials and methods. Quantification of the immunoblots are shown in Figure 2—figure supplement 5.
-
Figure 2—source data 1
Western blots corresponding to Figure 2A, C and D.
- https://cdn.elifesciences.org/articles/83534/elife-83534-fig2-data1-v3.zip
Figure 2—figure supplement 1
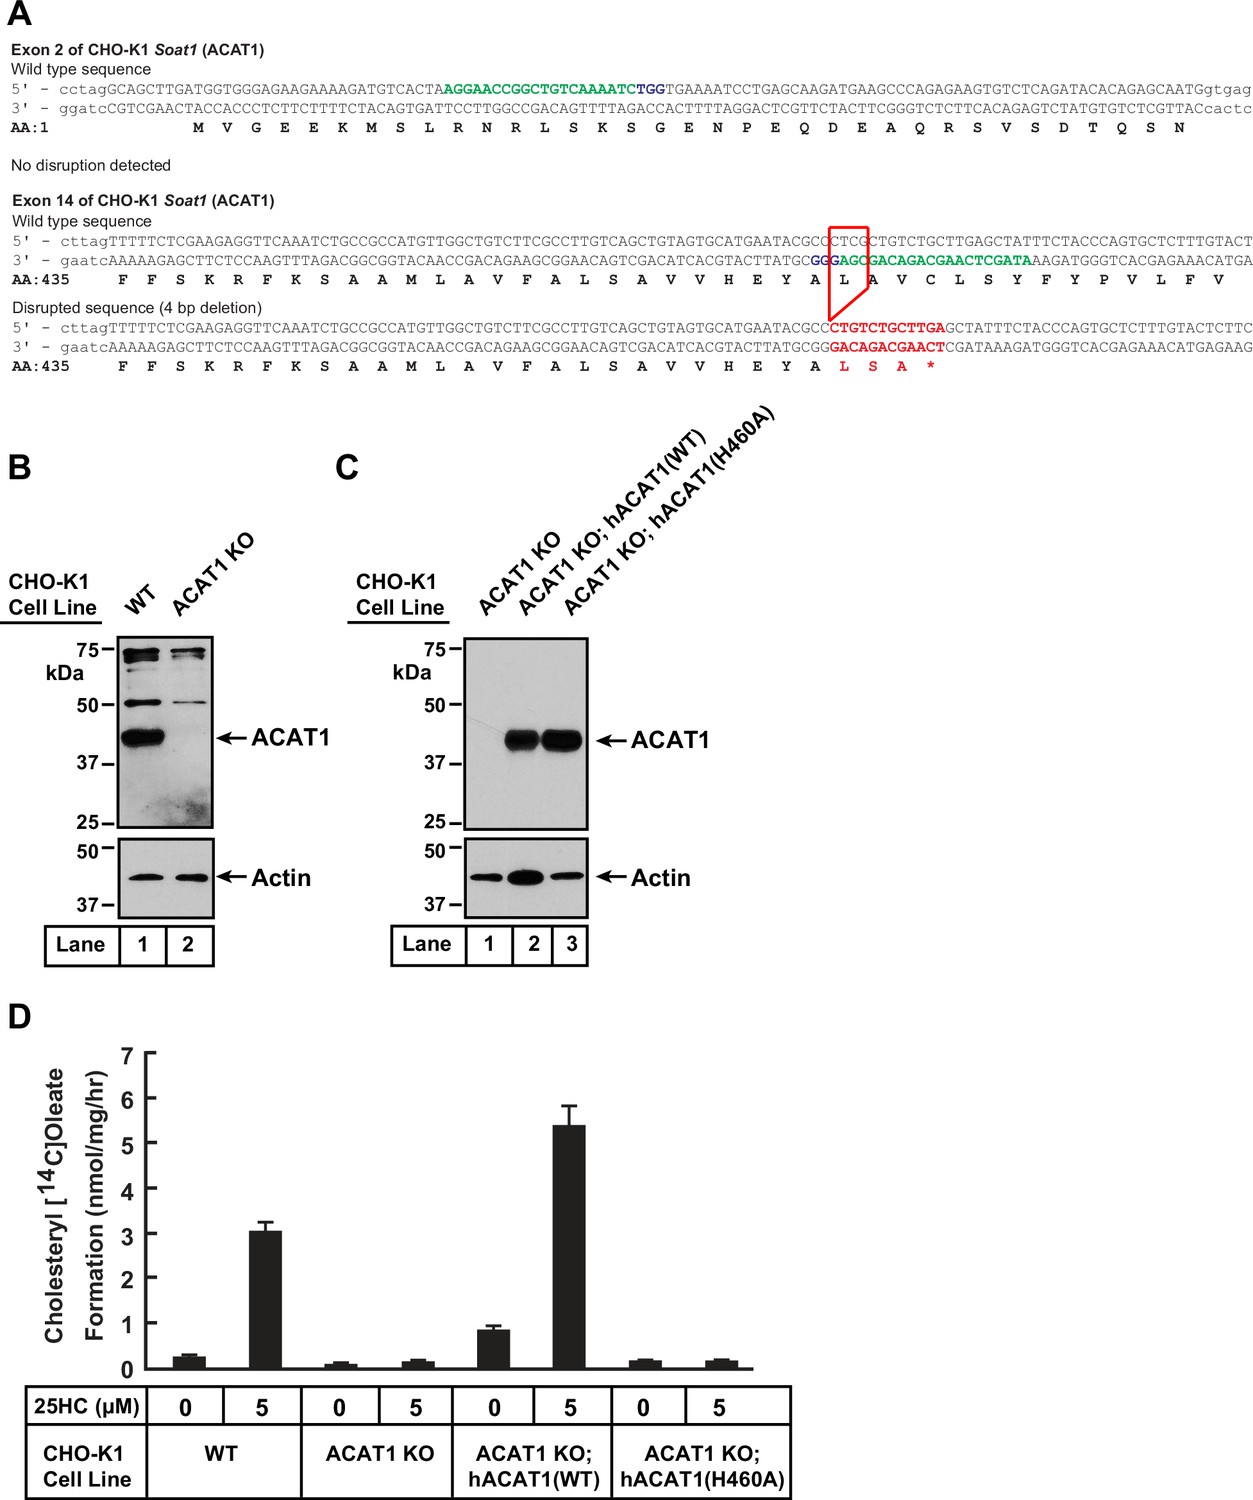
Characterization of a CHO-K1 cell line deficient in ACAT1.
(A) Strategy for generating ACAT1-deficient CHO-K1 cells using CRISPR-Cas9 technology. Two guide RNAs were designed to target and disrupt exons 2 and 14 of hamster ACAT1 (also designated as Soat1). The 20-nucleotide target sequence is shown in green and the NGG PAM sequence is in purple. Genomic sequencing revealed no disruptions to exon 2 and a 4 bp deletion in exon 14 (red box) that resulted in a truncated transcript encoding amino acids 1–461 of ACAT1 followed by two residues (red) and a stop codon (*). (B, C) Immunoblot analysis. On day 0, the indicated versions of CHO-K1 cells were set up in medium B at a density of 6x10⁴ cells per well of a 48-well plate. On day 1, media was removed, cells were washed twice with 500 µl of PBS, harvested, and equal aliquots of cell lysates were subjected to immunoblot analysis as described in Materials and methods. (D) ACAT activity. On day 0, the indicated versions of CHO-K1 cells were set up in medium B at a density of 2.5x10⁵ cells per 60 mm dish. On day 2, media was removed, cells were washed twice with 1 ml of PBS followed by addition of 2 ml of cholesterol-depleting medium C. On day 3, media was removed, cells were washed with 1 ml of PBS followed by addition of 1 ml of medium C supplemented with the indicated concentration of 25HC. After incubation at 37 °C for 1 hr, each dish was supplemented with 0.2 mM sodium [14C]oleate (6500 dpm/nmol) and incubated at 37 °C for an additional 2 hr, after which cells were harvested, and levels of cholesteryl [14C]oleate were measured as described in Materials and methods. Each column represents the mean of cholesterol esterification measurements from three experiments, and error bars show the standard error.
-
Figure 2—figure supplement 1—source data 1
Western blots corresponding to Figure 2—figure supplement 1B, C.
- https://cdn.elifesciences.org/articles/83534/elife-83534-fig2-figsupp1-data1-v3.zip
-
Figure 2—figure supplement 1—source data 2
Data supporting Figure 2—figure supplement 1D.
- https://cdn.elifesciences.org/articles/83534/elife-83534-fig2-figsupp1-data2-v3.zip
Figure 2—figure supplement 2
Quantification of immunoblot analysis shown in Figure 2A.
The intensities of bands corresponding to bound His6-FLAG-ALOD4 in Figure 2A were quantified by densitometry and normalized to cellular actin levels as described in Materials and Methods. The intensity values for the zero 25HC concentration point (lane 1 in all panels of Figure 2A) were set to 100 and all other values were normalized relative to this set-point. Each data point represents the average values obtained from three independent experiments (the one shown in Figure 2A along with two other experiments conducted in the same manner) and error bars indicate the standard error.
-
Figure 2—figure supplement 2—source data 1
Data supporting Figure 2—figure supplement 2.
- https://cdn.elifesciences.org/articles/83534/elife-83534-fig2-figsupp2-data1-v3.zip
Figure 2—figure supplement 3
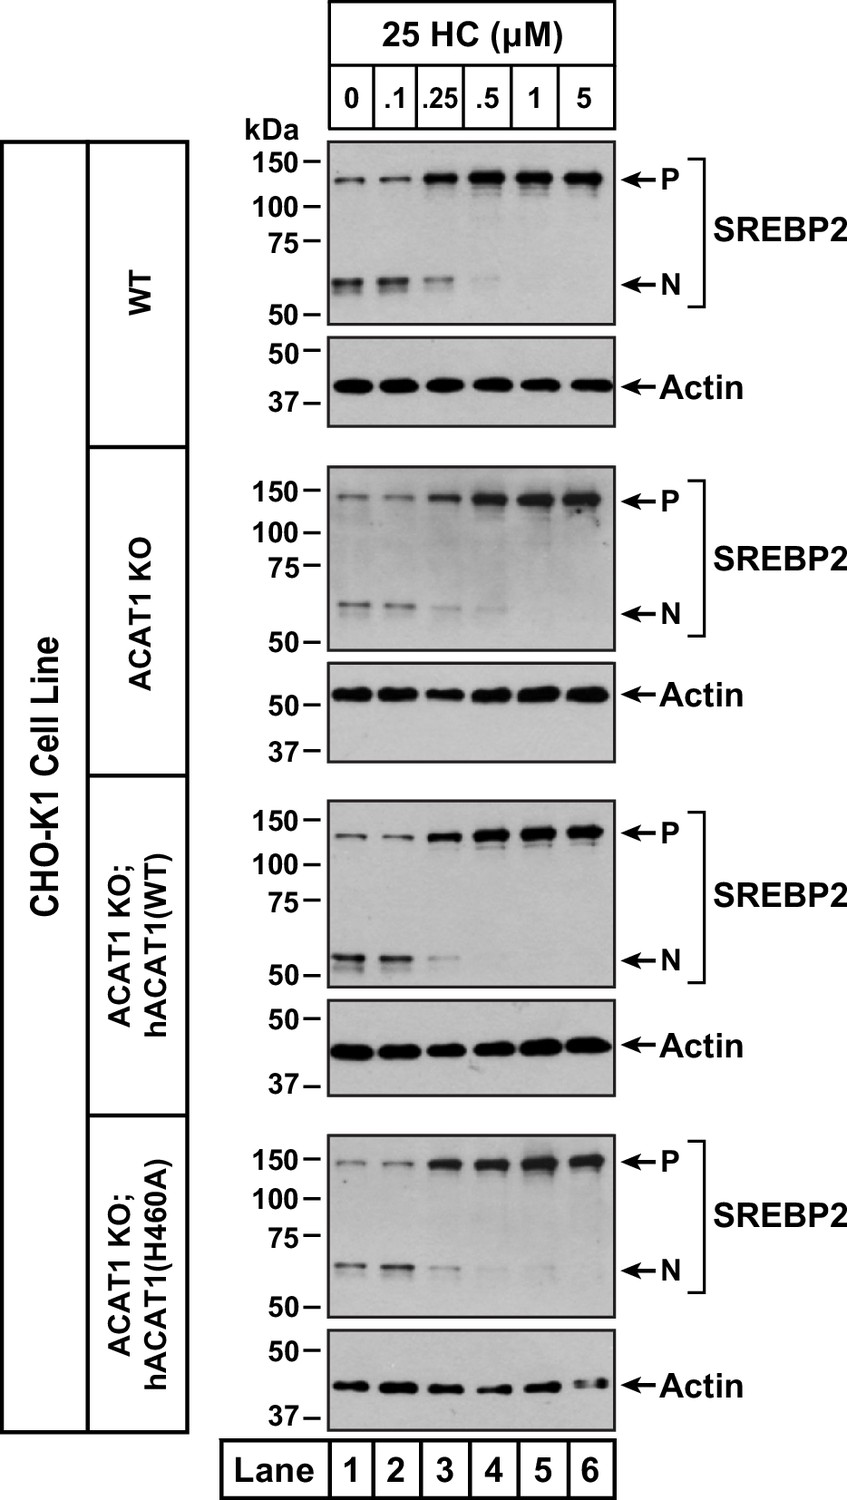
Effects of 25HC on SREBP2 processing in ACAT-deficient cells.
On day 0, the indicated versions of CHO-K1 cells were set up in medium B at a density of 6x10⁴ cells per well of a 48-well plate. On day 1, media was removed, cells were washed twice with 500 µl of PBS followed by addition of 200 µl of medium C supplemented with 1% (w/v) HPCD. After incubation at 37 °C for 1 hr, media was removed, cells were washed twice with 500 µl of PBS followed by addition of 200 µl of medium C supplemented with the indicated concentrations of 25HC. After incubation at 37 °C for 3 hr, media was removed, cells were washed twice with 500 µl of PBS, harvested, and equal aliquots of cell lysates were subjected to immunoblot analysis as described in Materials and Methods. P, precursor form of SREBP2; N, cleaved nuclear form of SREBP2.
-
Figure 2—figure supplement 3—source data 1
Western blots corresponding to Figure 2—figure supplement 3.
- https://cdn.elifesciences.org/articles/83534/elife-83534-fig2-figsupp3-data1-v3.zip
Figure 2—figure supplement 4
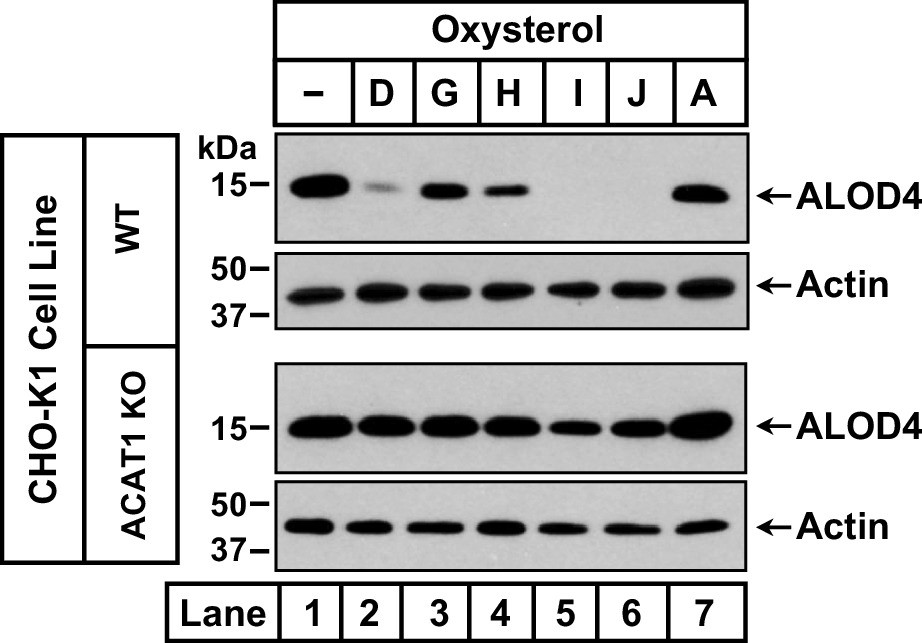
Oxysterols that activate ACAT fail to trigger rapid depletion of accessible cholesterol from PMs of ACAT-deficient cells.
On day 0, the indicated versions of CHO-K1 cells were set up in medium B at a density of 6x10⁴ cells per well of a 48-well plate. On day 1, media was removed, followed by addition of 200 µl of medium B supplemented without or with 5 µM of the indicated oxysterols (see Figure 1C for oxysterol structures). After incubation at 37 °C for 4 hr, media was removed and replaced with 200 µl of medium B supplemented with 3 µM His6-Flag-ALOD4. After incubation at 37 °C for 30 min, cells were washed twice with 500 µl of PBS, harvested, and equal aliquots of cell lysates were subjected to immunoblot analysis as described in Materials and methods.
-
Figure 2—figure supplement 4—source data 1
Western blots corresponding to Figure 2—figure supplement 4.
- https://cdn.elifesciences.org/articles/83534/elife-83534-fig2-figsupp4-data1-v3.zip
Figure 2—figure supplement 5
Quantification of immunoblot analysis shown in Figure 2C and D.
(A, B) The intensities of bands corresponding to bound His6-FLAG-ALOD4 (left panels of Figure 2C and D) and bound OlyA-His6 (right panels of Figure 2C and D) were quantified by densitometry and normalized to cellular actin levels as described in Materials and Methods. The intensity values for the zero 25HC concentration point (lane 1 in all panels of Figure 2C and D) were set to 100 and all other values were normalized relative to this set-point. Each data point represents the average values obtained from three independent experiments (the ones shown in Figure 2C and D along with two other experiments conducted in the same manner) and error bars indicate the standard error.
-
Figure 2—figure supplement 5—source data 1
Data supporting Figure 2—figure supplement 5A and B.
- https://cdn.elifesciences.org/articles/83534/elife-83534-fig2-figsupp5-data1-v3.zip
Figure 3 with 1 supplement
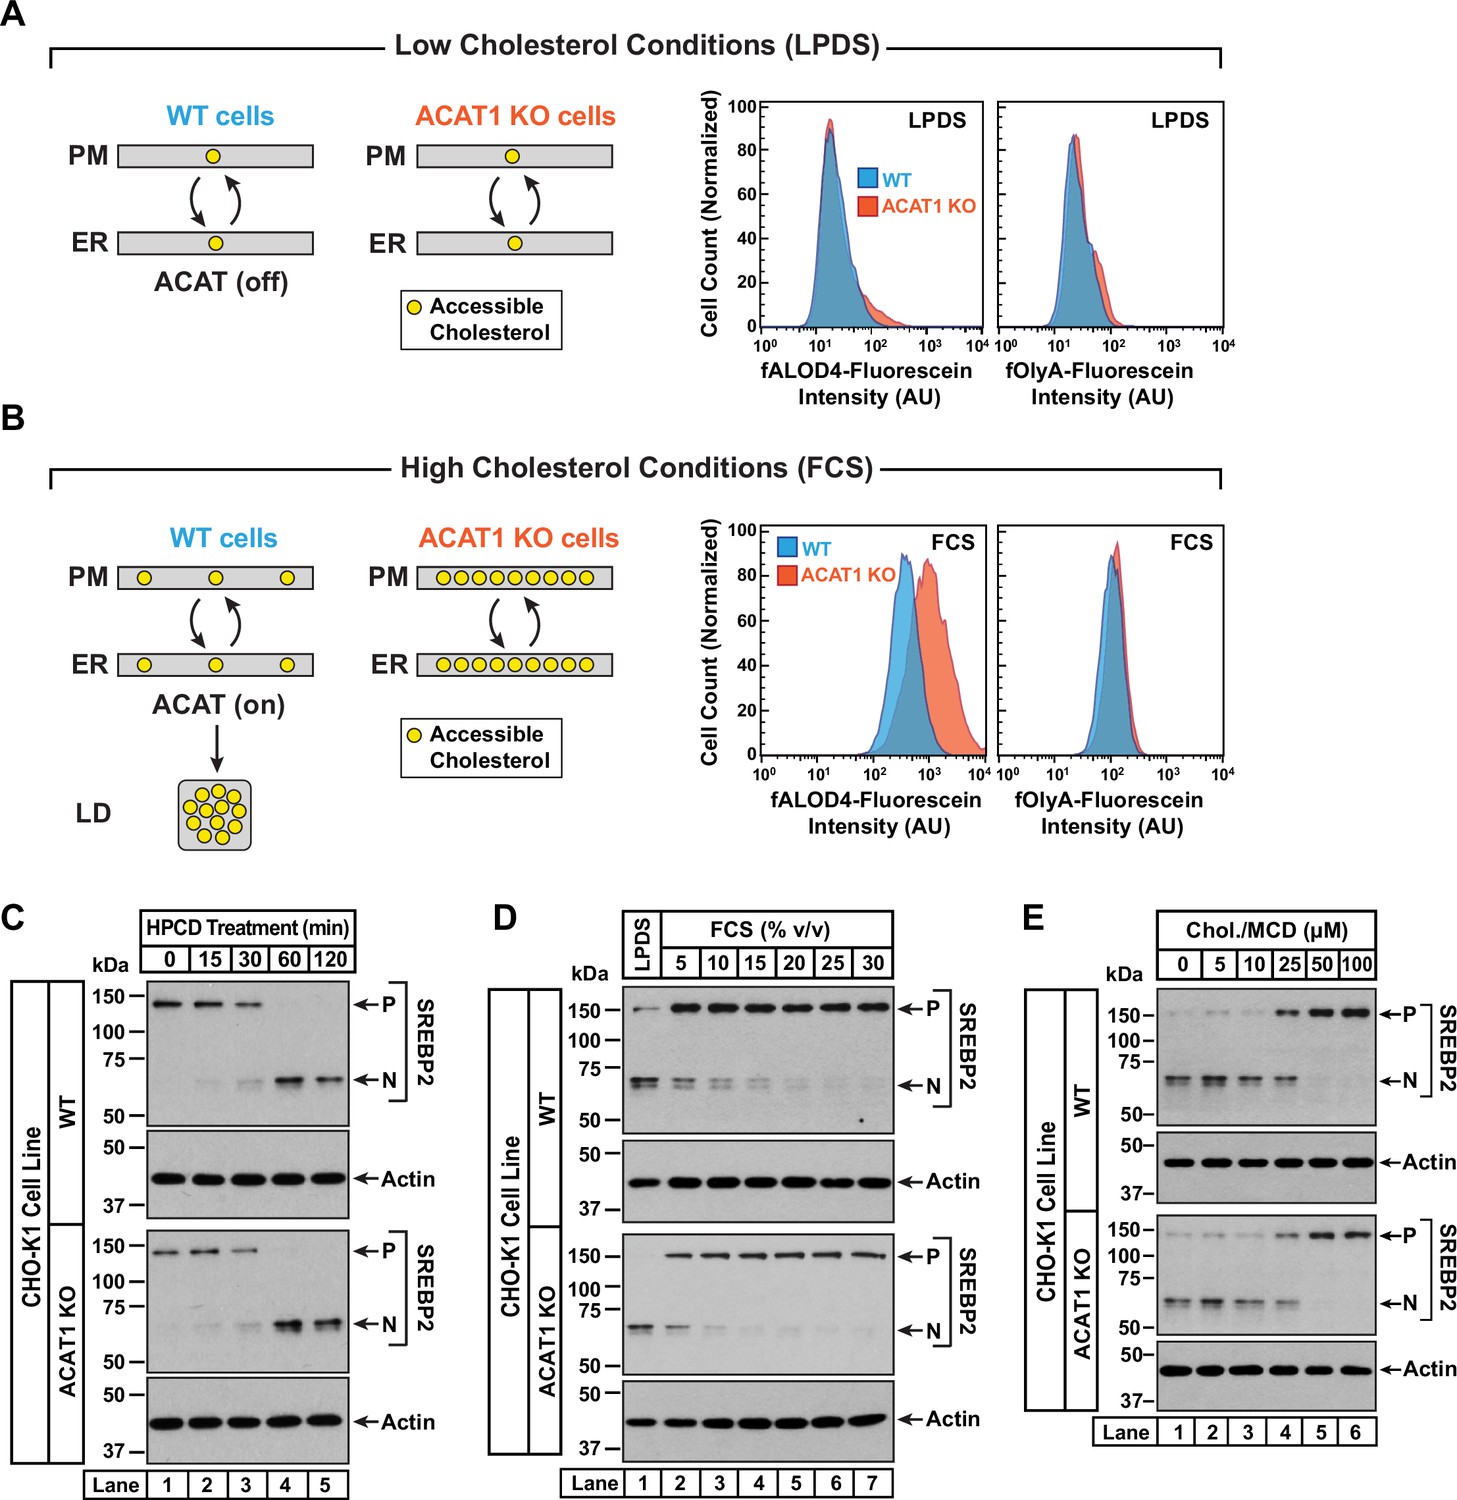
Intracellular cholesterol trafficking and steady state levels of PM accessible cholesterol in ACAT-deficient cells.
On day 0, wild-type and ACAT1-deficient CHO-K1 cells were set up in medium B at a density of 5x10⁴ cells per well of a 24-well plate (A, B) or 6x10⁴ cells per well of a 48-well plate (C - E). (A, B) Steady state levels of accessible cholesterol in PMs. On day 1, media was removed, cells were washed twice with 500 µl of PBS followed by addition of 500 µl of medium A supplemented with 5% (v/v) of either LPDS (A) or FCS (B). On day 2, media was removed, cells were washed twice with 500 µl of PBS followed by addition of 200 µl of medium A containing 5% (v/v) of the indicated serum along with 0.5 µM of either fALOD4-fluorescein or fOlyA-fluorescein. After incubation at 37 °C for 30 min, media was removed, cells were washed twice with 500 µl of PBS, and subjected to flow cytometry as described in Materials and methods. LD, lipid droplets. (C) Cholesterol depletion by HPCD. On day 1, media was removed, cells were washed twice with 500 µl of PBS followed by addition of 200 µl of medium B supplemented with 2% (w/v) HPCD. (D) Cholesterol repletion by lipoproteins. On day 1, media was removed, cells were washed twice with 500 µl of PBS followed by addition of 500 µl of cholesterol-depleting medium C. On day 2, media was removed, cells were washed twice with 500 µl of PBS followed by addition of 200 µl of medium A containing either 5% (v/v) lipoprotein-deficient serum (lane 1) or the indicated concentrations of lipoprotein-rich FCS (lanes 2–7). (E) Cholesterol repletion by cholesterol/cyclodextrin complexes. On day 1, media was removed, cells were washed twice with 500 µl of PBS followed by addition of 200 µl of medium C supplemented with 1% (w/v) HPCD. After incubation at 37 °C for 1 hr, media was removed, cells were washed twice with 500 µl of PBS followed by addition of 200 µl of medium C supplemented with the indicated concentrations of cholesterol/MCD complexes. (C – E) After incubation at 37 °C for the indicated times (C), 5 hr (D), or 3 hr (E), media was removed, cells were washed twice with 500 µl of PBS, harvested, and equal aliquots of cell lysates were subjected to immunoblot analysis as described in Materials and methods. P, precursor form of SREBP2; N, cleaved nuclear form of SREBP2; Chol., cholesterol. Quantification of the immunoblots are shown in Figure 3—figure supplement 1.
-
Figure 3—source data 1
Western blots corresponding to Figure 3C, D and E.
- https://cdn.elifesciences.org/articles/83534/elife-83534-fig3-data1-v3.zip
Figure 3—figure supplement 1
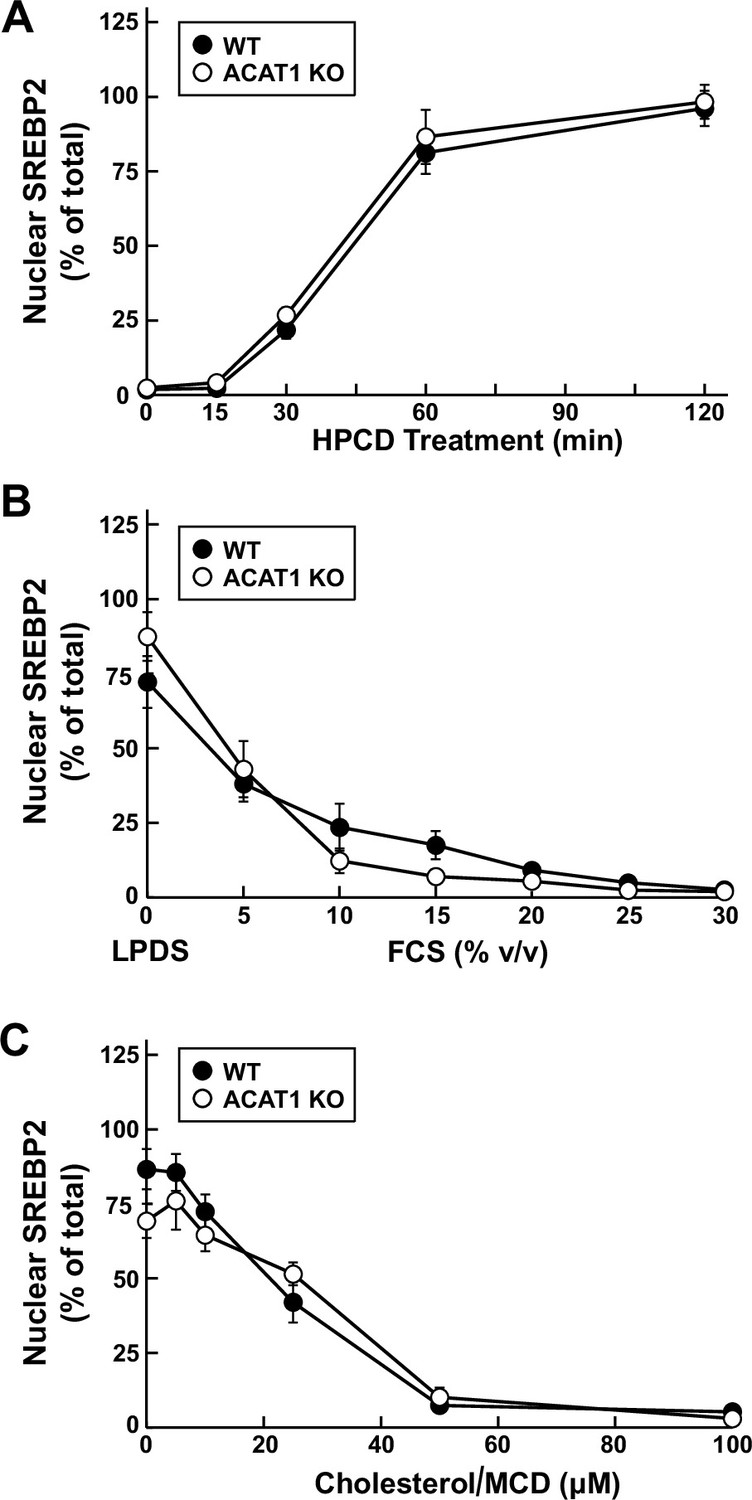
Quantification of immunoblot analysis shown in Figure 3C, D and E.
(A – C) The intensities of bands corresponding to precursor (P) and nuclear (N) forms of SREBP2 in Figure 3C, D and E were quantified by densitometry and these values were used to calculate the percentage of nuclear SREBP2 (100*N/(N+P)). Each data point represents the average values obtained from three independent experiments (the ones shown in Figure 3C, D and E along with two other experiments conducted in the same manner) and error bars indicate the standard error.
-
Figure 3—figure supplement 1—source data 1
Data supporting Figure 3—figure supplement 1A, B, C.
- https://cdn.elifesciences.org/articles/83534/elife-83534-fig3-figsupp1-data1-v3.zip
Figure 4 with 2 supplements
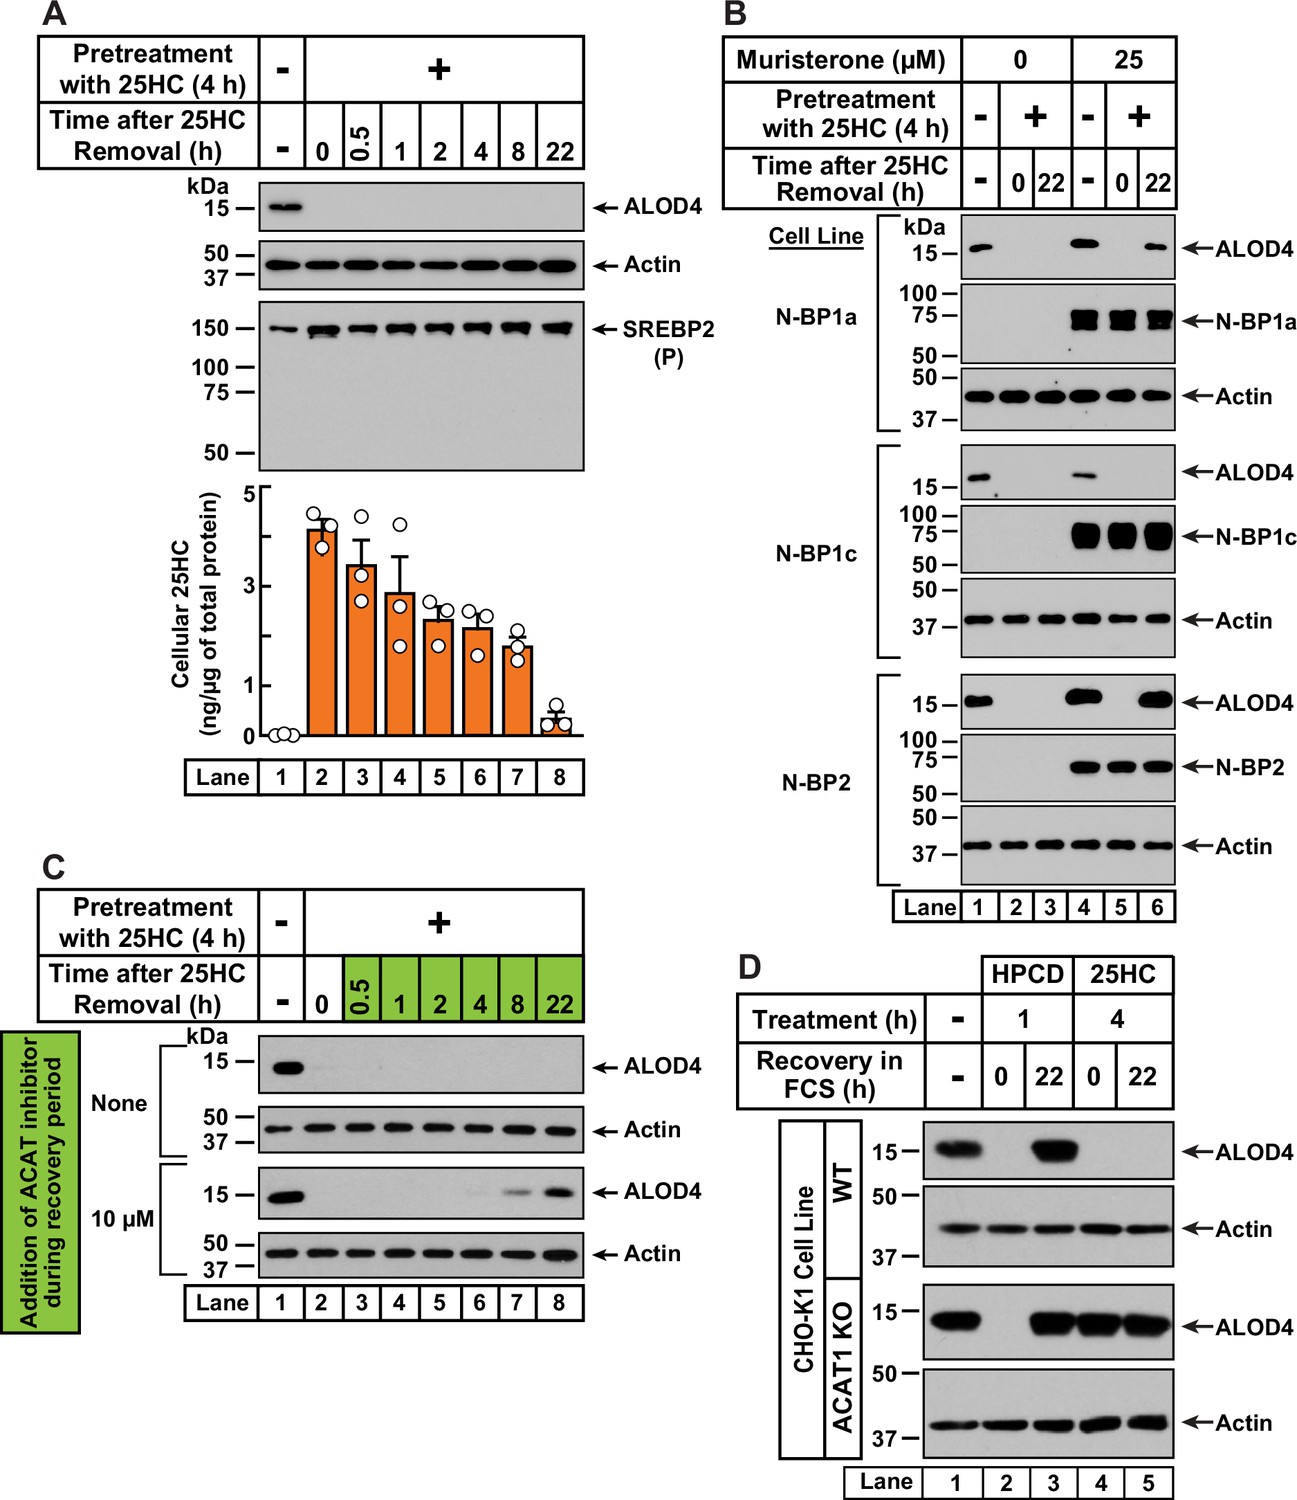
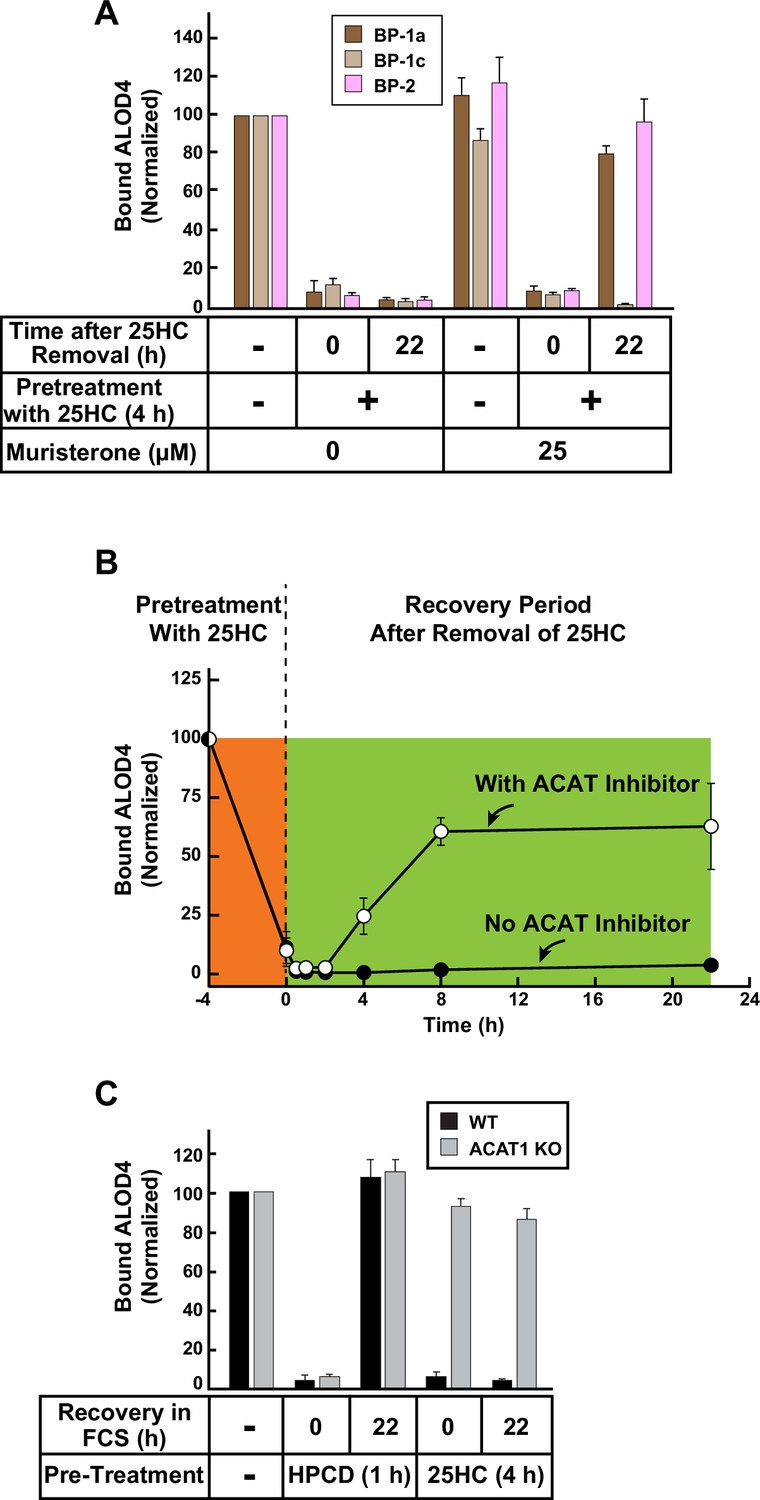
25HC-triggered depletion of accessible cholesterol from PMs persists for long times through suppression of SREBP-mediated cholesterol synthesis and uptake, and continued activation of ACAT.
(A) Retention of 25HC in cells prevents replenishment of accessible cholesterol on PMs after it has been depleted by 25HC. On day 0, CHO-K1 cells were set up in medium B in eight 24-well plates at a density of 1.5x10⁵ cells per well. On day 1, media was removed from seven of the eight plates, cells were washed twice with 1 ml of PBS followed by addition of 1 ml of medium B supplemented with 5 µM of 25HC (lanes 2–8). After incubation at 37 °C for 4 hr, media was removed, cells were washed twice with 1 ml of PBS followed by addition of 1 ml of medium B. Each of the seven plates was incubated for the indicated times, after which media was removed from 10 wells and cells were washed twice with 1 ml of PBS. Then, 100 µl of PBS was added to each well and the cells were scraped and pooled for further analysis. The eighth plate (lane 1) was not subjected to any treatment and was processed for analysis as above. For each plate, an aliquot of the pooled cells (20% of total) was used to determine protein concentration with a BCA protein assay kit and the remainder (80% of total) was subjected to mass spectrometry analysis for free 25HC as described in Materials and methods. An 11th well from each plate was subjected to immunoblot analysis of His6-Flag-ALOD4 binding (top panel). These samples were also immunoblotted for SREBP2 (third panel). P, precursor form of SREBP2; N, cleaved nuclear form of SREBP2. (B) Nuclear SREBPs counteract 25HC-mediated depletion of accessible cholesterol. On day 0, Site-2 protease-deficient CHO-K1 cells inducibly expressing the nuclear transcription factor domains (N–BP) of the indicated isoforms of SREBP were set up in medium B at a density of 5x10⁴ cells per well of a 48-well plate. On day 1, media was removed, cells were washed twice with 500 µl of PBS followed by addition of 200 µl of medium B supplemented with the indicated concentrations of muristerone A. On day 2, media was removed, cells were washed twice with 500 µl of PBS followed by addition of 200 µl of medium B supplemented with the indicated concentration of muristerone along with 5 µM 25HC (lanes 2, 3, 5, 6). After incubation at 37 °C for 4 hr, media was removed, cells were washed twice with 500 µl of PBS followed by addition of 200 µl of medium B. After incubation for the indicated times, media was removed from these 25HC-treated wells as well as from two wells that were not subjected to any of the above treatments (lanes 1, 4). The media was replaced with 200 µl of medium B supplemented with 3 µM His6-Flag-ALOD4. After incubation at 37 °C for 30 min, cells were washed twice with 500 µl of PBS, harvested, and equal aliquots of cell lysates were subjected to immunoblot analysis as described in Materials and methods. Quantification of the immunoblots are shown in Figure 4—figure supplement 2A. (C) Inhibition of ACAT activity allows partial replenishment of accessible cholesterol on PMs after it has been depleted by 25HC. On day 0, CHO-K1 cells were set up in medium B at a density of 1.5x10⁵ cells per well of a 24-well plate. On day 1, media was removed, cells were washed twice with 1 ml of PBS, followed by addition of 1 ml of medium B supplemented with 5 µM 25HC. After incubation at 37 °C for 4 hr, media was removed, cells were washed twice with 1 ml of PBS, followed by addition of 1 ml of medium B without or with 10 µM of SZ58-035. After incubation for the indicated times, media was removed and replaced with 200 µl of medium B supplemented with 3 µM His6-Flag-ALOD4. After incubation at 37 °C for 30 min, cells were washed twice with 1 ml of PBS, harvested, and equal aliquots of cell lysates were subjected to immunoblot analysis as described in Materials and methods. Quantification of the immunoblots are shown in Figure 4—figure supplement 2B. (D) PM accessible cholesterol in ACAT-deficient cells. On day 0, the indicated versions of CHO-K1 cells were set up in medium B at a density of 1.5x10⁵ cells per well of a 24-well plate. On day 1, media was removed, cells were washed twice with 500 µl of PBS followed by addition of 300 µl of medium B supplemented with either 1% (w/v) HPCD (lanes 2, 3) or 5 µM 25HC (lanes 4, 5). After incubation for either 1 hr (lanes 2, 3) or 4 hr (lanes 4, 5), media was removed, cells were washed twice with PBS followed by addition of 1 ml of medium B. After incubation for the indicated times, media was removed from these treated wells as well as from a well that was not subjected to any of the above treatments (lane 1). The media was replaced with 200 µl of medium B supplemented with 3 µM His6-Flag-ALOD4. After incubation at 37 °C for 30 min, cells were washed twice with 1 ml of PBS, harvested, and equal aliquots of cell lysates were subjected to immunoblot analysis as described in Materials and methods. Quantification of the immunoblots are shown in Figure 4—figure supplement 2C.
-
Figure 4—source data 1
Western blots corresponding to Figure 4.
- https://cdn.elifesciences.org/articles/83534/elife-83534-fig4-data1-v3.zip
-
Figure 4—source data 2
Data supporting Figure 4A and Figure 4—figure supplement 2.
- https://cdn.elifesciences.org/articles/83534/elife-83534-fig4-data2-v3.zip
Figure 4—figure supplement 1
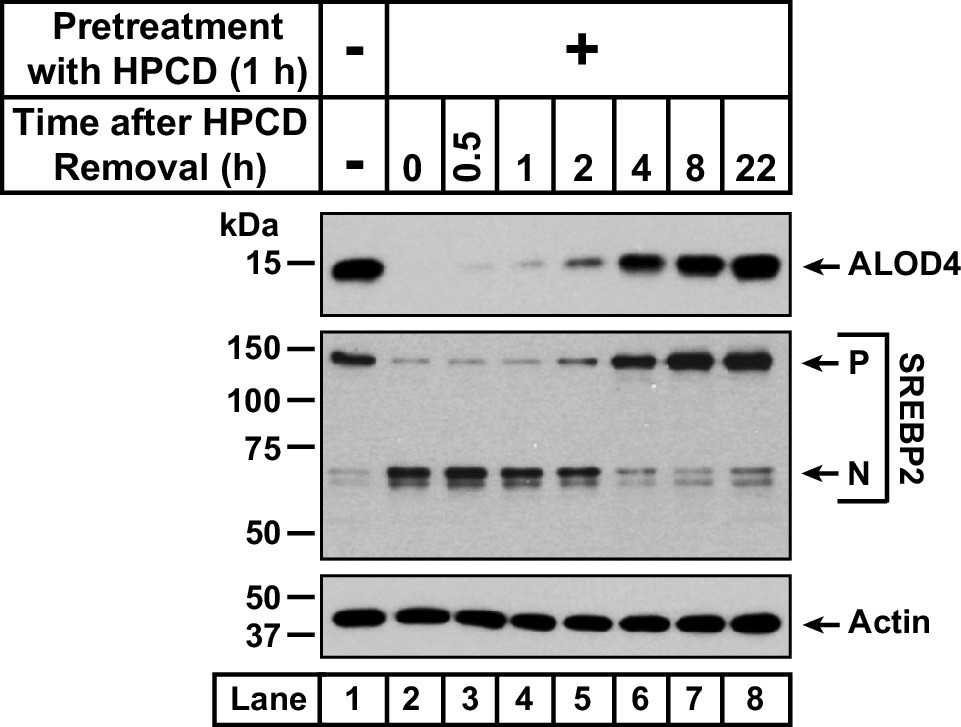
Recovery of accessible cholesterol on PMs after depletion by HPCD.
On day 0, CHO-K1 cells were set up in medium B at a density of 1.5x10⁵ cells per well of a 24-well plate. On day 1, media was removed, cells were washed twice with 1 ml of PBS followed by addition of 300 µl of medium B supplemented with 1% (w/v) HPCD (lanes 2–8). After incubation at 37 °C for 1 hr, media was removed, cells were washed twice with 1 ml of PBS followed by addition of 1 ml of medium B. After incubation for the indicated times, media was removed from these treated wells as well as from a well that was not subjected to any of the above treatments (lane 1). The media was replaced with 200 µl of medium B supplemented with 3 µM His6-Flag-ALOD4. After incubation at 37 °C for 30 min, cells were washed twice with 1 ml of PBS, harvested, and equal aliquots of cell lysates were subjected to immunoblot analysis as described in Materials and methods.
-
Figure 4—figure supplement 1—source data 1
Western blots corresponding to Figure 4—figure supplement 1.
- https://cdn.elifesciences.org/articles/83534/elife-83534-fig4-figsupp1-data1-v3.zip
Figure 4—figure supplement 2
Quantification of immunoblot analysis shown in Figure 4B, C and D.
The intensities of bands corresponding to bound His6-FLAG-ALOD4 in Figure 4B, C and D were quantified by densitometry and normalized to cellular actin levels as described in Materials and methods. The intensity values for lane 1 of all panels were set to 100 and all other values were normalized relative to this set-point. Each data point represents the average values obtained from three independent experiments (the ones shown in Figure 4B, C and D along with two other experiments conducted in the same manner) and error bars indicate the standard error.
Figure 5 with 1 supplement
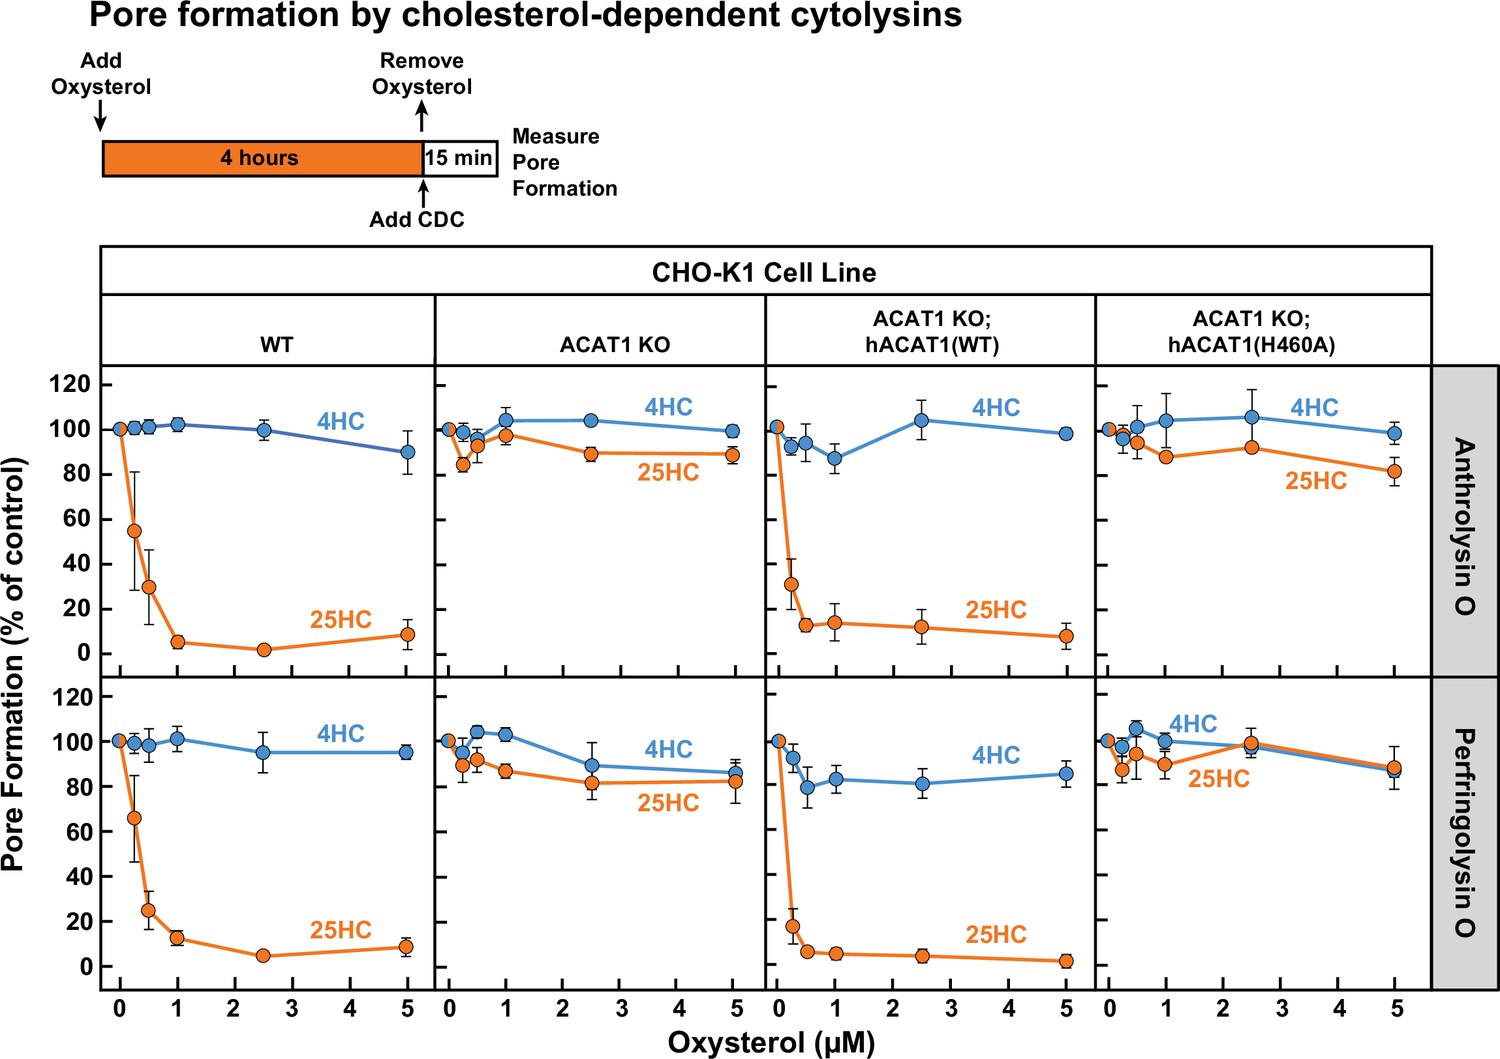
25HC fails to protect ACAT-deficient cells from pore formation by bacterial cytolysins.
On day 0, the indicated versions of CHO-K1 cells were set up in medium B at a density of 7.5x10⁴ cells per well of a 48-well plate. On day 1, media was removed and replaced with 500 µl of medium B supplemented with the indicated concentrations of either 25HC or 4HC. After incubation at 37 °C for 4 hr, media was removed, cells were washed twice with 500 µl of HBSS followed by addition of 500 µl of HBSS containing either 100 pM of His6-ALO(FL) (top panel) or 500 pM of His6-PFO(FL) (bottom panel). After incubation at 37 °C for 15 min, media was removed and pore formation was assessed as described in Materials and methods. For each cell line, the extent of pore formation in the absence of oxysterol treatment was set to 100%, and all other values were normalized to this set-point.
-
Figure 5—source data 1
Data supporting Figure 5 and Figure 5—figure supplement 1.
- https://cdn.elifesciences.org/articles/83534/elife-83534-fig5-data1-v3.zip
Figure 5—figure supplement 1
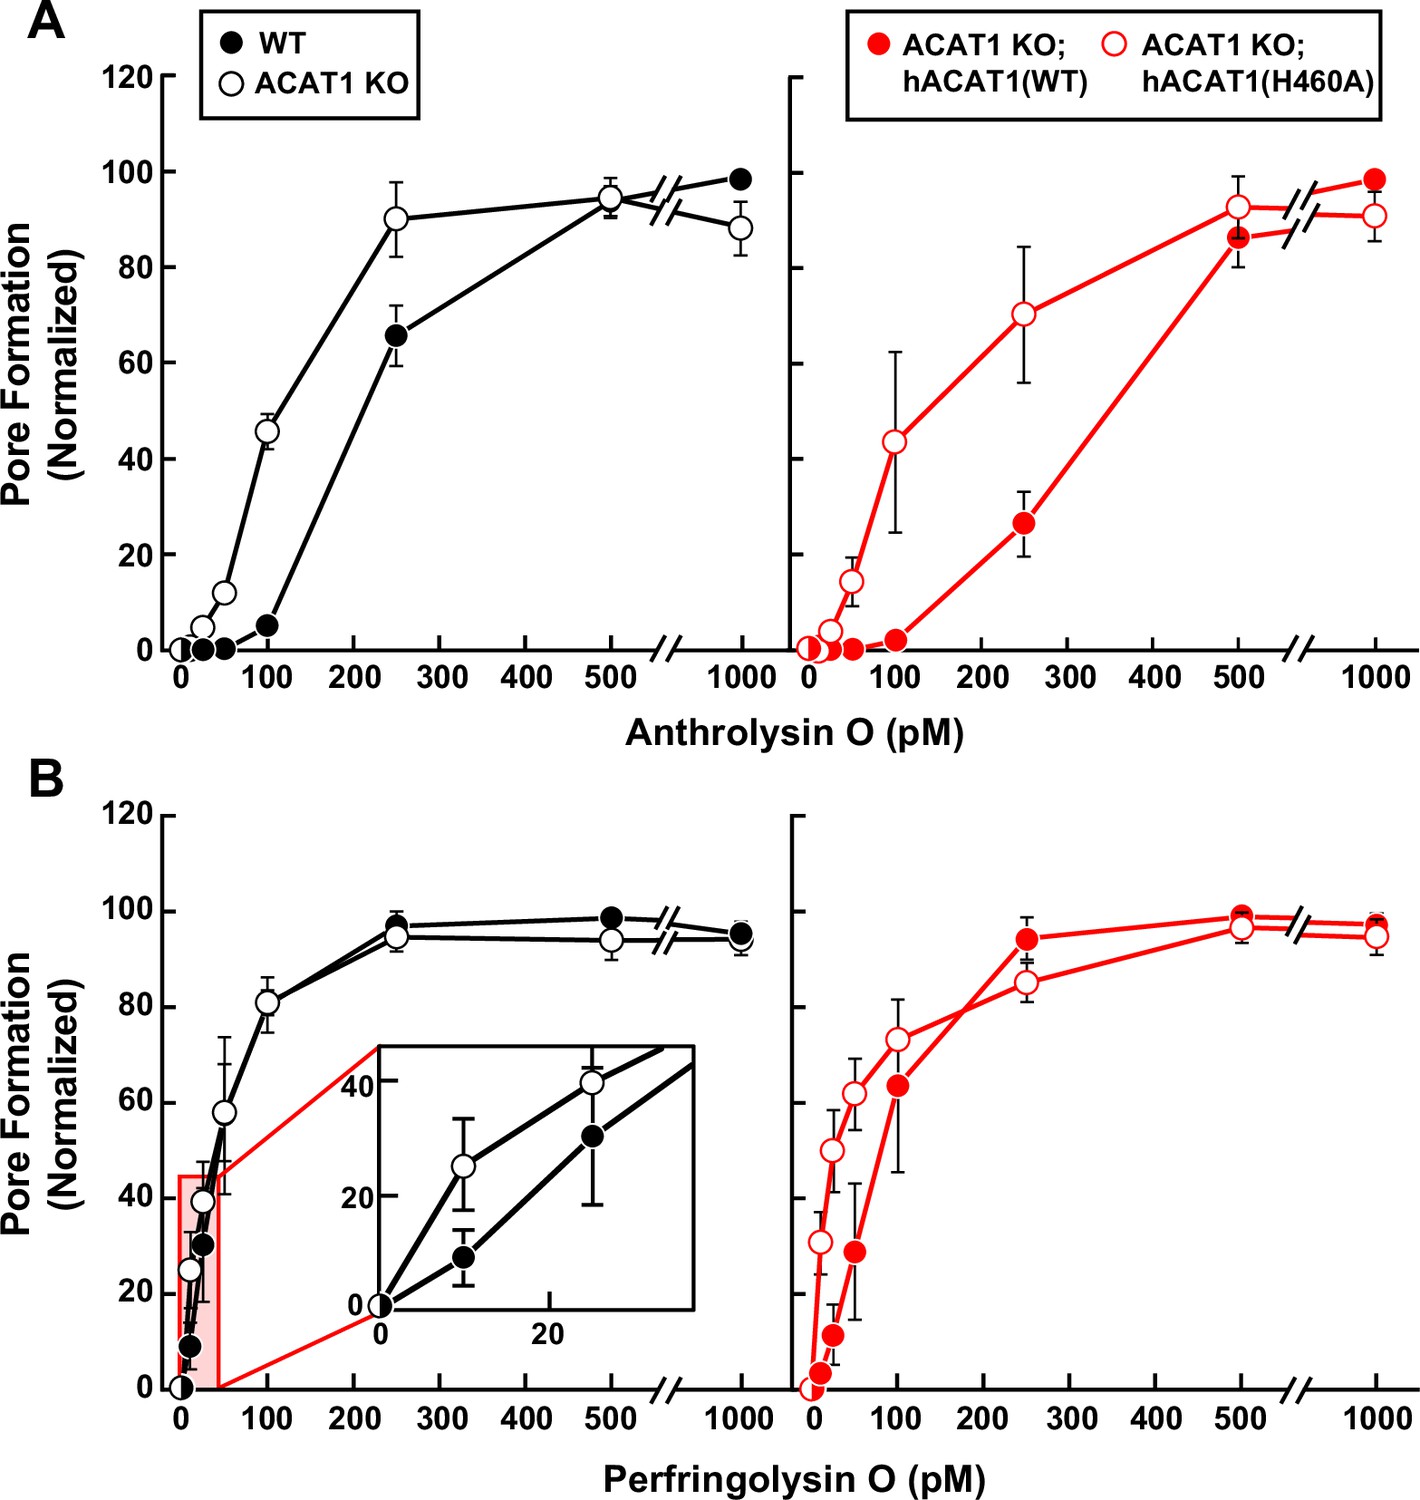
Susceptibility of wild-type and ACAT-deficient CHO-K1 cells to pore formation by bacterial cytolysins.
(A, B) Pore formation by ALO and PFO. On day 0, the indicated versions of CHO-K1 cells were set up in medium B at a density of 7.5x10⁴ cells per well of a 48-well plate. On day 1, media was removed, cells were washed twice with 500 µl of HBSS, followed by addition of 500 µl of HBSS supplemented with the indicated concentrations of His6-ALO(FL) (A) or His6-PFO(FL) (B). After incubation for 15 min at 37 °C, media was removed, and pore formation was assessed as described in Materials and methods. For each cell line, the maximum extent of pore formation for each replicate assay was set to 100%, and all other values were normalized to this set-point.
Figure 6 with 1 supplement
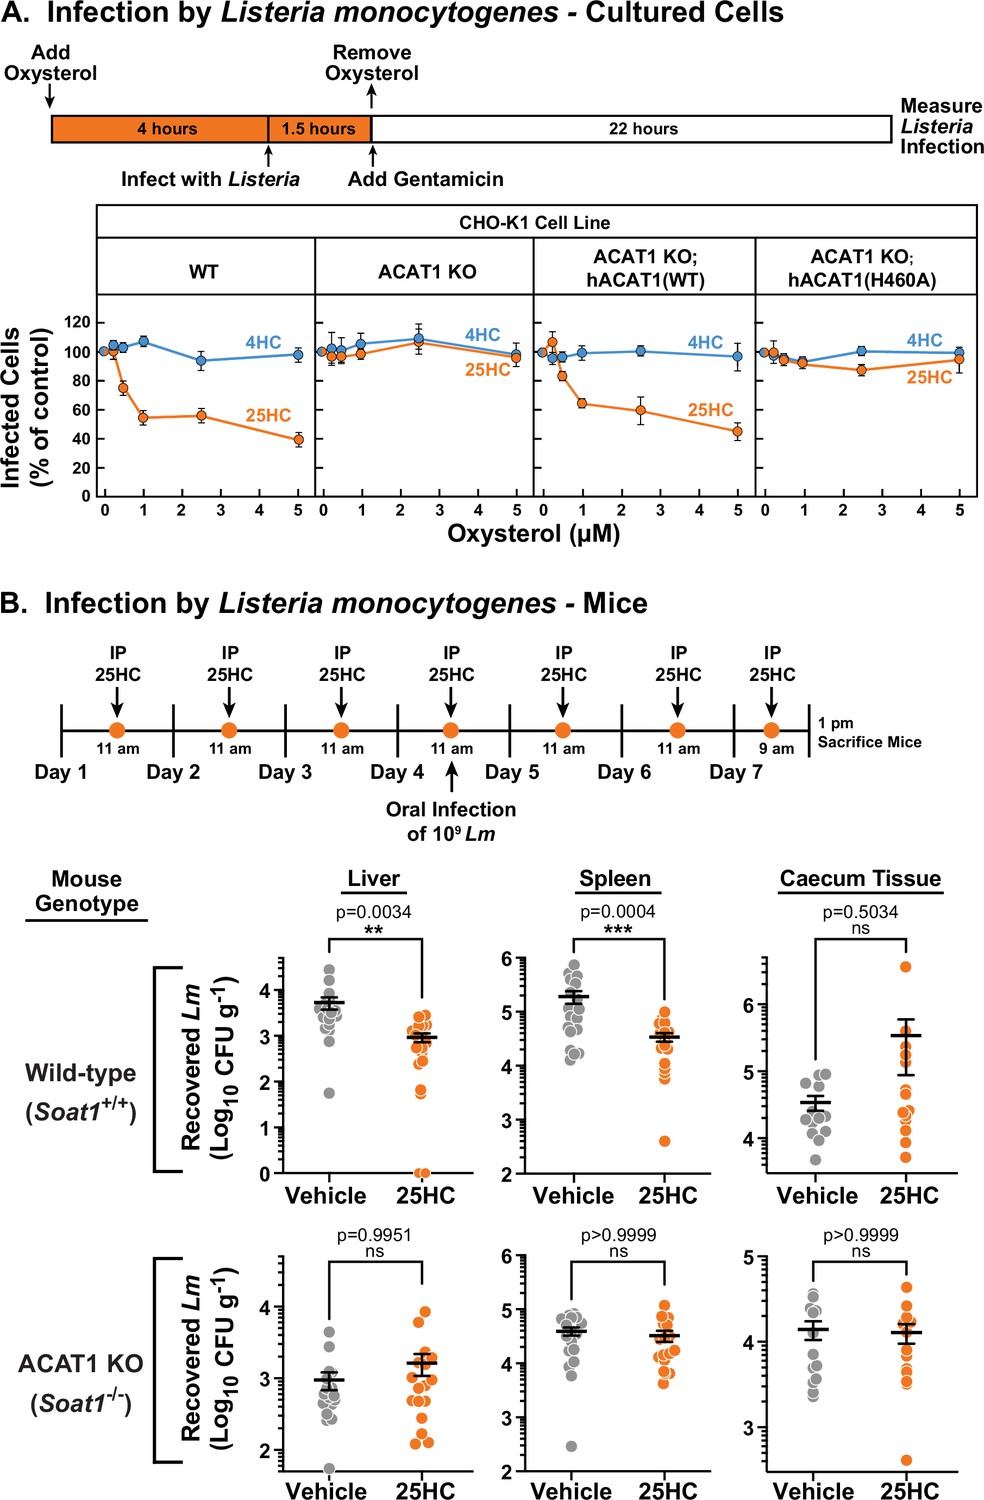
25HC fails to protect ACAT-deficient cell lines and mice from infection by Listeria monocytogenes.
(A) Listeria infection of CHO-K1 cells. On day 0, the indicated versions of CHO-K1 cells were set up in medium I at a density of 1x10⁵ cells per well of a 24-well plate. On day 1, media was supplemented with either 25HC or 4HC to obtain the final concentration indicated. After incubation at 37 °C for 4 hr, cells were infected with Listeria monocytogenes (MOI = 1) for 90 min. Following this step, cells were washed twice with 1 ml of PBS followed by addition of 1 ml of medium I supplemented with 50 µg/ml of gentamicin to kill extracellular bacteria. After 22 hr, cells were harvested and infection levels were determined as described in Materials and methods. For each cell line, the infection level measured in the absence of oxysterols was set to 100% for each replicate, and all other values were normalized to this set-point. (B) Listeria infection of mice. On days 1–7, wild-type and ACAT1 KO mice were injected once daily intraperitoneally with either 25HC or ethanol. On day 4, the mice were orally infected with 1x10⁹ Listeria monocytogenes strain EGD harboring a mutation in Internalin A (Lm-InlAm) as described in the Materials and methods. On day 7, 4 hr after the 25HC injection, the spleen, liver, and caecum tissues of each mouse was collected and infection levels were determined as described in Materials and methods. Asterisks denote levels of statistical significance (one-way analysis of variance (ANOVA) with Dunnett’s correction): non-significant (ns) p>0.05; * p≤0.05; ** p≤0.01; and *** p≤0.001. IP, intraperitoneal injection.
-
Figure 6—source data 1
Data supporting Figure 6 and Figure 6—figure supplement 1.
- https://cdn.elifesciences.org/articles/83534/elife-83534-fig6-data1-v3.zip
Figure 6—figure supplement 1
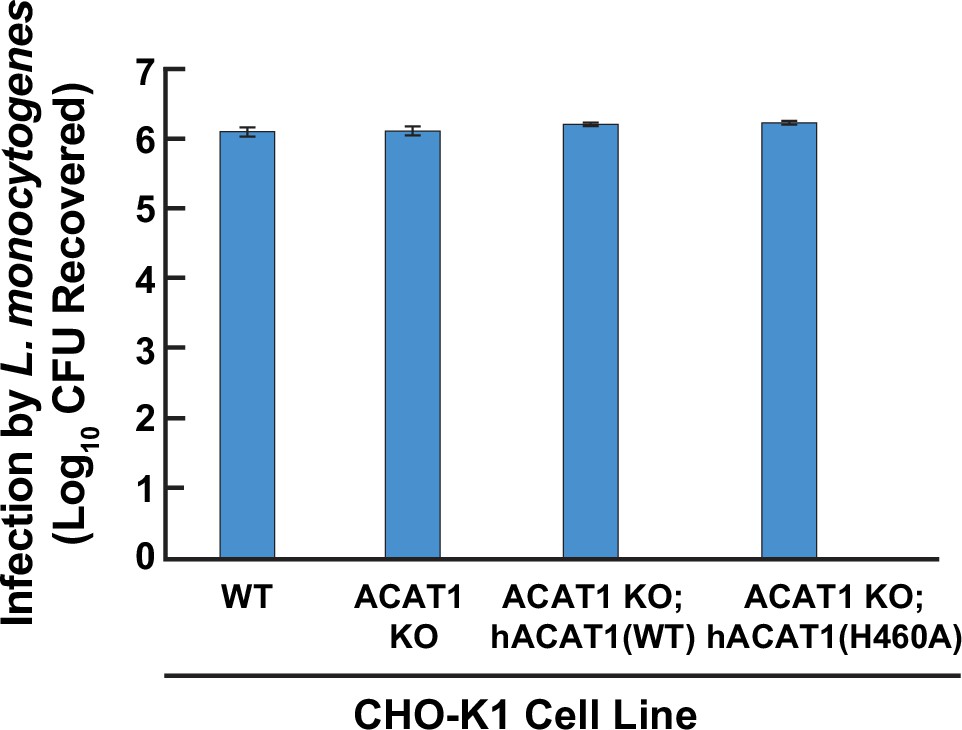
Susceptibility of wild-type and ACAT-deficient CHO-K1 cells to infection by Listeria monocytogenes.
On day 0, the indicated versions of CHO-K1 cells were set up in medium I at a density of 1x10⁵ cells per well of a 24-well plate. On day 1, cells were infected with Listeria monocytogenes (MOI = 1) for 90 min. Following this step, cells were washed twice with 1 ml of PBS followed by addition of 1 ml of medium I supplemented with 50 µg/ml of gentamicin. After 22 hr, cells were harvested, and infection levels were determined as described in Materials and methods.
Figure 7 with 1 supplement
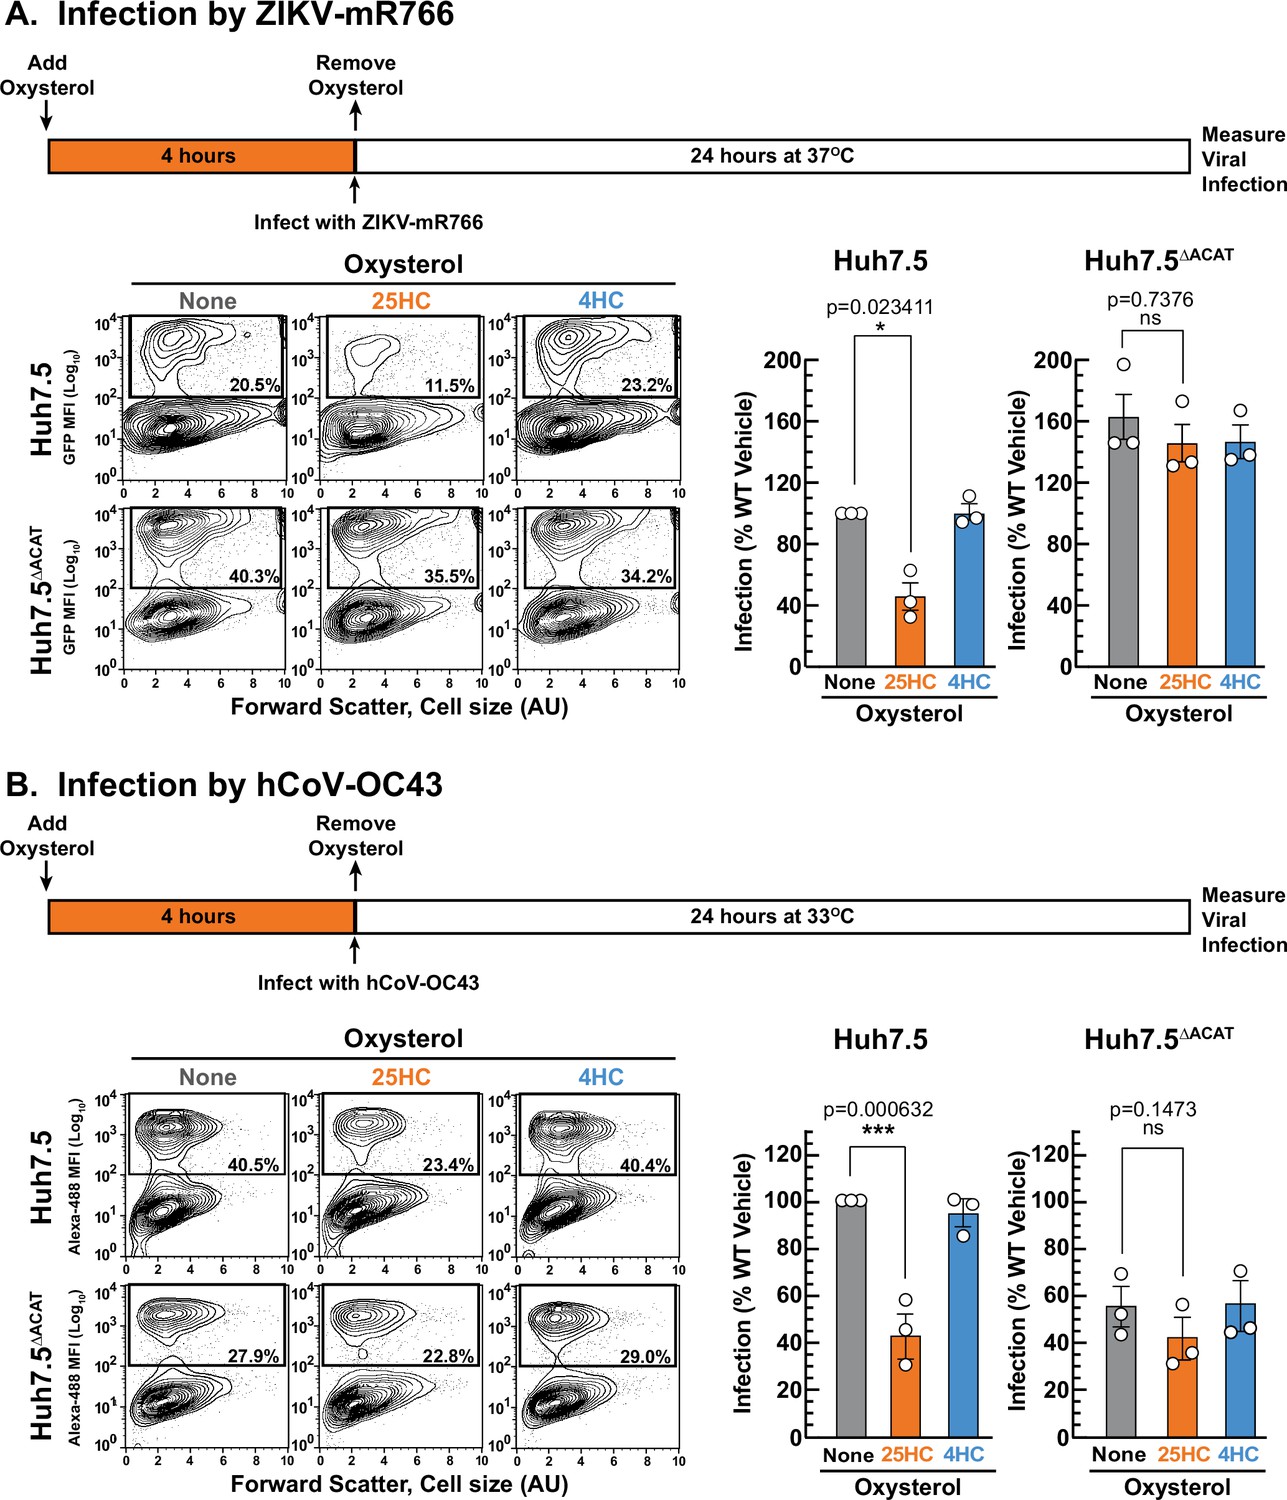
25HC fails to protect ACAT-deficient cells from viral infection.
(A, B) Viral infection of Huh7.5 cells. On day 0, the indicated versions of Huh7.5 cells were set up in medium E at a density of 7x10⁴ cells per well of a 24-well plate. On day 1, media was removed and replaced with 1 ml of medium E supplemented with 5 µM of the indicated oxysterol. After incubation at 37 °C for 4 hr, media was removed, and cells were infected with either hCoV-OC43 (A) or ZIKV-mR766 (B) at the indicated temperatures as described in Materials and methods. After 24 hr, cells were harvested, and infection levels were determined as described in Materials and methods. Representative flow cytometry plots of infected cells and quantification of infection levels (rectangular boxes) are shown for hCoV-OC43 (A) and ZIKV-mR766 (B). The infection value obtained for Huh7.5 cells in the absence of oxysterol treatment for each experiment was set to 100% and all other values are normalized to this set-point. Asterisks denote levels of statistical significance (one-way analysis of variance (ANOVA) with Dunnett’s correction) of the unnormalized data: non-significant (ns) p>0.05; * p≤0.05; ** p≤0.01; and *** p≤0.001. In all panels, no significant differences (p>0.05) were detected in cells treated with 4HC.
-
Figure 7—source data 1
Data supporting Figure 7 and Figure 7—figure supplement 1B.
- https://cdn.elifesciences.org/articles/83534/elife-83534-fig7-data1-v3.zip
Figure 7—figure supplement 1
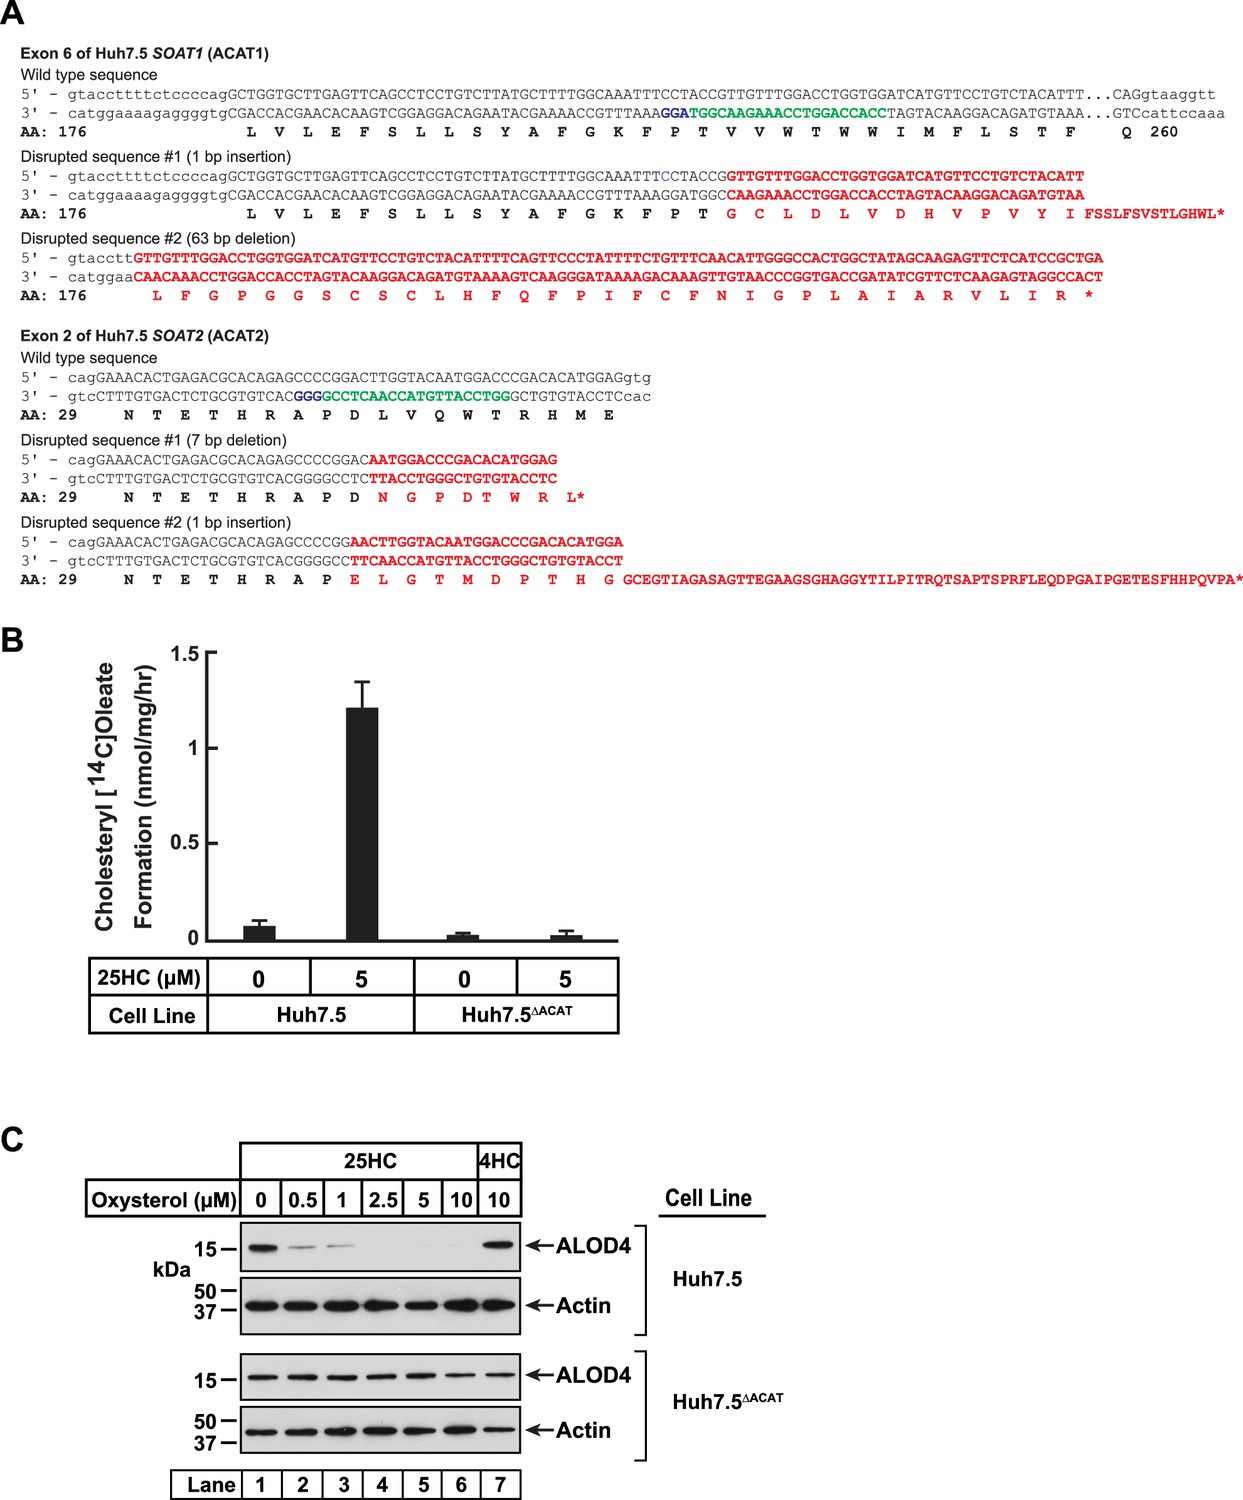
Characterization of a Huh7.5 cell line deficient in ACAT1 and ACAT2.
(A) Strategy for generating Huh7.5 cells deficient in ACAT1 and ACAT2. Guide RNAs were designed to target and disrupt exon 6 in human ACAT1 (also designated as SOAT1) and exon 2 in human ACAT2 (also designated as SOAT2). The 20-nucleotide target sequences are shown in green and the NGG PAM sequences are in purple. Genomic sequencing of the SOAT1 (ACAT1) gene revealed a 1 bp insertion in one allele and a 63 bp deletion in the other allele that generated premature stop codons and truncated transcripts as indicated in red. Genomic sequencing of the SOAT2 (ACAT2) gene revealed a 7 bp deletion in one allele and a 1 bp insertion in the other allele that generated premature stop codons and truncated transcripts as indicated in red. (B) ACAT activity. On day 0, the indicated versions of Huh7.5 cells were set up in medium D at a density of 2.5x10⁵ cells per 60 mm dish. On day 2, media was removed, cells were washed twice with 1 ml of PBS followed by addition of 2 ml of cholesterol-depleting medium (DMEM (high glucose) supplemented with 5% (v/v) LPDS, 50 µM compactin, 50 µM sodium mevalonate, 100 units/ml penicillin, and 100 µg/ml streptomycin sulfate). On day 3, media was removed, cells were washed with 1 ml of PBS followed by addition of 1 ml of the above cholesterol-depleting medium supplemented with the indicated concentration of 25HC. After incubation at 37 °C for 1 hr, each dish was supplemented with 0.2 mM sodium [14C]oleate (6500 dpm/nmol) and incubated at 37 °C for an additional 2 hr, after which cells were harvested, and levels of cholesteryl [14C]oleate were measured as described in Materials and Methods. Each column represents the mean of cholesterol esterification measurements from three experiments, and error bars show the standard error. (C) Immunoblot analysis of ALOD4 binding. On day 0, the indicated versions of Huh7.5 cells were set up in medium D at a density of 1.5x10⁵ cells per well of a 24-well plate. On day 1, media was removed, cells were washed twice with 500 µl of PBS followed by addition of 200 µl of medium D supplemented with the indicated concentrations of either 25HC or 4HC. After incubation at 37 °C for 4 hr, media was removed and replaced with 200 μl of medium D supplemented with 3 μM of His6-Flag-ALOD4. After incubation at 37 °C for 30 min, cells were washed twice with 500 µl of PBS, harvested, and equal aliquots of cell lysates were subjected to immunoblot analysis as described in Materials and methods.
-
Figure 7—figure supplement 1—source data 1
Western blots corresponding to Figure 7—figure supplement 1C.
- https://cdn.elifesciences.org/articles/83534/elife-83534-fig7-figsupp1-data1-v3.zip
Author response image 1
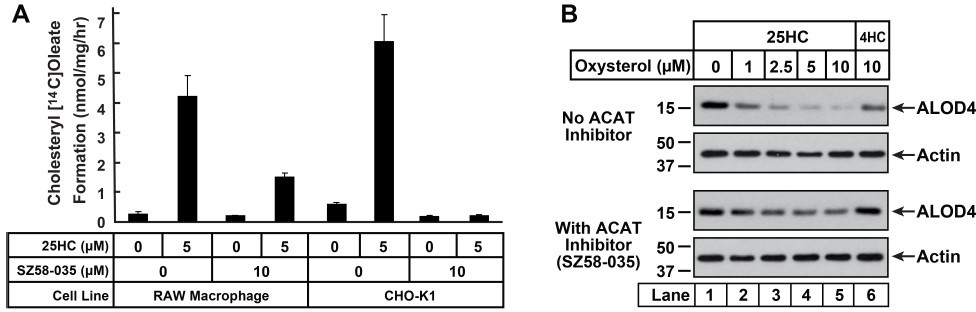
Inhibition of ACAT activity and depletion of accessible PM cholesterol by 25HC in RAW macrophage cells.
(A) ACAT activity [same procedure as in Figure 1F]. On day 0, cells were set up either in medium D (RAW) or medium B (CHO-K1) at a density of 2.5 x 10⁵ cells per 60-mm dish. One day 2, media was removed, cells were washed twice with PBS followed by addition of 2 ml of media containing lipoprotein-deficient serum and compactin, without or with 10 µm ACAT inhibitor SZ58-035. On day 3, media was removed, cells were washed with PBS followed by addition of 1 ml of same media supplemented with 25HC [in the absence of or presence of SZ58-035]. After incubation at 37°C for 1 h, each dish was supplemented with 0.2 mm sodium [14C]oleate and incubated at 37°C for an additional 2 h, after which cells were harvested and levels of [14C]cholesteryl oleate were measured as described in the methods. Each column represents the mean of cholesterol esterification measurements (in triplicate) from two independent experiments. (B) ALOD4 binding. On day 0, RAW macrophage cells were set up in medium D containing 10% FCS at a density of 7.5 x 10⁴ cells per well of a 24-well plate. One day 1, media was removed, cells were washed twice with PBS followed by addition of 200 µl medium D (with 10% FCS) without or with 10 µm of SZ58-035. After 18 hours, media was replaced with 200 µl of the same media supplemented with the indicated concentrations of 25HC, without or with 10 µm of SZ58-035. After 1 hour, media was removed and replaced with 200 µl media supplemented with 3 µm His6-FLAG-ALOD4. After incubation at 37°C for 30 min, cells were washed twice with PBS, harvested and subjected to immunoblot analysis as described in methods.
Tables
Appendix 1—key resources table
| Reagent type (species) or resource | Designation | Source or reference | Identifiers | Additional information |
|---|---|---|---|---|
| Gene (Cricetulus griseus) | Soat1 | NCBI Gene | Gene ID:100689317 | |
| Gene (H. sapiens) | SOAT1 | NCBI Gene | Gene ID:6646 | |
| Gene (H. sapiens) | SOAT2 | NCBI Gene | Gene ID:8435 | |
| Strain, strain background (Mus musculus) | C57BL/6 J | The Jackson Laboratory | Cat#000664 | |
| Strain, strain background (M. musculus) | Wild Type C57BL/6JSoat1+/+ | This paper | Experimental Wild-type mice | |
| Strain, strain background (M. musculus) | Mouse: ACAT1+/-: C57BL/6JSoat+/- | This paper | Heterozygous ACAT1 mice | |
| Strain, strain background (M. musculus) | Mouse: ACAT1-/-: C57BL/6JSoat1-/- | This paper | PMID:8943057 | Experimental ACAT1 KO mice |
| Strain, strain background (Listeria monocytogenes) | 10403s | PMID:3114382 | Gift from Dr. Daniel Portnoy, University of California, Berkeley | |
| Strain, strain background (L. monocytogenes) | EGD InlAmut | PMID:17540170 | Gift from Dr. Wolf-Dieter Schubert, University of Pretoria, South Africa | |
| Strain, strain background (Escherichia coil) | BL21 (DE3) pLysS | Invitrogen | Cat#C606003 | Chemically competent cells |
| Strain, strain background (Coronaviridae) | hCoV-OC43 | ATCC | Cat# VR-1558 | |
| Cell line (C. griseus) | CHO-K1 | ATCC | CAT#CCL-61 | |
| Cell line (C. griseus) | CHO-K1 ACAT1 KO | This paper | Dr. Arun Radhakrishnan (UTSW) | |
| Cell line (C. griseus) | CHO-K1 ACAT1 KO; hACAT1(WT) | This paper | Dr. Arun Radhakrishnan (UTSW) | |
| Cell line (C. griseus) | CHO-K1 ACAT1 KO; hACAT1(H460A) | This paper | Dr. Arun Radhakrishnan (UTSW) | |
| Cell line (C. griseus) | M19 | PMID:9748295 | Dr. Arun Radhakrishnan (UTSW) | |
| Cell line (C. griseus) | SRD13A | PMID:10497220 | Dr. Arun Radhakrishnan (UTSW) | |
| Cell line (H. sapiens) | HEK293A | PMID:32284563 | Dr. Neal Alto (UTSW) | |
| Cell line (H. sapiens) | HEK293A LXRα;LXRβ-deficient cells | PMID:32284563 | Dr. Neal Alto (UTSW) | |
| Cell line (H. sapiens) | HEK293T | PMID:21478870 | Dr. John Schoggins (UTSW) | |
| Cell line (H. sapiens) | Huh7.5 | PMID:21478870 | Dr. John Schoggins (UTSW) | |
| Cell line (H. sapiens) | Huh7.5ΔACAT | This paper | Dr. Neal Alto (UTSW) | |
| Transfected construct (human) | pCDNA6.ZikaMR766.Venus3115Intron HDVr | PMID:27704051 | Dr. Matthew Evans (Icahn School of Medicine at Mount Sinai) | |
| Transfected construct (human) | pGag-pol | Other | Dr. Charles Rice (Rockefeller University) | |
| Transfected construct (human) | pLentiCRISPRv2-Blast | Addgene | Cat#98293 | |
| Transfected construct (human) | pLentiCRISPRv2-Puro | Addgene | Cat#98290 | |
| Transfected construct (human) | pTRIP.CMV.IVSB.ires.TagRFP | PMID:21478870 | Dr. John Schoggins (UTSW) | |
| Transfected construct (human) | pTRIP.CMV.hACAT1.ires.TagRFP | This paper | Dr. Arun Radhakrishnan (UTSW) | |
| Transfected construct (human) | pTRIP.CMV.hACAT1(H460A).ires.TagRFP | This paper | Dr. Arun Radhakrishnan (UTSW) | |
| Transfected construct (human) | pVSV-Glycoprotein | Other | Dr. Charles Rice (Rockefeller University) | |
| Antibody | anti-mouse IgG (H+L) (Donkey Polyclonal Peroxidase-AffiniPure) | Jackson ImmunoResearch | Cat#715-035-150; RRID: AB_2340770 | WB (1:5,000) |
| Antibody | anti-rabbit IgG (H+L) (Goat Polyclonal Peroxidase AffiniPure) | Jackson ImmunoResearch | Cat#111-035-003; RRID:AB_2313567 | WB (1:5,000) |
| Antibody | anti-Coronavirus Group Antigen, nucleoprotein of OC-43, 229E strain, clone 542-7D (Mouse Monoclonal) | Millipore Sigma | Cat# MAB9013; RRID:AB_95425 | Flow cytometry (1:50) |
| Antibody | anti-FLAG M2 clone (Mouse Monoclonal) | Sigma-Aldrich | F1804; RRID:AB_262044 | WB (1:1,000) |
| Antibody | anti-His Tag, clone HIS.H8 (Mouse Monoclonal) | Millipore | Cat#05–949; RRID:AB_492660 | WB (1:1,000) |
| Antibody | anti-SREBP2 (Mouse Monoclonal) | Ref. (95) | IgG-7D4 | WB (10 μg/ml) |
| Antibody | anti-Mouse IgG (H+L) Cross-Adsorbed Secondary Antibody, Alexa Fluor 488 (Mouse Polyclonal Goat) | Thermo Fisher Scientific | Cat#A-11001; RRID:AB_2534069 | Flow cytometry (1:1,000) |
| Antibody | anti-ACAT1 (Rabbit Polyclonal) | Novus | Cat#NB400-141; RRID:AB_10001588 | WB (1:1,000) |
| Recombinant DNA reagent | His6-ALO(FL) in pRSET-B | PMID:25809258 | Dr. Arun Radhakrishnan (UTSW) | |
| Recombinant DNA reagent | His6-FLAG-ALOD4 in pRSET-B | PMID:33712199 | Dr. Arun Radhakrishnan (UTSW) | |
| Recombinant DNA reagent | His6-Neon-FLAG-ALOD4 in pRSET-B | PMID:33712199 | Dr. Arun Radhakrishnan (UTSW) | |
| Recombinant DNA reagent | OlyA-His6 in pRSET-B | PMID:33712199 | Dr. Arun Radhakrishnan (UTSW) | |
| Recombinant DNA reagent | His6-PFO(FL) in pRSET-B | PMID:25809258 | Dr. Arun Radhakrishnan (UTSW) | |
| Sequence-based reagent | CHO-K1 Soat1 gRNA for Exon 2 | This paper | Target sequence | AGGAACCGGCTGTCAAAATC |
| Sequence-based reagent | CHO-K1 Soat1 gRNA for Exon 14 | This paper | Target sequence | ATAGCTCAAGCAGACAGCGA |
| Sequence-based reagent | Huh7.5 SOAT1 gRNA for Exon 6 | This paper | Target sequence | CACCAGGTCCAAACAACGGT |
| Sequence-based reagent | Huh7.5 SOAT2 gRNA for Exon 2 | This paper | Target sequence | GGTCCATTGTACCAAGTCCG |
| Sequence-based reagent | CHO-K1 Soat1 Exon 2 Forward | This paper | PCR Primer | CTACAAGAGCTAGTTTCAGG |
| Sequence-based reagent | CHO-K1 Soat1 Exon 2 Reverse | This paper | PCR Primer | CCCTGTGTGTACAGTGCCTT |
| Sequence-based reagent | CHO-K1 Soat1 Exon 14 Forward | This paper | PCR Primer | TCACTCACCTTGAAGACCCA |
| Sequence-based reagent | CHO-K1 Soat1 Exon 14 Reverse | This paper | PCR Primer | GGGTTCCTCTCTACACACTCA |
| Sequence-based reagent | Huh7.5 Soat1 Exon 6 Forward | This paper | PCR Primer | CAGCGTATTAACGTTGTGGTGT |
| Sequence-based reagent | Huh7.5 Soat1 Exon 6 Reverse | This paper | PCR Primer | GCCCAATGTTGAAACAGAAAAT |
| Sequence-based reagent | Huh7.5 Soat2 Exon 2 Forward | This paper | PCR Primer | CAACTTCCCCTTCTAGTAGCCC |
| Sequence-based reagent | Huh7.5 Soat2 Exon 2 Reverse | This paper | PCR Primer | CTTTATCACCAAGCCTCACTCC |
| Commercial assay or kit | Cytofix/Cytoperm Fixation/Permeabilization Kit | BD Biosciences | Cat#554714; RRID:AB_2869008 | |
| Commercial assay or kit | LookOut Mycoplasma PCR Detection Kit | Millipore Sigma | Cat# MP0035 | |
| Commercial assay or kit | Microplate BCA Protein Assay Kit | Thermo Fisher Scientific | Cat#23252 | |
| Chemical compound, drug | 19-hydroxycholesterol | Steraloids | Cat#C6470-000 | |
| Chemical compound, drug | 2-Hydroxypropyl-β-cyclodextrin (HPCD) | Cyclodextrin Technologies Development | Cat#THPB-P | |
| Chemical compound, drug | 20(R)-hydroxycholesterol | Avanti Polar Lipids | Cat#700156 | |
| Chemical compound, drug | 22(R)-hydroxycholesterol | Avanti Polar Lipids | Cat#700058 | |
| Chemical compound, drug | 22(S)-hydroxycholesterol | Avanti Polar Lipids | Cat#700057 | |
| Chemical compound, drug | 24(R)-hydroxycholesterol | Avanti Polar Lipids | Cat#700071 | |
| Chemical compound, drug | 24(S)-hydroxycholesterol | Avanti Polar Lipids | Cat#700061 | |
| Chemical compound, drug | 25-hydroxycholesterol | Avanti Polar Lipids | Cat#700019 | |
| Chemical compound, drug | 25-hydroxycholesterol-3-sulfate | Avanti Polar Lipids | Cat#700017 | |
| Chemical compound, drug | 25-hydroxycholesterol-d6 | Avanti Polar Lipids | Cat#700053 | |
| Chemical compound, drug | 27-hydroxycholesterol | Avanti Polar Lipids | Cat#700021 | |
| Chemical compound, drug | 4’,6-Diamidino-2-phenylindole dihydrochloride (DAPI) | Millipore Sigma | Cat#D8417 | Microscopy (1 µg/ml) |
| Chemical compound, drug | 4β-hydroxycholesterol | Avanti Polar Lipids | Cat#700036 | |
| Chemical compound, drug | 7α-hydroxycholesterol | Avanti Polar Lipids | Cat#700034 | |
| Chemical compound, drug | Accumax | Innovative Cell Technologies | Cat#AM105 | |
| Chemical compound, drug | Alexa Fluor 647 C2-maleimide | Thermo Fisher Scientific | Cat#A20347 | |
| Chemical compound, drug | Blasticidin S HCl | Thermo Fisher Scientific | Cat#A1113903 | |
| Chemical compound, drug | Bovine serum albumin | Millipore Sigma | Cat#P0834 | |
| Chemical compound, drug | Brain Heart Infusion Agar | Thermo Fisher Scientific | Cat#DF0418 | |
| Chemical compound, drug | Brain Heart Infusion Broth | Thermo Fisher Scientific | Cat#DF0037 | |
| Chemical compound, drug | Cholesterol | Millipore Sigma | Cat#C8667 | |
| Chemical compound, drug | cOmplete, EDTA-free Protease Inhibitor Cocktail | Roche | Cat# 05056489001 | |
| Chemical compound, drug | Dulbecco’s Modified Eagle Medium (DMEM) – high glucose | Sigma | Cat#D6429 | |
| Chemical compound, drug | Dulbecco’s Modified Eagle Medium (DMEM) – low glucose | Sigma | Cat#D6046 | |
| Chemical compound, drug | Dulbecco’s Modified Eagle Medium (DMEM)/F-12 (1:1 mixture) | Corning | Cat#10–090-CV | |
| Chemical compound, drug | Dulbecco’s phosphate buffered saline (PBS) | Thermo Fisher Scientific | Cat#MT21031CV | |
| Chemical compound, drug | Fetal Calf Serum | Sigma-Aldrich | Cat#F2442 | |
| Chemical compound, drug | Fluorescein-5-maleimide | Thermo Fisher Scientific | Cat#62245 | |
| Chemical compound, drug | Gentamicin | Quality Biological | Cat#120-098-661 | |
| Chemical compound, drug | Ghost Dye Violet 450 | Tonbo biosciences | Cat#13–0863 | |
| Chemical compound, drug | Hanks Balanced Salt Solution (HBSS) | Millipore Sigma | Cat#14175–095 | |
| Chemical compound, drug | Hexadimethrine bromide | Thermo Fisher Scientific | Cat#107689 | |
| Chemical compound, drug | MEM Non-Essential Amino Acids Solution (100 X) | Thermo Fisher Scientific | Cat#11140050 | |
| Chemical compound, drug | Methyl-β-cyclodextrin, randomly methylated (MCD) | Cyclodextrin Technologies Development | Cat#TRMB-P | |
| Chemical compound, drug | Muristerone A | Sigma-Aldrich | Cat#M7888 | |
| Chemical compound, drug | Opti-MEM | Thermo Fisher Scientific | Cat#31985062 | |
| Chemical compound, drug | Paraformaldehyde | Alfa Aesar | Cat#43368 | |
| Chemical compound, drug | Penicillin/Streptomycin | Gibco | Cat#15140–122 | |
| Chemical compound, drug | Phenylmethylsulfonyl fluoride (PMSF) | Goldbio | Cat#P-470–25 | |
| Chemical compound, drug | Puromycin | Thermo Fisher Scientific | Cat#A1113803 | |
| Chemical compound, drug | Rabbit Whole Blood | Innovative Research | Cat# IGRBWBK2E10ML | |
| Chemical compound, drug | Sodium compactin | PMID:624722 | N/A | |
| Chemical compound, drug | Sodium mevalonate | PMID:624722 | N/A | |
| Chemical compound, drug | Sandoz 58–035 (SZ58-035) | Millipore Sigma | Cat#S9318 | |
| Chemical compound, drug | Tris (2-carboxyethyl) phosphine Hydrochloride (TCEP) | Goldbio | Cat#TCEP1 | |
| Software, algorithm | Benchling CRISPR Guide RNA design tool | Benchling | https://www.benchling.com/crispr | |
| Software, algorithm | CHOP-CHOP | PMID:31106371 | https://chopchop.cbu.uib.no/ | |
| Software, algorithm | FlowJo | BD (Becton, Dickinson & Co.) | http://www.flowjo.com | |
| Software, algorithm | ImageJ | PMID:22930834 | https://imagej.nih.gov/ij/ | |
| Other | Eclipse Ti epifluorescence microscope | Nikon Inc. | N/A | Instrument used for microscopy imaging studies. |
| Other | S1000 Flow Cytometer | Stratedigm Inc. | NA | Instrument used for flow cytometry analysis. |
Additional files
Download links
A two-part list of links to download the article, or parts of the article, in various formats.
Downloads (link to download the article as PDF)
Open citations (links to open the citations from this article in various online reference manager services)
Cite this article (links to download the citations from this article in formats compatible with various reference manager tools)
A concerted mechanism involving ACAT and SREBPs by which oxysterols deplete accessible cholesterol to restrict microbial infection
eLife 12:e83534.
https://doi.org/10.7554/eLife.83534


