Initiation of HIV-1 Gag lattice assembly is required for recognition of the viral genome packaging signal
- Laboratory of Retrovirology, Rockefeller University, United States
- Howard Hughes Medical Institute, The Rockefeller University, United States
Figures
Figure 1 with 1 supplement
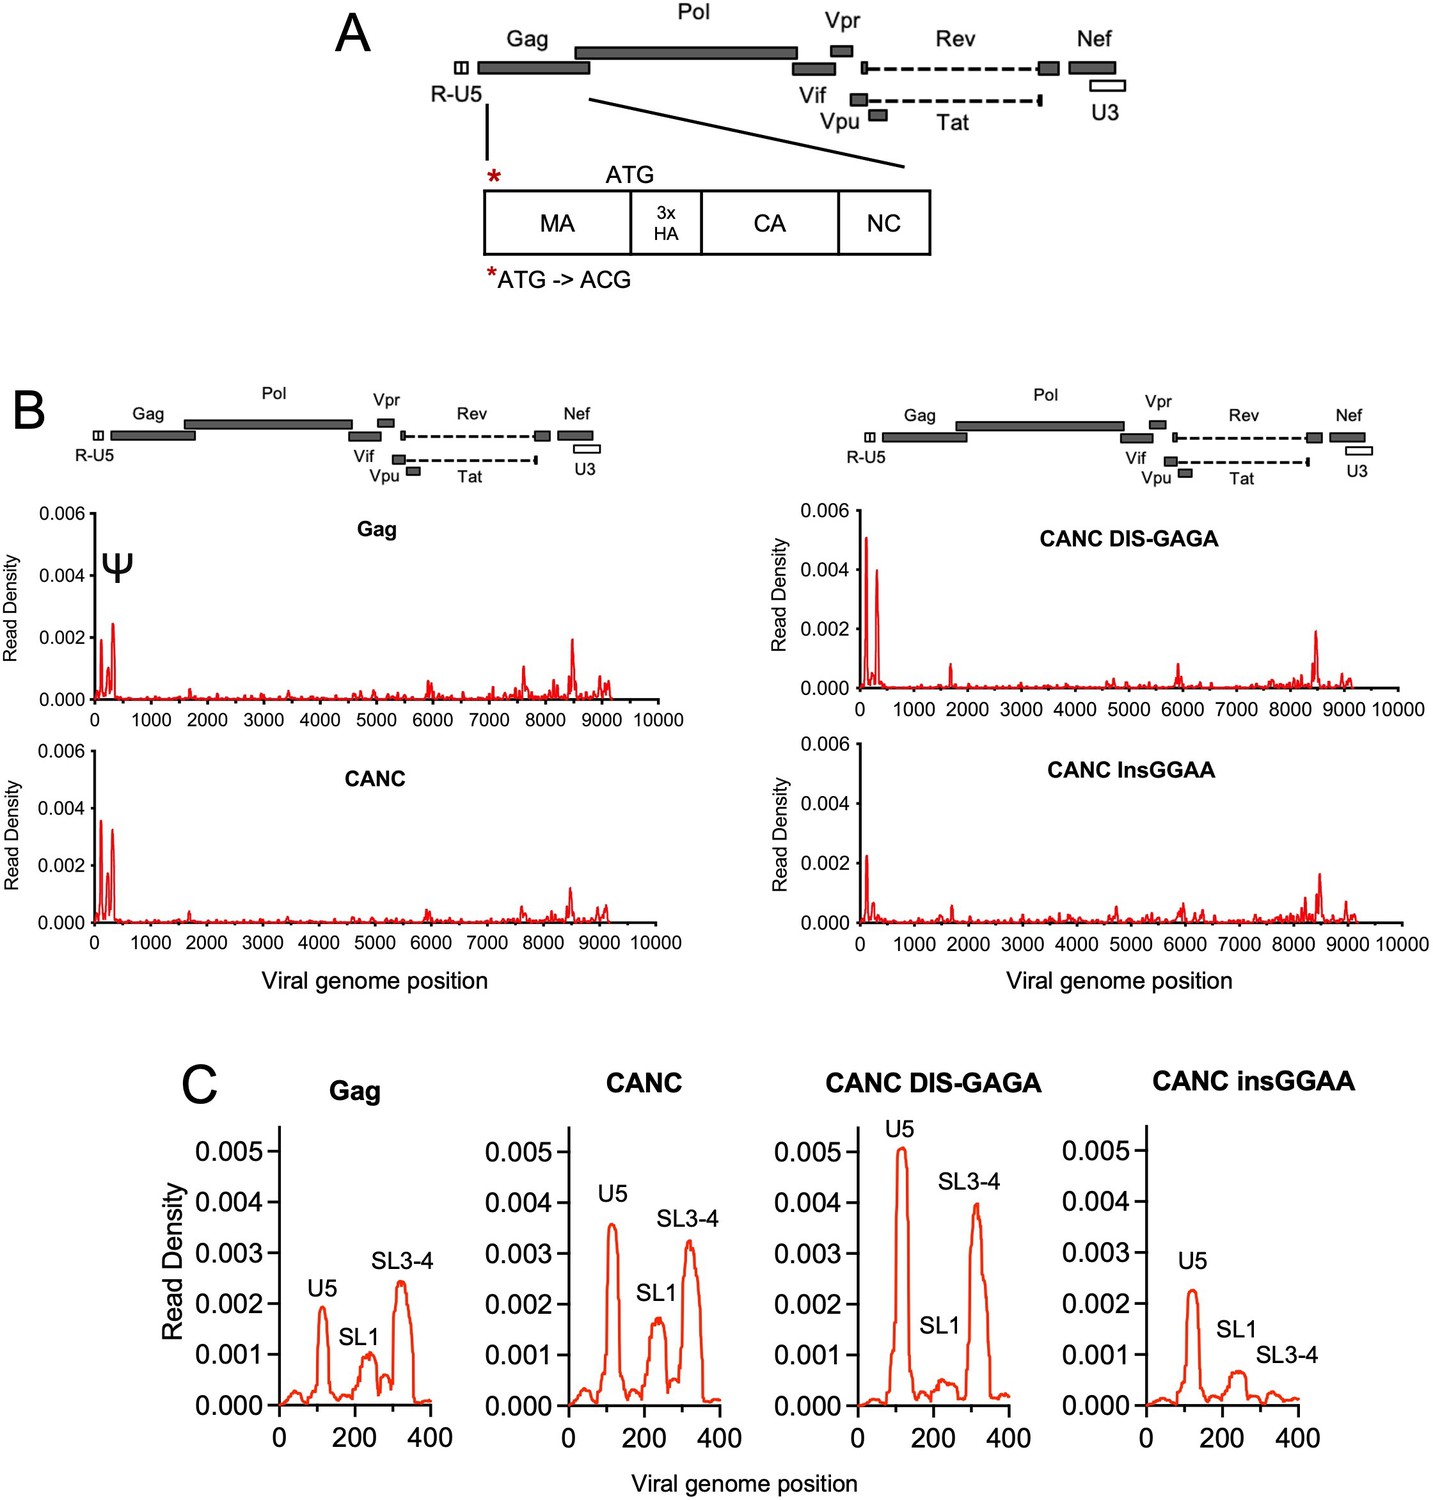
Crosslinking immunoprecipitation (CLIP) method validation and effects of Ψ perturbations on Gag recognition.
(A) Schematic representation of the pCANC construct. Asterisk indicates the mutation introduced at the matrix (MA) start codon (ATG to ACG). (B) Read density distribution on viral RNA from CLIP experiments in which constructs encoding Gag, CANC, or CANC with mutant Ψ elements (CANC DIS-GAGA and CANC InsGGAA) were used. The y-axis represents the decimal fraction of all reads that mapped to the viral genome in which a given nucleotide was present. The x-axis indicates the nucleotide position on the viral genome. A colinear schematic HIV-1 genome is presented above each set of charts. (C) Expanded view of read densities for the 400 nucleotides at the 5’ end of the viral genome. For (B) and (C), CLIP assays for each construct were repeated in at least two independent experiments, and the average read density is plotted.
-
Figure 1—source data 1
- https://cdn.elifesciences.org/articles/83548/elife-83548-fig1-data1-v2.zip
Figure 1—figure supplement 1
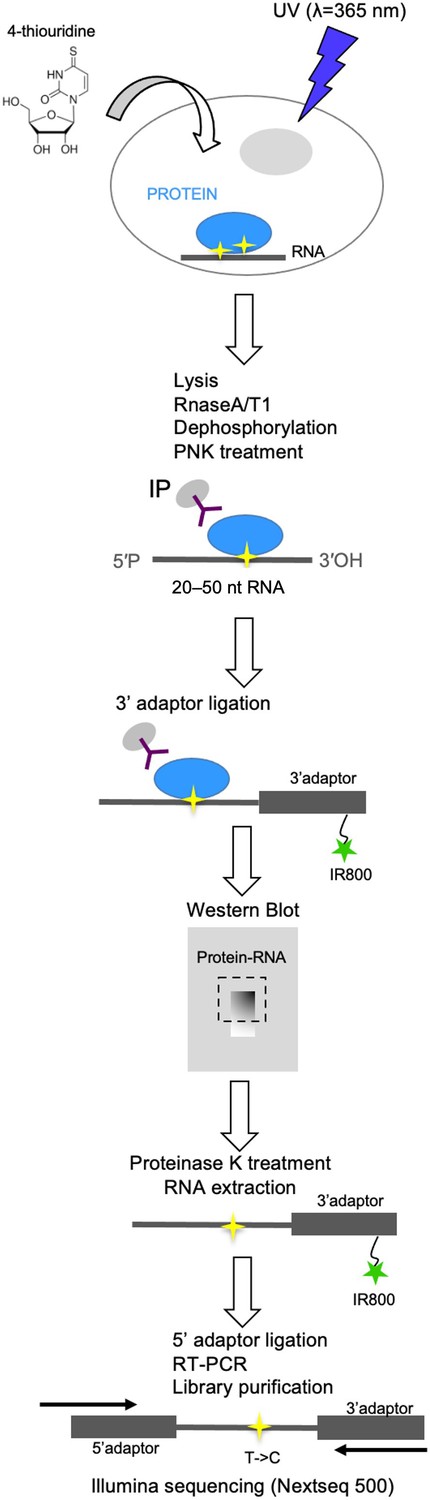
Crosslinking immunoprecipitation (CLIP) procedure.
Schematic flow diagram depiction of the CLIP procedure used in this study.
Figure 2 with 3 supplements
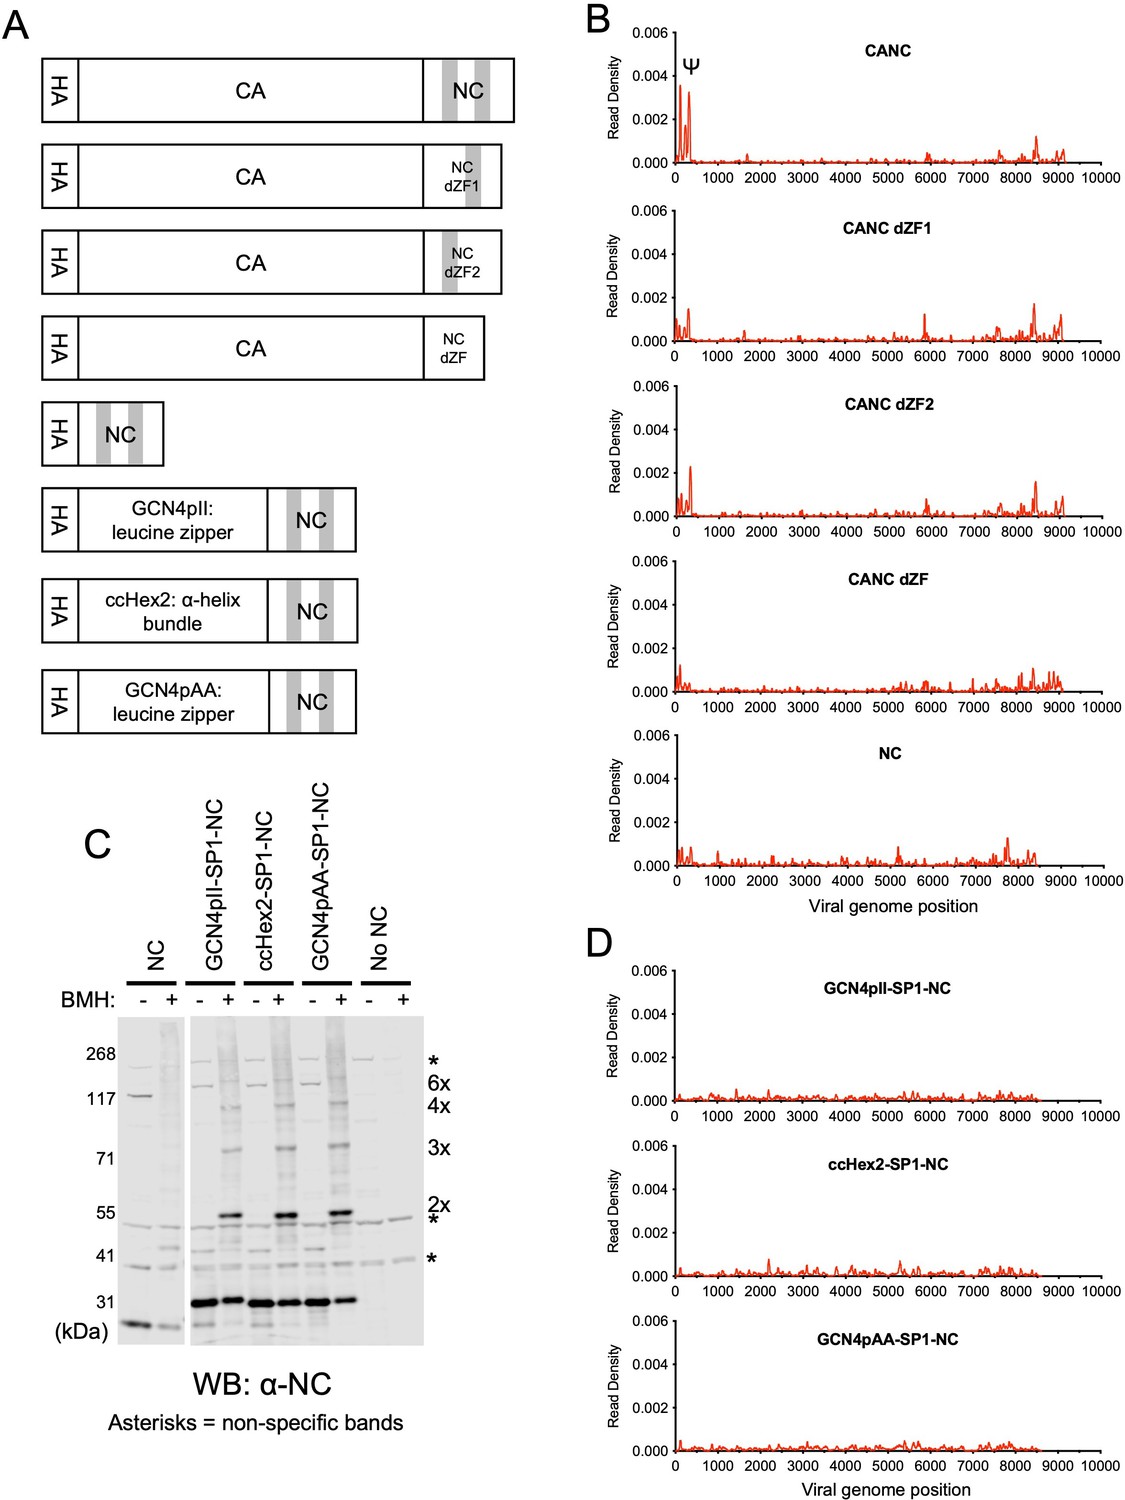
RNA binding specificity of nucleocapsid (NC) zinc-finger deletion mutants, monomeric NC, and artificially multimerized NC proteins.
(A) Schematic representation of the constructs used. Shaded regions indicate NC zinc fingers. (B) Read density distribution on viral RNA from crosslinking immunoprecipitation (CLIP) experiments in which constructs encoding CANC, and mutant derivatives with deletions of the zinc finger 1 (CANC dZF1), zinc finger 2 (CANC dZF2), or both zinc fingers (CANC dZF) were used. Alternatively, a construct (NC) in which capsid (CA) was deleted was used. Each chart represents at least two independent experiments, and the average read density is plotted. (C) Western blot analysis of Gag-derived proteins following chemical crosslinking in living cells using 1,6-Bismaleimidohexane (BMH) prior to cell lysis. Proteins were detected with an anti-NC antibody. (D) Read density distribution on viral RNA from CLIP experiments in which constructs encoding chimeric NC proteins with artificial multimerizing domains were used. Each chart represents at least two independent experiments, and the average read density is plotted.
-
Figure 2—source data 1
Uncropped and labeled blots for Figure 2C.
- https://cdn.elifesciences.org/articles/83548/elife-83548-fig2-data1-v2.zip
-
Figure 2—source data 2
- https://cdn.elifesciences.org/articles/83548/elife-83548-fig2-data2-v2.zip
Figure 2—figure supplement 1
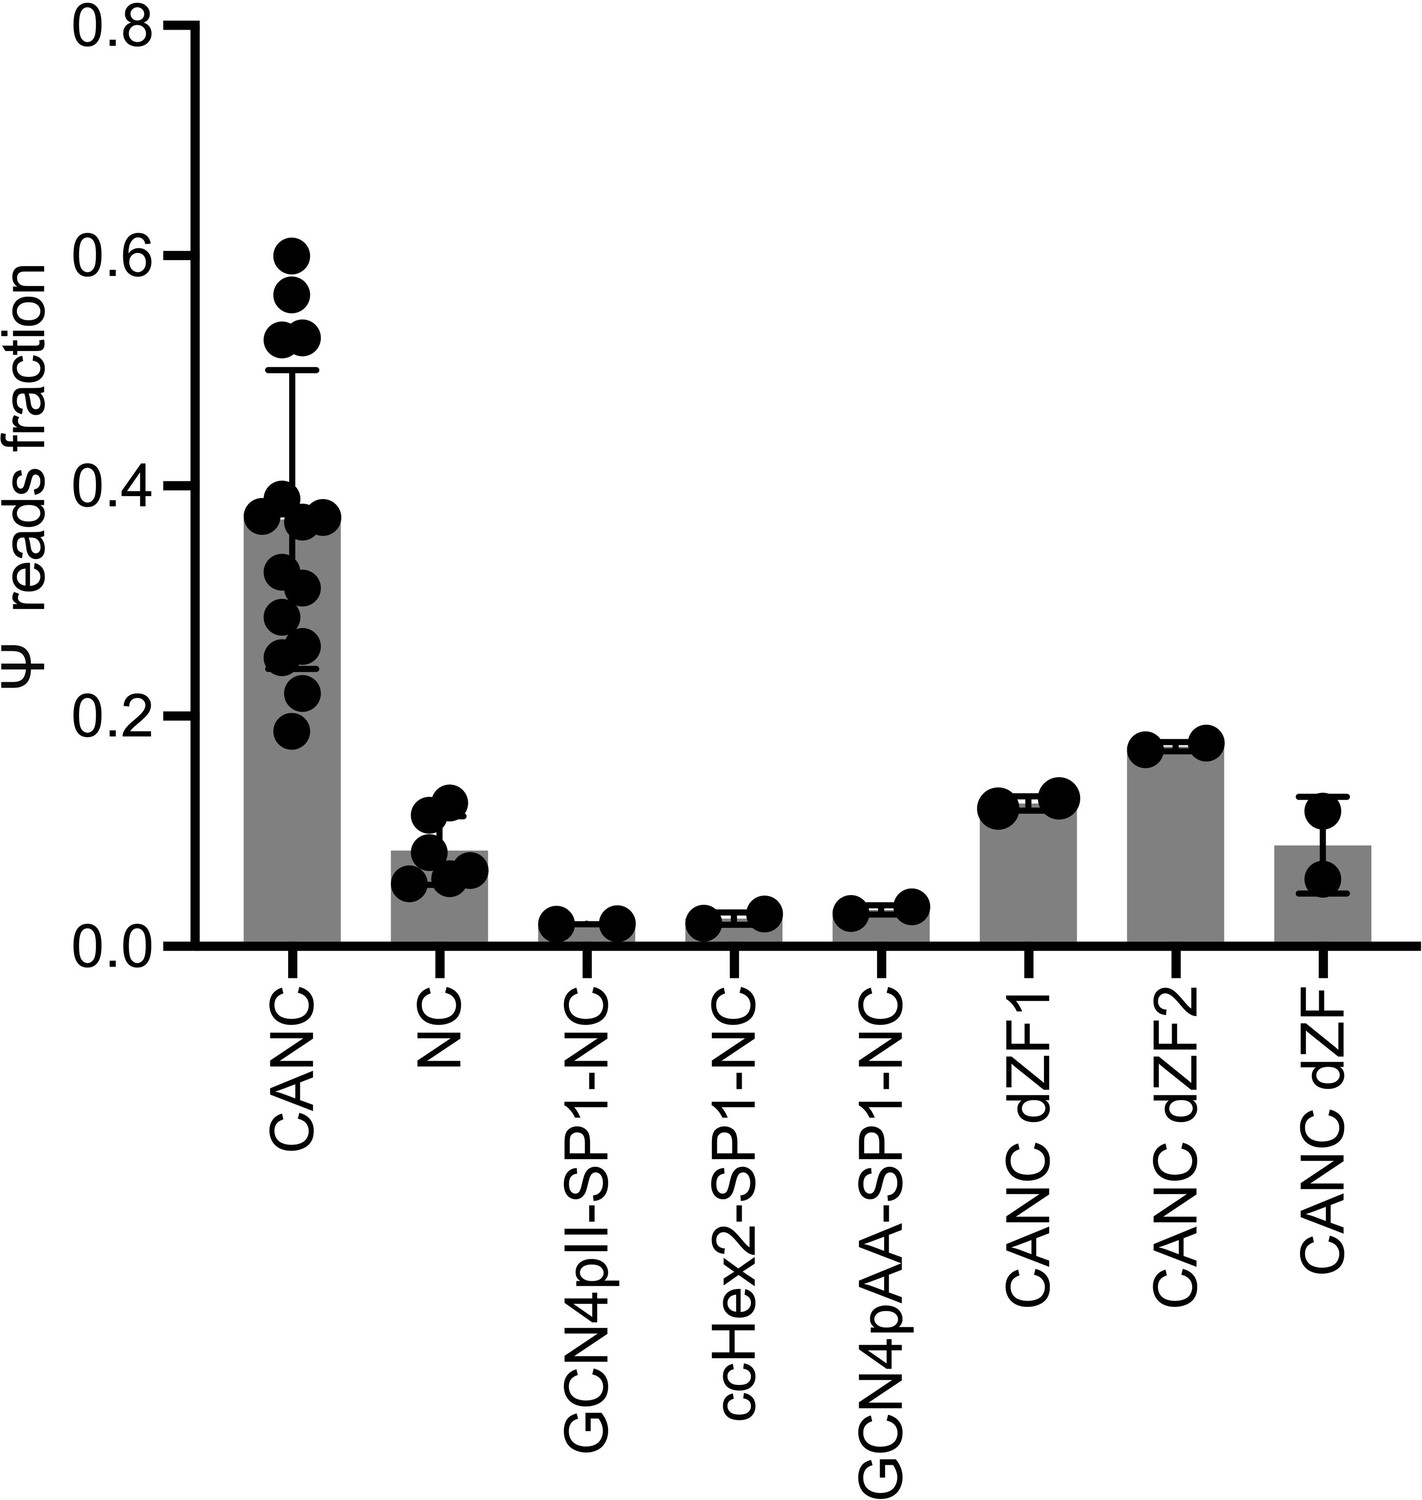
Quantification of Ψ binding specificity by CANC, nucleocapsid (NC), and artificially multimerized NC proteins.
The decimal fraction of reads, calculated by dividing the number of reads that mapped in the Ψ region of the genome (coordinates: 101–356) by the total number of reads mapped to the viral genome, is plotted. Each dot represented data from one independent experiment; error bars indicate SD.
Figure 2—figure supplement 2
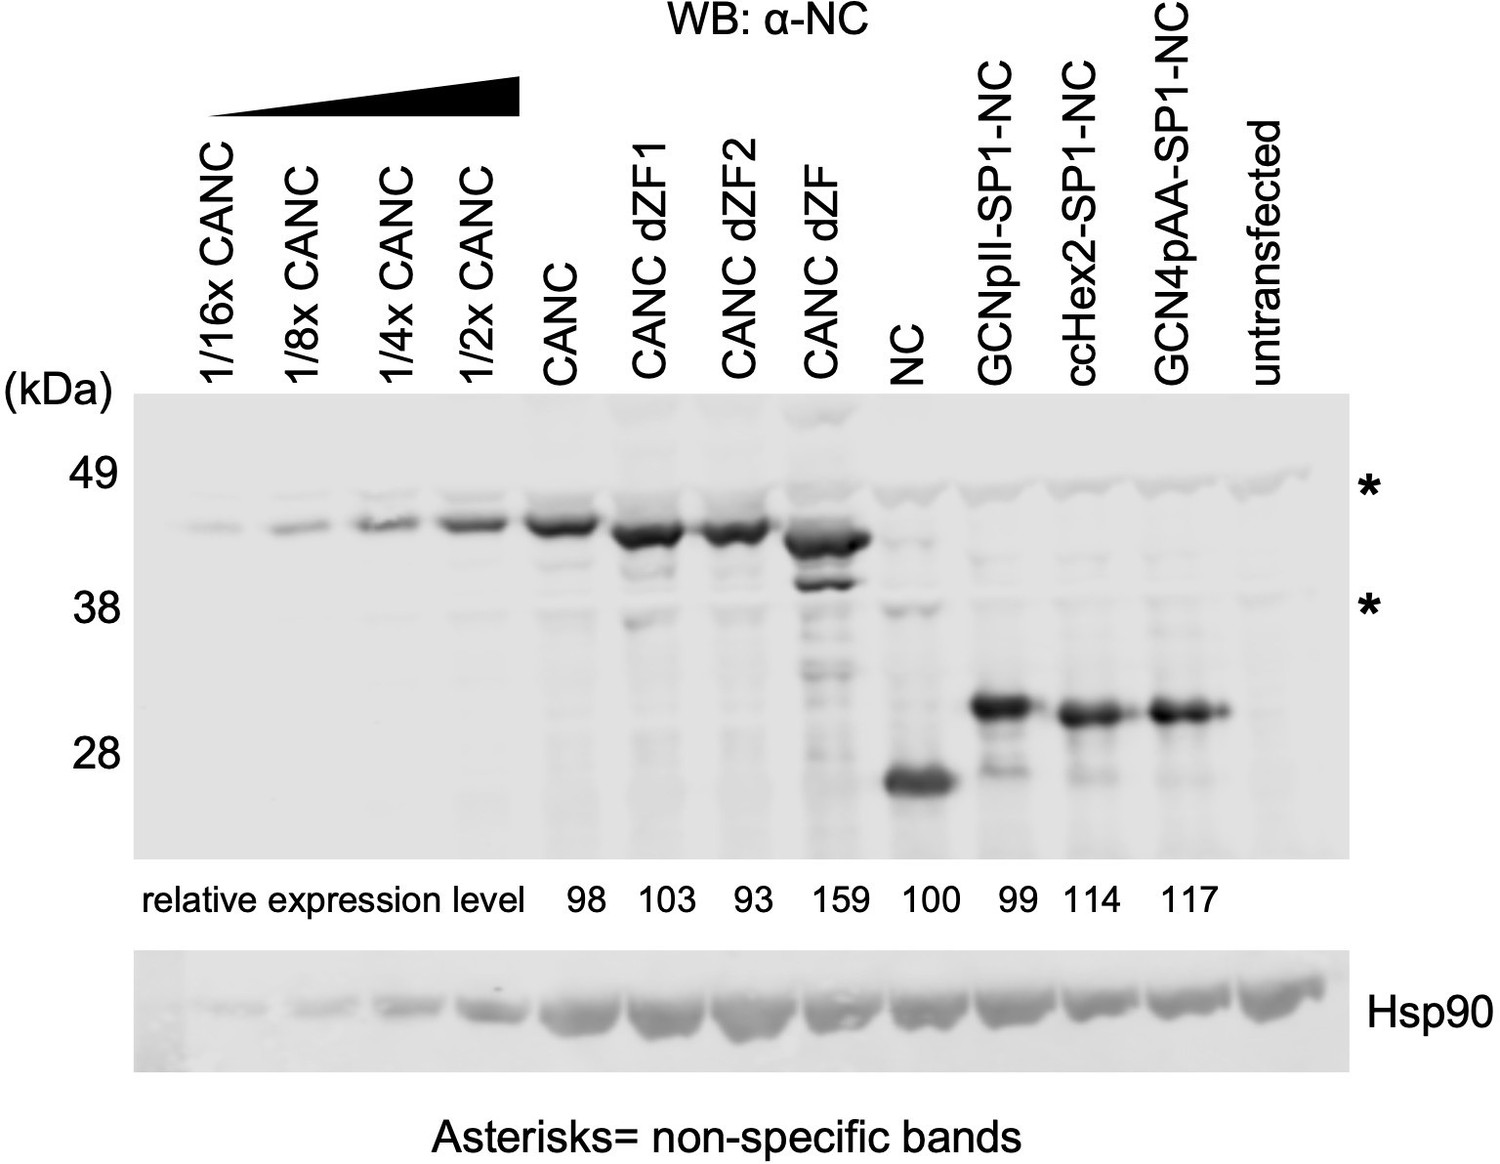
Quantification of protein expression levels of crosslinking immunoprecipitation (CLIP) constructs.
Western blot analysis of the CANC and chimeric fusion proteins used in CLIP experiments. Serial dilution of lysates containing CANC and Hsp90 was used to generate standard curves for quantification. Relative protein levels for each construct (numbers below each lane of the top panel) were first calculated relative to CANC (set at 100) and then further normalized based on the levels of Hsp90 for each construct. The Odyssey Image Studio (LI-COR Biosciences) was used to quantify protein bands.
-
Figure 2—figure supplement 2—source data 1
Uncropped and labeled blots Figure 2—figure supplement 2.
- https://cdn.elifesciences.org/articles/83548/elife-83548-fig2-figsupp2-data1-v2.zip
Figure 2—figure supplement 3
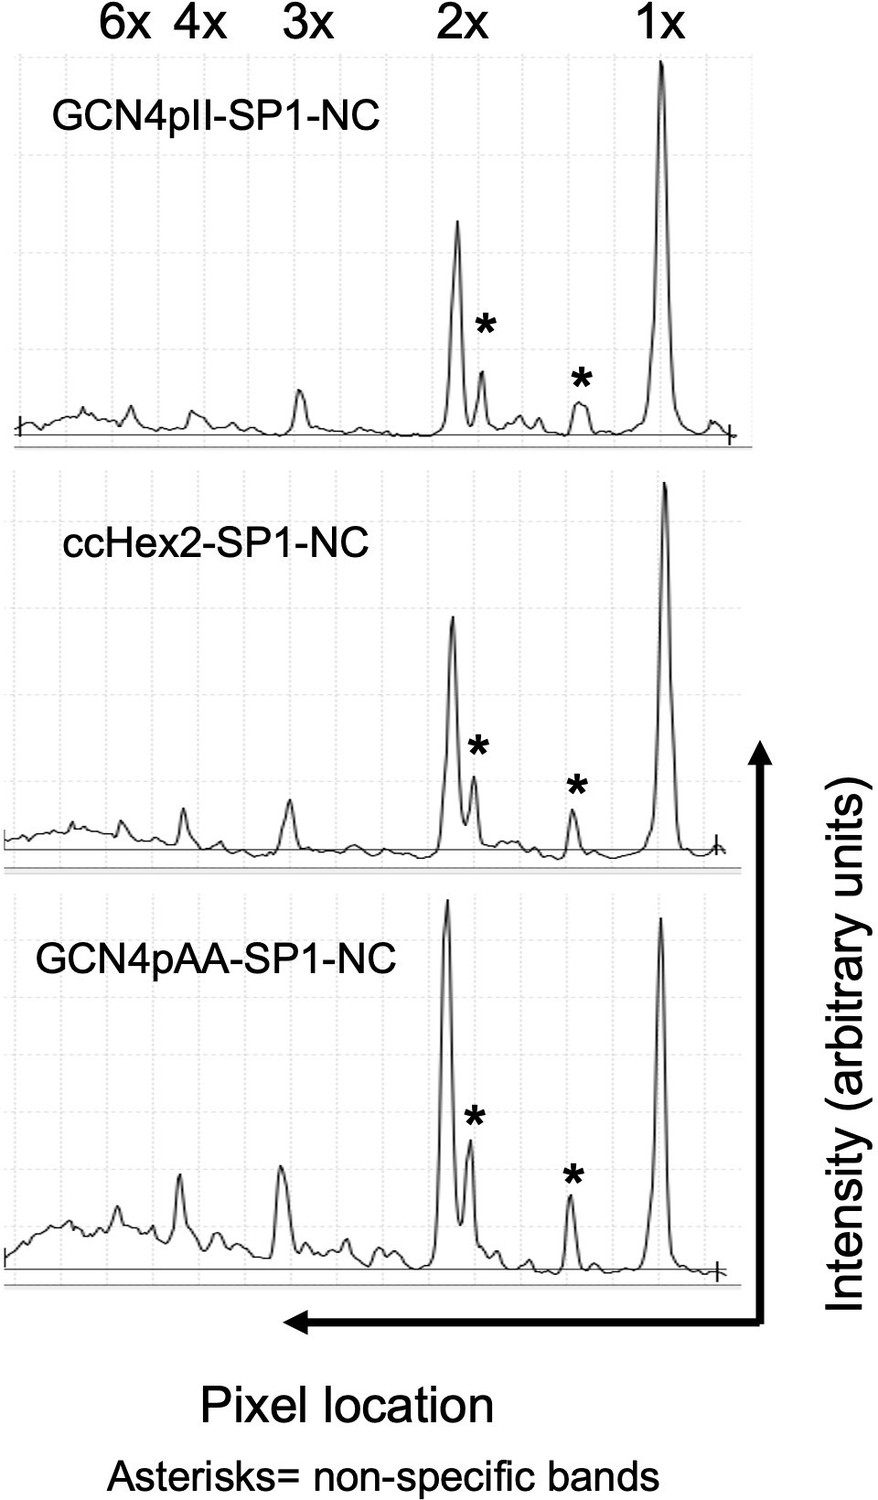
Quantitative analysis of BMH crosslinked species in Figure 2C.
Quantitative analysis of 1,6-Bismaleimidohexane (BMH) crosslinked artifically multimerized NC proteins in the western blot in Figure 2C. The x-axis shows the pixel location, and the y-axis indicates the average pixel intensity in the lane that was analyzed. The presumed stoichiometry of CANC multimerization based on migration in the gel is marked above each peak. The Odyssey Image Studio Suite (LI-COR Biosciences) was used to quantify protein bands.
Figure 3
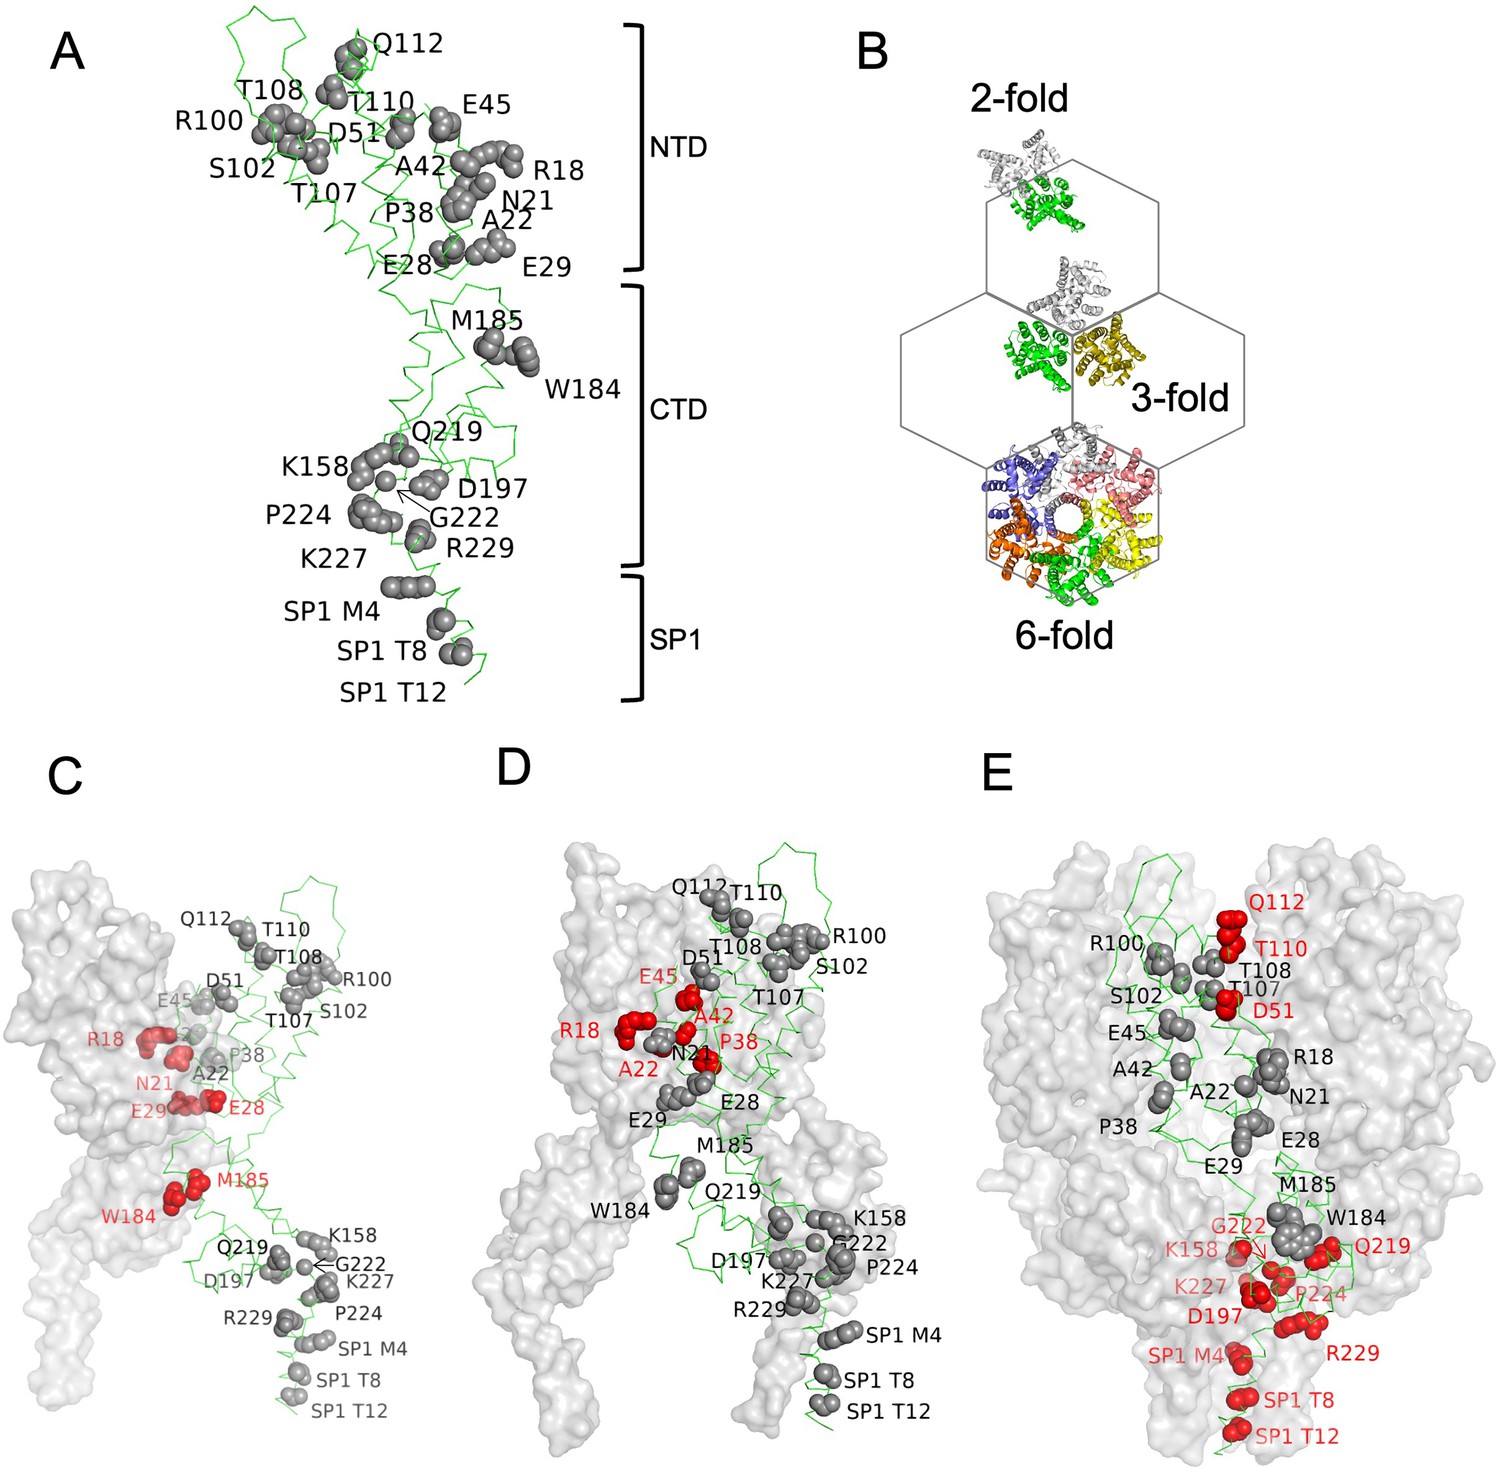
Amino acids substitutions targeting capsid (CA) interfaces in the immature Gag lattice.
(A) Amino acids selected for substitution are depicted onto a CA monomer component of the immature HIV-1 Gag lattice (adapted from PDB 7ASH). Residues subjected to substitution are shown in ball and stick presentation. (B) A schematic of the immature hexagonal CA lattice showing twofold, threefold, and sixfold symmetry contacts. (C–E) Depiction of substitutions targeting the twofold (C), threefold (D) , and sixfold (E) CA-CA interaction interfaces. One monomer of CASP1 is labeled, and the residues at the respective CA-CA interaction interfaces are colored in red. Other monomers are shown in gray surface presentation.
Figure 4 with 4 supplements
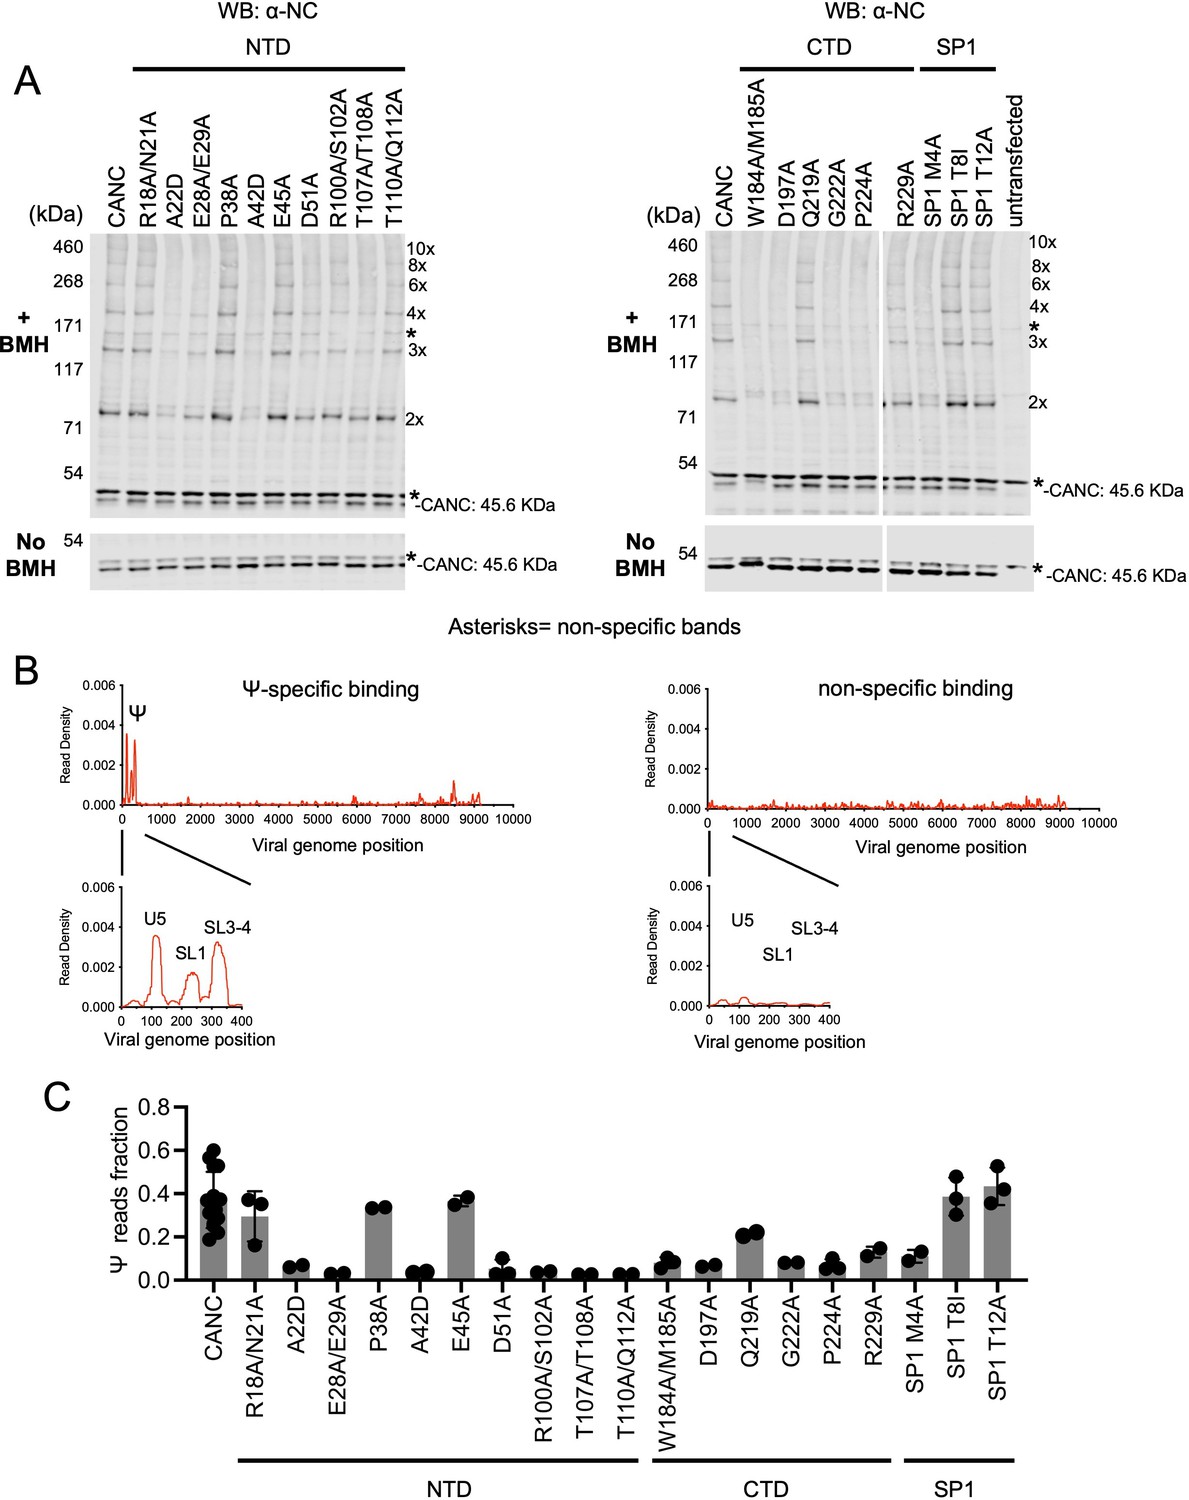
Effects of caspid (CA) substitutions on the in vivo multimerization and RNA binding properties of CANC proteins assessed by crosslinking experiments.
(A) Western blot analysis of CANC proteins following chemical crosslinking in living cells using BMH prior to cell lysis. Proteins were detected with anti-nucleocaspid (NC) antibody. (B) Typical results of crosslinking immunoprecipitation (CLIP) experiments of using CANC mutants. The left panel indicates the specific Ψ binding by CANC and certain mutants thereof. Mutants in this category include: R18A/N21A, P38A, E45A, Q219A, SP1 T8I, and SP1 T12A. The right panel indicates lack of specific Ψ binding; mutants in this category include: A22D, E28A/E29A, A42D, D51A, R100A/S102A, T107A/T108A, T110A/Q112A, W184A/M185A, D197A, G222A, P224A, R229A, and SP1 M4A. CLIP results for each mutant are shown in Figure 4—figure supplement 3. (C) Quantification of Ψ binding specificity of CANC mutants. The decimal fraction of reads, calculated by dividing the number of reads that mapped in the Ψ region of the genome (coordinates: 101–356) by the total number of reads that mapped to the viral genome, is plotted. Each dot represents data from an independent experiment. Error bars indicate the SD of all independent experiments.
-
Figure 4—source data 1
Uncropped and labeled blots Figure 4A.
- https://cdn.elifesciences.org/articles/83548/elife-83548-fig4-data1-v2.zip
Figure 4—figure supplement 1
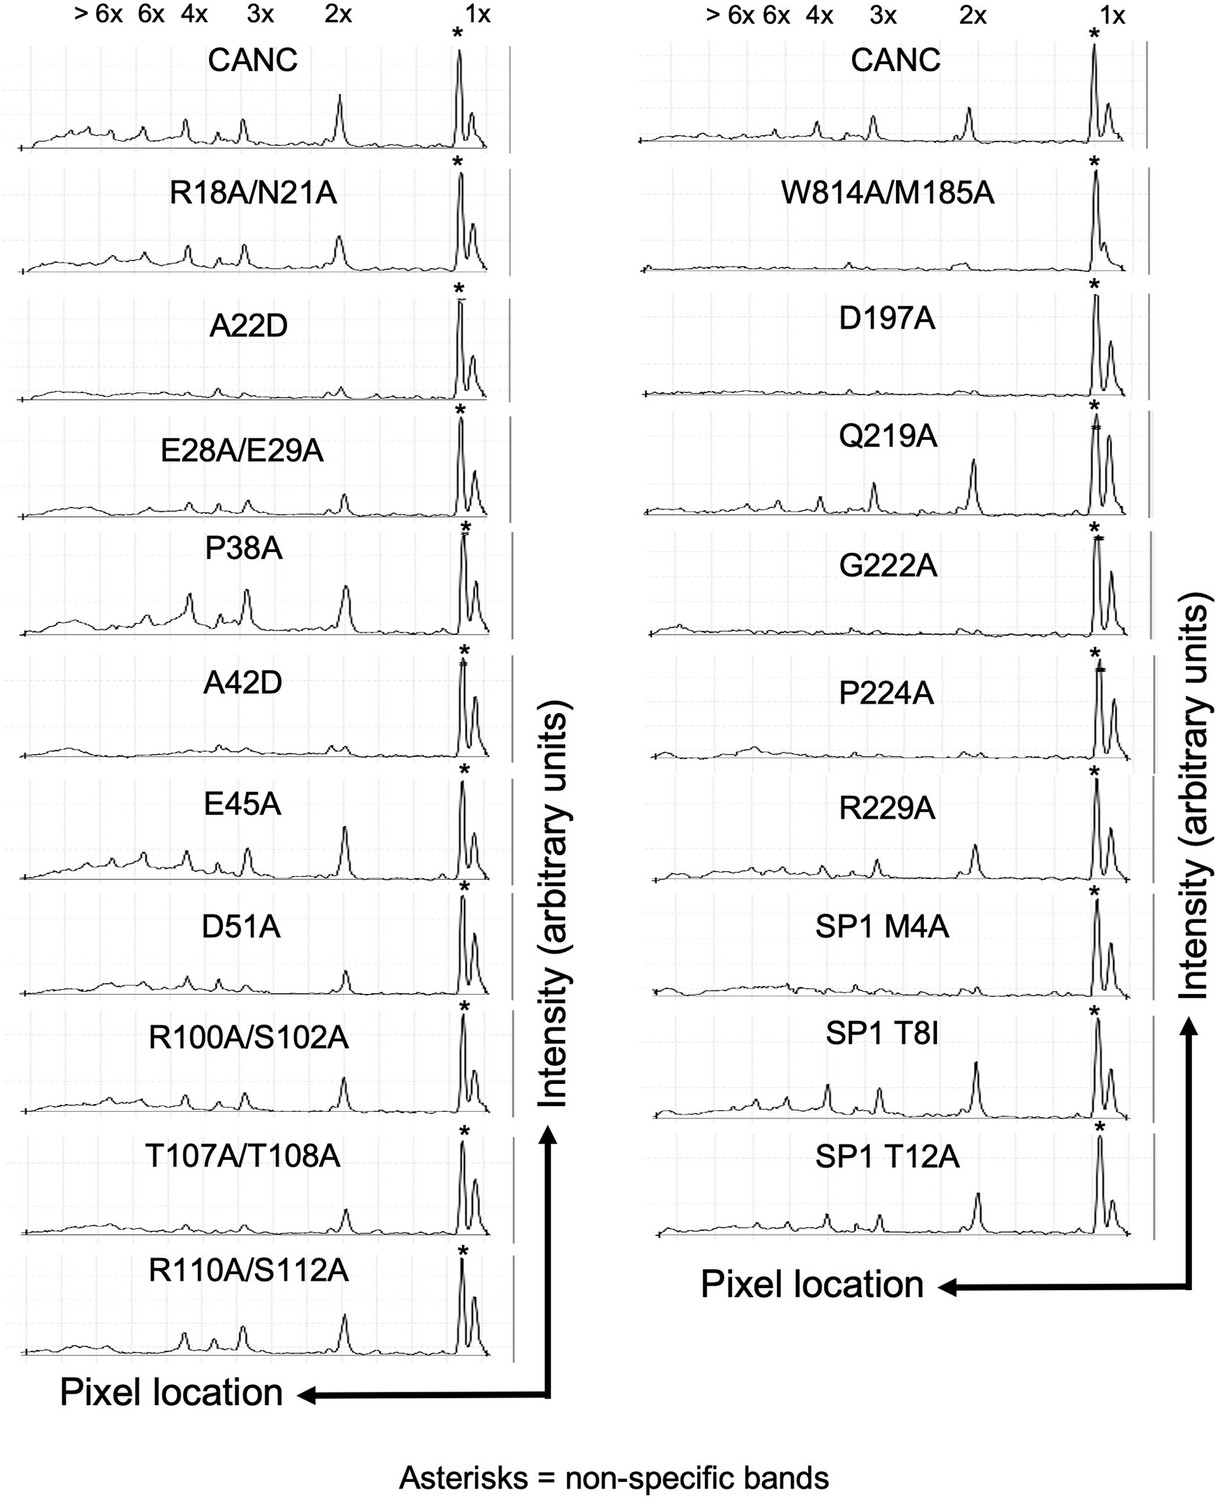
Quantitative analysis of BMH crosslinked species in Figure 4A.
Quantitative analysis of BMH crosslinked CANC proteins and mutants thereof from the western blot in Figure 4A. The x-axis shows the pixel location, and the y-axis indicates the average pixel intensity in the lane that was analyzed. The presumed stoichiometry of CANC multimerization based on migration in the gel is marked above each peak. The Odyssey Image Studio Suite (LI-COR Biosciences) was used to quantify protein bands.
Figure 4—figure supplement 2
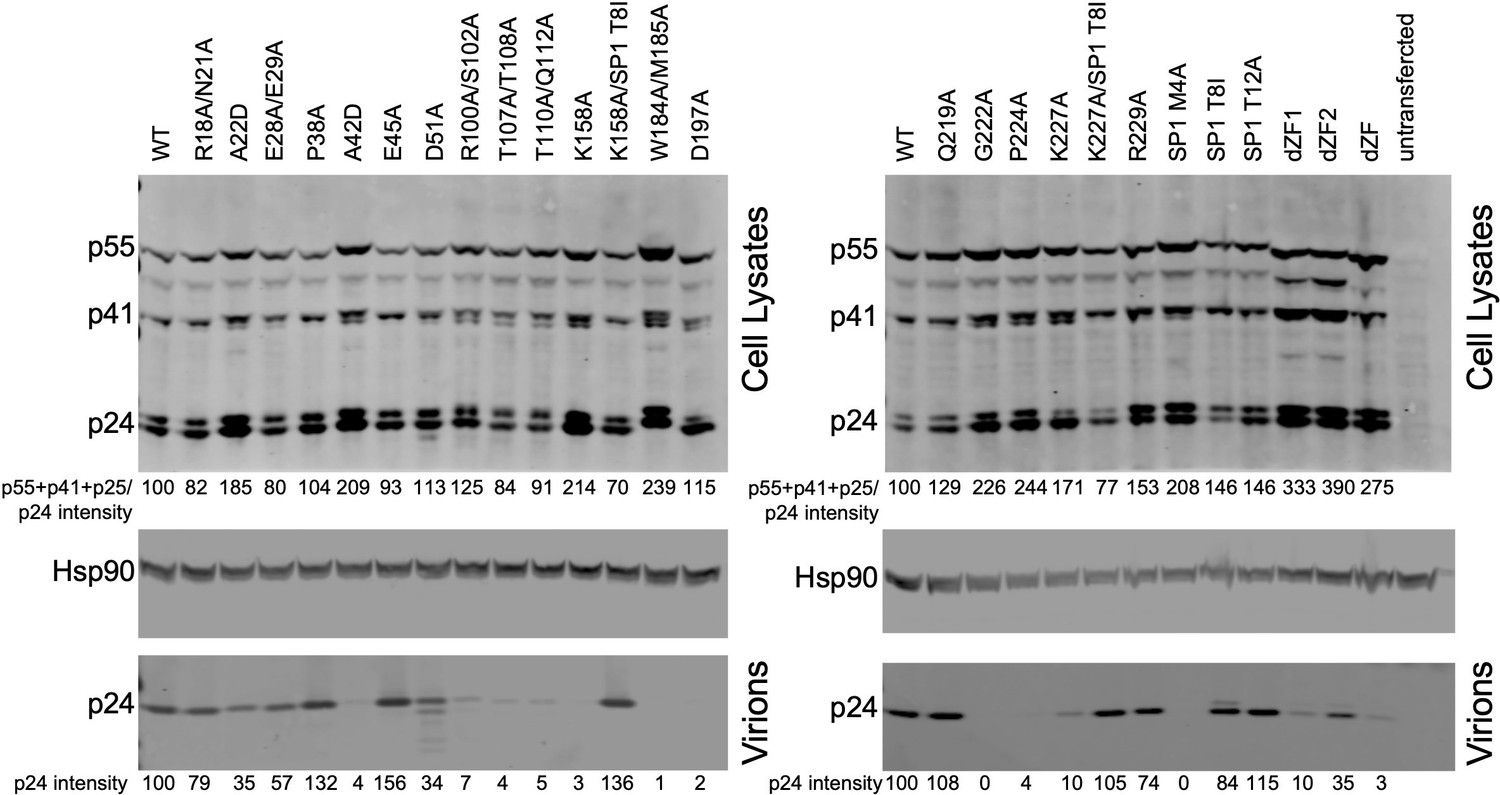
Western blot analysis of HIV-1 NL4-3 caspid (CA) mutants in particle production experiments.
Lysates of 293T cells transfected with the indicated HIV-1 NL4-3 proviral plasmids were subjected to western blotting with anti-CA and anti-Hsp90 antibodies. Lysates of virions pelleted from the corresponding culture supernatants were similarly analyzed using the anti-CA antibody. Relative intensity of total cellular Gag and virion p24 bands is listed below each lane. HIV-1 NL4-3 (wild type) cellular Gag and virion p24 levels were arbitrarily set to 100 for comparison. The Odyssey Image Studio Suite (LI-COR Biosciences) was used to quantify protein bands.
-
Figure 4—figure supplement 2—source data 1
Uncropped and labeled blots from Figure 4—figure supplement 2.
- https://cdn.elifesciences.org/articles/83548/elife-83548-fig4-figsupp2-data1-v2.zip
Figure 4—figure supplement 3
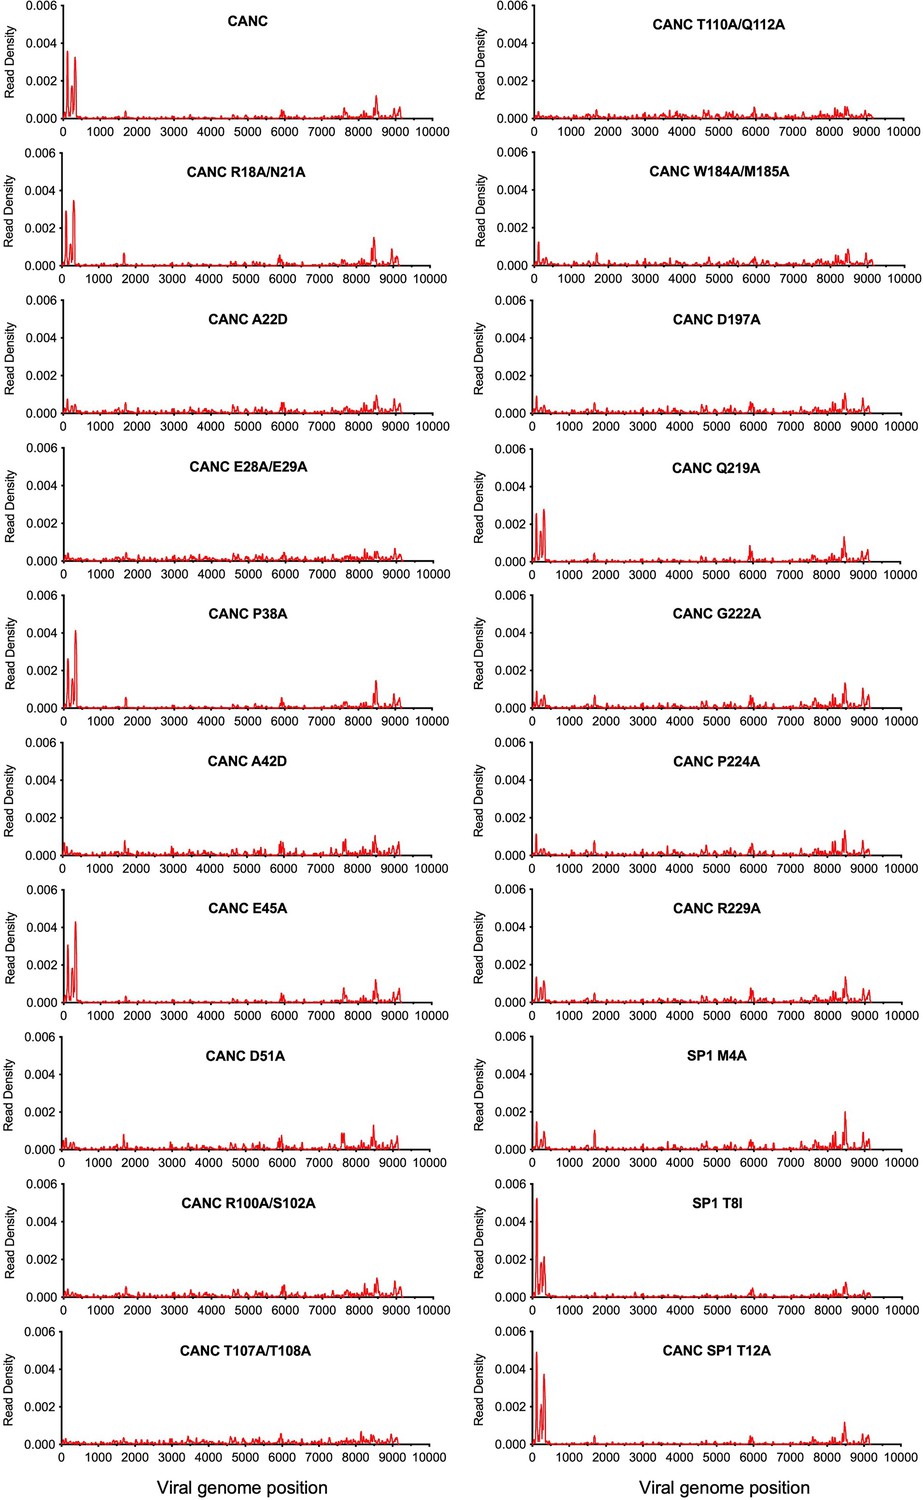
Effect of caspid (CA) mutations on CANC RNA binding specificity.
Read density distribution on viral RNA from CLIP experiments in which constructs encoding CANC mutants were used. Each chart represents at least two independent experiments, and the average read density is plotted.
-
Figure 4—figure supplement 3—source data 1
Read density data for Figure 4—figure supplement 3.
- https://cdn.elifesciences.org/articles/83548/elife-83548-fig4-figsupp3-data1-v2.zip
Figure 4—figure supplement 4
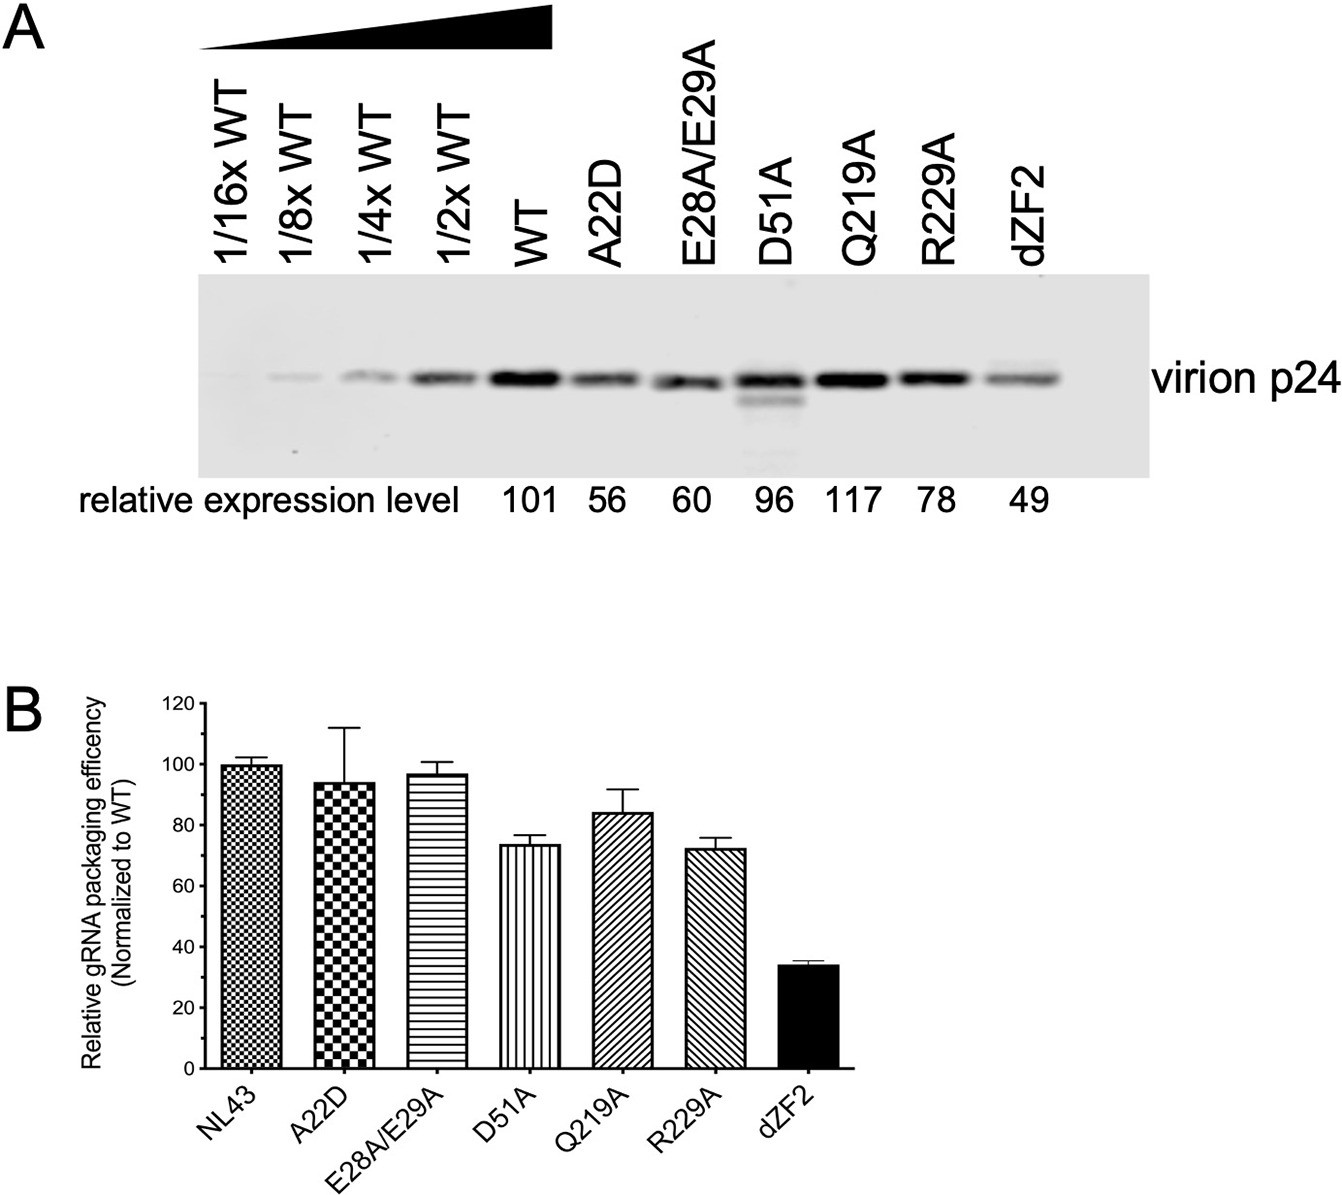
Reverse transcription-quantitative polymerase chain reaction (RT-qPCR) quantification of copies of unspliced gRNA in virions generated by HIV-1 NL4-3 and caspid (CA) mutants in Figure 4—figure supplement 2.
(A) Virion p24 CA protein quantification of HIV-1 NL4-3 and CA mutants thereof that were able to generate extracellular virions. Serial dilutions of HIV-1 NL4-3 virions were used to generate a standard curve for quantification. The relative intensity of each CA mutant band is shown below each lane, and the HIV-1 NL4-3 virion p24 CA level was arbitrarily set to 100 for comparison. (B) Relative gRNA packaging efficiency for HIV-1 NL4-3 and mutants, derived by dividing the copies of gRNA in virion pellets by the p24 CA levels as measured in (A). HIV-1 NL4-3 packaging efficiency was arbitrarily set to 100 for comparison. Error bar indicates SEM of three technical replicates for each sample. Experiment was repeated twice, and the results of one representative experiment are shown.
-
Figure 4—figure supplement 4—source data 1
Uncropped and labeled blots from Figure 4—figure supplement 4A.
- https://cdn.elifesciences.org/articles/83548/elife-83548-fig4-figsupp4-data1-v2.zip
Figure 5 with 1 supplement
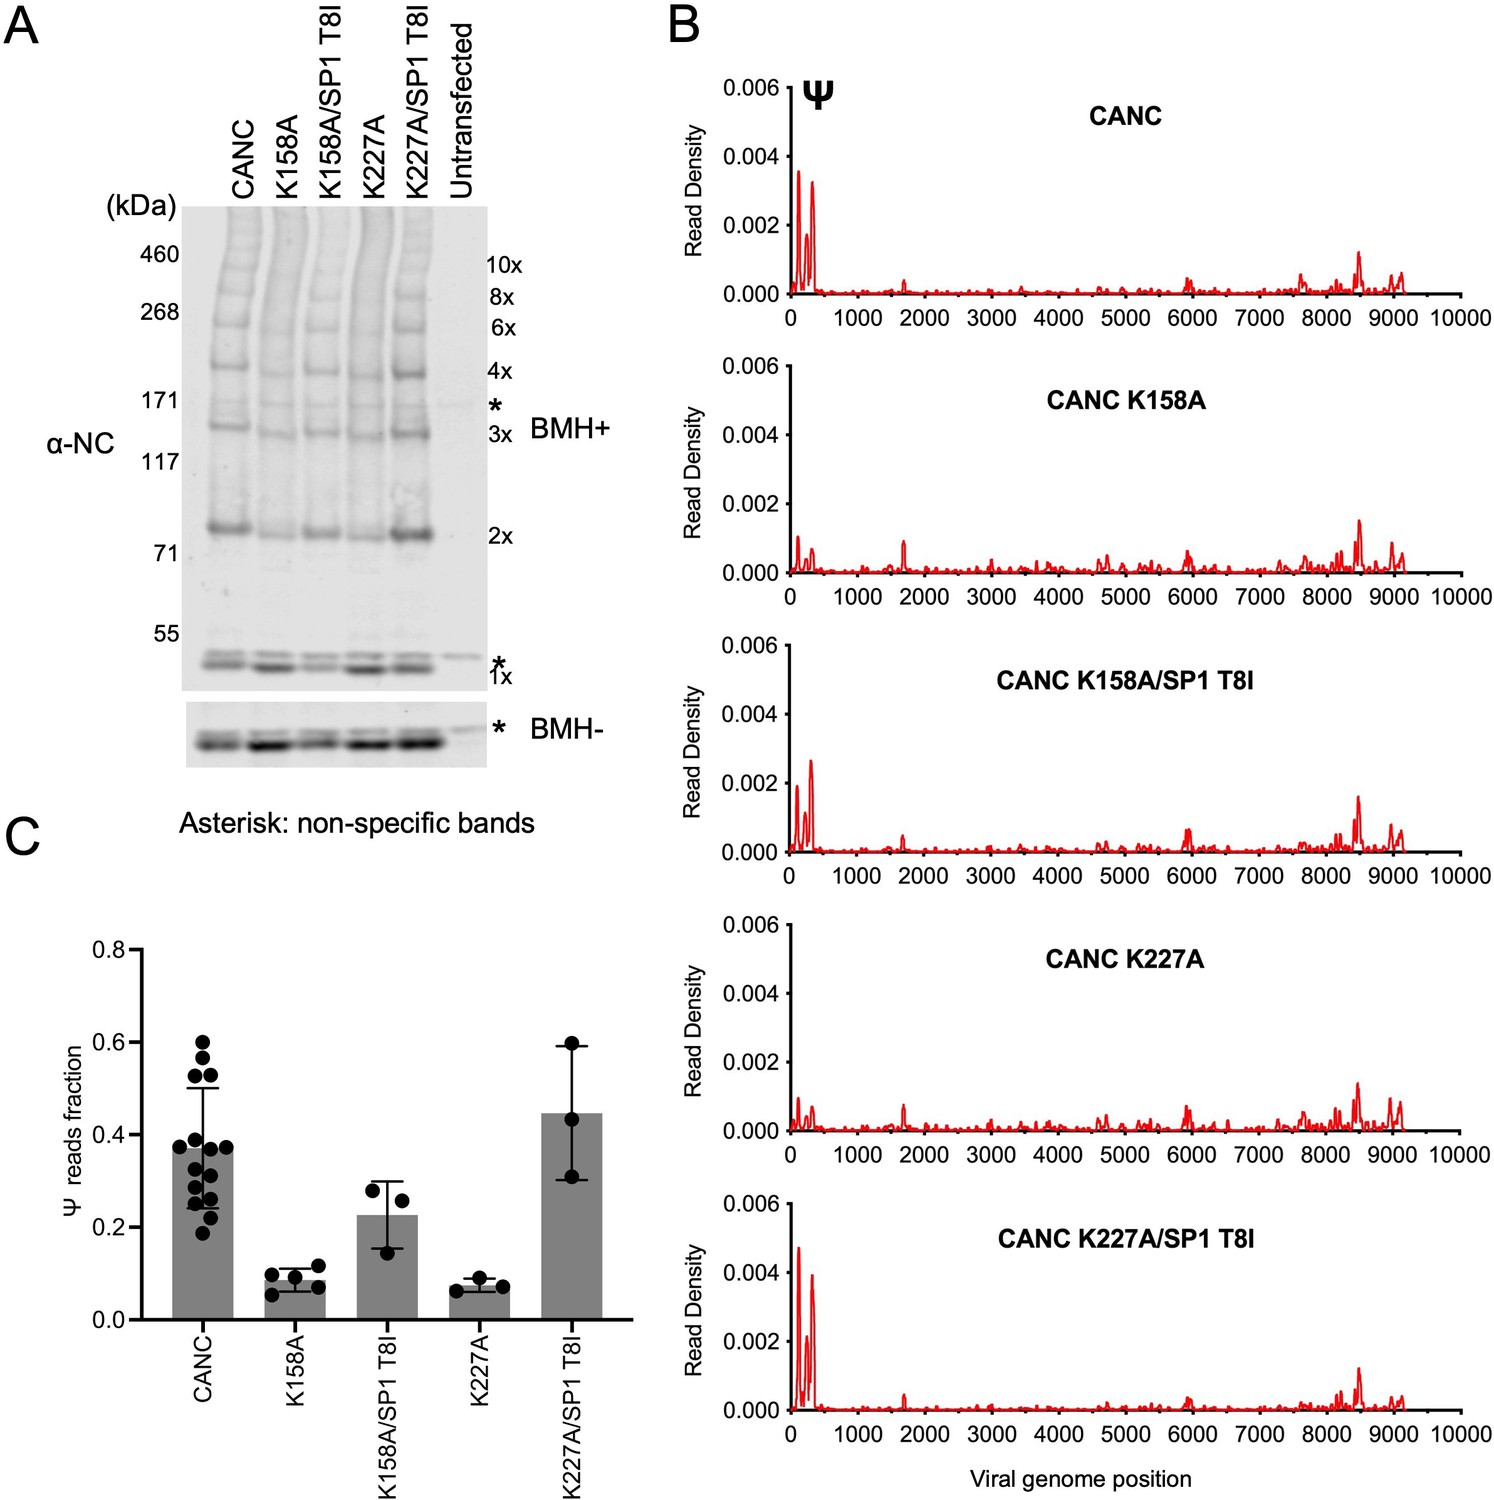
Analysis of multimerization and RNA binding by hexakisphosphate (IP6)-binding deficient mutants and second-site revertants.
(A) Western blot analysis of mutants CANC K158A, CANC K227A, and the corresponding second-site revertants CANC K158A/SP1 T8I and CANC K227A/SP1 T8I following chemical crosslinking in living cells using BMH prior to cell lysis. Proteins were detected with anti-NC antibody. (B) Read density distribution on viral RNA from crosslinking immunoprecipitation (CLIP) experiments in which constructs encoding CANC, CANC K158A, CANC K158A/SP1 T8I, CANC K227A, and CANC K227A/SP1 T8I were used. Each chart represents at least two independent experiments, and the average read density is plotted. (C) Quantification of Ψ binding specificity of the mutants in panel (B). The decimal fraction of reads, calculated by dividing the number of reads that mapped in the Ψ region of the genome (coordinates: 101–356) by the total number of reads mapped to the viral genome, is plotted.
-
Figure 5—source data 1
Uncropped and labeled blots from Figure 5A.
- https://cdn.elifesciences.org/articles/83548/elife-83548-fig5-data1-v2.zip
-
Figure 5—source data 2
Read density data for Figure 5B, C.
- https://cdn.elifesciences.org/articles/83548/elife-83548-fig5-data2-v2.zip
Figure 5—figure supplement 1
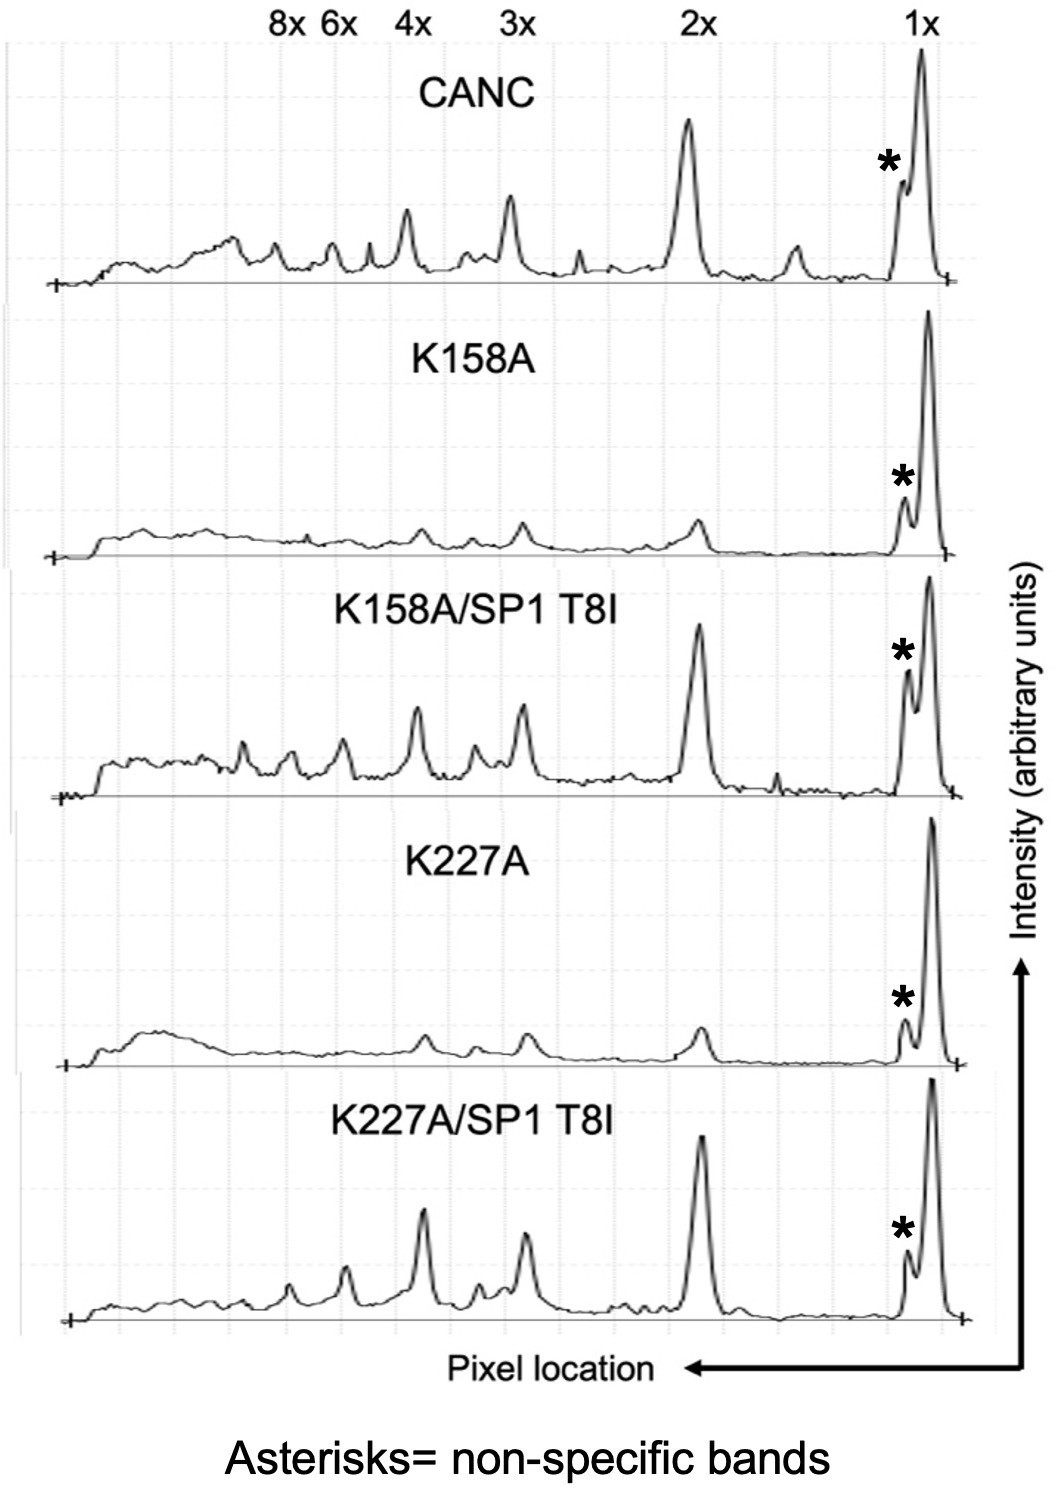
Quantitative analysis of BMH crosslinked species in Figure 5A.
Quantitative analysis of BMH crosslinked CANC proteins and mutants of the western blot in Figure 5A. x-axis shows the pixel location and y-axis indicates the average pixel intensity in the lane that was analyzed. Degree of CANC and mutants multimerization is marked above each peak. The Odyssey Image Studio Suite (LI-COR Biosciences) was used to quantify protein bands.
Tables
Key resources table
| Reagent type (species) or resource | Designation | Source or reference | Identifiers | Additional information |
|---|---|---|---|---|
| Cell line (Homo sapiens) | 293T | ATCC | CRL-3216 | Periodically checked for mycoplasma and retrovirus contamination not authenticated since purchased directly from ATCC |
| Transfected construct (HIV-1) | pNL4-3 and CA mutants introduced in pNL4-3 | This paper | For viral production assay and RT-qPCR gRNA quantification assay | |
| Transfected construct (HIV-1) | NL4-3 (MA-3xHA/PR-) and its derivatives | This paper | For CLIP experiments and BMH crosslink experiments | |
| Antibody | Mouse monoclonal anti-HIV-1 p24CA | NIH AIDS Reagent Program | 183-H12-5C | WB (1:100) |
| Antibody | Rabbit polyclonal anti-HIV-1 Nucleocapsid | This paper | WB (1:2000) | |
| Commercial assay or kit | Power SYBR Green RNA-to-CT 1-Step Kit | ThermoFisher | Cat# 4389986 | |
| Chemical compound and drug | BMH (bismaleimidohexane) | ThermoFisher | Cat# 22330 | |
| Software and algorithm | Prism | Graphpad | For CLIP data analysis graphing | |
| Software and algorithm | Image Studio | LI-COR Biosciences | For western blot band quantification | |
| Software and algorithm | Cutadapt | https://doi.org/10.14806/ej.17.1.200 | For CLIP data processing | |
| Software and algorithm | FASTX toolkit | http://hannonlab.cshl.edu/fastx_toolkit | For CLIP data processing | |
| Software and algorithm | Bowtie | https://doi.org/10.1186/gb-2009-10-3-r25 | For CLIP data processing | |
| Software and algorithm | SAMTools | https://doi.org/10.1093/bioinformatics/btp352 | For CLIP data processing |
Additional files
Download links
A two-part list of links to download the article, or parts of the article, in various formats.
Downloads (link to download the article as PDF)
Open citations (links to open the citations from this article in various online reference manager services)
Cite this article (links to download the citations from this article in formats compatible with various reference manager tools)
Initiation of HIV-1 Gag lattice assembly is required for recognition of the viral genome packaging signal
eLife 12:e83548.
https://doi.org/10.7554/eLife.83548


