Global analysis of contact-dependent human-to-mouse intercellular mRNA and lncRNA transfer in cell culture
- Department of Molecular Genetics, Weizmann Institute of Science, Israel
- Berlin Institute of Medical Systems Biology and Systems Biology, Max Delbruck Center for Molecular Medicine, Germany
- Department of Anatomy & Structural Biology, Albert Einstein College of Medicine, United States
Figures
Figure 1 with 1 supplement
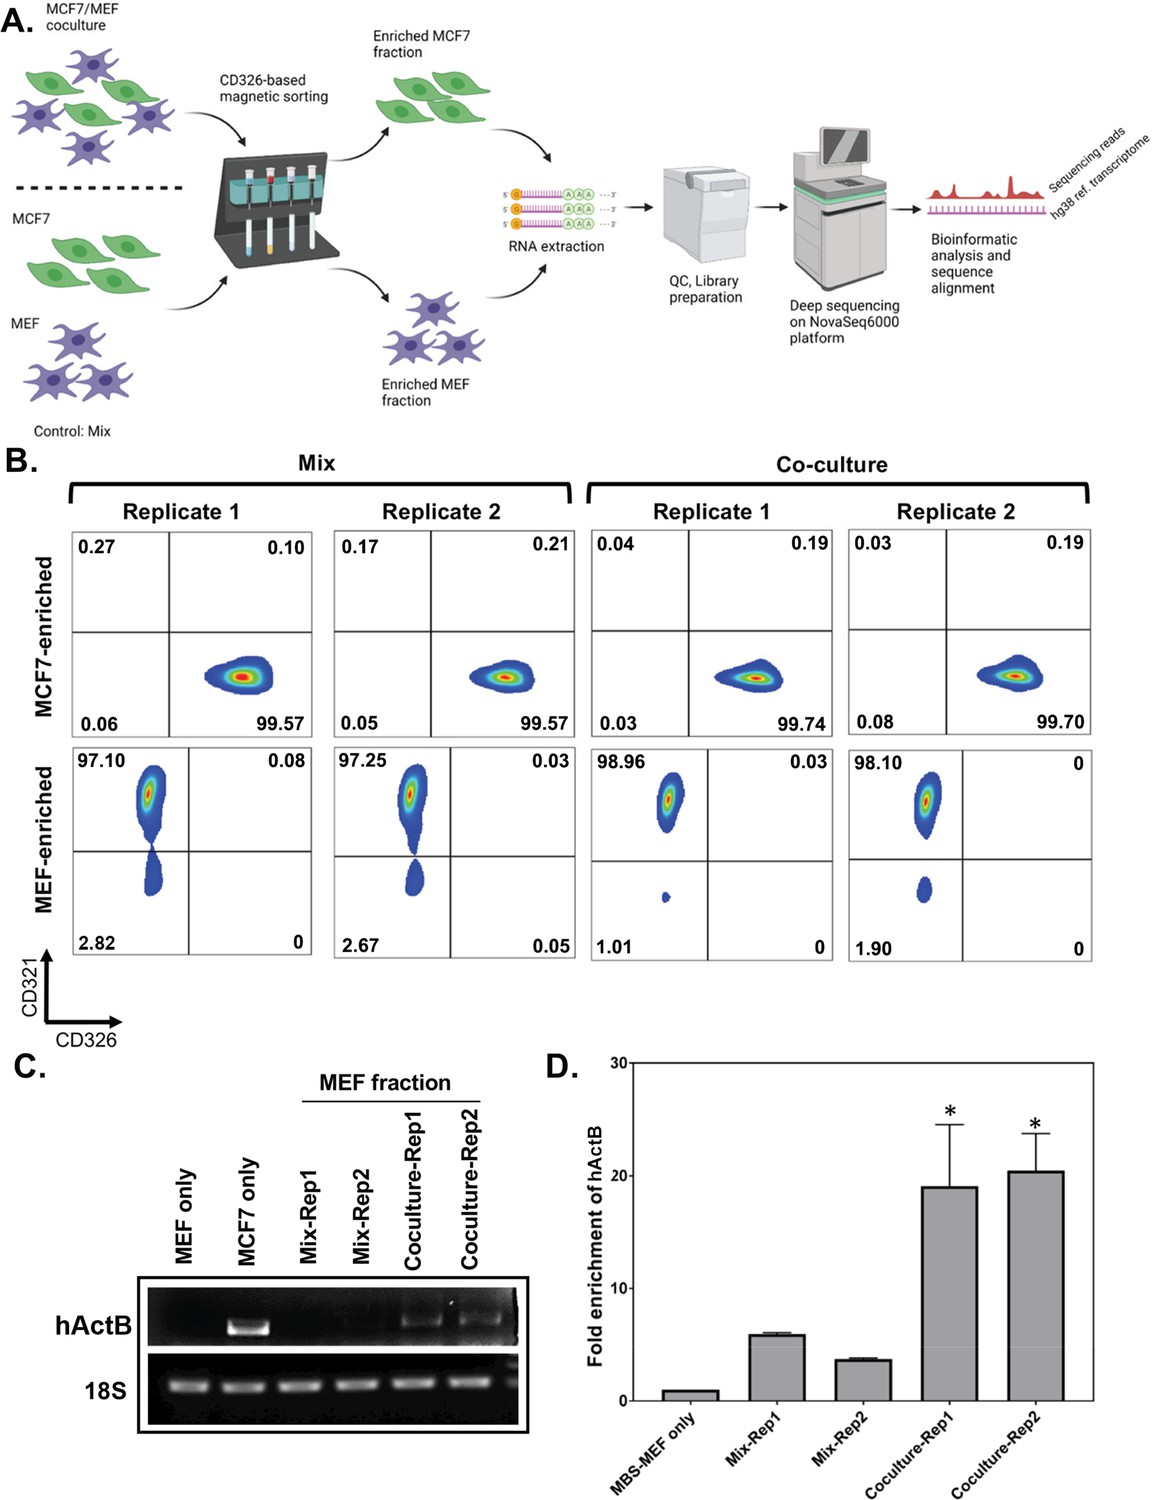
Affinity purification of single populations of MCF7 and MEF cells following mix/co-culture.
(A) Schematic representation of the magnetic bead-based sorting and RNA sequencing to identify mRNAs transferred between two cell types. Between 2 and 3 million each of human and mouse cells (i.e. MCF7 cells and MBS-MEFs, respectively) are either co-cultured or only mixed before cell sorting. The heterologous cell population is then sorted using magnetic microbeads conjugated to an anti-CD326 antibody specific to MCF7 cells. The sorted cells are then analyzed by RNA-sequencing to identify the transferred RNAs. (B) Flow cytometry profiles of the sorted cell populations of MCF7 and MBS-MEF cells following affinity purification. Post-sorting, cell suspensions were counterstained with a human CD326-Alexa 488 antibody that labels only the MCF7 cells and a mouse CD321-PE antibody that labels the MBS-MEF cells. The sorted cell populations were analyzed by flow cytometry using the Alexa Fluor-488 and R-PE windows. (C–D) RT-PCR (C) and RT-qPCR (D) validation of transfer of β-actin mRNA from MCF7 to MBS-MEF cells in co-culture. Total RNA from one replicate of a MBS-MEF and MCF7 single culture and two replicates of MBS-MEF fractions from Mix and Co-culture were collected for analysis by semi-quantitative RT-PCR (25 cycles) (C) (representative image from three replicas) and RT-qPCR (D) using primers specific for human β-actin. 18 S rRNA was amplified as an internal control. The graph in D shows the average of three repeats. * - p≤0.05. See Figure 1—source data 1 for complete gel images of panel C.
-
Figure 1—source data 1
Full agarose gel images of the RT-PCR depicted in Figure 1C.
The source data contains the original images of the hActb RT-PCR and 18 S RT-PCR gels, and an annotated figure indicating the lane names and the bands corresponding to the specific genes. * indicated non-specific band.
- https://cdn.elifesciences.org/articles/83584/elife-83584-fig1-data1-v2.zip
Figure 1—figure supplement 1
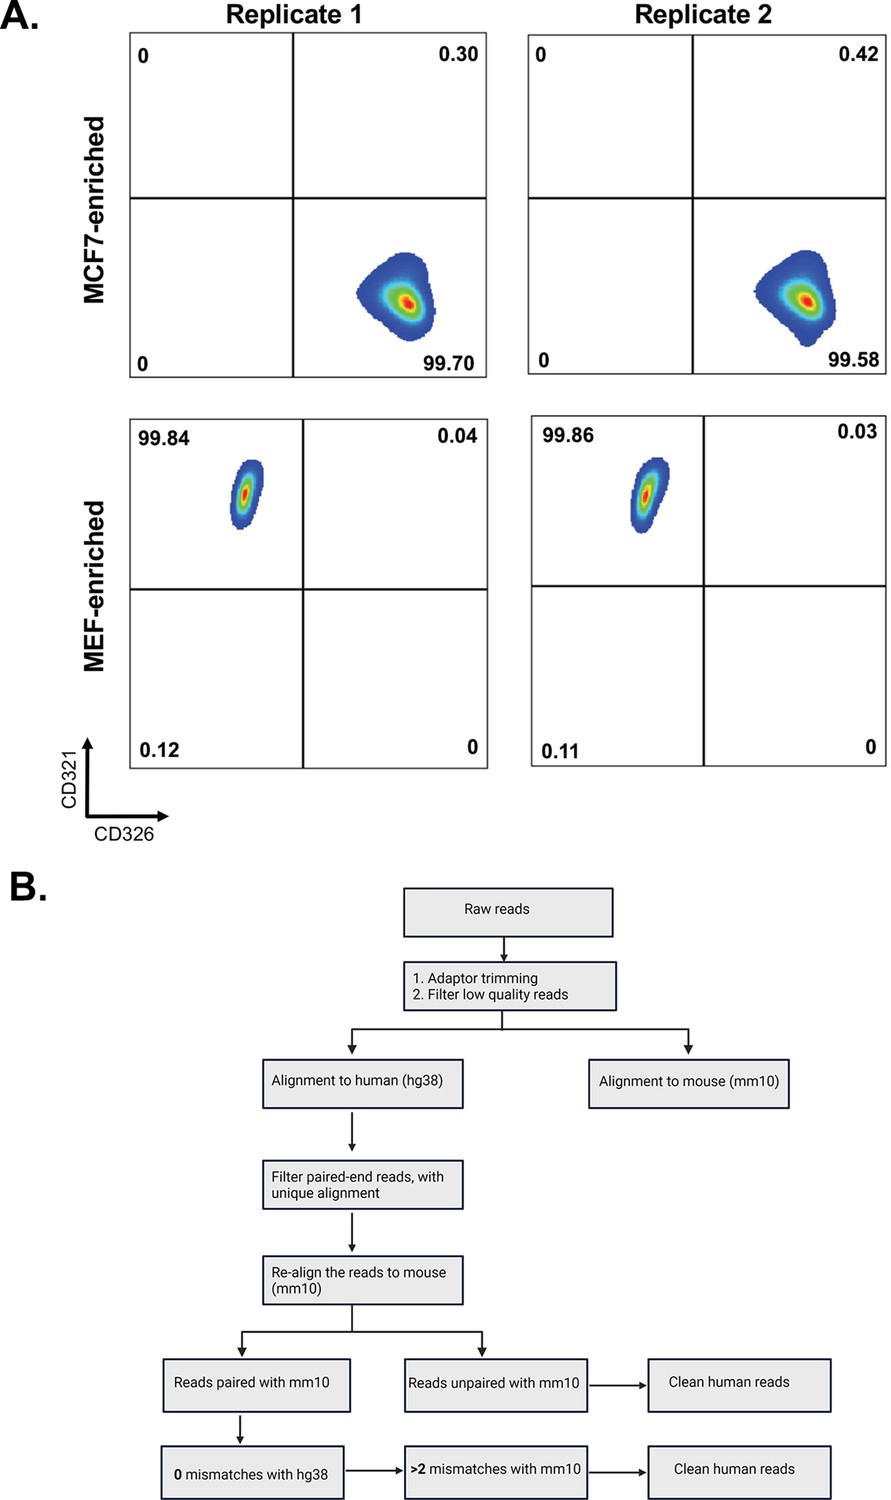
Flow cytometry profiles of single cultures of MBS-MEF and MCF7 cells and bioinformatic pipeline to identify species-specific mRNAs.
(A) Three million MBS-MEF and MCF7 cells were each subjected separately to same sorting protocol (without undergoing mixing/co-culture with each other) as shown in Figure 1A and used in Figure 1B. The flow cytometry profiles for the expression of mouse CD321 and human CD326 on MBS-MEF and MCF7 cells, respectively, after sorting are shown. (B) A scheme depicting the identification of human (MCF7) mRNAs in mouse (MBS-MEF) cells. Following the trimming of adaptors and filtering for low-quality reads, the reads were aligned to human reference genomes. Reads that were paired-end and showed unique alignment with human genome were again realigned with mouse reference genome to discard genes with 100% homology. The resulting clean human reads were finally identified based on status of alignment of ends and mismatches with human and mouse genomes. For detailed explanation, see Materials and methods.
Figure 2 with 2 supplements
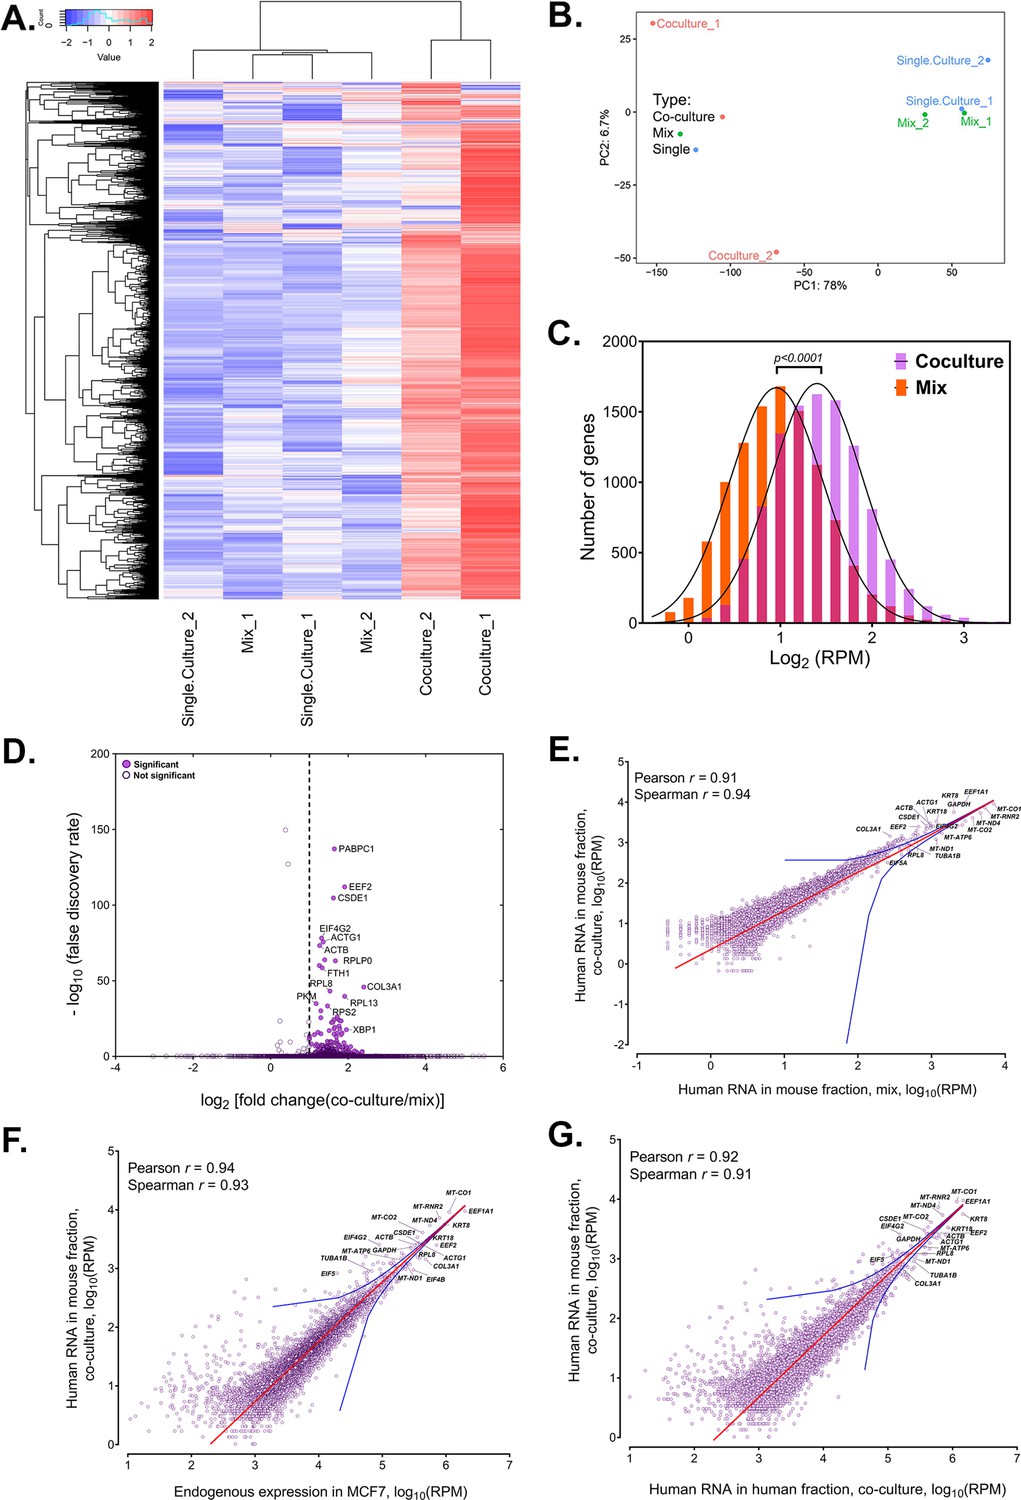
Analysis of human RNAs present in mouse-enriched fractions and identification of transferred mRNAs.
(A) Heat map analysis showing the transferred human RNA in mouse samples. RPM counts of human-specific genes across single culture, mix and co-culture samples of mouse-enriched fractions were Z-normalized across rows and plotted using the G-Plot package of R. Each row indicates a single gene and each column represents a sample. Cluster analysis of the samples was done by ‘maximum’ distance function. (B) PCA analysis of the different samples. Human-specific reads from mouse samples were analyzed and plotted, as a Principal Component Analysis graph using the base functions of R. The scales represent the numbers obtained after PCA transformation and represent the percent variability in the samples contributed by each principle component (78% for PC1 and 6.7% for PC2). Red icon: Co-culture, Blue icon: Single Culture and Green icon: Mix. (C) Read distribution between the Co-culture and Mix samples. The lognormal distribution of the reads in Co-culture (purple bars) and Mix (orange bars) were plotted and fitted to a Gaussian curve, and revealing that mRNAs from almost the entire human trancriptome underwent transfer. This was depicted by a shift of the “Co-culture” curve to the right. The red bars represents the overlap between the two distributions. The p value for the average of all human genes in the Gaussian is given. (D) Identification of RNAs that underwent robust transfer. A dot plot representing the results from a single-tailed, unpaired t-test between the two replicates of Co-culture and two replicates of Mix was performed to identify the genes exhibiting the highest transfer. Significance threshold (dashed line): Fold change >2; false discovery rate (FDR)<0.05. Closed circles: Significant genes, open circles: Statistically insignificant genes. An FDR of 0.05 roughly implies that 5% of significant tests will result in false positives. (E–G) Identification of human RNAs in mouse cells relative to gene expression levels. Linear regression analyses of human-specific read counts from the mouse fraction of the Co-culture samples with respect to the human reads from mouse fraction of Mix samples (E) with the reads from the MCF7 Single culture (F), or with reads from MCF7 in co-culture (G), which provide various ways to look at the level of endogenous expression. The red line indicates the linear regression line, while the blue lines indicate the upper and lower bounds of the 99% confidence internal. Pearson and Spearman coefficients are indicated.
Figure 2—figure supplement 1
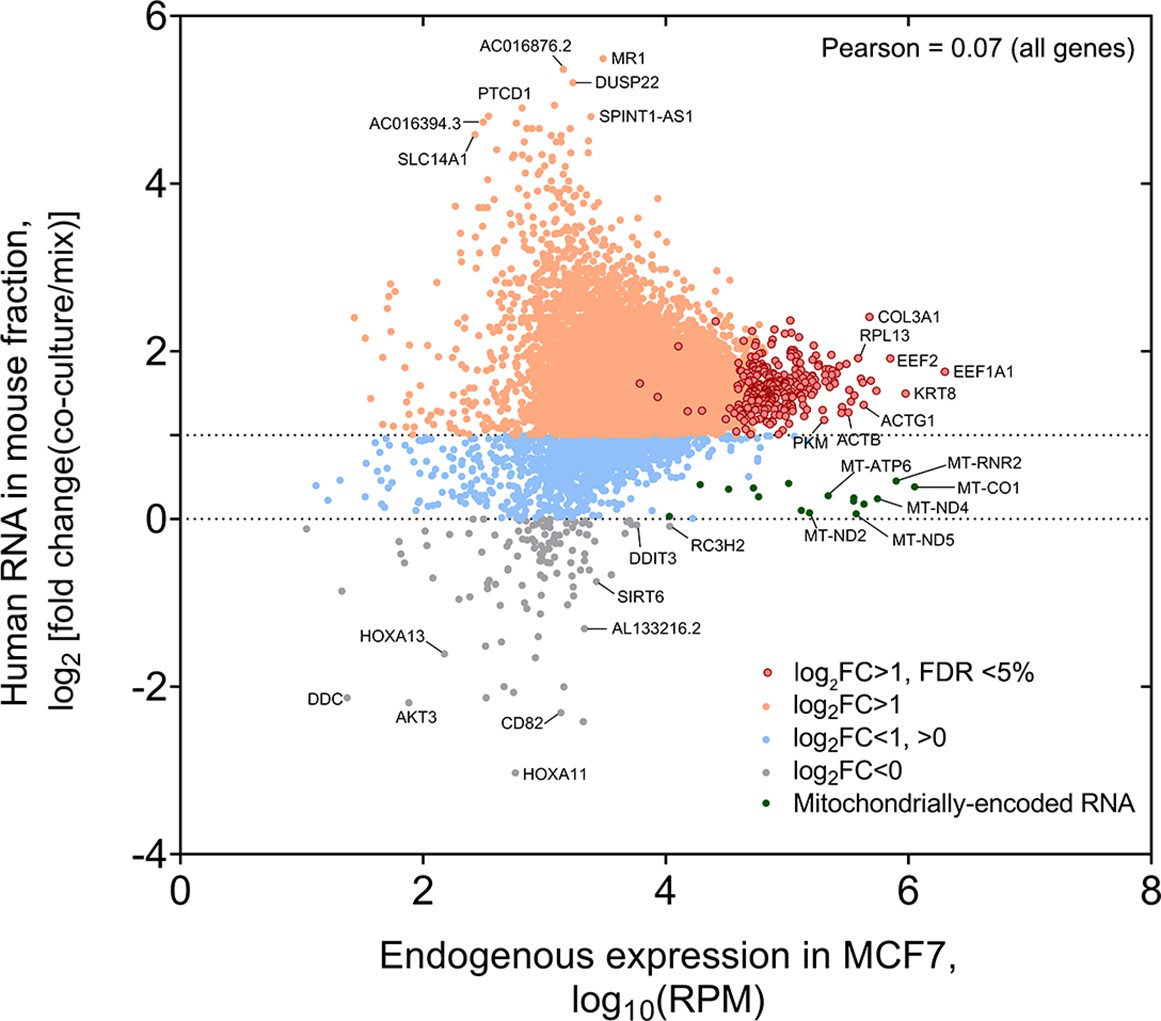
Analysis of the fold-change (FC) of human RNA transferred to mouse cells.
Genome-wide distribution of fold-change (i.e. RPM of Coculture samples divided by RPM of Mix samples) of human mRNAs that undergo transfer vs. the endogenous level of expression in the donor MCF7 cells. Pearson correlation value is indicated.
Figure 2—figure supplement 2
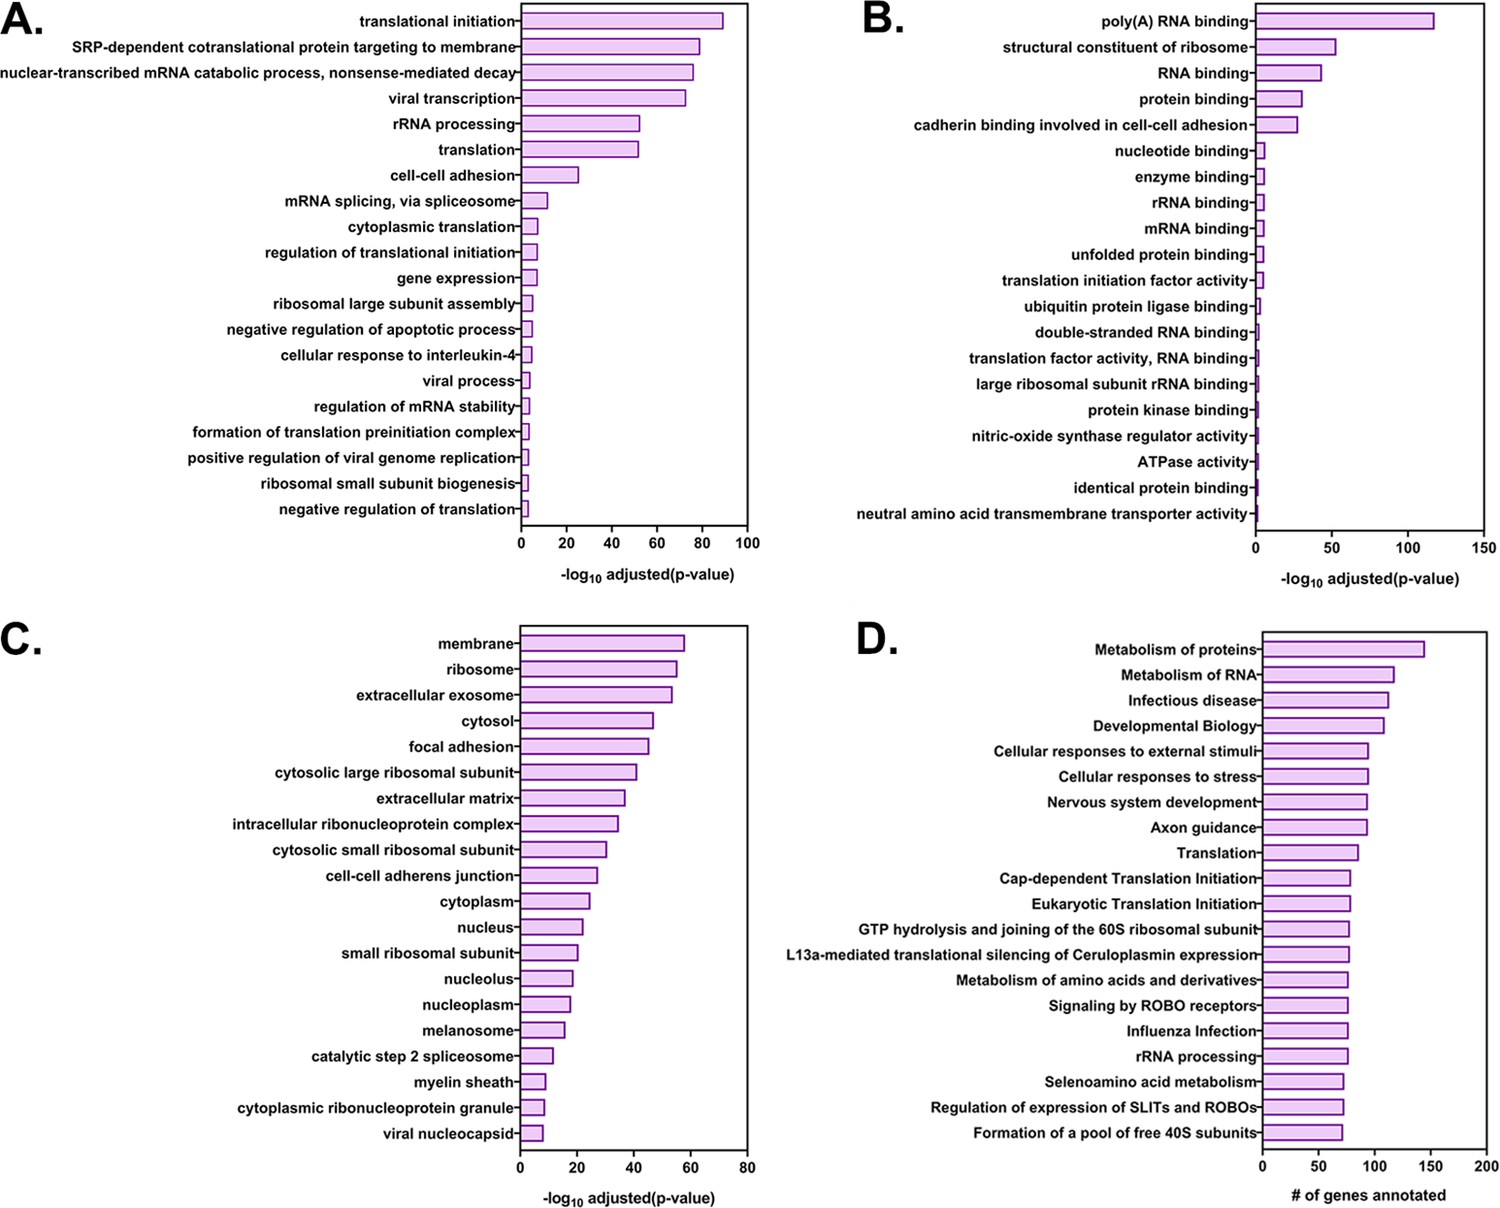
GO annotation and pathway analysis of the highly transferred genes.
The list of 283 highly transferred genes was analyzed by DAVID (Database for Annotation, Visualization and Integrated Discovery) and GeneCards for GO annotations and by Reactome and KEGG for pathway analysis. Shown are the top 20 terms for each GO terms family (A) Biological processes, (B) Molecular Function and (C) Cellular Component along with their log (adjusted P values). (D) The top 20 enriched KEGG pathways and the number of genes in the corresponding pathway.
-
Figure 2—figure supplement 2—source data 1
This file contains GO terms analysis of transferred mRNAs.
- https://cdn.elifesciences.org/articles/83584/elife-83584-fig2-figsupp2-data1-v2.xlsx
Figure 3
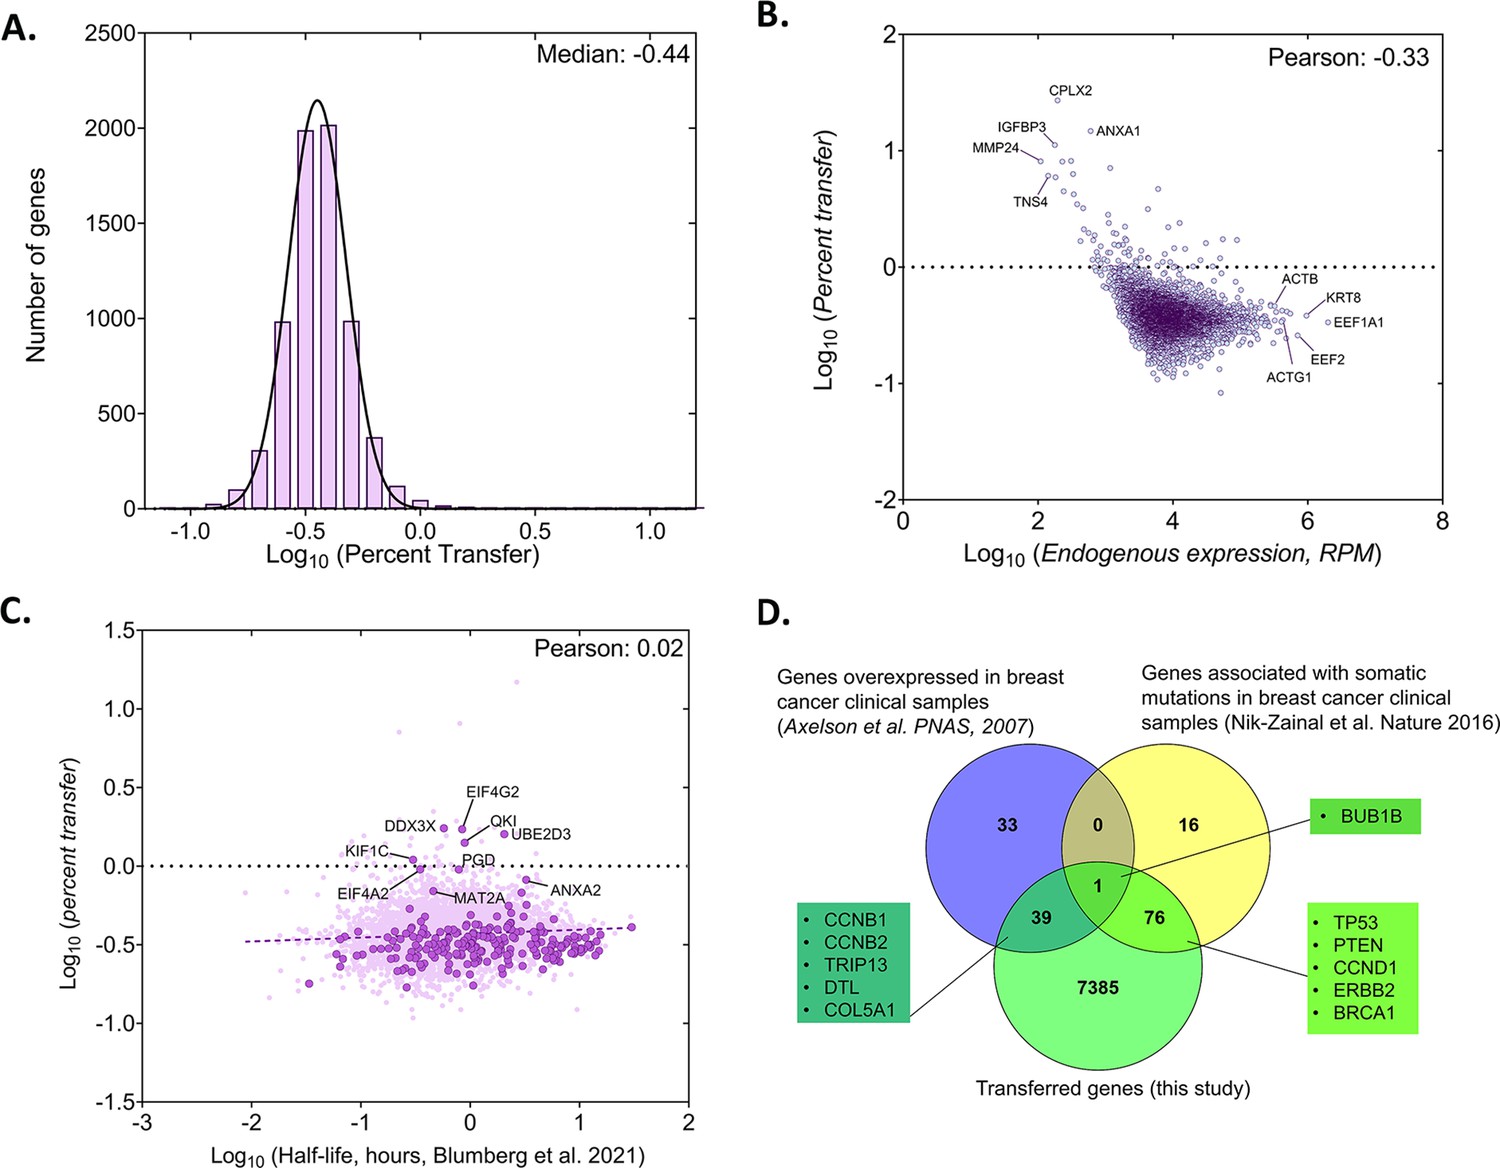
Analysis of the percentage of human RNA transferred to mouse cells.
(A) Genome wide distribution of proportion of donor mRNAs that undergo transfer. The black curve indicates the best-fit Gaussian distribution. Log of median percent transfer is indicated. (B) Linear regression analysis of the percentage transfer for each gene with the donor endogenous level of expression. Each circle represents an individual. Pearson correlation is indicated. (C) Linear regression analysis of the percentage transfer of each mRNA with its half-life. Stability data of each mRNA was derived from a recent analysis of genome-wide mRNA half-lives (Blumberg et al., 2021). RPM count of transferred mRNAs (y-axis) and half-lives of mRNAs (x-axis) of 4972 annotated genes are plotted. Solid dark purple dots indicate 223 of the 283 robustly transferred mRNAs identified in Figure 2D and Source data 1 - table 3. The purple solid line indicates the linear regression line; Pearson coefficient is indicated. (D) Breast cancer-specific overexpressed and mutated genes were found to undergo mRNA transfer from MCF7 cells to MEFs. This list of human-mapped genes in mouse enriched fraction from co-culture sample was compared to a set of 73 genes that were found to be overexpressed in 184 breast cancer samples from 11 patients, compared to 8 samples from healthy tissues (Axelsen et al., 2007) and to a set of 93 genes that were found to be frequently mutated in 560 breast cancer samples (Nik-Zainal et al., 2016). A representative list of genes from the indicated overlaps are mentioned in the boxes. Only the genes with RPM counts of >10 in both replicates of co-culture and FC >1 were considered for this analysis (7500 genes).
Figure 4 with 1 supplement
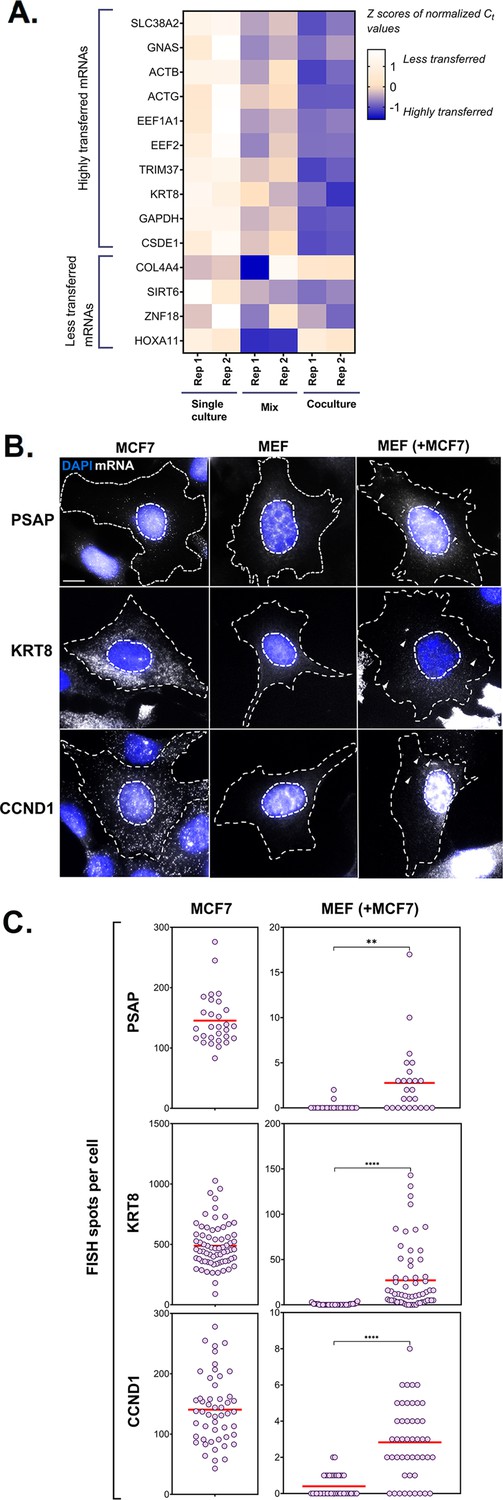
PCR and smFISH verification of transfer of selected mRNAs.
(A) Heatmap summarizing transfer of human mRNAs in Co-culture compared to Mix. qRT-PCR was performed on RNA samples from MBS-MEF Single culture, Mix, and Co-culture samples from two independent biological replicates and the presence of transferred RNA was detected with human-specific oligos for ten transferred genes, as identified in Figure 2D. Four less transferred genes were used as negative controls. Human β-actin was used as a positive control. The color of the heatmap corresponds to the row-wise Z-scores of Ct values of the indicated genes after normalizing for an internal control (18 S rRNA). Increasing darkness corresponds to increasing gene expression. All but one gene (i.e. GNAS) showed good agreement with the RNA-seq results and have a higher fold-change as compared to the Mix sample. Each box represents an average of three independent technical replicates. (B–C) Verification by smFISH. Three genes (KRT8, PSAP, and CCND1) that demonstrated high level of transfer by RNA-Seq were chosen to be analyzed by smFISH. Acceptor cells (MBS-MEFs) were co-cultured with MCF7 cells together on fibronectin-coated coverslips at a ratio of 1:1 for 12 hr. Following co-culture, the cells were fixed and smFISH was performed using Quasar 570-labeled oligonucleotide probes complementary to the human-specific RNA of the indicated genes and Cy5-labeled probes specific for the MBS sequence. The transfer of mRNAs was detected by wide-field microscopy and quantified using a MATLAB program, FISH-Quant. (B) smFISH images. Representative smFISH images of MBS-MEF and MCF7 single cultures, and MCF7 cells in co-culture with MBS-MEFs. Labels: gray, Q570-labeled smFISH probes; blue, DAPI staining of the nucleus. Donor and acceptor cells were distinguished by the high expression of β-actin-MBS (identified by Cy5-MBS probes) in MBS-MEF cells only (not shown). Scale bar: 10 µm. (C) Quantification of the number of mRNAs of two independent experiments. The left panels show the number of mRNAs expressed for the indicated genes in the MCF7 cells only, while the right panel shows the number of corresponding mRNAs in MBS-MEF cells alone or in co-culture. Each dot represents the number of indicated mRNAs detected in a single cell, as measured by FISH-Quant. Horizontal red lines represent the average number of mRNAs. ** - p≤0.01; **** - p≤0.0001.
Figure 4—figure supplement 1
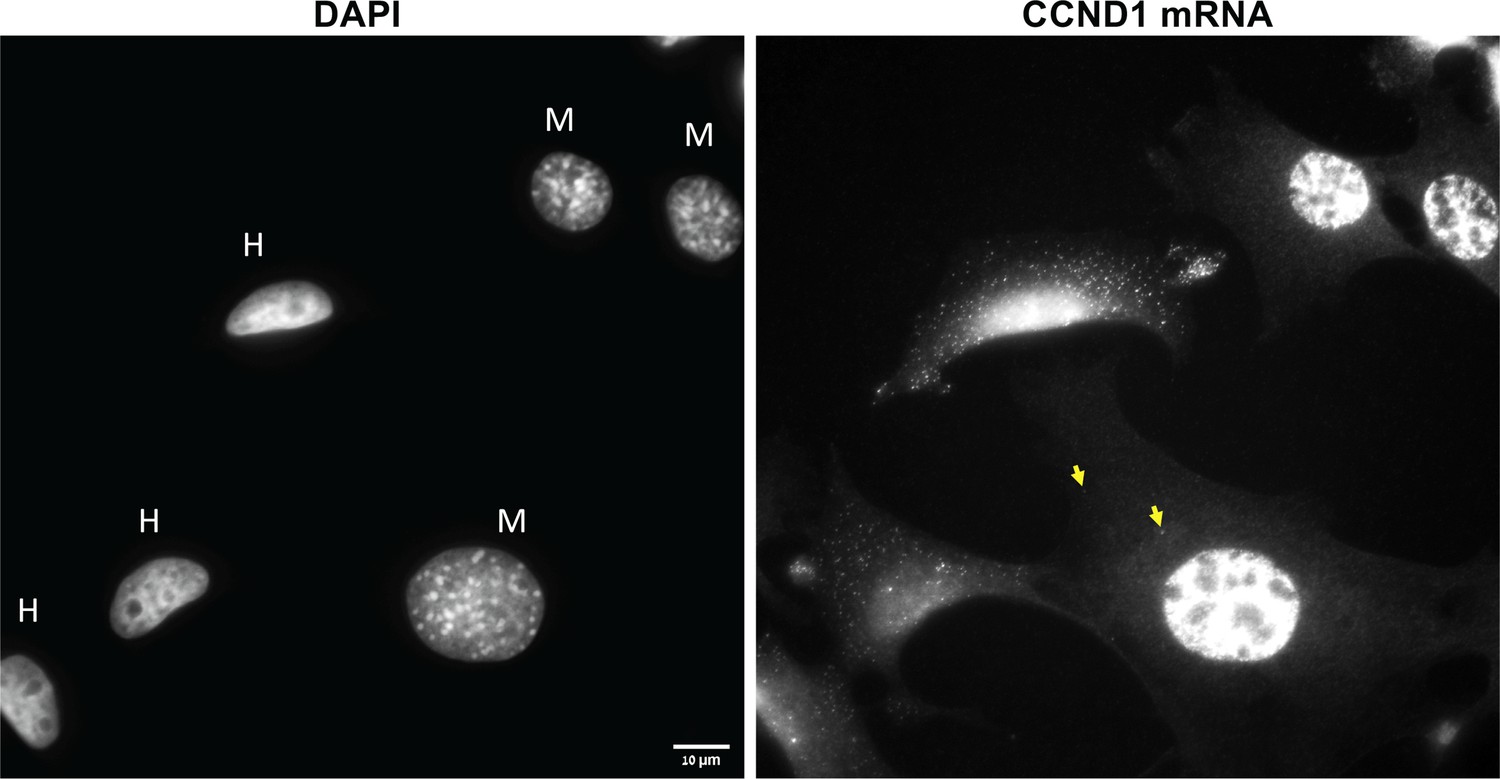
Nuclear morphology and high levels of query mRNA expression distinguish human cells from mouse cells.
Left panel: A DAPI image of a human-mouse co-culture. Note the ovoid and non-granulated human (MCF7, ‘H’) nuclei in contrast to the rounded and granulated mouse (MEF, ‘M’) nuclei. Right panel: Cells were labeled with fluorescent oligonucleotides for CCND1 by smFISH. Note the high expression levels in the human cells. Scale bar = 10 μm. Yellow arrows indicate transferred RNAs.
Figure 5 with 2 supplements
mRNA transfer is driven by gene expression.
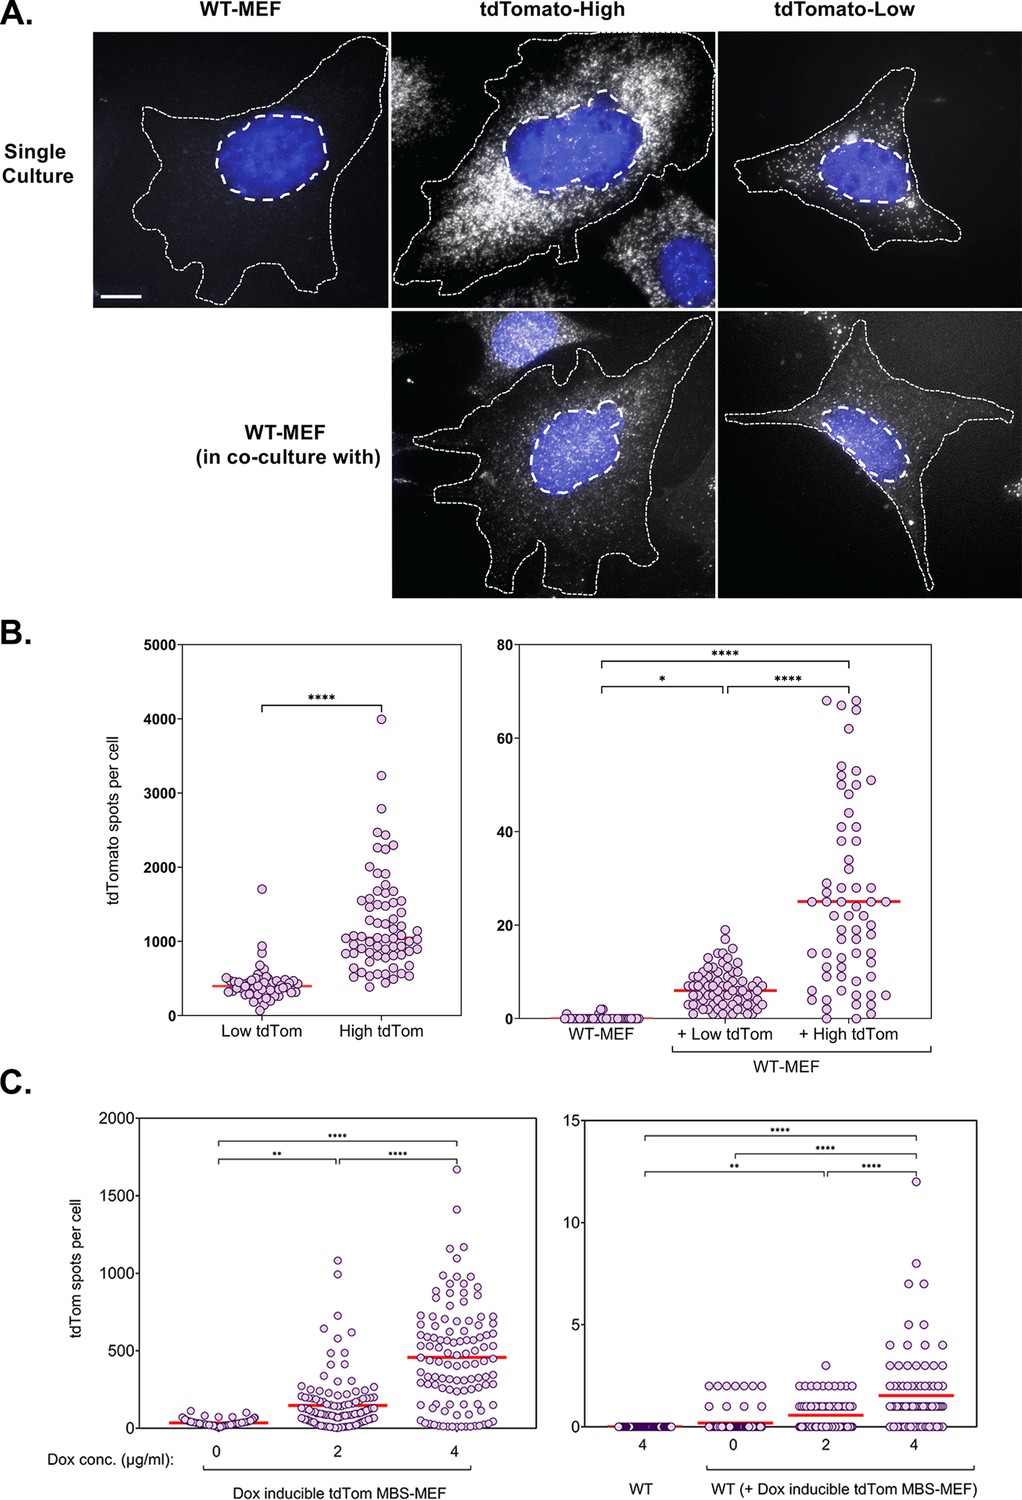
(A) tdTomato RNA smFISH images. Representative smFISH images of Cy5-labeled tdTomato RNA in WT MEFs and donor MBS-MEFs expressing either high or low levels of tdTomato in single cell culture (top row) and acceptor WT MEFs after co-culture (bottom row) are shown. White spots: Cy5 labeled tdTomato FISH. Blue: DAPI labeling. Dashed outlines represent the approximate cellular and nuclear boundaries. Donor and acceptor cells were differentiated by the number of spots and the presence of transcription sites, which appear only in donor cells. (B) Distribution of the tdTomato spots. FISH-Quant quantification of the number of tdTomato RNAs detected in each cell (denoted as a single dot) in donor MBS-MEFs cells (left) and WT MEF acceptor cells alone or in co-culture (right) of two independent experiments. Red horizontal line indicates the mean of the distribution. The samples in WT-MEF and in co-culture were compared by a one-way ANOVA, followed by indicated post-hoc pairwise comparisons. Expression in the two donor cell populations were compared by unpaired t-test. * - p≤0.05; **** - p≤0.0001. (C) Use of a doxycycline-inducible tdTomato. MBS-MEFs stably expressing tdTomato under the control of a doxycycline-inducible promoter were incubated with increasing concentrations of doxycycline (0–4 mg/ml) for 24 hr prior to co-culture with WT MEFs in medium containing the same concentration of doxycycline. Left panel: Score of smFISH labeling of donor tdTomato MBS-MEFs using probes against tdTomato RNA. Right panel: Score of smFISH labeling of tdTomato RNA in acceptor WT MEFs after co-culture. Summary of two independent experiments. Expression (left panel) and RNA transfer (right panel) between untreated and doxycycline-treated cells, respectively, was compared using an unpaired t-test. Red horizontal line indicates the mean of the distribution. * - p≤0.05; ** - p≤0.01; *** - p≤0.001; **** - p≤0.0001.
Figure 5—figure supplement 1
No cis element is involved in β-actin mRNA transfer.
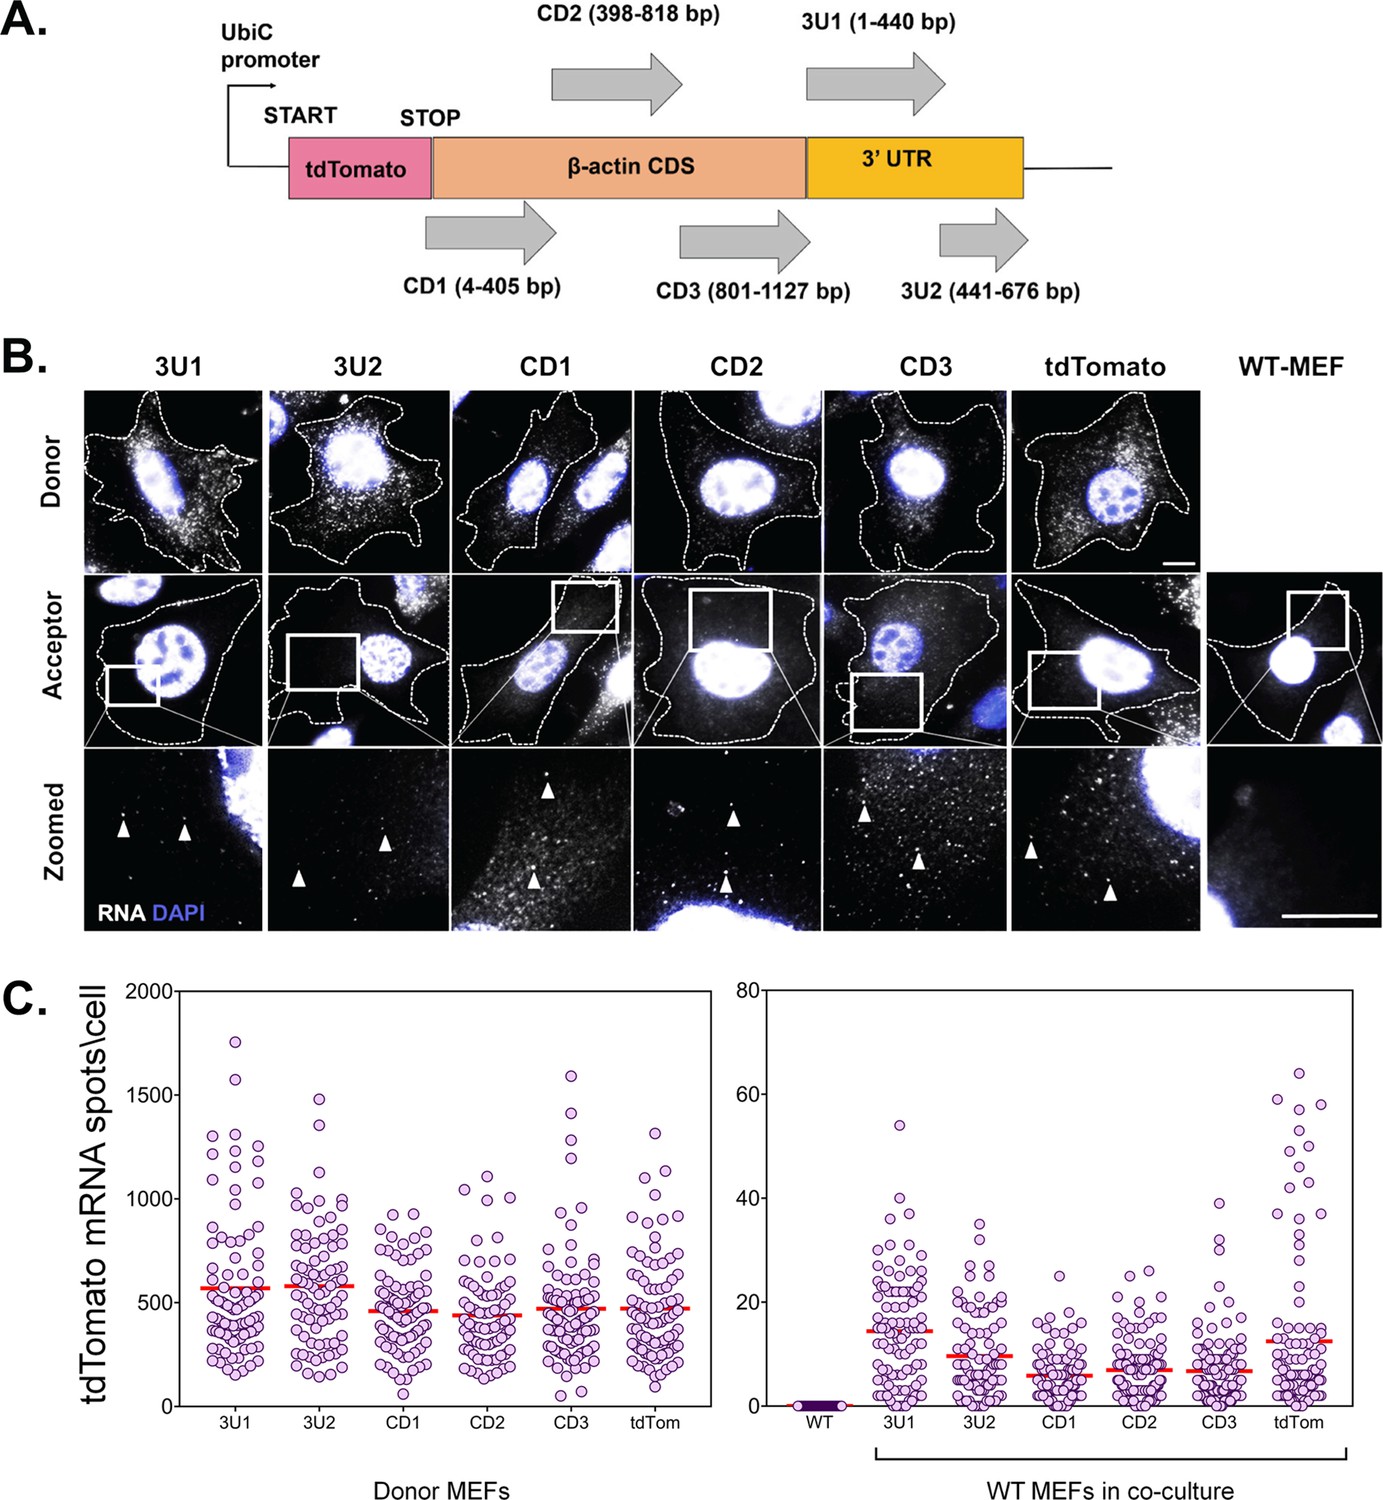
(A) Schematic of the construct design: The CDS and 3’ UTR of the β-actin were divided into five segments, namely CD1, CD2, CD3, 3U1, 3U2. The three fragments of coding sequences were designed to be overlapping so as to detect any cis element that might occur in the junction. The 3’ UTR was divided at the bp 441 after the stop codon as the insertion of MBS at this point was used to detect robust transfer, as reported previously (Haimovich et al., 2017). Each of the constructs was cloned after the stop codon of tdTomato CDS and under the control of a constitutely active Ubiquitin promoter. A construct using just the tdTomato CDS and no β-actin fragment was used as a control. Transfer of each construct was followed by smFISH for the tdTomato CDS. (B) smFISH images: Representative images of Cy5-labeled tdTomato RNA by smFISH in donor cells (top row), acceptor cells (last column) and acceptor cells in culture with donor cells expressing six different constructs (middle row). Indicated squares are magnified, with the transferred RNAs indicated by arrowheads. Gray: Cy5-labeled tdTomato FISH spots. Blue: DAPI. Dashed outline represent the approximate cell boundary. Scale bar: 10 µm (C) Distribution of the tdTomato spots: FISH-Quant quantification of the number of tdTomato mRNAs detected (each cell is a single dot) in donor cells (left) and acceptor cells alone or in co-culture (right) of two independent experiments. The red horizontal lines indicate the mean of the distribution. The samples were statistically compared by a one-way ANOVA, followed by post hoc pairwise comparisons, details of which are given in Supplementary file 1 - table 2.
Figure 5—figure supplement 2
MEME analysis of transferred genes.
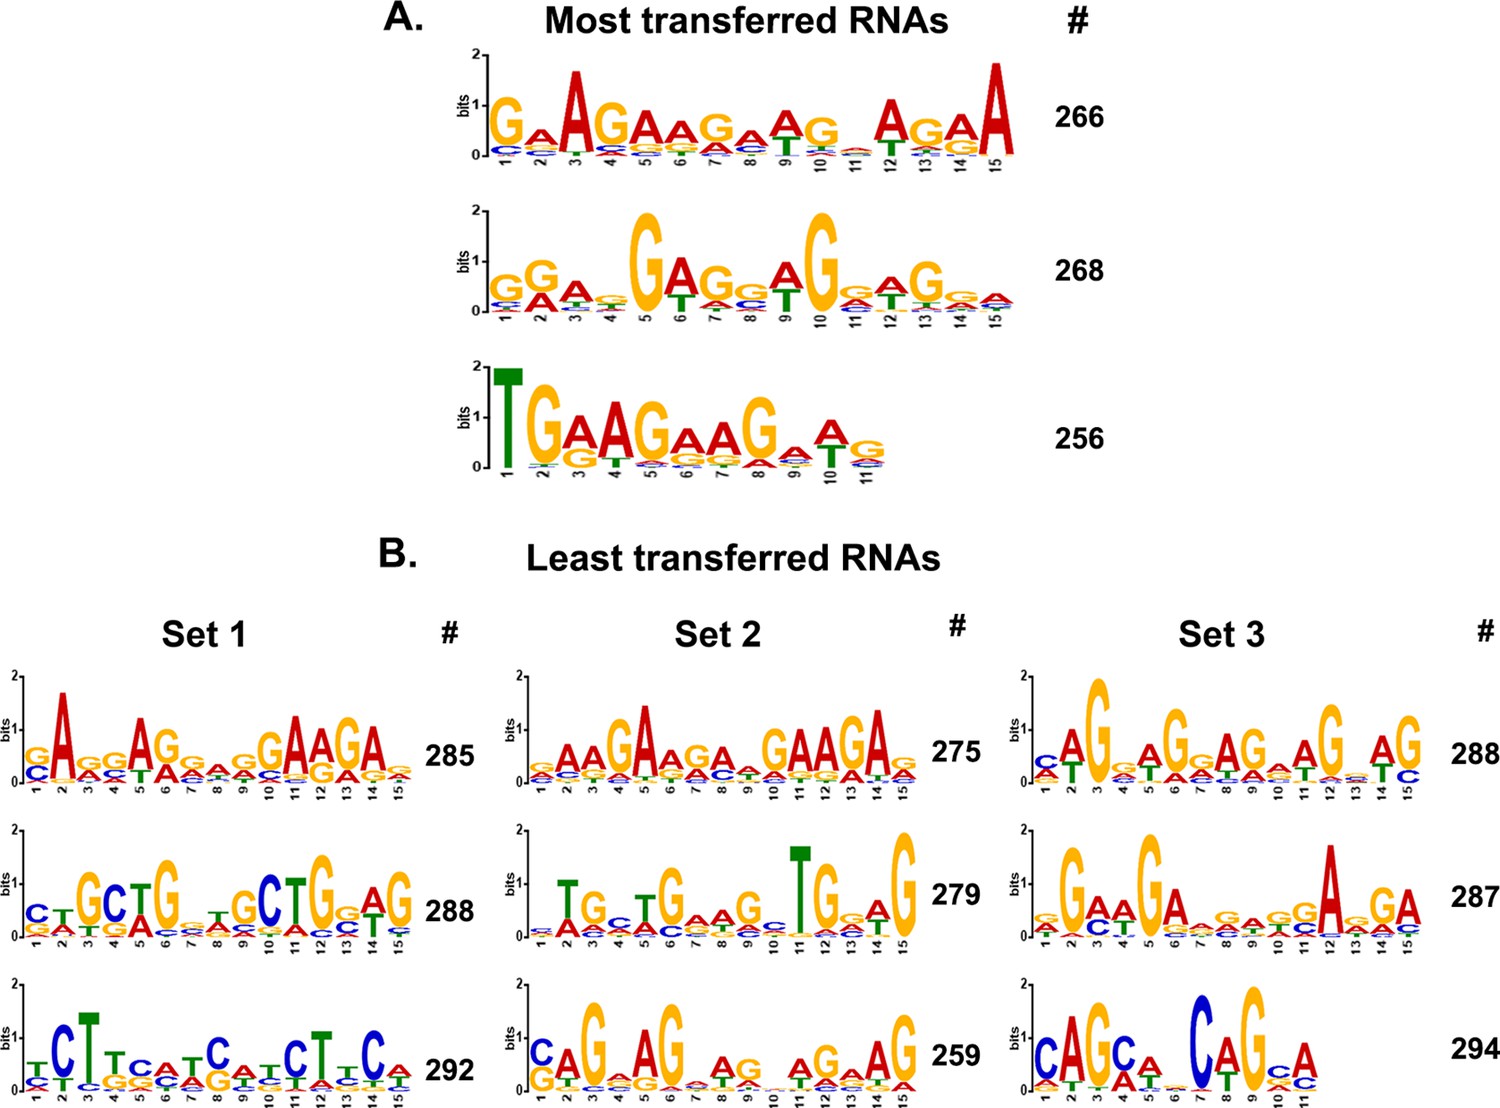
(A) Consensus motifs of the genes encoding top-most transferred RNAs. Different consensus motifs were identified among the top-most 279 transferred RNAs, as analyzed using MEME Suite. # indicates the number of query genes bearing the motif. The motifs are arranged from top to bottom according to decreasing statistical significance. (B) Consensus motifs identified among the least-transferred genes are shown. For comparison to A, three different groups of ~300 genes each of the least transferred mRNAs (Figure 5—figure supplement 2—source data 1) were analyzed and displayed in the same fashion. Set 1=300 genes examined; Set 2=288; Set 3=299.
-
Figure 5—figure supplement 2—source data 1
This file contains three lists of low-transferred mRNAs and their transfer-related data used for MEME analysis in Figure 5—figure supplement 2.
- https://cdn.elifesciences.org/articles/83584/elife-83584-fig5-figsupp2-data1-v2.xlsx
Figure 6 with 5 supplements
Cells are connected by mRNA-containing TNTs.
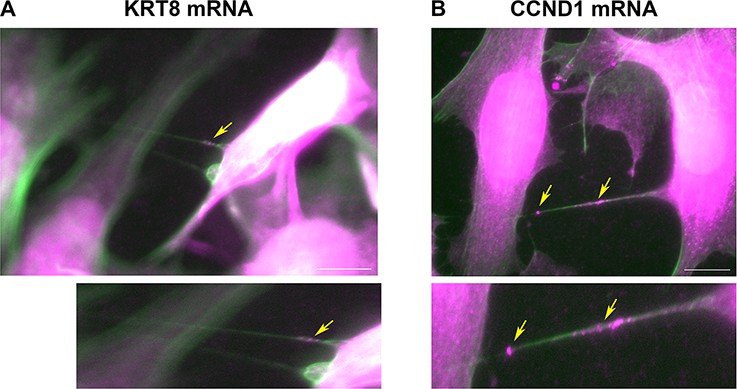
(A) KRT8 FISH image of MCF7-MEF co-cultures show actin-based TNTs (green) that contain KRT8 FISH spots (magenta). Shown is a single z slice of the FISH image, and an enlarged image of the TNTs. Brightness was amplified to allow easy visualization of the FISH spots (indicated by yellow arrows) in TNTs. Scale bar: 10 µm. See Figure 6—video 1 for the whole z stack. (B) CCND1 FISH image of MCF7-MEF co-cultures show actin-based TNT (green) that contain CCND1 FISH spots (magenta). Brightness was amplified to allow easy visualization of the FISH spots (indicated by yellow arrows) in TNTs. Shown is a max-projection of three middle z slices from the FISH image, and an enlarged image of the TNT. Scale bar: 10 µm. See Figure 6—video 2 for the whole z stack.
Figure 6—figure supplement 1
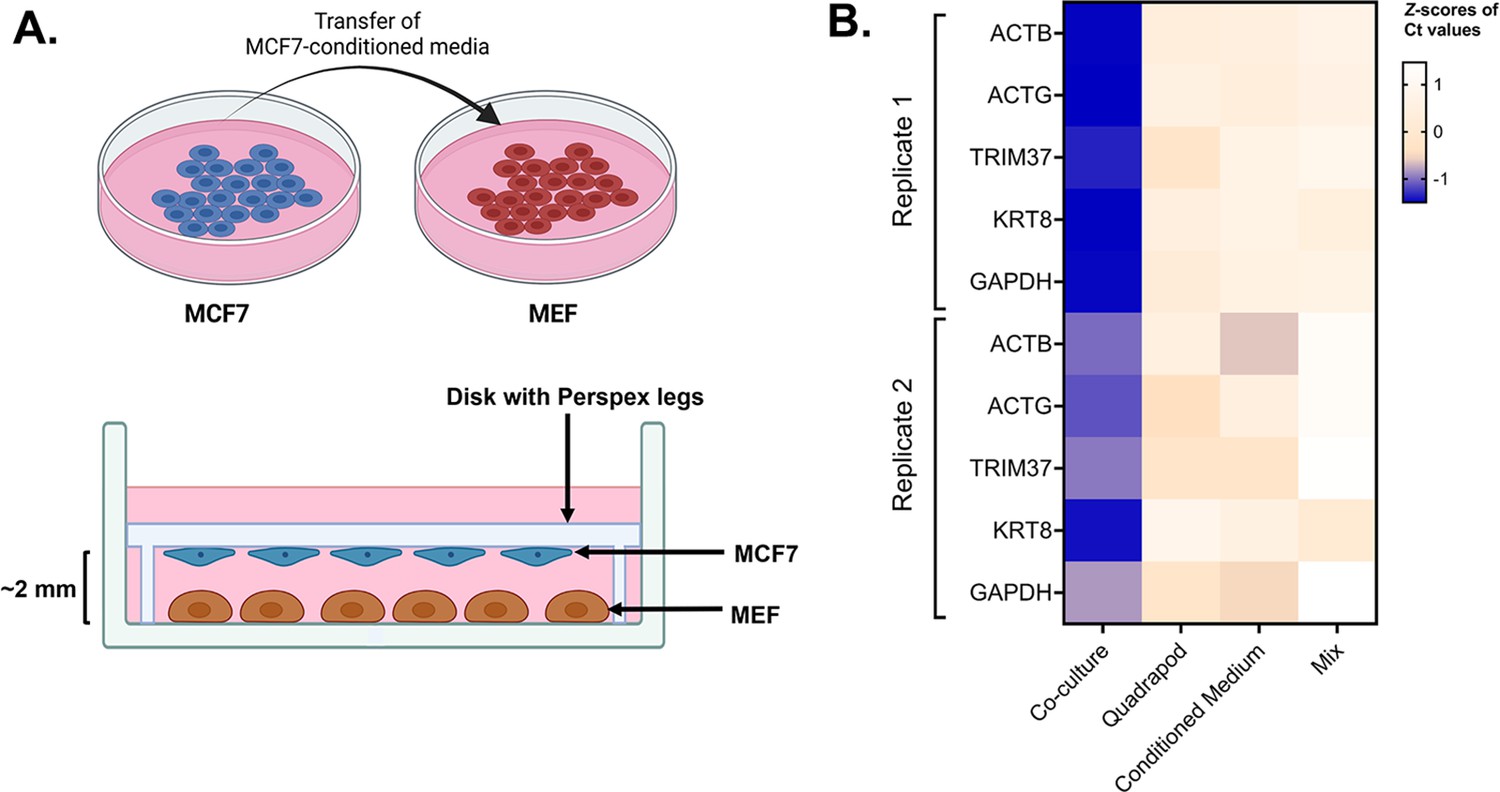
Role of cell-cell contact in intercellular mRNA transfer.
(A) Schematic of the conditioned media and quadrapod setup: (Top) Conditioned media was derived from a culture plate of MCF7 cells and transferred to a plate of MEF cells. (Bottom) In the quadrapod setup, MEF cells were cultured in a 15 cm plate while a disk with four Perspex legs (‘quadrapod’) was placed upside down. The disk contained an equivalent number of MCF7 cells, facing towards the MEF. MCF7 and MBS-MEF cells were separated by ~2–3 mm. Following culture, magnetic sorting and FACS validation, the transfer of candidate human genes in mouse cells was detected by qPCR using human-specific oligos. (B) Detection of transferred human genes in mouse samples: Transfer of 5 human mRNAs were compared in four experimental conditions – Co-culture, Mix, Quadrapod, and Conditioned Media, from two independent biological replicates. Each row represents a gene while each column represents an experimental condition. The color in each box represents the Z scores of the Ct values after normalizing for an endogenous control (18 S) and corresponding donor cell expression. Darker colors correspond to higher transfer.
Figure 6—figure supplement 2
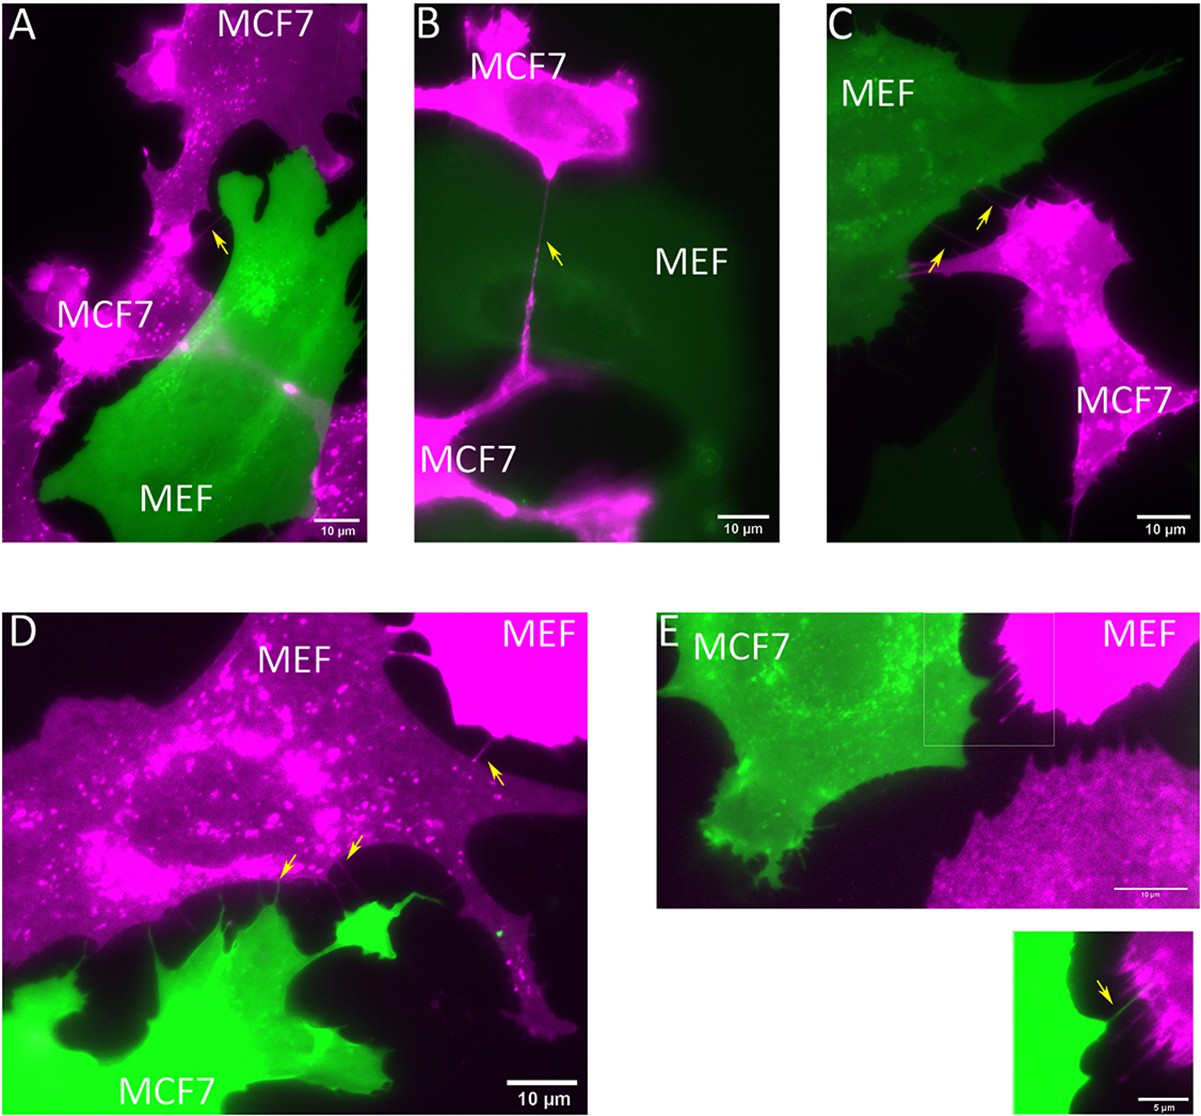
MEFs and MCF7 cells are connected by TNTs.
(A–C) MCF7 cells and MBS-MEFs expressing TagRFP-T-ps (magenta) and GFP-ps (green), respectively, were co-cultured on fibronectin-coated glass-bottom dishes. Cells were imaged 3 hr after co-culture. Yellow arrows point towards TNTs. Scale bar: 10 µm. (D–E) MCF7 cells and MBS-MEFs expressing GFP-ps (green) and TagRFP-T-ps (magenta), respectively, were co-cultured on fibronectin-coated glass-bottom dishes. Cells were imaged 3 hr after co-culture. Yellow arrows point towards TNTs. Scale bar: 10 µm. Scale bar in inset: 5 µm.
Figure 6—figure supplement 3
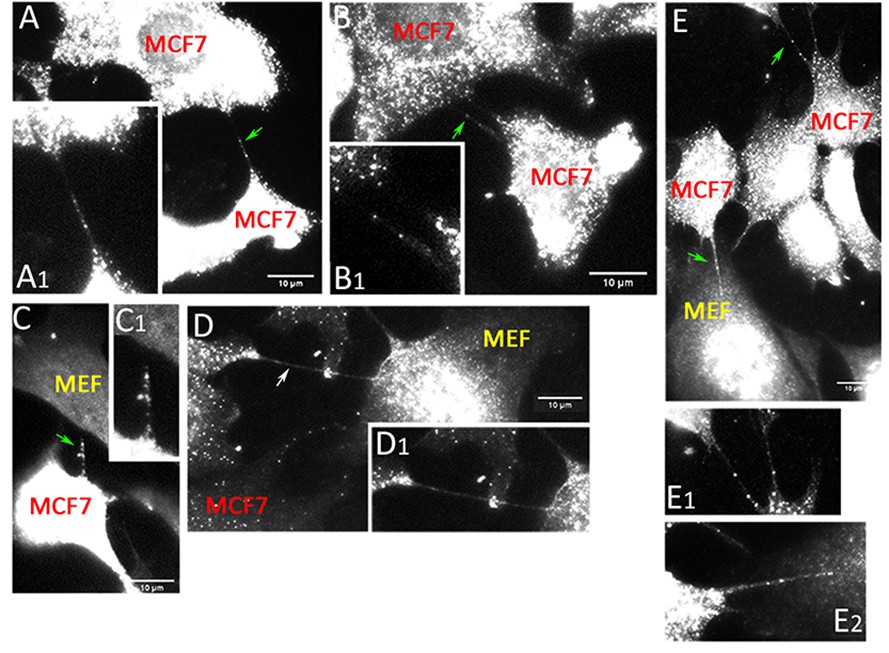
Cells are connected by mRNA-containing TNTs.
MCF7 cells and MEFs were co-cultured on fibronectin-coated glass-bottom plates and processed for smFISH using probe sets specific to KRT8 and CCND1. Panels (A–C). KRT8 RNA - FISH images of MCF7-MEF co-cultures show TNTs that contain KRT8 FISH spots (green arrows). Shown are maximum-projection FISH images and enlarged images of the TNTs (A1, B1 and C1). Scale bar: 10 µm. Panels (D–E). CCND1 RNA - FISH images of MCF7-MEF co-cultures show TNTs that either do not contain FISH spots (D); white arrow or contain CCND1 FISH spots (E); green arrows. Shown are maximum projection FISH images and enlarged images of the TNTs (D1, E1 and E2). Scale bar: 10 µm.
Figure 6—video 1
Full z stack of Figure 6A.
MCF7 cells and MEFs were co-cultured on fibronectin-coated glass-bottom plates, labeled with phalloidin, and processed for smFISH using probes specific to KRT8 RNA. Sequential z-stack imaging of the MCF7-MEF co-culture shows actin-based TNTs (green) that contain KRT8 FISH spots (magenta).
Figure 6—video 2
Full z stack of Figure 6B.
MCF7 cells and MEFs were co-cultured on fibronectin-coated glass-bottom plates, labeled with phalloidin, and processed for smFISH using probes specific to CCND1 RNA. Sequential z-stack imaging of the MCF7-MEF co-culture shows actin-based TNTs (green) that contain CCND1 FISH spots (magenta).
Figure 7 with 1 supplement
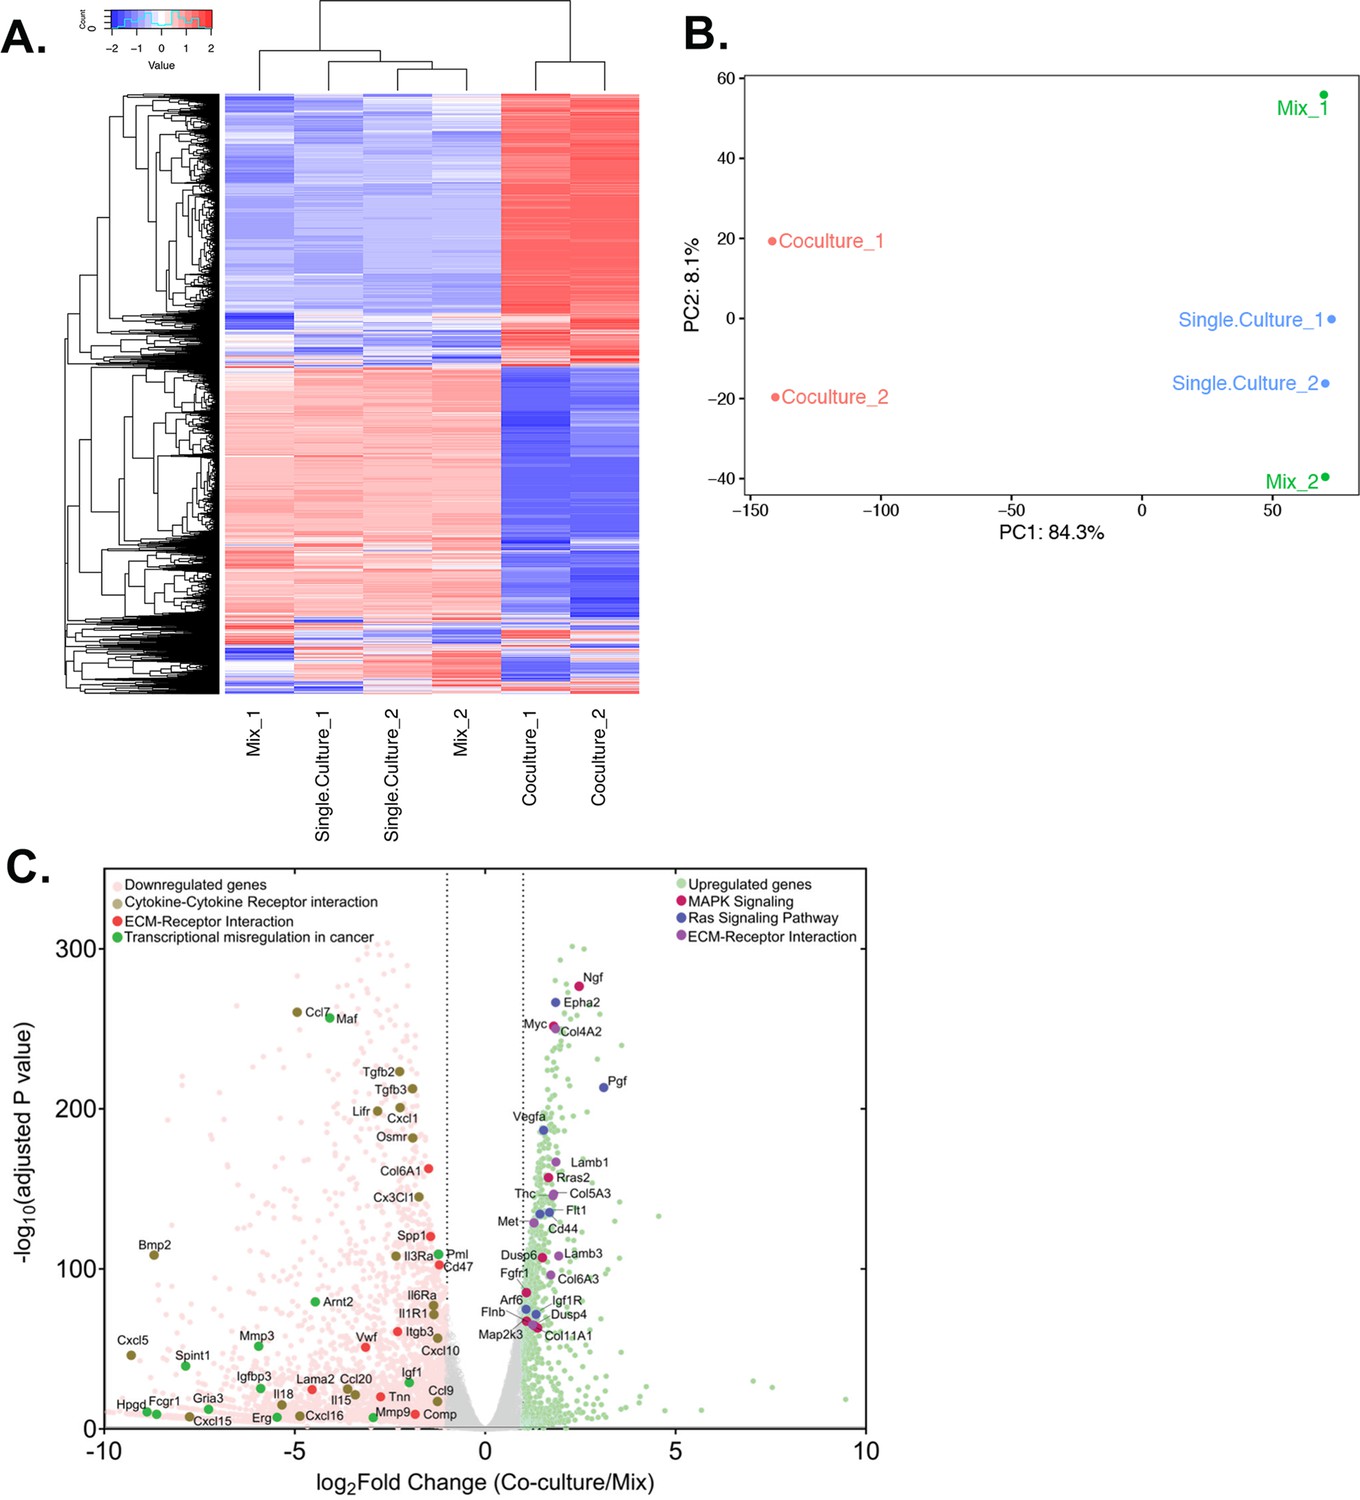
Differential gene expression in acceptor cells in response to co-culture.
RPM counts from the mouse fraction of MBS-MEF Single culture, Mix, and Co-culture samples were aligned with the mouse reference genome (mm10) and analysed further as follows. (A) Heatmap analysis indicating up-and down-regulated clusters of genes. Normalized read counts (RPM) of mouse-specific genes across Single culture, Mix, and Co-culture mouse samples were Z-normalized across rows and plotted using G-Plot package of R. Each row indicates a single gene and each column represents a sample. Cluster analysis of the samples was done by ‘maximum’ distance function and the top dendrogram shows the results. (B) PCA analysis of the samples: Mouse-specific reads from mouse samples were analyzed and plotted, as a Principal Component Analysis graph by using the base function of R. Red icon: Co-culture, Blue icon: Single Culture and Green icon: Mix. (C) Volcano plot depicting differentially regulated genes and representative pathways: Mouse-aligned genes in two replicates of ‘Mix’ and ‘Co-culture’ were analyzed for differential gene regulation by Deseq2 package in R with default parameters. Results are shown as a volcano plot with the fold change in co-culture over mix and the corresponding adjusted p-values. Threshold limit for significance was set at P=0.05. Upregulated genes are shown in light green, while the downregulated genes are shown in pink. Gray dots represent statistically insignificant genes. Black dashed lines show the fold change threshold value of ±2. Selected top upregulated and downregulated genes grouped by their cancer-related KEGG pathways are indicated.
Figure 7—figure supplement 1
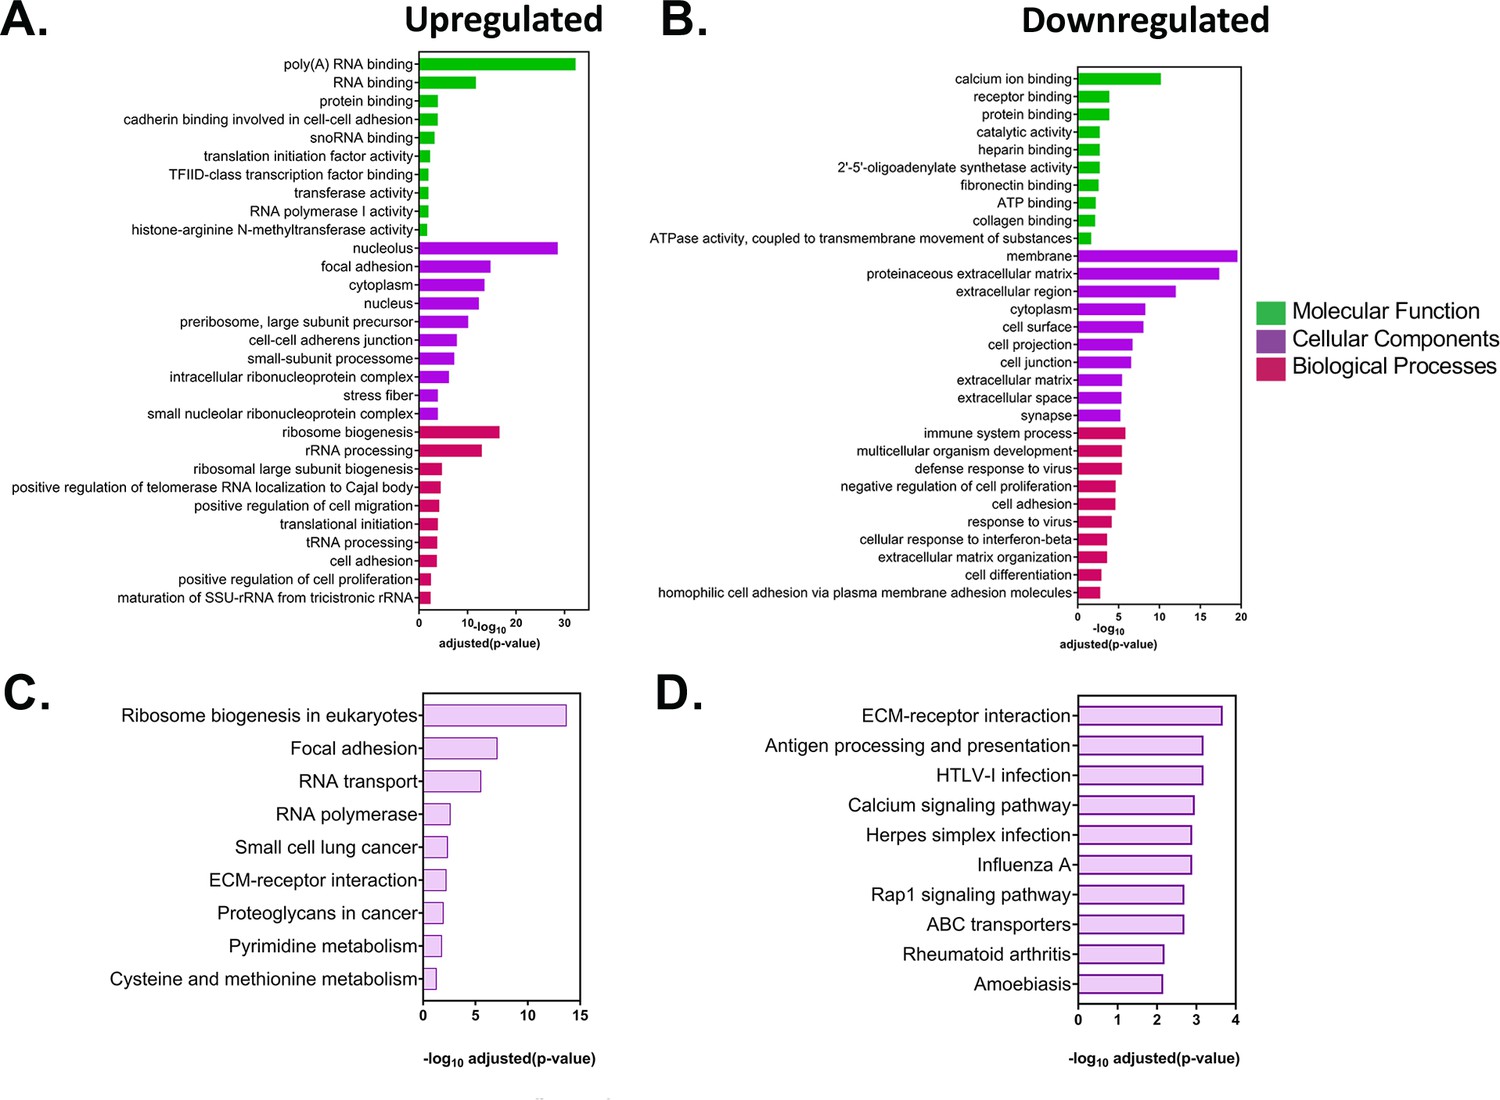
Analysis of differentially expressed genes in acceptor MEFs after co-culture.
(A–B) GO analysis of the differentially expressed genes in acceptor cells. The list of statistically significant upregulated and downregulated genes with a fold change of >±2 and were analysed by DAVID (Database for Annotation, Visualization and Integrated Discovery) and GeneCards for GO annotations. The top 10 annotations corresponding to molecular functions, cellular components and biological processes for upregulated (A) and downregulated (B) are shown, along with the adjusted values. (C–D) Pathway analysis of the differentially expressed genes in acceptor cells. The list of statistically significant upregulated and downregulated genes from the DESeq2 analysis were analysed for enriched pathways using the KEGG (Kyoto Encyclopedia of Genes and Genomes) database. Top 10 upregulated (C) and downregulated pathways (D) are shown along with the adjusted p values.
-
Figure 7—figure supplement 1—source data 1
This file contains GO and KEGG terms analysis of MEF endogenous mRNAs that were up or down regulated in co-culture.
- https://cdn.elifesciences.org/articles/83584/elife-83584-fig7-figsupp1-data1-v2.xlsx
Figure 8
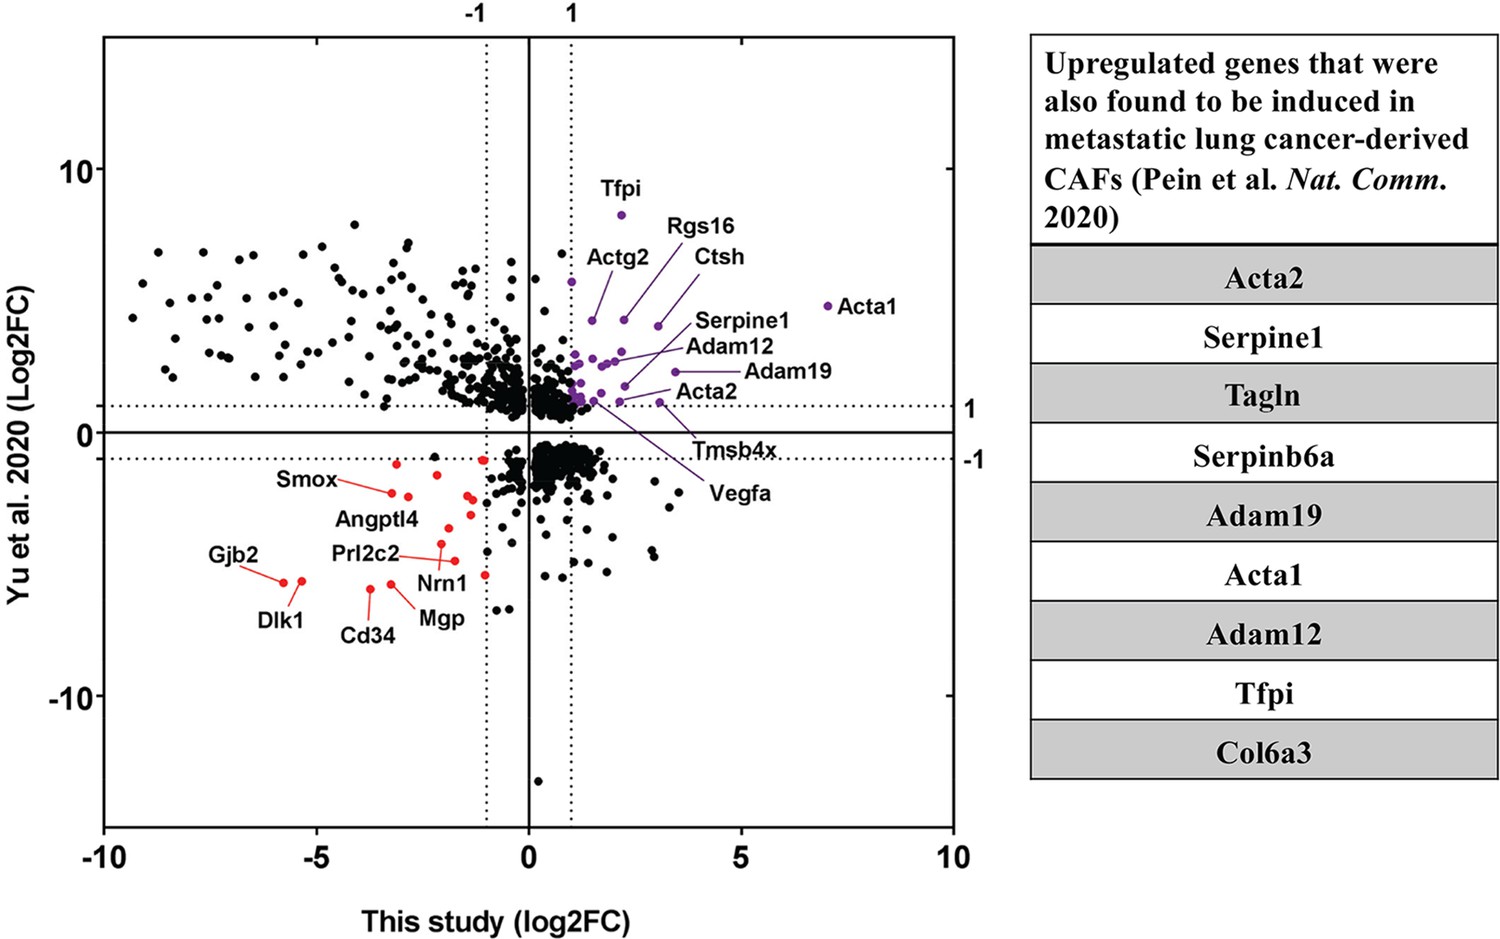
Upregulation of CAF-associated genes in MEF acceptor cells in co-culture.
Fold changes of differentially regulated genes (padj <0.05) in MEFs in co-culture compared to MEF in Mix (Figure 7) were compared to fold changes of corresponding genes in EG7-tumour derived CAFs over their precursor Mesenchymal Stem Cells (MSC) (Yu et al., 2020). Each point represents a gene. Thirty genes (marked in purple) were found to be significantly upregulated in both studies while seventeen genes (marked in red) were found to be downregulated. Among the upregulated ones, several genes (listed in the table on the right) were found to be upregulated in metastatic lung cancer-derived CAFs (Pein et al., 2020).
Additional files
-
Supplementary file 1
This file contains Tables 1-3.
Table 1. The table contains the conditions of cell sorting and percentage of cell populations after antigen-based magnetic bead cell sorting. Table 2. Results from post-hoc Tukey Test following one way ANOVA from Figure 5—figure supplement 1C – Detection of tdTomato mRNA transfer from donor MBS-MEFs expressing tdTomato-β-actin fusions to WT MEFs. Table 3. Number of occurrences of EV-mRNA targeting motifs in transferred RNAs of the same RNA sets used in Figure 5—figure supplement 2.
- https://cdn.elifesciences.org/articles/83584/elife-83584-supp1-v2.xlsx
-
Supplementary file 2
This file contains lists of FISH probes and PCR primers sequences.
- https://cdn.elifesciences.org/articles/83584/elife-83584-supp2-v2.xlsx
-
MDAR checklist
- https://cdn.elifesciences.org/articles/83584/elife-83584-mdarchecklist1-v2.pdf
-
Source data 1
This file contains 10 supplementary tables.
- https://cdn.elifesciences.org/articles/83584/elife-83584-data1-v2.xlsx
Download links
A two-part list of links to download the article, or parts of the article, in various formats.
Downloads (link to download the article as PDF)
Open citations (links to open the citations from this article in various online reference manager services)
Cite this article (links to download the citations from this article in formats compatible with various reference manager tools)
Global analysis of contact-dependent human-to-mouse intercellular mRNA and lncRNA transfer in cell culture
eLife 12:e83584.
https://doi.org/10.7554/eLife.83584


