Pharmacologic hyperstabilisation of the HIV-1 capsid lattice induces capsid failure
- EMBL Australia Node in Single Molecule Science, School of Biomedical Sciences, UNSW, Australia
- MRC Laboratory of Molecular Biology, United Kingdom
- Department of Biochemistry and Pharmacology, Bio21 Molecular Science and Biotechnology Institute, University of Melbourne, Australia
- Structural Biology Unit, St. Vincent’s Institute of Medical Research, Australia
- The Kirby Institute, UNSW, Australia
- Division of Infection and Immunity, University College London, United Kingdom
Figures
Figure 1
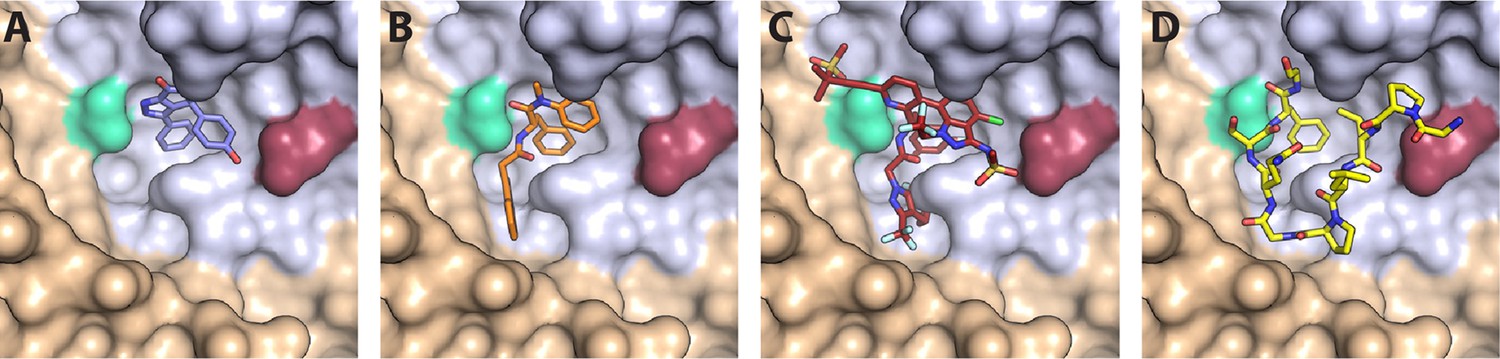
CA hexamer structures in complex with FG-binding pocket ligands.
Two neighbouring CA molecules (grey, light brown) are shown as surface representation. Landmark residues N57 (pale green) and N74 (red-brown) are highlighted. Ligands are shown as sticks: (A) BI-2. (B) PF74. (C) LEN. (D) CPSF6 peptide. PDB IDs in A, B and D: 4U0F, 4U0E, 4U0A (Price et al., 2014). PDB ID in C: 6V2F (Link et al., 2020). Images were generated with PyMol version 2.3.5.
Figure 2 with 3 supplements
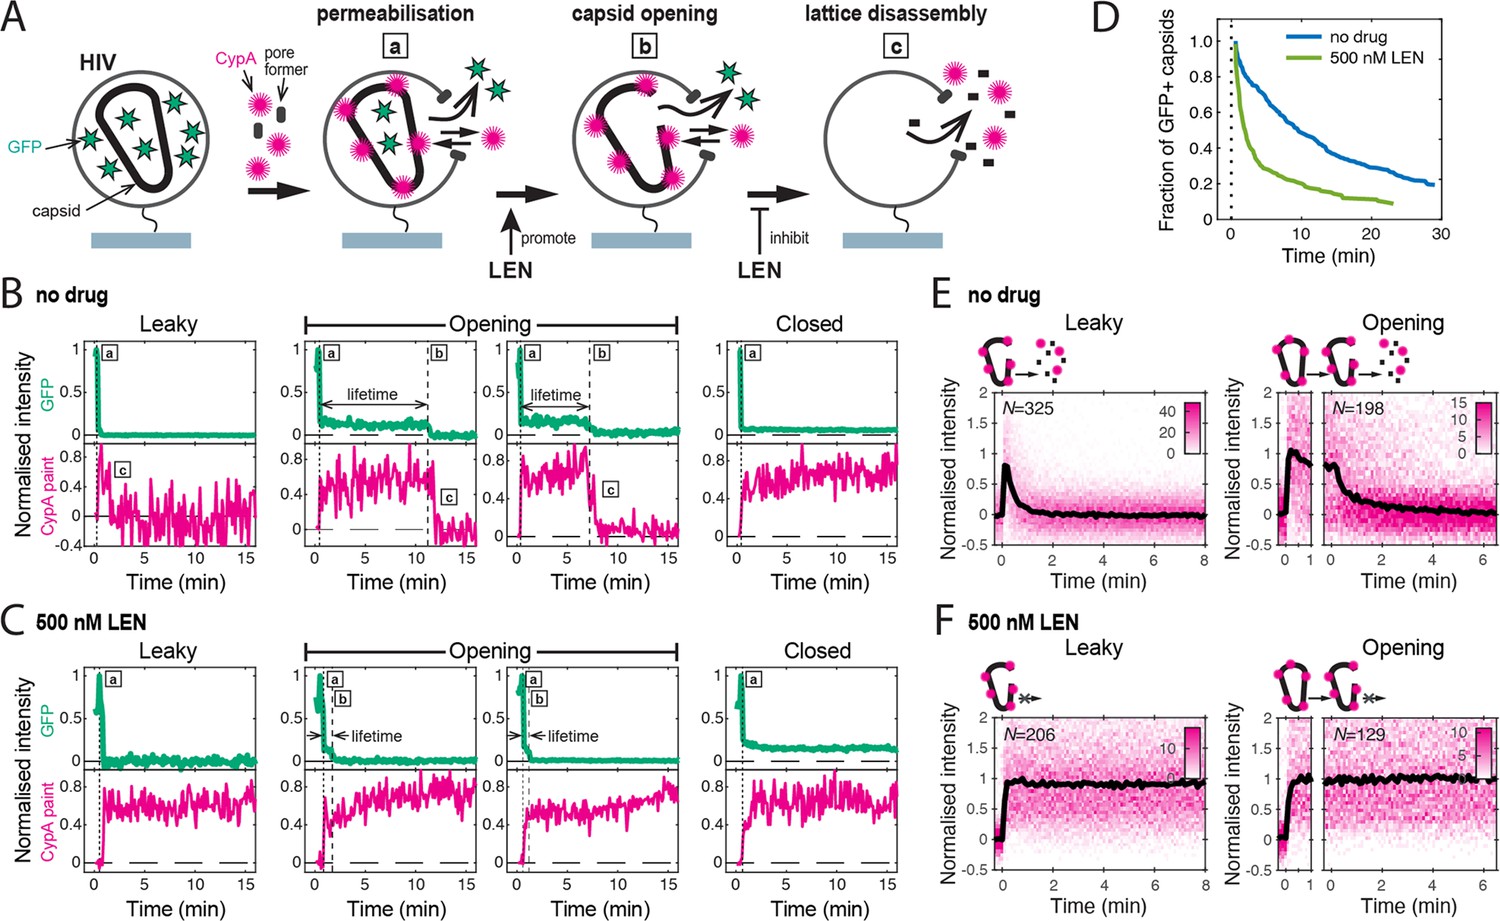
Single-molecule HIV capsid uncoating kinetics measured by TIRF microscopy.
(A) Schematic diagram of a viral particle at different stages of uncoating detected in the assay. HIV particles were produced using a proviral construct with internal GFP that is released from the viral Gag protein during maturation and packaged as a solution phase marker inside the two compartments bound by the viral membrane and the capsid, respectively. These GFP-loaded HIV particles are immobilised on the coverslip surface and permeabilised in the presence of AF568-labelled CypA while recording fluorescence traces at the locations of individual HIV particles by TIRF microscopy. Permeabilisation of the viral membrane (step a) with a pore-forming protein leads to loss of ~80–90% of the GFP signal corresponding to the pool of GFP outside the capsid. AF568-CypA molecules diffuse through the membrane pores and bind to the capsid to reach a level that is proportional to the number of CA subunits in the capsid. Capsid opening (step b) leads to loss of the residual GFP that is inside the capsid. CA lattice disassembly (step c) is apparent from the rapid loss of the CypA paint signal. (B, C) Example GFP release (blue-green) and CypA paint (magenta) traces for particles with capsids that are already leaky (i.e. contain defects and release all GFP in one step), undergo opening at various times after permeabilisation or remain closed throughout the observation period. In the absence of drug (B), the CypA paint intensity decays rapidly when the capsid is no longer closed (complete loss of GFP signal). In the presence of 500 nM LEN (C), the CypA paint signal remains constant even when the GFP signal is completely lost showing that the drug stabilises the ruptured capsid. (D) Analysis of the capsid lifetimes from all single-molecule GFP release traces in the field of view to yield capsid survival curves (including ‘opening’ and ‘closed’, excluding ‘leaky’). The faster decay in the presence of 500 nM LEN compared to no drug control shows that LEN induces rupture of the capsid. Data from a representative experiment (total number of traces): no drug (615); 500 nM LEN (281). (E, F) Analysis of all single-molecule CypA paint traces to yield heatmaps (magenta) and median traces (black line) of the CypA intensity measured at particles with leaky (left) or opening (right) capsids in the absence (E) or presence of 500 nM LEN (F). LEN prevents dissociation of CA from the lattice of capsids that are no longer closed cones. The number of HIV particles (N) for each condition is specified in the top left corner of the corresponding heatmap.
Figure 2—figure supplement 1

Maturation of HIV produced with Gag-iGFP.
(A) Bar chart showing the fraction of immature particles determined by TIRF imaging in the absence or presence of LEN or IP6. As expected, the fraction of immature particles does not depend on addition of LEN or IP6 during the uncoating experiment. The bars show the mean and the error bars show the standard deviation determined from the following number of experiments: 10 (0 nM LEN), 4 (5 nM LEN), 4 (50 nM LEN), 4 (500 nM LEN) and 3 (100 µM IP6). (B) Representative single-molecule fluorescence traces characteristic of an immature Gag lattice. Unlike particles that have undergone proteolysis, immature particles release little or no GFP because it remains part of the Gag polyprotein anchored to the inside of the viral membrane. CypA binding to these particles is negligible or slow because the CypA loops are poorly accessible in the context of the immature Gag lattice. Particles identified as immature on the basis of these criteria are excluded from analysis since they do not contain a mature capsid.
Figure 2—figure supplement 2
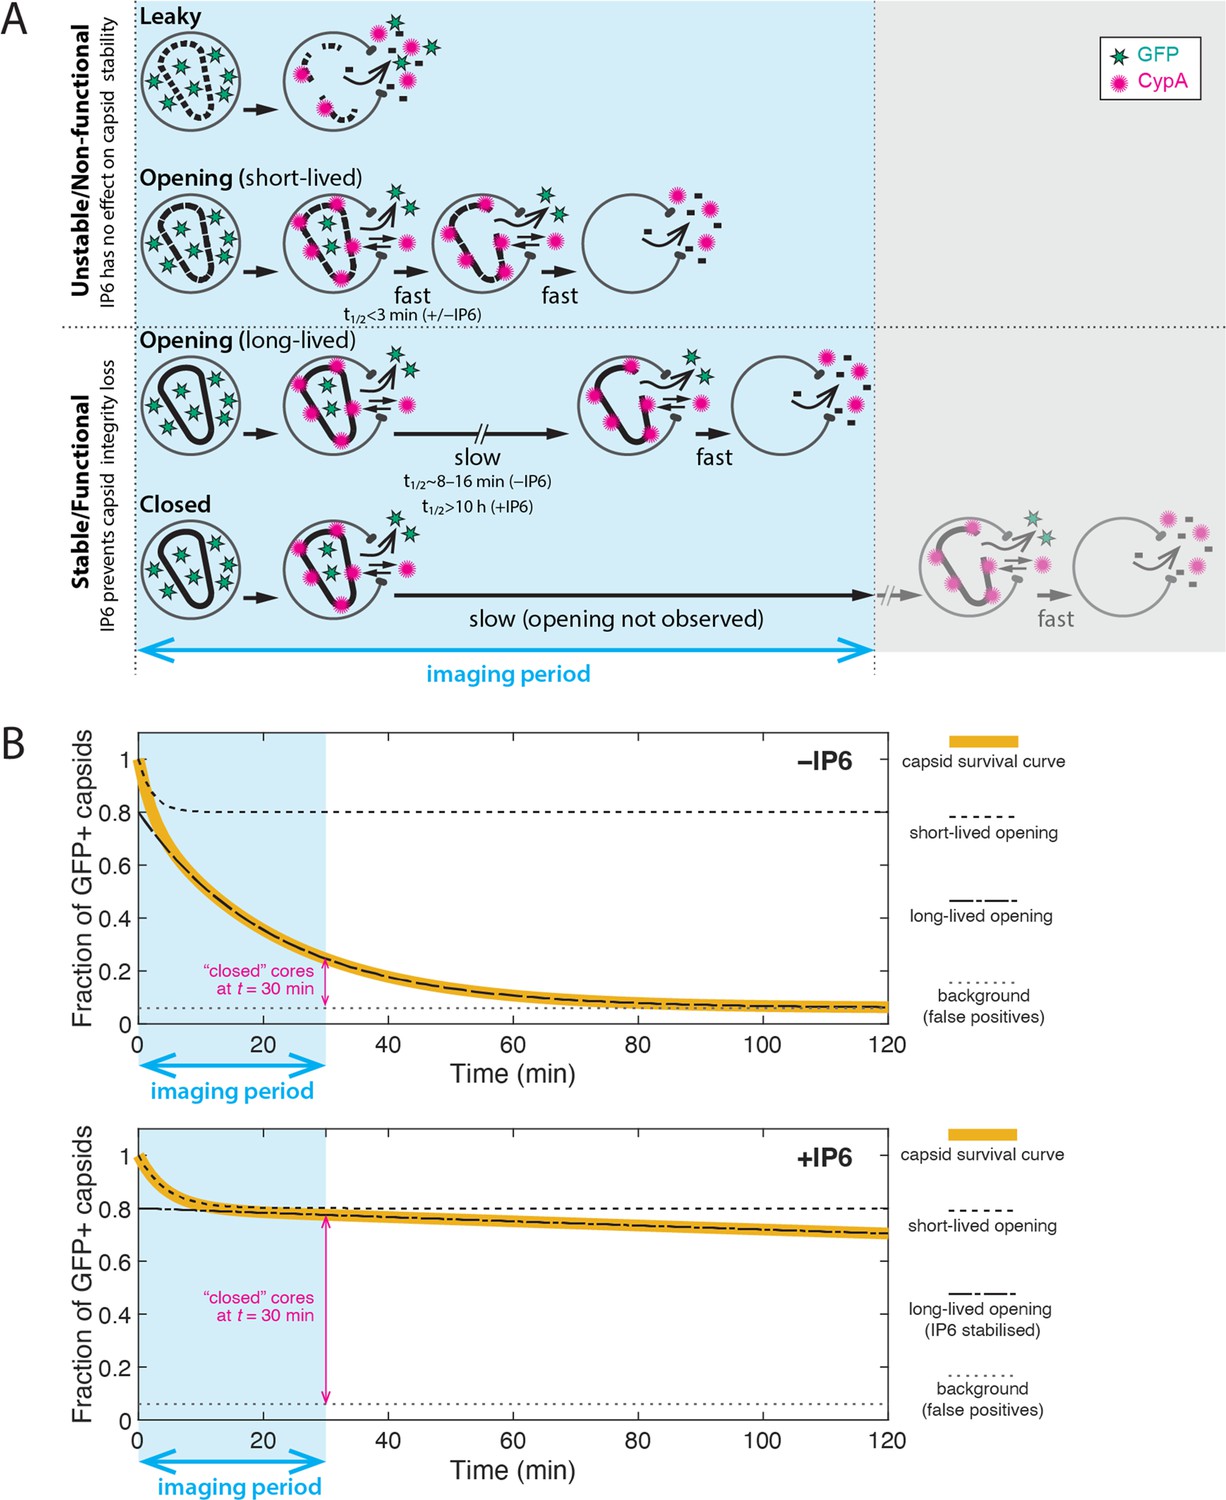
Interpretation of TIRF uncoating data and limitations of the assay.
(A) Cartoon showing the different uncoating phenotypes observed in the dual colour (iGFP release and CypA paint) TIRF uncoating assay. Two broad stability types can be distinguished: (1) Unstable/non-functional capsids. ‘Leaky’ (total GFP release upon virion permeabilisation) and ‘opening–short-lived’ capsids (half-life of 1–2 min) are intrinsically unstable and cannot be rescued by IP6. These capsids are presumably incompletely or improperly assembled and non-functional. (2) Stable/functional capsids. The subpopulation of ‘opening–long-lived’ capsids (half-life of 8–16 min) can be stabilised by IP6, which keeps the closed cone intact by preventing loss of the first subunit(s), greatly increasing the half-life. Capsids that remain closed at the end of the experiment are presumed to have the same uncoating behaviour (i.e. are structurally and functionally the same) as ‘opening–long-lived’ capsids, whereby the imaging period was simply not long enough to observe the opening of all capsids in the field of view. Limitations of the TIRF uncoating assay: As with all imaging methodologies, the particle detection limit depends on factors that influence the signal-to-noise ratio (e.g. laser power, exposure time, penetration depth, imaging frequency, photophysical properties of the fluorophore). Known artefacts of iGFP: (1) Particles produced with iGFP have a broad distribution of GFP intensities, and dim particles with closed capsids that contain too little GFP can fall below the detection limit and thus appear as GFP-negative/CypA paint-positive spots. (2) A small proportion of GFP-positive spots persists throughout the experiment and remains negative for CypA paint. We attribute this background of false positives (typically <5% of the preparation) to particles containing residual uncleaved Gag-iGFP. Known artefacts of CypA paint: The efficiency of using CypA paint analysis to detect leaky capsids depends on the imaging frequency. This is because the CypA paint signal of leaky capsids is too short-lived (often appearing in only one frame or missed entirely when imaged at a low frequency) to be detected in a noisy baseline. For example, only ~20% of leaky capsids that are detected by GFP release are also detected by CypA paint at an imaging frequency of 1 frame every 6 s. (B) Idealised capsid survival curves in the absence (top) and presence (bottom) of IP6. Leaky particles are excluded from survival analysis. The survival curve (yellow line) is a convolution of the decay curves corresponding to the short- (dashed black line) and long-lived (dash-dotted black line) subpopulations. Only the long-lived subpopulation responds to IP6. The survival curve decays to a background level above zero (dotted grey line) that is presumably due to false positive signals. Parameter values used for calculating the traces: Fractions of short-lived/long-lived/background particles are 20%/74%/6%, respectively. The half-lifes for the curves in the absence of IP6 are min and min. The half-lifes for the curves in the presence of IP6 are min and h.
Figure 2—figure supplement 3
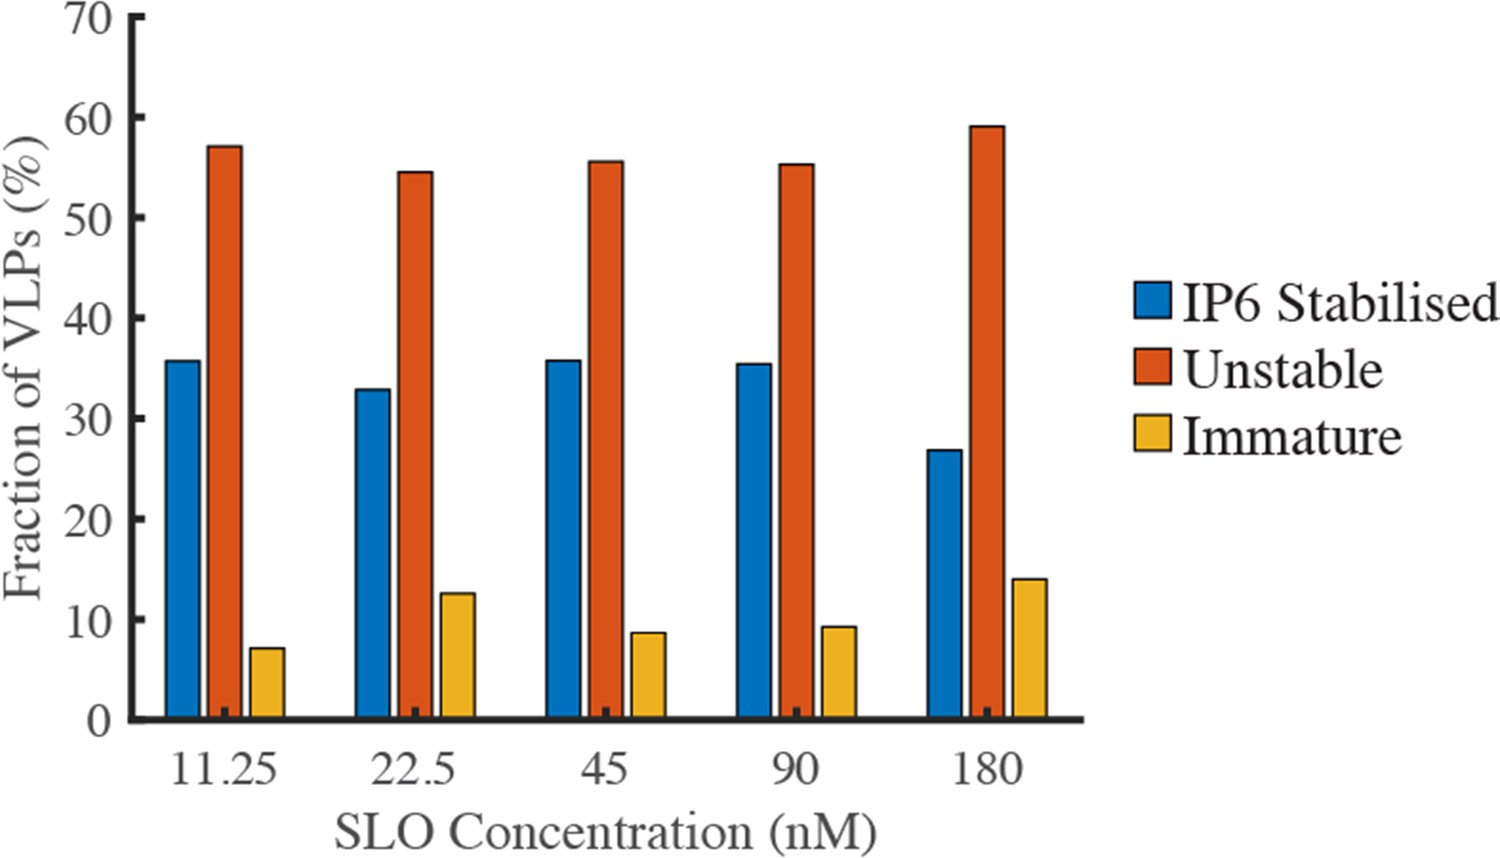
The pore-forming protein SLO does not affect capsid stability.
GFP-loaded HIV particles produced with Gag-iGFP were captured onto the surface of a glass coverslip and imaged by TIRF microscopy while flowing a solution containing the pore-forming protein SLO (to permeabilise the viral membrane) and IP6 (to prevent uncoating of stable capsids). The fractions of particles with IP6-stabilised capsids (retaining a low intensity signal corresponding to encapsidated GFP), particles with unstable capsids (complete loss of GFP intensity) and immature particles (high intensity signal due to unprocessed Gag-iGFP) was independent of the SLO concentration between 11.25 and 180 nM.
Figure 3 with 3 supplements
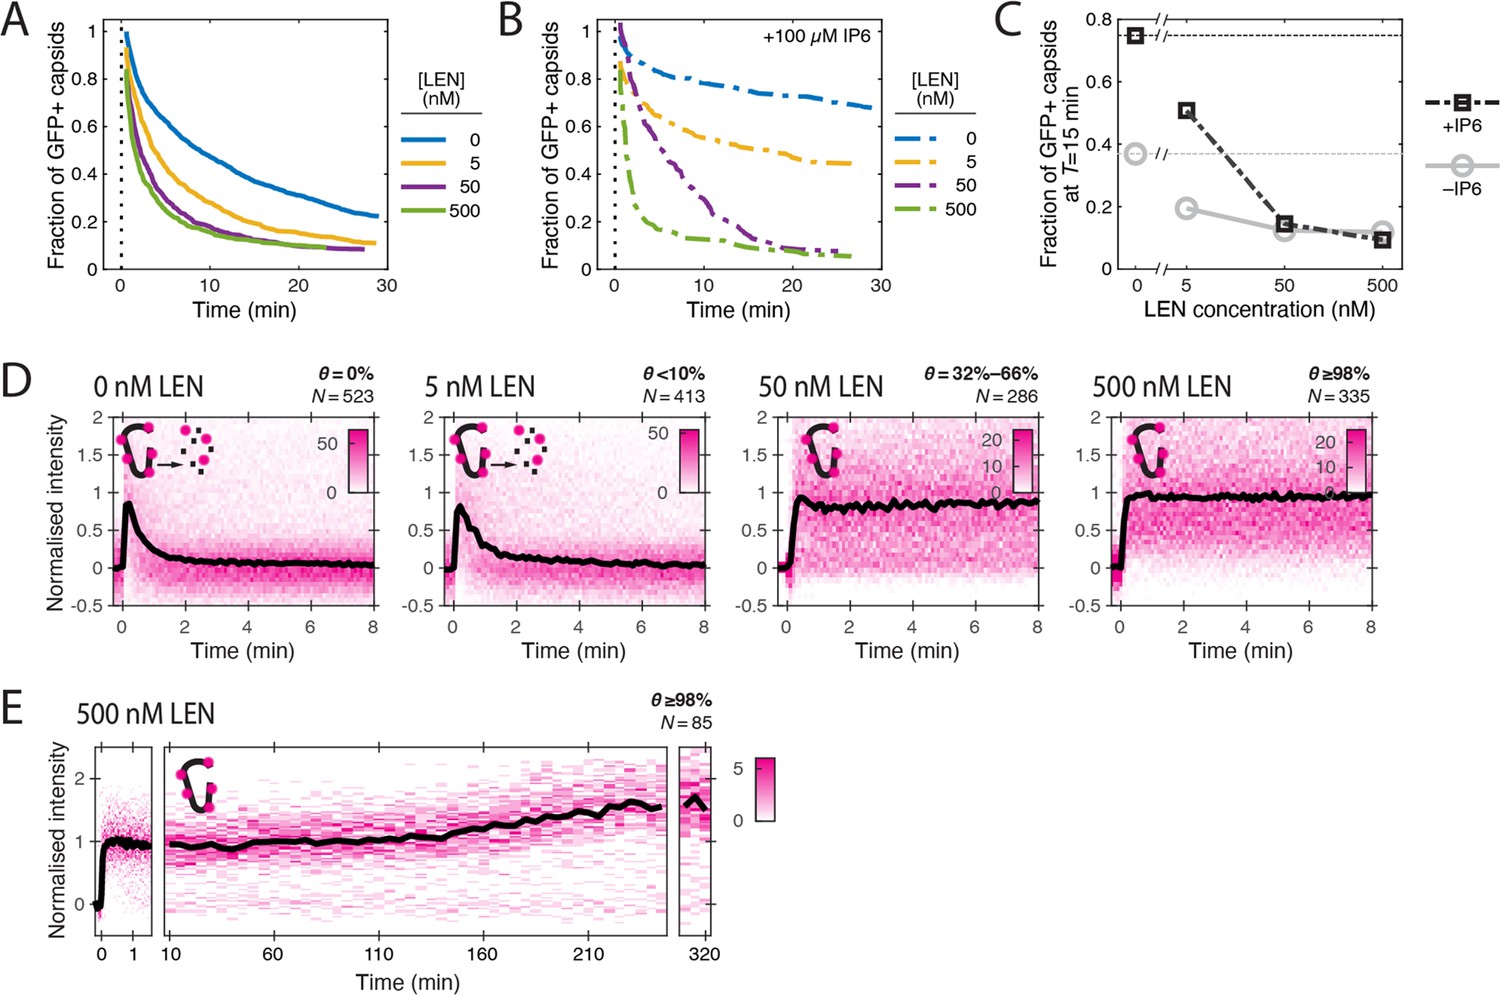
LEN accelerates capsid opening and subsequently prevents CA lattice disassembly.
Single-molecule analysis of the effect of 0–500 nM LEN −/+100 µM IP6 on capsid uncoating via GFP release and CypA paint. (A) Capsid survival curves showing that the drug induces rupture of the capsid. Pooled data from multiple experiments (total number of traces/number of experiments): 0 nM (4325/10); 0.5 nM (1242/4); 5 nM (1585/4); 50 nM (1520/5); 500 nM (1048/4). (B) Capsid survival curves showing that IP6 inhibits capsid opening in the absence of LEN and partially counteracts the drug-induced rupture of the capsid at low but not high concentrations of LEN. Pooled data from multiple experiments (total number of traces/number of experiments): 0 nM LEN +IP6 (836/3); 5 nM LEN +IP6 (589/2); 50 nM LEN +IP6 (321/1); 500 nM LEN +IP6 (238/1). (C) Fraction of closed (GFP-positive) capsids at t=15 minutes of the uncoating experiments shown in A and B. (D) Heatmaps (magenta) and median traces (black line) of the CypA intensity measured at particles with leaky or opening capsids in the presence of 0–500 nM LEN showing that LEN stabilises the CA lattice of ruptured capsids above an occupancy (θ) threshold of ~30–66%. The occupancy at the time of membrane permeabilisation was calculated as described in Figure 4—figure supplement 1. (E) Heatmap (magenta) and median trace (black line) of the CypA intensity of particles (leaky/opening) showing that 500 nM LEN prevents CA loss from the ruptured capsid for at least 5 hr. The number of HIV particles (N) for each condition in D and E is specified above the corresponding heatmap.
Figure 3—figure supplement 1
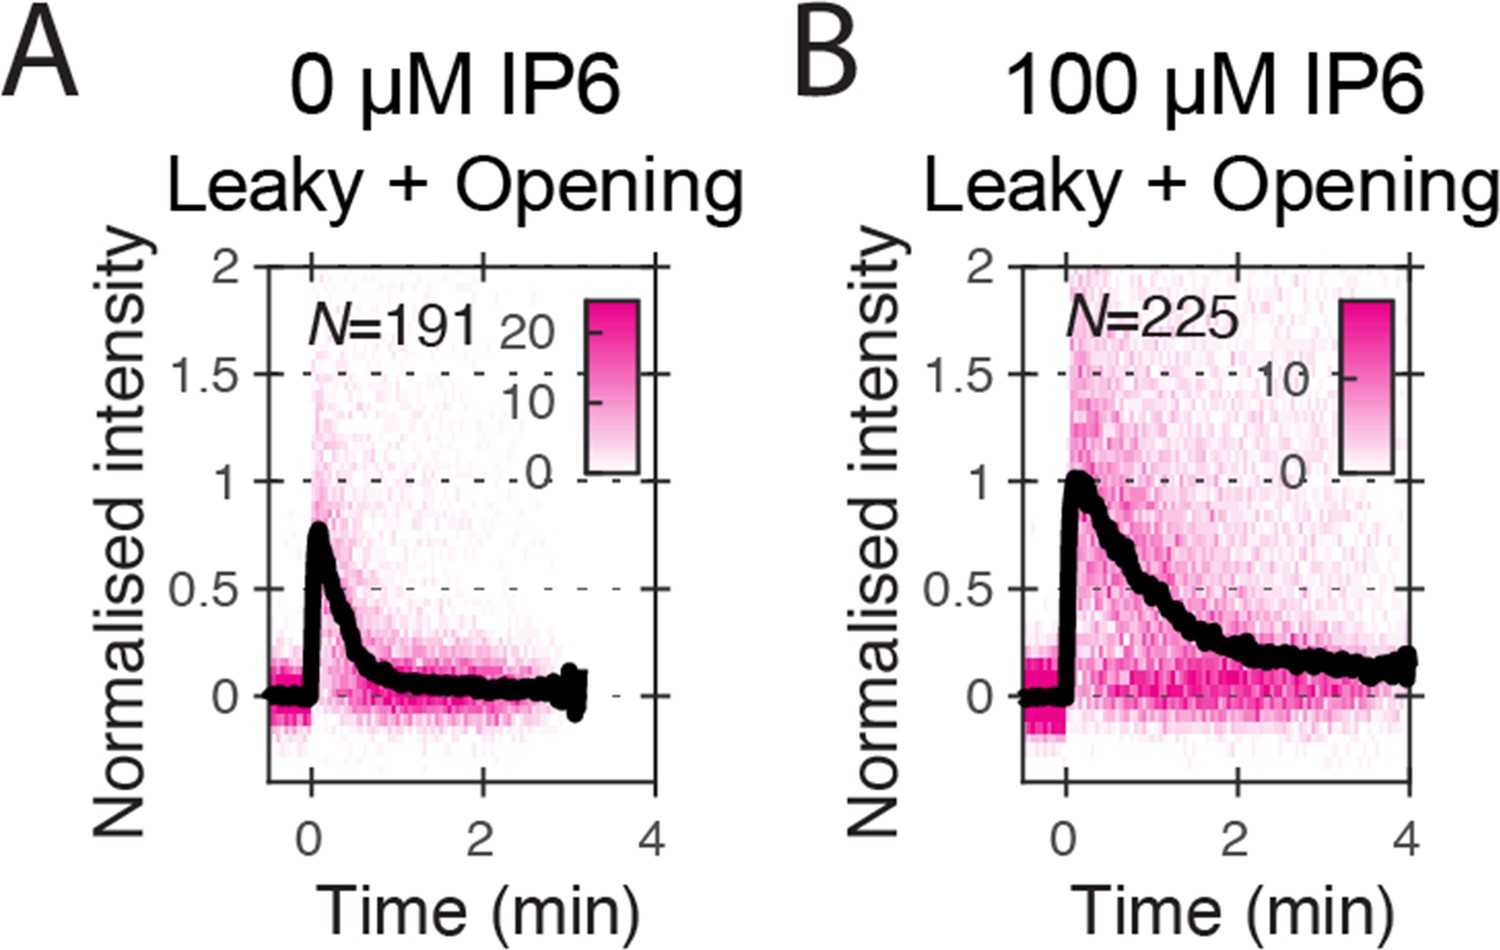
Heatmaps (magenta) and median traces (black line) of the CypA intensity measured at particles with leaky or opening capsids in the absence (A) or presence (B) of 100 μM IP6.
The number of HIV particles (N) for each condition is specified in the top left corner of the corresponding heatmap.
Figure 3—figure supplement 2
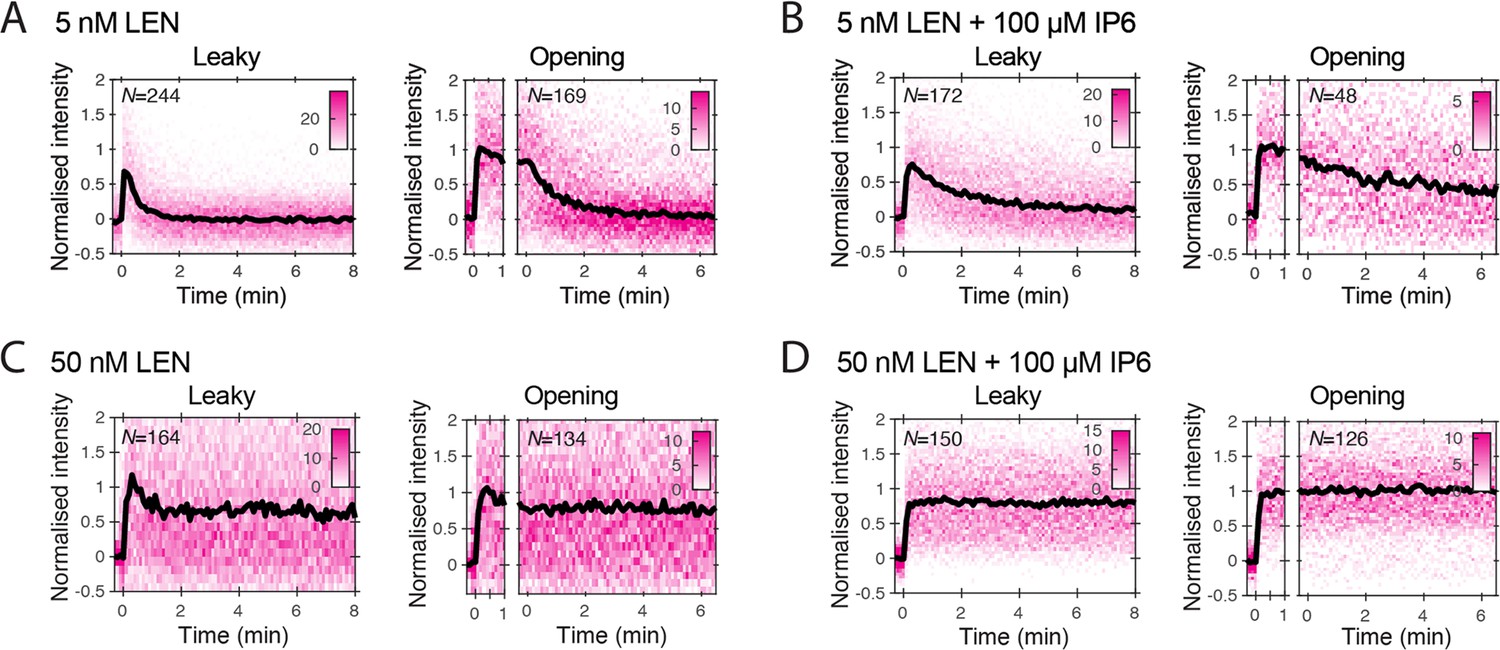
Heatmaps (magenta) and median traces (black line) of the CypA intensity measured at particles with leaky (left) or opening (right) capsids.
(A, B) 5 nM LEN in the absence (A) or presence (B) of 100 μM IP6. The presence of IP6 slows capsid disassembly in the presence of 5 nM LEN but does not prevent it. (C, D) 50 nM LEN in the absence (C) or presence (D) of 100 μM IP6. 50 nM LEN stabilises the CypA paint signal, regardless of whether IP6 is present. The number of HIV particles (N) for each condition is specified in the top left corner of the corresponding heatmap.
Figure 3—figure supplement 3
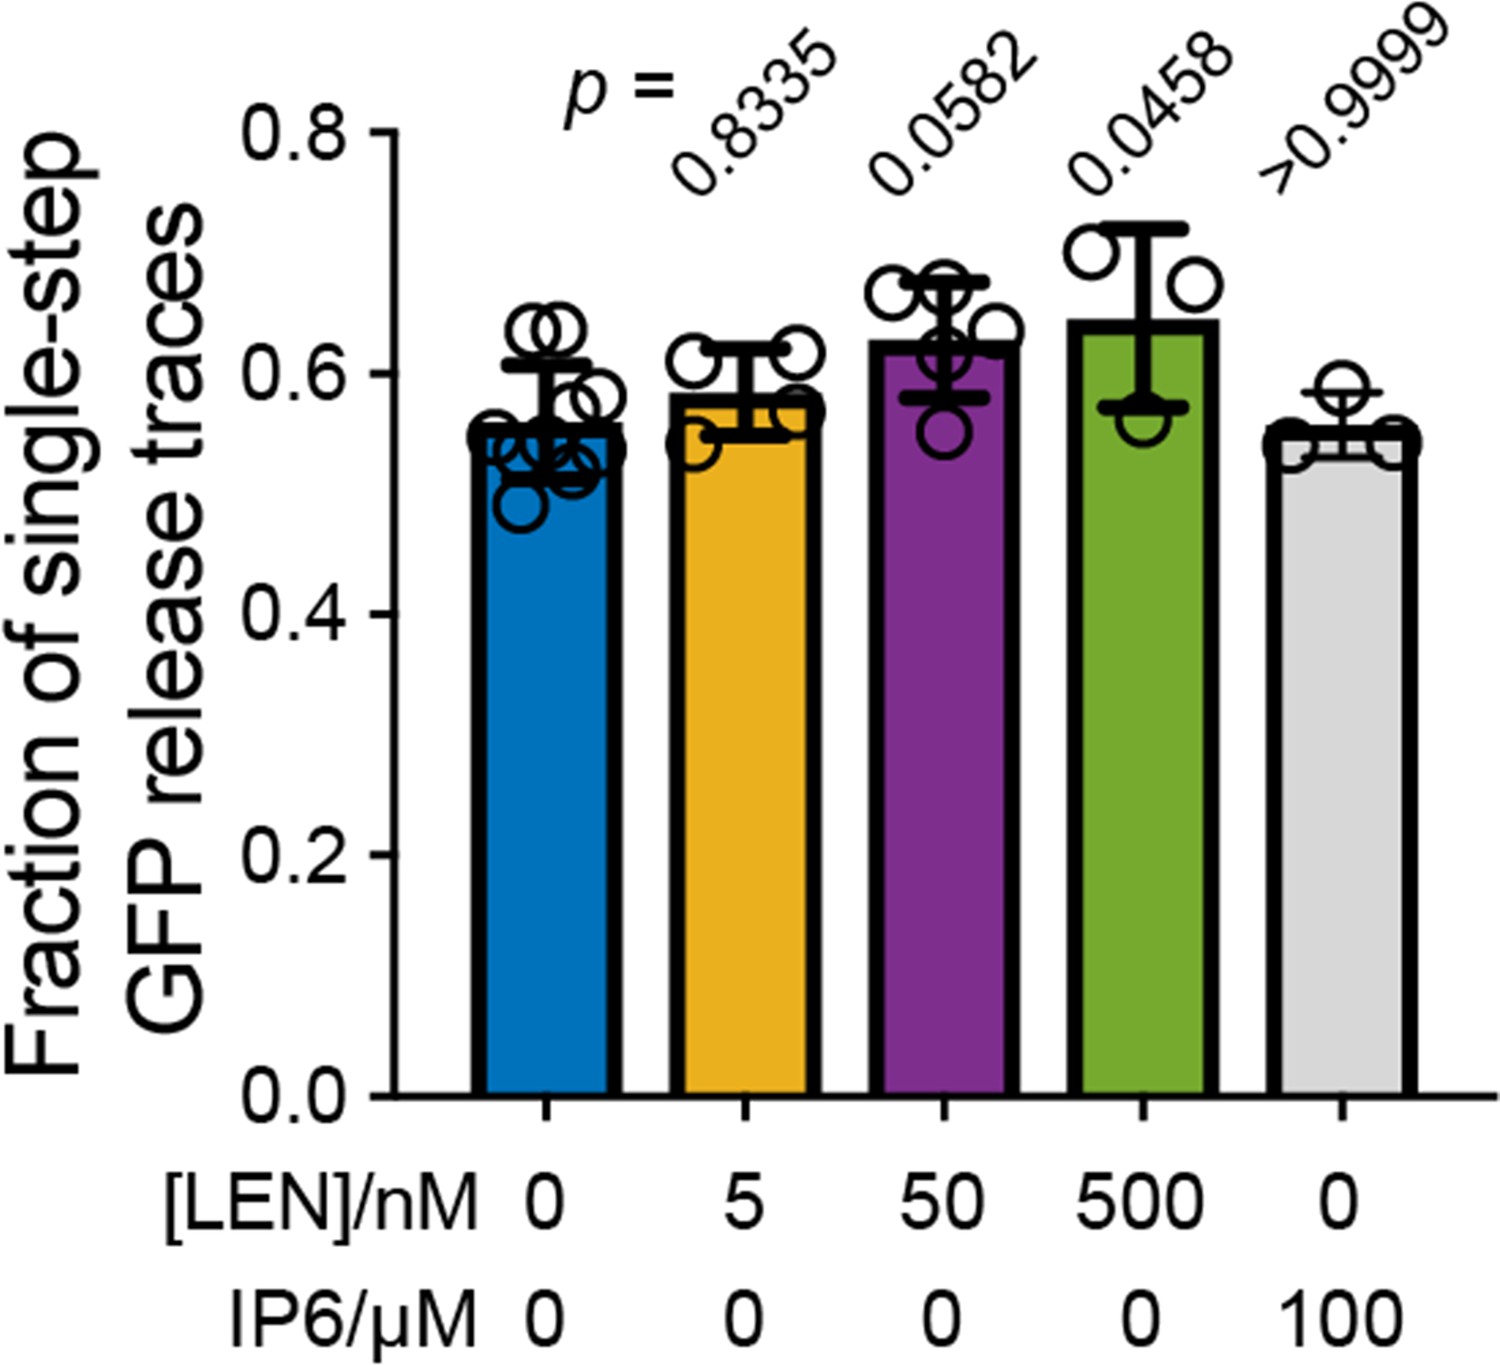
Effect of LEN on the fraction of particles that release their total GFP content in a single step.
Single-step GFP release traces in the absence of LEN are attributed to ‘leaky’ capsids that cannot retain GFP upon membrane permeabilisation. This leaky fraction is 56 ± 5% for virions analysed in Figures 2 and 3. Addition of LEN during the uncoating experiment causes a concentration-dependent increase in the fraction of single-step GFP release traces (reaching 65 ± 5% at 500 nM LEN), whereby we attribute the increase to rapid LEN-induced rupture of intact capsids (too fast to be resolved as a separate step in the uncoating traces recorded with a frame rate of 1 frame every 6 s). As expected, IP6 does not affect the ‘leaky’ fraction because IP6 stabilises closed cones but is unable to prevent disassembly of CA lattices with open edges. Bar charts show the mean and error bars show the standard deviation from the following number of experiments: 10 (0 nM LEN), 4 (5 nM LEN), 5 (50 nM LEN), 3 (500 nM LEN) and 3 (100 µM IP6). Statistical comparisons using one-way ANOVA with Dunnett’s multiple comparison test. The p values of the comparison between control (0 nM LEN) and different LEN concentrations are given above the corresponding bars.
Figure 4 with 3 supplements
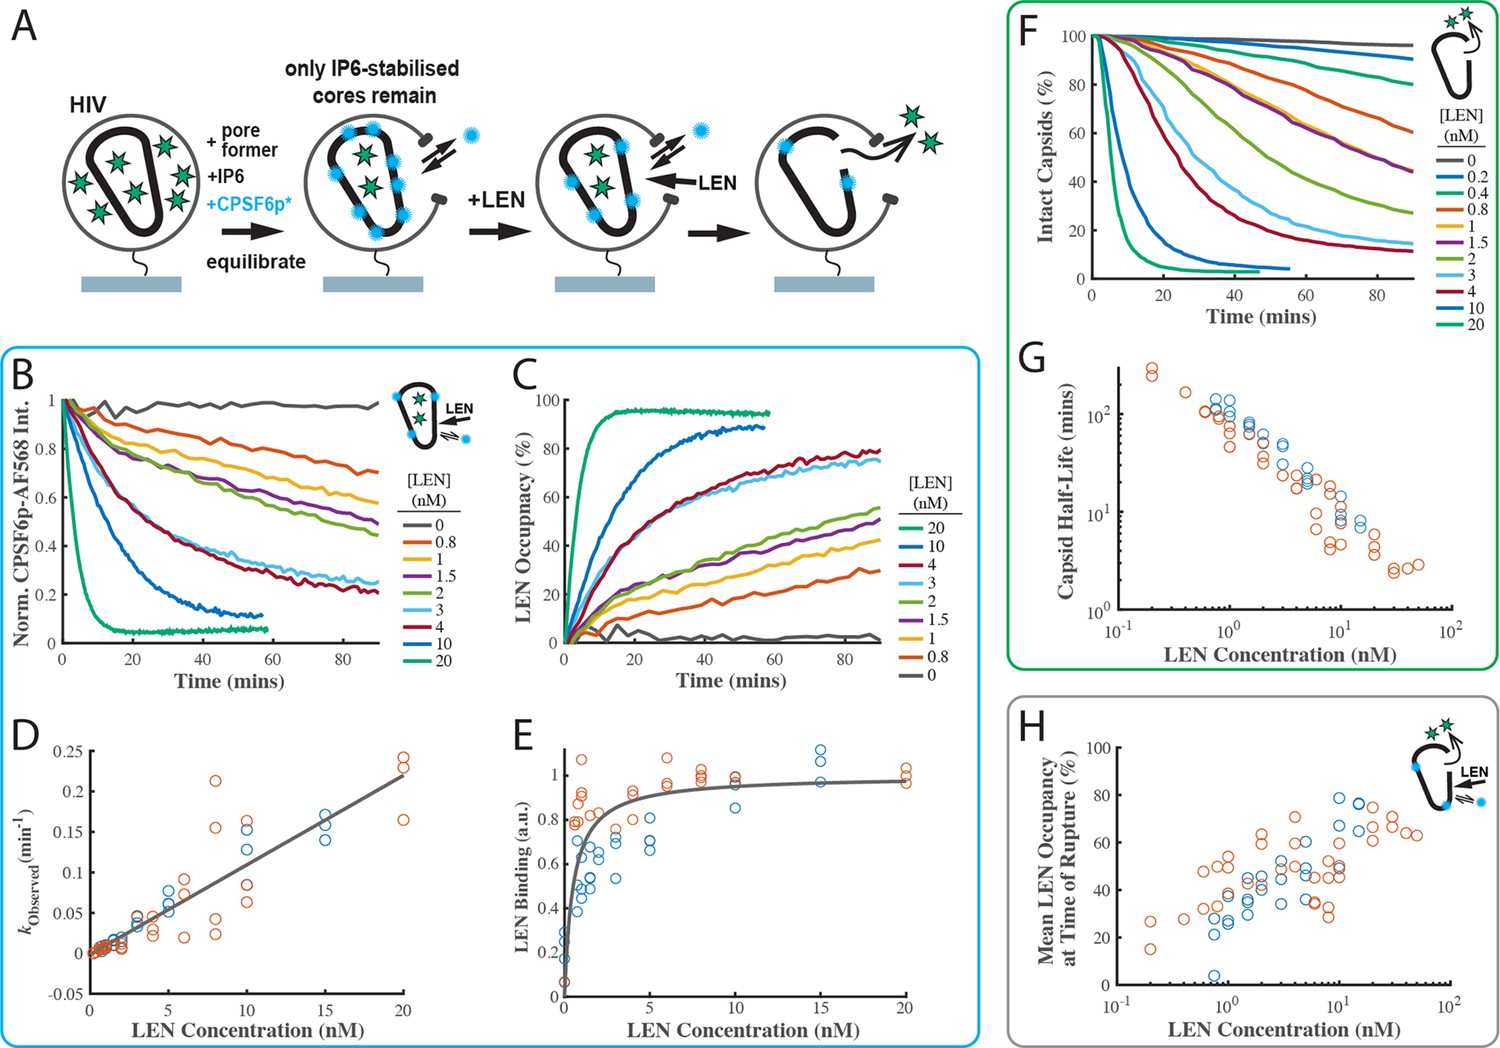
LEN binding to capsids is slow at concentrations close to the EC95 and limits the kinetics of LEN-induced capsid rupture.
(A) Schematic diagram of the TIRF microscopy competition binding and capsid opening assay. GFP-loaded HIV attached to the glass coverslip are permeabilised using SLO and incubated in a solution 30 µM IP6. During this period, unstable capsids that do not respond to IP6 fall apart. Labelled CPSF6p (0.2 nM) functions as a paint probe (occupying ~2% of free FG binding pockets at equilibrium). LEN displaces labelled CPSF6p on the capsid over time, leading to a decrease of the labelled CPSF6p intensity. Rupture of the capsid is detected by GFP release. (B–E) Analysis of CPSF6p-AF568 signal disappearance to extract LEN binding kinetics and affinity. (B) Mean CPSF6p-AF568 displacement curves measured at all IP6-stabilised capsids in the field of views in the presence of 0–20 nM LEN. (C) LEN binding curves calculated from the CPSF6p-AF568 displacement curves in B. (D) Observed LEN binding rates (obtained from an exponential fit of the binding curves) as a function of LEN concentration. The slope of the linear fit to data from two experiments provides a LEN binding rate of kon = 1.84 ± 0.78×10⁵ M–1 s–1. (E) Equilibrium binding curve for LEN on IP6-stabilised capsids. The fit (grey line) of an equilibrium binding model to the combined combined data from two experiments provided the dissociation constant of KD = 0.51 ± 0.58 nM. (F–G) Analysis of GFP release to determine the effect of LEN on capsid integrity. (F) Survival curves of IP6-stabilised capsids in the presence of 0–20 nM LEN. (G) Half life of the intact capsid as a function of LEN concentration determined from survival curves as the time point where half of the capsids had released GFP. (H) Combined analysis of the GFP release and labelled CPSF6p displacement. Mean LEN occupancy levels at the time of capsid rupture as a function of LEN concentration. Orange and blue circles in D, E, G and H correspond to two sets of experiments conducted with different viral preparations, different fluorophores, and different preincubation condition. Experiments shown as orange circles used CPSF6p-AF568, which was added to the capsid at the same time as LEN. Experiments shown as blue circles used CPSF6p-ATTO643, which was preincubated with HIV prior to LEN exposure. The CPSF6p displacement and capsid opening curves for the data set for the blue circles are shown in Figure 4—figure supplement 3.
Figure 4—figure supplement 1

The extent of the structural effect of LEN on the HIV capsid depends on LEN binding kinetics.
(A) Predicted occupancy of binding pockets on the CA lattice with LEN as a function of time (θ(t)) for different LEN concentrations.The occupancy is defined as the fraction of FG binding pockets on the capsid that are occupied with a LEN molecule and was calculated using the following equation: θ(t) = θeq(1-exp(-(kon ×cLEN + koff)×t)), where θeq is the occupancy at equilibrium, cLEN is the LEN concentration, kon is the association rate constant and koff is the dissociation rate constant. The curves were calculated using published values of kon = 6.5E4 M–1s–1 and koff = 1.4E-5 s–1 determined by surface plasmon resonance spectroscopy (Link et al., 2020). (B, C) Single-molecule analysis of capsid uncoating in the presence of 5 nM LEN added to the viral particles at the start (0 hr preincubation) or 4 hr before the start (4 hr preincubation) of the TIRF assay. (B) Capsid survival curves show that preincubation with drug increases capsid rupture. Pooled data from multiple experiments (total number of traces/number of experiments): 5 nM LEN with 4 hr preincubation (1159/3). Traces without preincubation (0/5/500 nM) are replotted from Figure 3A for comparison. (C) CypA paint heatmaps and median CypA paint intensity traces of leaky and opening capsids show that preincubation is required to stabilise the CA lattice after capsid rupture. The occupancy at the time of permeabilisation (2 min) was calculated as above using the published rate constants determined by surface plasmon resonance spectroscopy or TIRF microscopy (this work). The number of HIV particles (N) for each condition is specified above the corresponding heatmap.
Figure 4—figure supplement 2

Binding of labelled CPSF6p to closed capsids.
(A) Schematic of the binding assay. (B) Mean binding traces recorded at the indicated concentrations of labelled CPSF6p. Binding traces were recorded at the locations of viral particles with closed capsid, whereby t=0 corresponds to the time of viral membrane permeabilisation. (C) Mean CPSF6p intensity measured at closed capsids after wash-out of labelled CPSF6p from the flow channel at t=0. The black line represents a fit of the data with a single exponential decay function. (D) Mean number of labelled CPSF6p bound per capsid determined from binding experiments (see panel B for an example). Each symbol represents an independent binding experiment, black bars indicate mean and standard deviation.
Figure 4—figure supplement 3

Independent repeat of the single-molecule capsid uncoating experiment with fluorescent CPSF6p as a ‘paint’ probe to measure LEN binding.
(A) Mean CPSF6p-Atto643 displacement curves measured at all IP6-stabilised capsids in the field of views in the presence of 0–15 nM LEN. The Atto643 label resulted in a higher background than observed for the AF568 label in Figure 4. (B) LEN binding curves calculated from the CPSF6p-Atto643 displacement curves in A. (C) Survival curves of IP6-stabilised capsids in the presence of 0–15 nM LEN. (D) Fraction of IP6-stabilised capsids that open in the presence of 0.2–50 nM LEN. The LEN-induced caspsid rupture efficiency drops to below 65% at concentration ≤0.4 nM LEN.
Figure 5 with 1 supplement
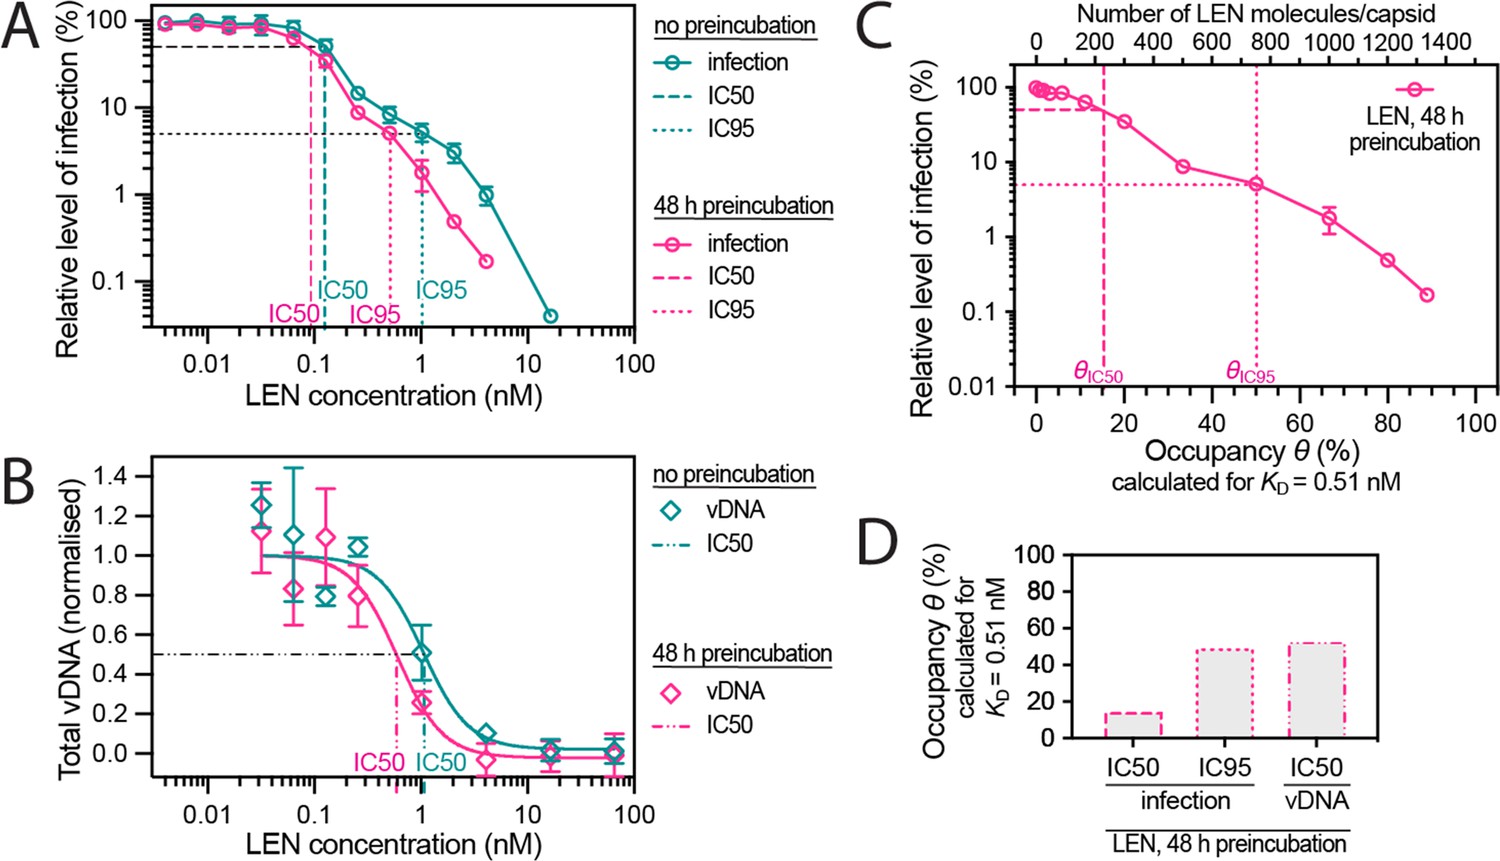
Preincubating HIV particles with LEN is required to obtain the full effect of the drug on capsid stability, HIV infection and reverse transcription.
(A) Dose-response curves of Jurkat cells infected with VSV-G-pseudotyped GFP-encoding virus that was preincubated for 0 hr or 48 hr with the corresponding concentration of LEN. The number of infected cells was determined by flow cytometry 48 hr post infection. Data points represent percent infectivity relative to the vehicle control. The graph shows data from four (0 hr preincubation) or three (48 hr preincubation) independent experiments. The symbols represent the mean and the error bars the standard deviation. The vertical dashed lines indicate the IC50 values determined from least squares fits of the curves and the vertical dotted lines indicate the IC95 values determined as the concentration where the relative level of infection reaches 5% (0 hr preincubation: 1.024 nM [5.3% infection]; 48 hr preincubation: 0.512 nM [5.1% infection]). (B) Quantification using qPCR of total viral DNA from Jurkat cells collected 24 hr after infection with VSV-G-pseudotyped GFP-encoding virus as in panel D (with 0 hr or 48 hr preincubation with LEN). Normalised copy numbers (mean ± SD) from two independent experiments with two technical repeats each. Least squares fit (solid line) providing IC50 values of ~1080 pM without preincubation and ~590 pM with 48 hr preincubation. (C) Relative infection after 48 hr preincubation of HIV with varying LEN concentrations (same data as in A) plotted as a function of occupancy (θ) of the FG binding pockets on the capsid. (D) Bar charts of occupancy at the IC50 and IC95 for infection and at the IC50 for vDNA synthesis. The occupancy in C and D was calculated for each LEN concentration assuming a dissociation constant (KD) of 0.51 nM using the equation θeq = cLEN / (cLEN +KD), where θeq is the occupancy at equilibrium and cLEN is the LEN concentration.
Figure 5—figure supplement 1
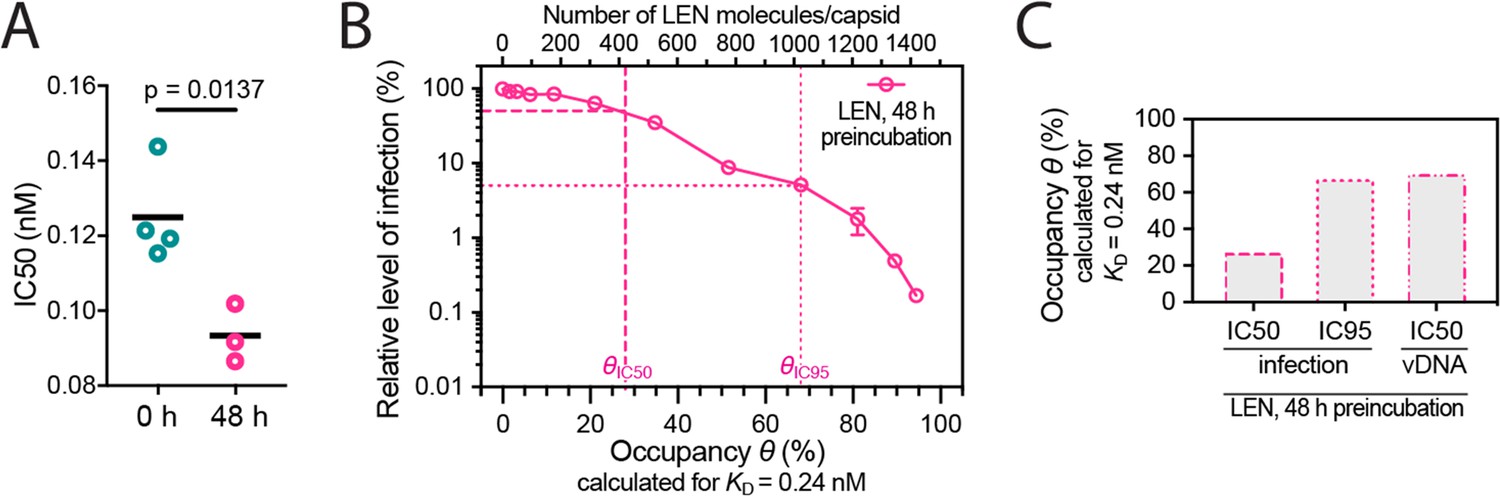
Preincubation of HIV with LEN.
(A) Effect on IC50 of preincubating VSV-G-pseudotyped GFP-encoding HIV with LEN. Relative IC50 values determined from least squares fits of the data in Figure 5A giving values of 125±13 pM without preincubation and 93±8 pM with 48 hr preincubation. Each symbol represents an independent experiment and the black line represents the mean. Statistical analysis using an unpaired two-tailed t-test. (B, C) Same plots as in Figure 5C and D but assuming the dissociation constant (KD) of 0.24 nM determined by surface plasmon resonance spectroscopy (Link et al., 2020). (B) Relative infection after 48 hr preincubation of HIV with varying LEN concentrations plotted as a function of occupancy (θ) of the FG binding pockets on the capsid. (C) Bar charts of occupancy at the IC50 and IC95 for infection and at the IC50 for vDNA synthesis.
Figure 6 with 1 supplement
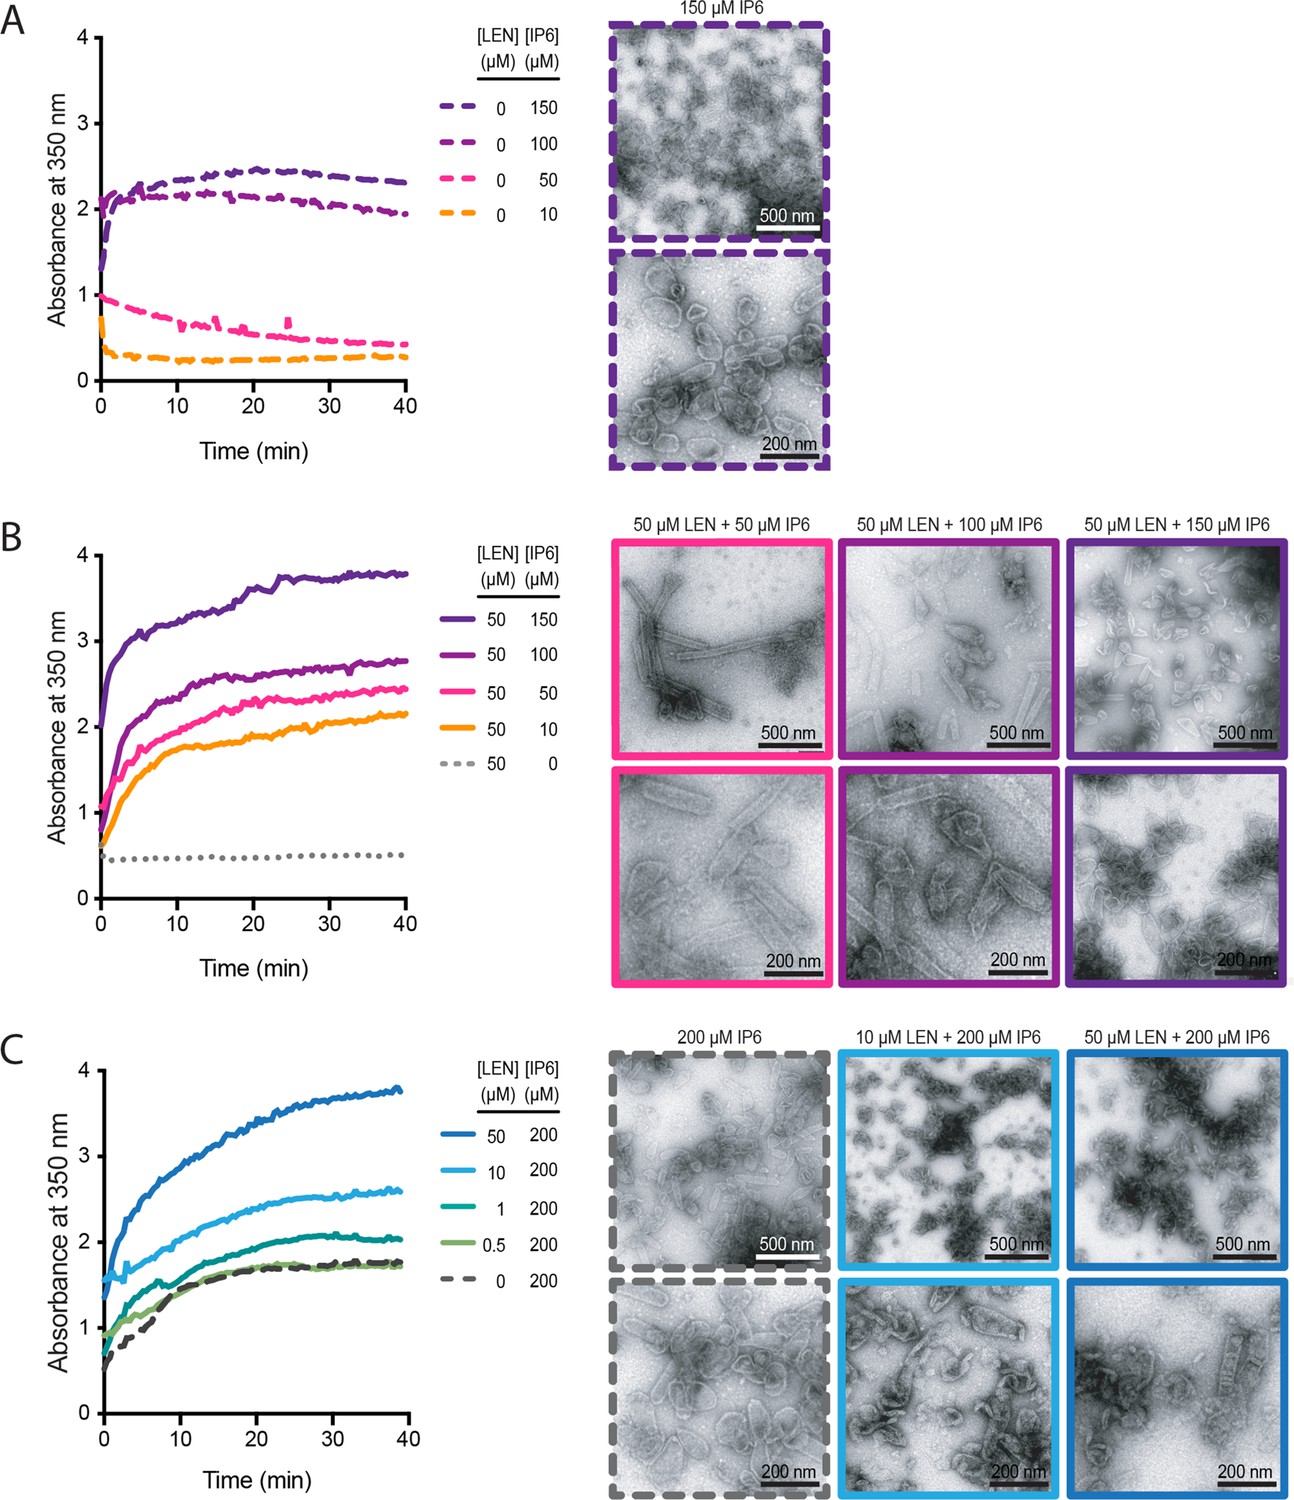
IP6 and LEN synergise to promote CA assembly.
In vitro assembly reactions of CA (75 μM) were carried out in 50 mM MES (pH 6.0) containing 1 mM DTT and monitored in real time by absorbance measurements at 350 nm. The assembly products obtained at the end of the reaction were imaged by negative staining electron microscopy. (A, B) Assembly kinetics (left) and products (right) formed at 10–150 μM IP6 in the absence (A) or the presence (B) of 50 μM LEN. (C) Assembly kinetics (left) and products (right) formed at 0–50 μM LEN in the presence of 200 μM IP6.
Figure 6—figure supplement 1
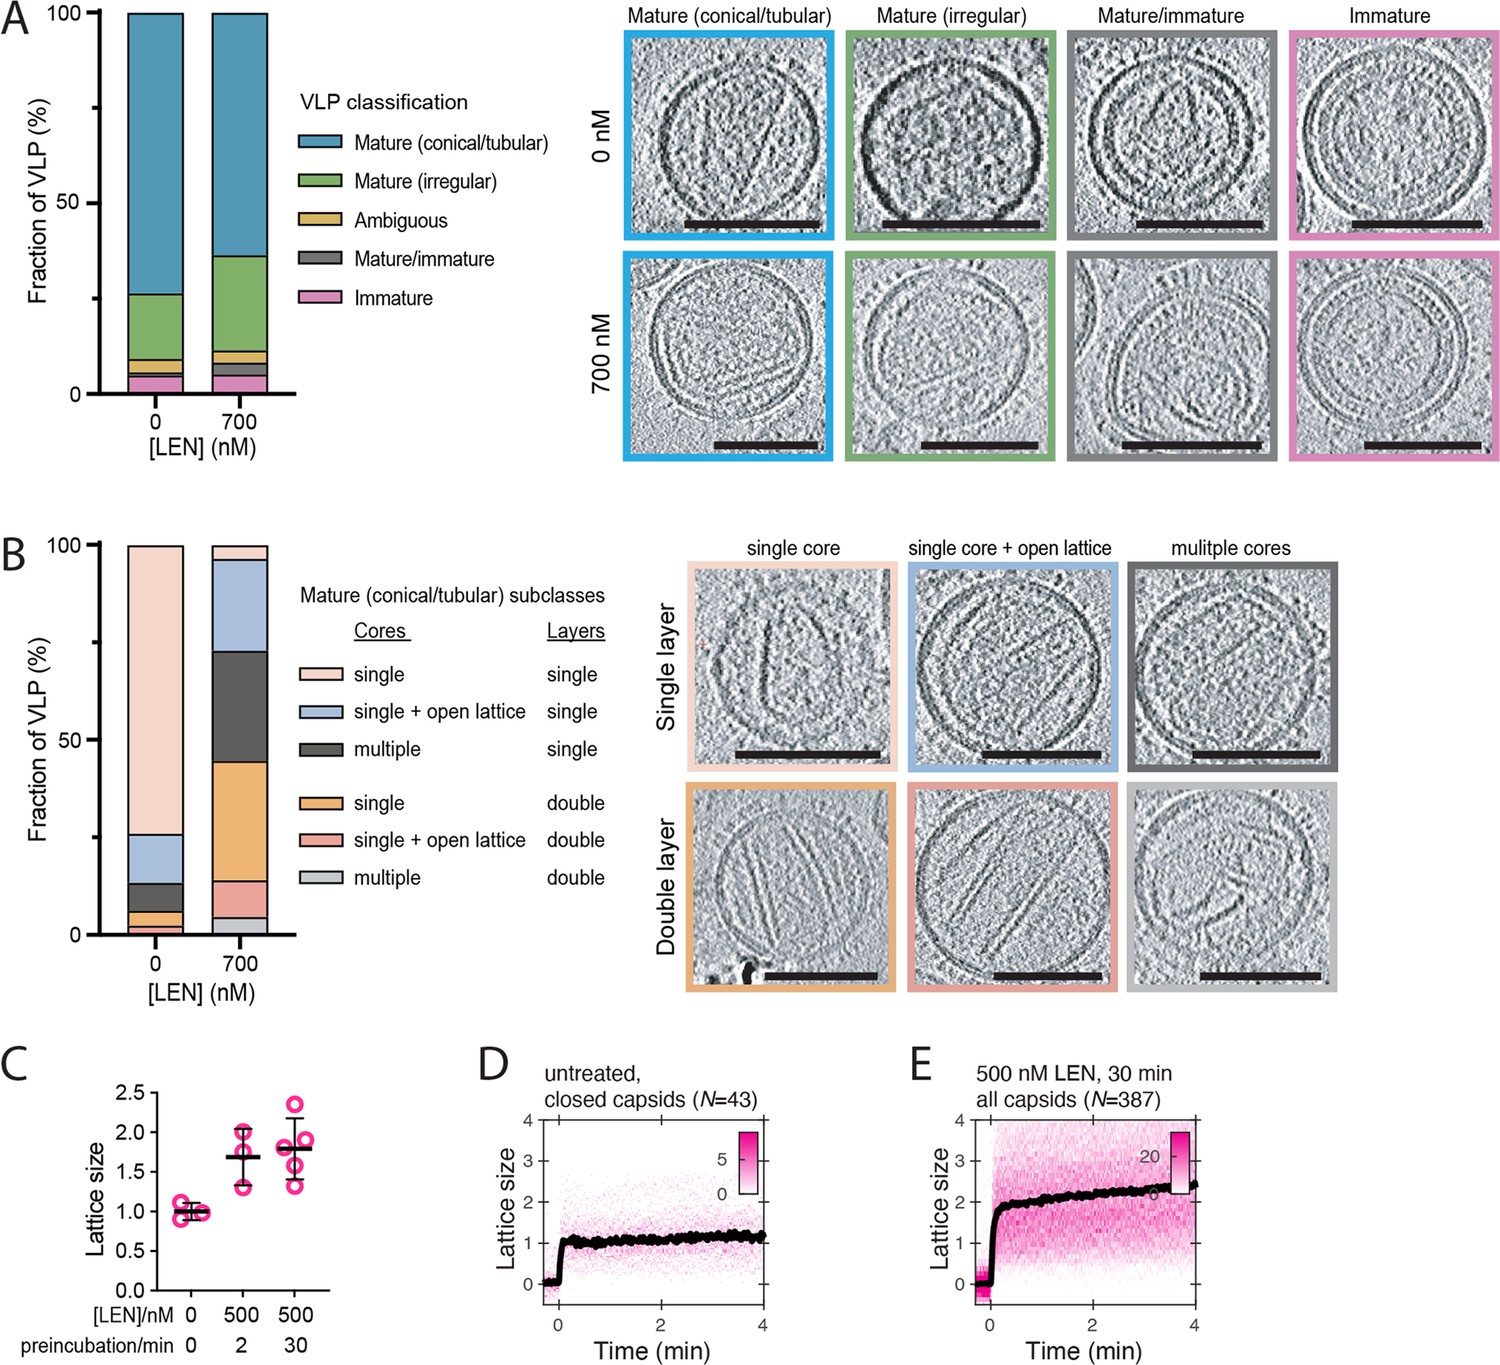
LEN promotes assembly of additional CA structures outside the capsid in mature HIV particles.
(A, B) CryoET analysis of untreated HIV and HIV incubated with 700 nM LEN for 30 min. A total of 139 untreated and 96 drug-treated viral particles were analysed, and the frequency of each phenotype is plotted as a percentage in the bar plots. Slices through representative tomograms of each phenotype are shown. Scale bars, 100 nm. (A) Virions were classified as either immature, mature/immature, ambiguous, mature (irregular) or mature (conical/tubular). (B) The mature (conical/tubular) particles from C were further divided into subclasses reflecting the number of CA assemblies per virion and the absence or presence of assemblies with two CA layers. (C) CypA paint intensity analysis to estimate the level of CA lattice assembly (‘lattice size’) in HIV particles preincubated with 500 nM LEN for 2 or 30 min before permeabilisation relative to the lattice size of closed capsids in untreated HIV particles. Comparison of lattice size in untreated control (three experiments) and HIV preincubated with 500 nM LEN for 2 min (three experiments) or 30 min (five experiments) showing that drug induces an increase in lattice size. The bold black lines represent the mean and the error bars represent the standard deviation. Example CypA paint heatmaps are shown panels D and E. (D, E) CypA paint intensity analysis to estimate the level of CA lattice assembly (‘lattice size’) in HIV particles preincubated with 500 nM LEN for 30 min before permeabilisation relative to the lattice size of closed capsids in untreated HIV particles. Example CypA paint heatmaps (magenta) and median traces (black) of closed capsids in untreated HIV (D) and all capsids in HIV preincubated with drug (E). The number of HIV particles (N) for each condition is specified above the corresponding heatmap.
Figure 7 with 1 supplement
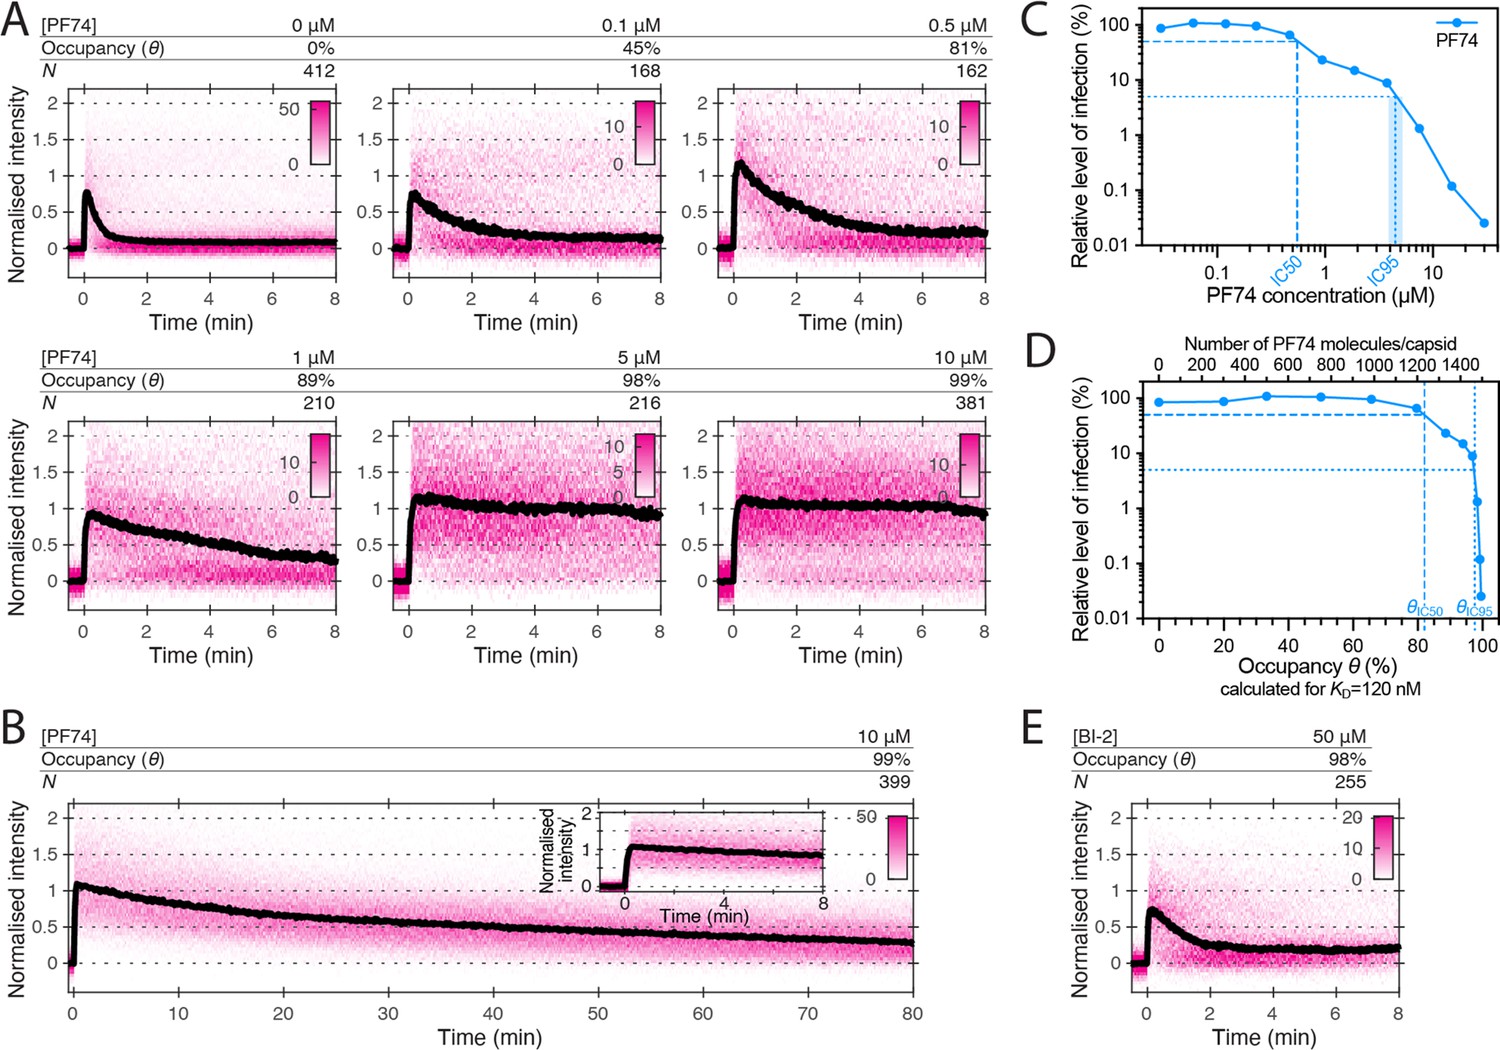
Effects of PF74 and BI-2 on CA lattice stability.
(A, B) Heatmaps (magenta) and median traces (black line) of the CypA intensity measured at particles with leaky or opening capsids in the presence of 0–10 μM PF74 showing that PF74 stabilises the CA lattice in a concentration-dependent manner. (A) PF74 titration in 8 min experiments. (B) 10 μM PF74 in an 80 min experiment showing that capsid lattices disassemble over this time period. The inset shows the first 8 min of the trace. (C) Dose-response curve of Jurkat cells infected with VSV-G-pseudotyped GFP-encoding virus in the presence of the indicated concentrations of PF74. The number of infected cells was determined by flow cytometry 48 hr post infection. Data points represent percent infectivity relative to the vehicle control. The dashed line indicates the IC50 determined from least squares fits of the curve (~0.6 μM, corresponding to ~5×KD). The dotted line indicates the IC95 (4–5 μM, corresponding to 30–40×KD). (D) Relative infection (same data as in C) plotted as a function of occupancy (θ) of the FG binding pockets on the capsid calculated for each PF74 concentration assuming a KD of 120 nM. (E) Heatmap (magenta) and median trace (black line) of the CypA intensity at particles with leaky or opening capsids in the presence of 50 μM BI-2 showing that BI-2 does not prevent CA lattice disassembly.
Figure 7—figure supplement 1
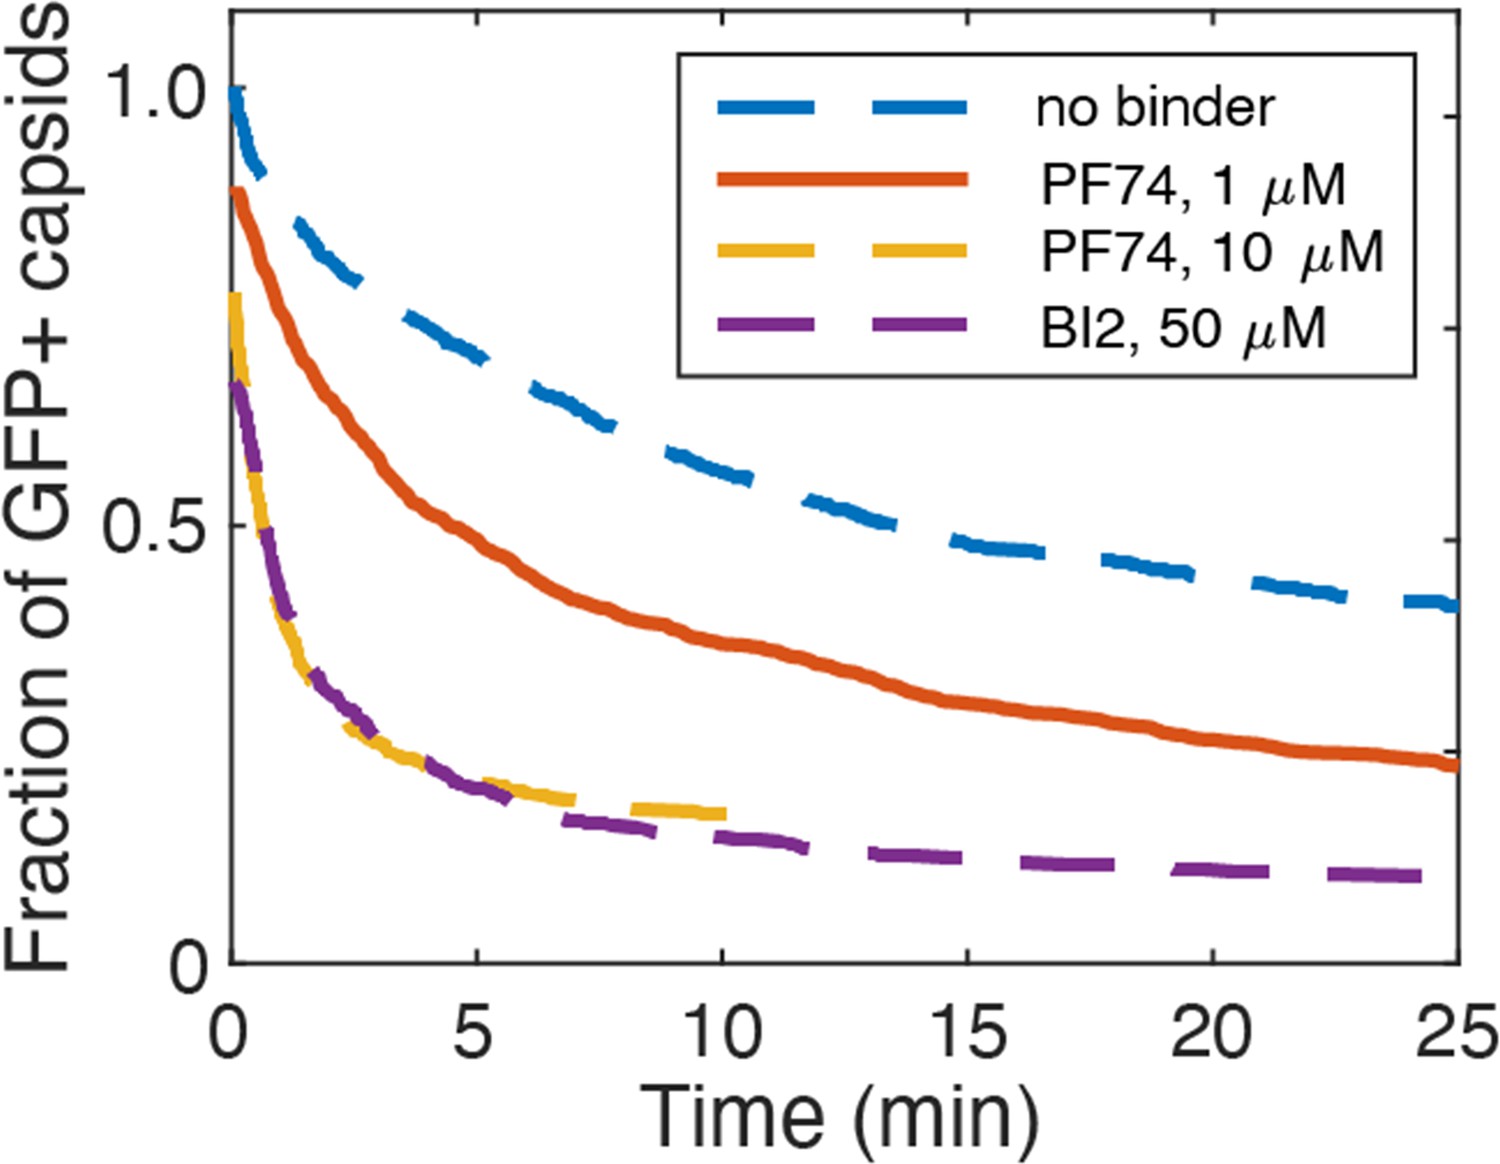
PF74 and BI-2 binding at high occupancy leads to capsid rupture.
Capsid survival curves were determined from GFP release traces. The control curve (no binder) and the curves determined in the presence of 10 µM PF74 and 50 µM BI-2 are reproduced from Márquez et al., 2018.
Figure 8 with 1 supplement
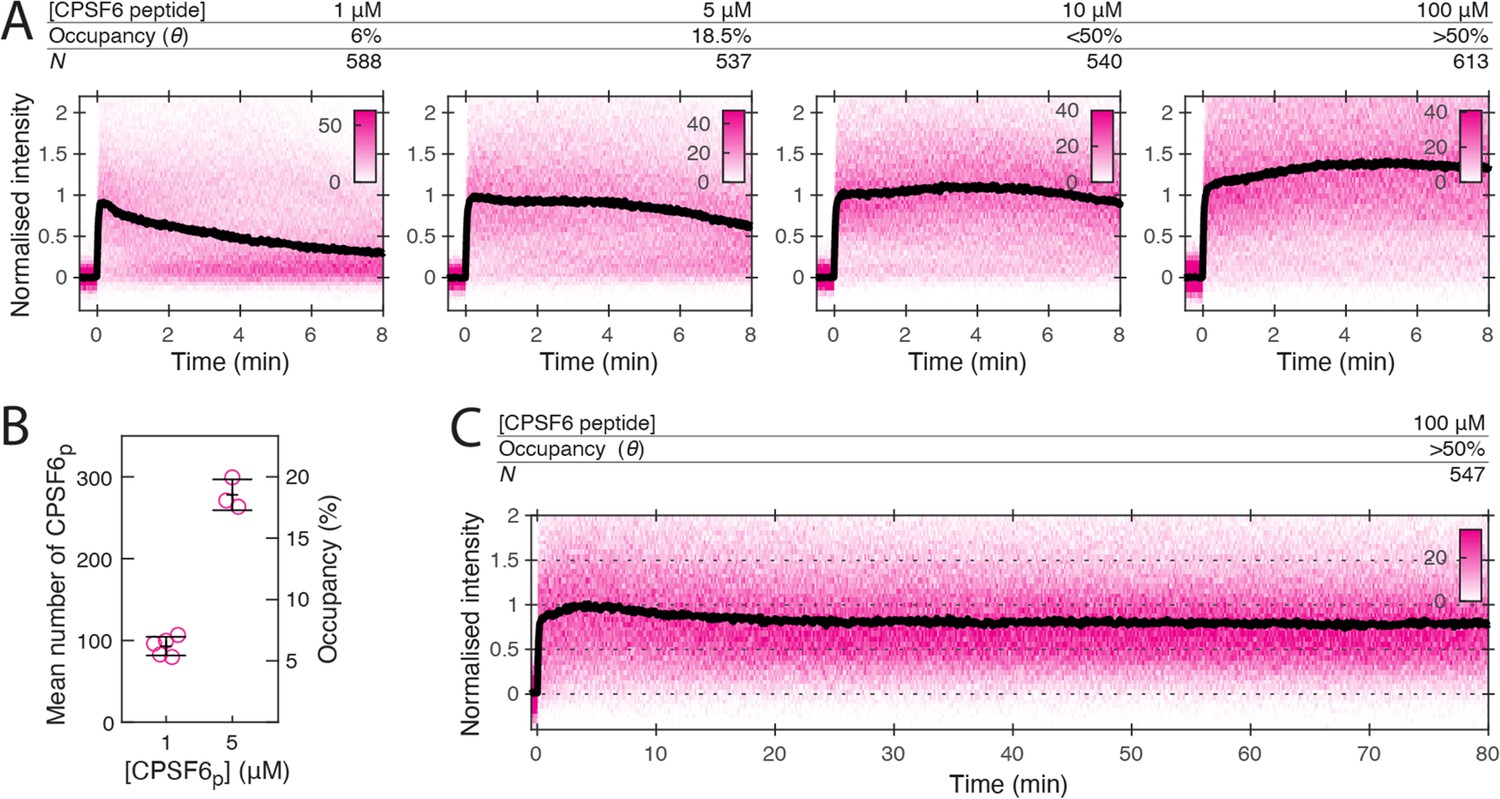
CPSF6 peptide stabilises the CA lattice at low occupancy.
(A) Heatmaps (magenta) and median traces (black line) of the CypA intensity measured at particles with leaky capsids in the presence of 1–100 μM CPSF6p showing that the peptide stabilises the CA lattice at concentrations below the KD of the peptide-CA hexamer interaction. The occupancy (θ) at 1 µM and 5 µM was determined experimentally (see B) while θ was estimated for higher concentratrions assuming a KD of 50 µM. (B) Mean number of CPSF6p bound per capsid determined from CPSF6p-AF568 binding experiments. Each symbol represents an independent binding experiment, black bars indicate mean and standard deviation. (C) Heatmap (magenta) and median trace (black line) of the CypA intensity at particles with leaky or opening capsids in the presence of 100 μM CPSF6p monitored over 80 min, showing long-term stabilisation of the CA lattice.
Figure 8—figure supplement 1
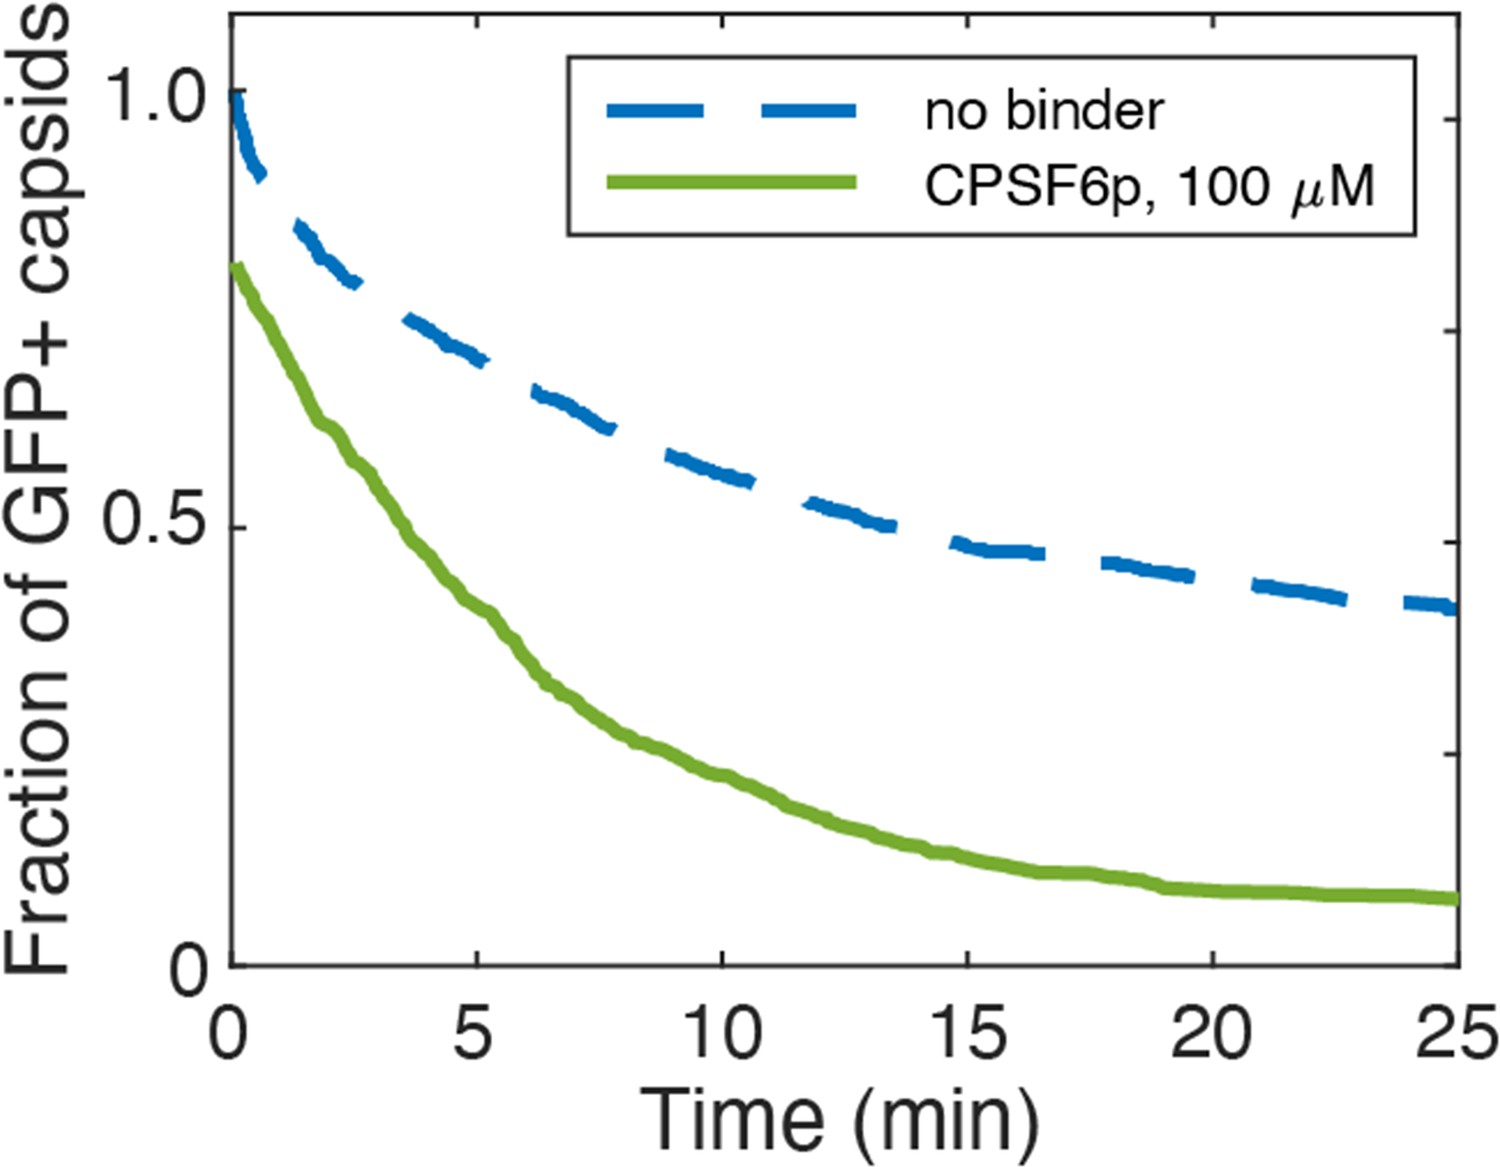
Effect of CPSF6p on capsid opening.
Capsid survival curves were determined from GFP release traces. The control curve (no binder) is reproduced from Márquez et al., 2018.
Tables
Key resources table
| Reagent type (species) or resource | Designation | Source or reference | Identifiers | Additional information |
|---|---|---|---|---|
| Cell line (human) | HEK293T | ATCC | ATTC:CRL-3216 | |
| Cell line (human) | Jurkat, Clone E6-1 | ATCC | ATTC:TIB-152 | |
| Recombinant DNA reagent | pNL4.3-iGFP-ΔEnv | DOI: 10.1371/journal.ppat.1002762 | ||
| Recombinant DNA reagent | psPAX2 | NIH AIDS Reagent Program | NIH AIDS Reagent Program:#11348 | |
| Recombinant DNA reagent | pCRV1-GagPol | DOI: 10.1128/jvi.78.21.12058–12061.2004 | ||
| Recombinant DNA reagent | pCSGW | DOI: 10.1126/science.272.5259.263 | Transfer vector encoding GFP | |
| Recombinant DNA reagent | pMD2.G | Addgene (Trono lab) | Addgene:#12259 | Encodes VSV-G envelope protein |
| Recombinant DNA reagent | pMCSG7-DLY | DOI: 10.1128/iai.00927–12 | Plasmid for bacterial expression of recombinant desulfolysin from Desulfobulbus propionicus | |
| Sequence-based reagent | 2-LTR junction fwd | Integrated DNA Technologies | PCR primer for quantification of 2-LTR circles, 5’-GCTAACTAGGGAACCCACTGCTTAAG-3’ | |
| Sequence-based reagent | 2-LTR junction rev | Integrated DNA Technologies | PCR primer for quantification of 2-LTR circles, 5’-ACTGGTACTAGCTTGTAGCACCATCCA-3’ | |
| Sequence-based reagent | Mf374 probe | Sigma-Aldrich | 6-FAM-ACA [C]A[C]A[A]G[G][C]T-BHQ-1 | |
| Sequence-based reagent | KBrun692F | Sigma-Aldrich | PCR primer for quantification of viral DNA, 5’-CAGGACTCGGCTTGCTGAAG-3' | |
| Sequence-based reagent | KBrun797R | Sigma-Aldrich | PCR primer for quantification of viral DNA, 5’-GCACCCATCTCTCTCCTTCTAGC-3’ | |
| Peptide, recombinant protein | CPSF6p | GenScript | custom synthesised peptide, sequence: PVLFPGQPFGQPPLG | |
| Peptide,- recombinant protein | CPSF6p-Cys | GenScript | custom synthesised peptide, sequence: PVLFPGQPFGQPPLGC | |
| Chemical compound, drug | GS-6207 | MedChemExpress | MedChemExpress:HY-111964 | |
| Chemical compound, drug | PF74 | Sigma-Aldrich | Sigma-Aldrich:SML0835 | |
| Chemical compound, drug | BI-2 | Enamine | Enamine:Z1982491200 | |
| Chemical compound, drug | EZ-Link Sulfo-NHS-LC-LC-Biotin | Thermo Fisher Scientific | Thermo Fisher Scientific:21338 | |
| Software, algorithm | JIM Immobilized Microscopy analysis package | Walsh, 2021 | https://github.com/lilbutsa/JIM-Immobilized-Microscopy-Suite | |
| Other | SLO | Sigma-Aldrich | Sigma-Aldrich:S5265-25KU | Streptolysin O from Streptococcus pyogenes |
Additional files
Download links
A two-part list of links to download the article, or parts of the article, in various formats.
Downloads (link to download the article as PDF)
Open citations (links to open the citations from this article in various online reference manager services)
Cite this article (links to download the citations from this article in formats compatible with various reference manager tools)
Pharmacologic hyperstabilisation of the HIV-1 capsid lattice induces capsid failure
eLife 13:e83605.
https://doi.org/10.7554/eLife.83605


