Nuclear SUN1 stabilizes endothelial cell junctions via microtubules to regulate blood vessel formation
- Curriculum in Cell Biology and Physiology, The University of North Carolina at Chapel Hill, United States
- Department of Biology, The University of North Carolina at Chapel Hill, United States
- Department of Molecular Biomedical Sciences, College of Veterinary Medicine, North Carolina State University, United States
- Department of Pathology, The University of North Carolina at Chapel Hill, United States
- McAllister Heart Institute, The University of North Carolina at Chapel Hill, United States
Figures
Figure 1 with 1 supplement
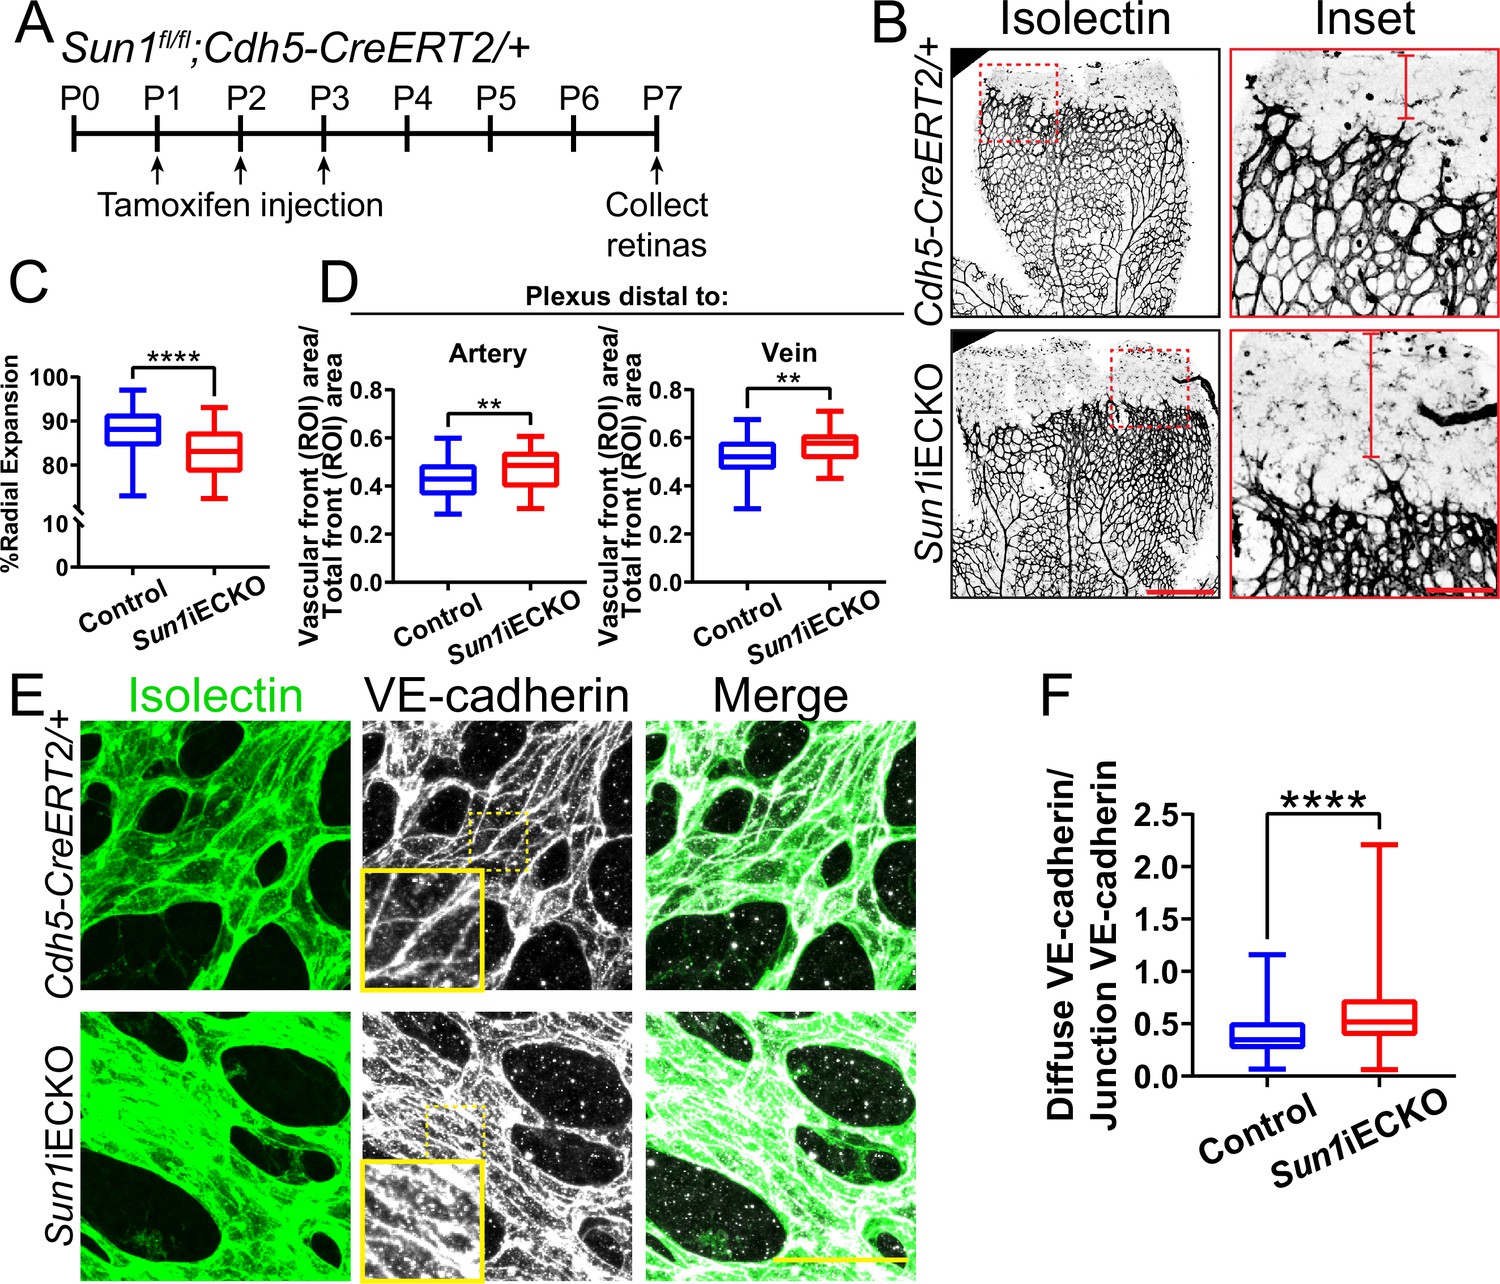
The nuclear LINC protein SUN1 regulates vascular development.
(A) Schematic of tamoxifen-induced excision of exon 4 of Sun1 in pups from cross of Sun1fl/fl × Sun1fl/+;Cdh5-CreERT2 mice. (B) Representative images of postnatal day (P)7 mouse retinas of indicated genotypes, stained for IB4 (isolectin). Scale bar, 500 µm. Inset shows vascular plexus ahead of vein. Red line shows expansion of vascular front. Scale bar inset, 150 µm. (C) Quantification of vessel network radial expansion in (B). n=186 ROIs from 44 retinas (controls) and 63 ROIs from 16 retinas (Sun1iECKO) from six independent litters. ****, p<0.0001 by Student’s two-tailed unpaired t-test. (D) Quantification of vascular density ahead of either arteries or veins. n=87 ROIs (controls, artery), 38 ROIs (Sun1iECKO, artery), 84 ROIs (controls, vein), and 37 ROIs (Sun1iECKO, vein) from 27 retinas (controls) and 12 retinas (Sun1iECKO) from three independent litters. **, p<0.01 by Student’s two-tailed unpaired t-test. (E) Representative images of IB4 (isolectin) (green, vessels) and VE-cadherin (white, junctions) staining in P7 retinas of indicated genotypes. Scale bar, 50 µm. (F) Quantification of disorganized VE-cadherin as shown in (E). n=160 junctions (10 retinas, controls) and 160 junctions (10 retinas, Sun1iECKO). ****, p<0.0001 by Student’s two-tailed unpaired t-test. For all graphs, boxes represent the upper quartile, lower quartile, and median; whiskers represent the minimum and maximum values.
Figure 1—figure supplement 1
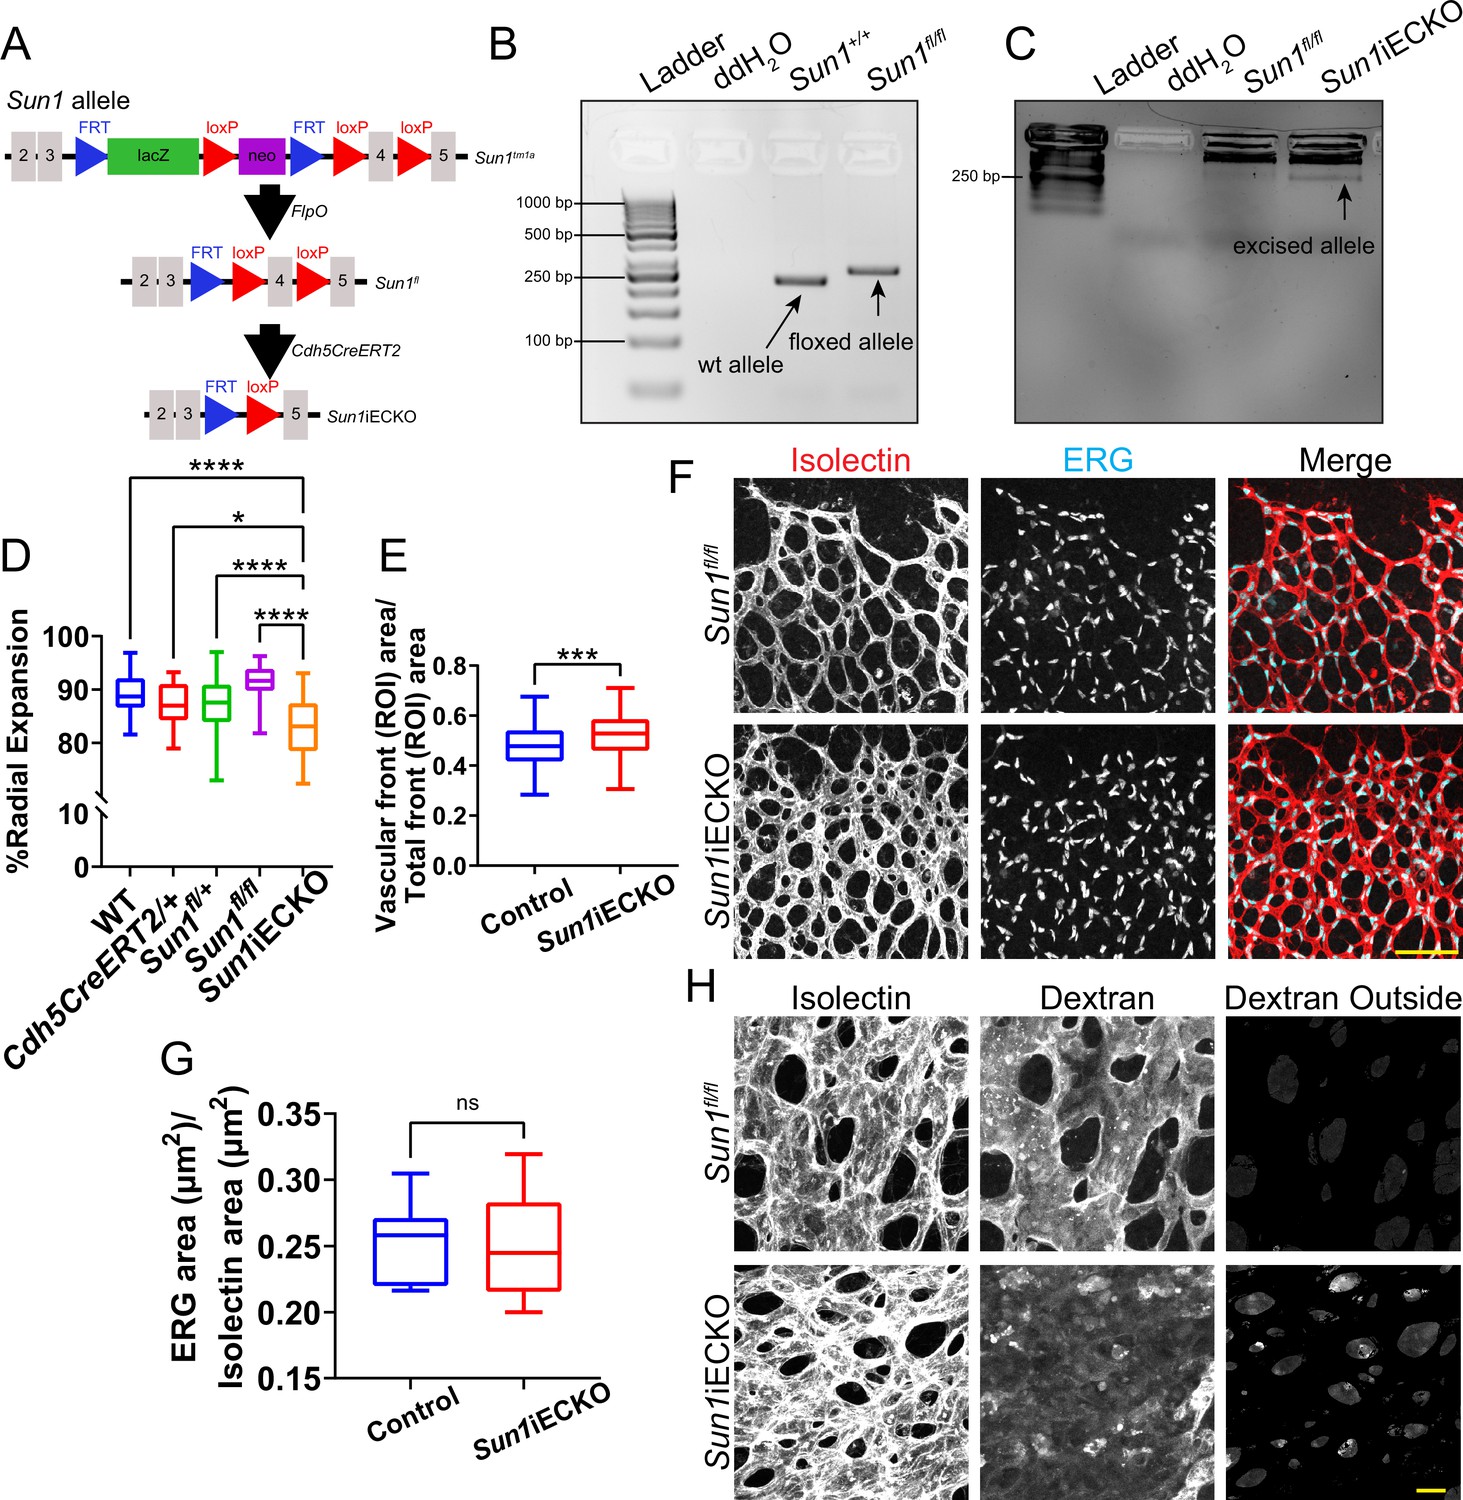
Loss of Sun1 in the postnatal retina leads to altered sprouting and junction integrity.
(A) Schematic showing strategy for generation of the Sun1 floxed allele and subsequent Cre-mediated excision of exon 4 of the Sun1 allele. (B) Agarose ethidium bromide gel showing PCR bands specific for WT or Sun1fl allele. (C) Agarose ethidium bromide gel showing PCR band specific for the excised Sun1 allele from mouse lung tissue. (D) Graph of radial expansion from Figure 1C with genotypes broken out. *, p<0.05; ****, p<0.0001 by one-way ANOVA with Tukey’s multiple comparisons test. (E) Graph of vascular density of combined ROIs from Figure 1D. n=171 ROIs from 27 retinas (controls) and 75 ROIs from 12 retinas (Sun1iECKO) from three independent litters. ***, p<0.001 by Student’s two-tailed unpaired t-test. (F) Representative images showing nuclear shape and density in postnatal day (P)7 mouse retinas with indicated genotypes. Retinas were stained with IB4 (isolectin) (red, vessels) and ERG (cyan, nuclei). Scale bar, 100 µm. (G) Quantification of ERG area relative to isolectin area as shown in (F). n=14 ROIs from four retinas (controls) and 14 ROIs from four retinas (Sun1iECKO) from two independent litters. ns, not significant by Student’s two-tailed unpaired t-test. (H) Representative images showing dextran labeling within P7 mouse retinas with indicated genotypes. Scale bar, 20 µm. For all graphs, boxes represent the upper quartile, lower quartile, and median; whiskers represent the minimum and maximum values.
-
Figure 1—figure supplement 1—source data 1
Agarose ethidium bromide gel showing PCR bands specific for WT or Sun1fl allele (left) or PCR band for the presence of the Cdh5-CreERT2 allele (right).
DNA was extracted from mouse tail cuts.
- https://cdn.elifesciences.org/articles/83652/elife-83652-fig1-figsupp1-data1-v1.zip
-
Figure 1—figure supplement 1—source data 2
Agarose ethidium bromide gel showing PCR band specific for the excised Sun1 allele.
DNA was extracted from mouse lung tissue.
- https://cdn.elifesciences.org/articles/83652/elife-83652-fig1-figsupp1-data2-v1.zip
Figure 2 with 1 supplement
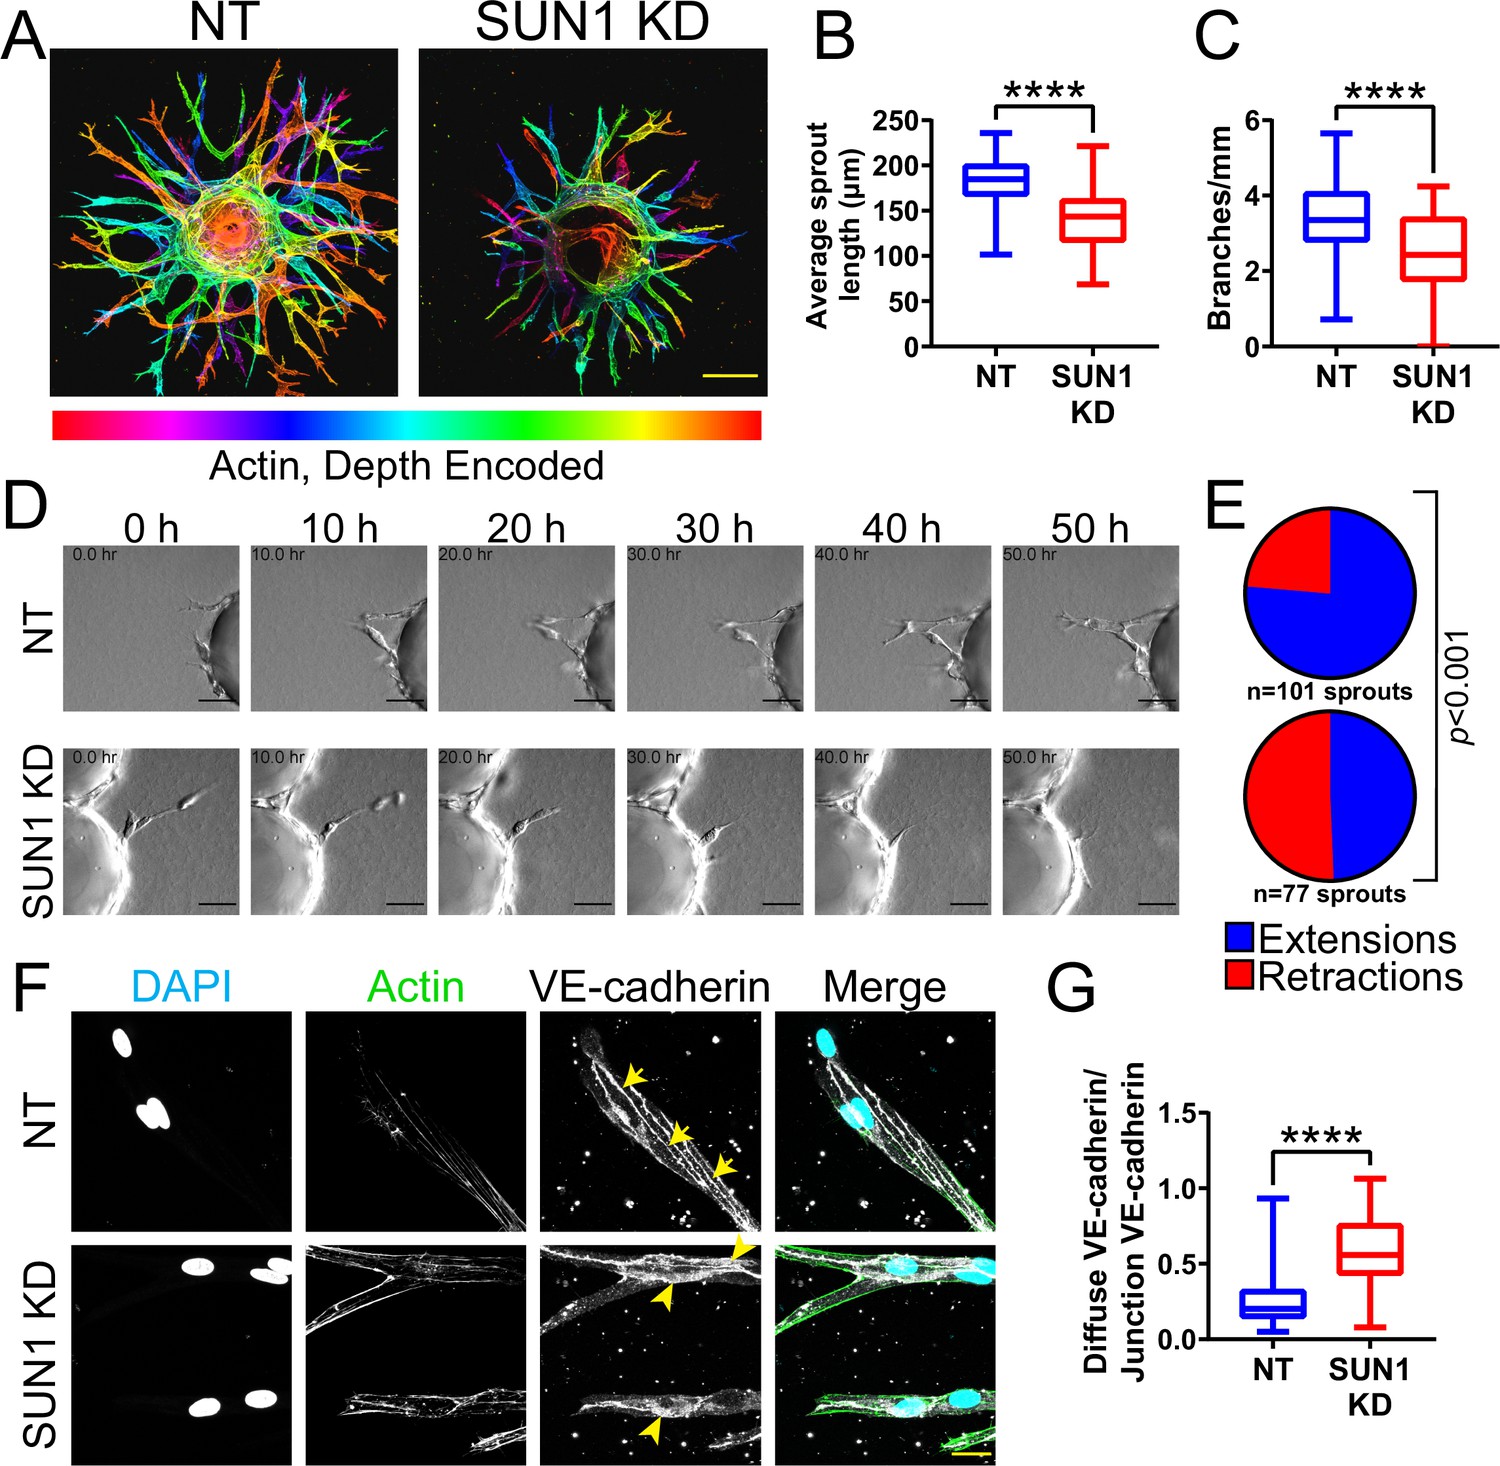
Nuclear SUN1 is required for sprouting angiogenesis.
(A) Representative images of human umbilical vein endothelial cells (HUVEC) with indicated siRNAs in 3D angiogenic sprouting assay. Sprouts were stained for Phalloidin (actin) and then depth encoded such that cooler colors are further in the Z-plane and warmer colors are closer in the Z-plane. Scale bar, 100 µm. (B) Quantification of average sprout length of 3D angiogenic sprouts shown in (A). n=42 beads (non-targeting [NT]) and 43 beads (SUN1 knockdown [KD]) compiled from five replicates. ****, p<0.0001 by Student’s two-tailed unpaired t-test. (C) Quantification of branches/mm of 3D angiogenic sprouts shown in (A). n=41 beads (NT) and 43 beads (SUN1 KD) compiled from five replicates. ****, p<0.0001 by Student’s two-tailed unpaired t-test. (D) Stills from Video 1 and Video 2 showing sprouting dynamics of HUVEC with indicated siRNAs over 50 hr. Scale bar, 50 µm. (E) Quantification of HUVEC sprout extensions and retractions shown in (D). n=101 sprouts (NT) and 77 sprouts (SUN1 KD) compiled from three replicates. p<0.001 by χ2 analysis. (F) Representative images of HUVEC with indicated siRNAs and stained with indicated antibodies in the 3D sprouting angiogenesis assay. Endothelial cells were stained for DAPI (cyan, DNA), Phalloidin (green, actin), and VE-cadherin (white, junctions). Arrows indicate normal junctions; arrowheads indicate abnormal junctions. Scale bar, 20 µm. (G) Quantification of disorganized VE-cadherin as shown in (F). n=32 junctions (NT) and 30 junctions (SUN1 KD) compiled from two replicates. ****, p<0.0001 by Student’s two-tailed unpaired t-test. For all graphs, boxes represent the upper quartile, lower quartile, and median; whiskers represent the minimum and maximum values.
Figure 2—figure supplement 1
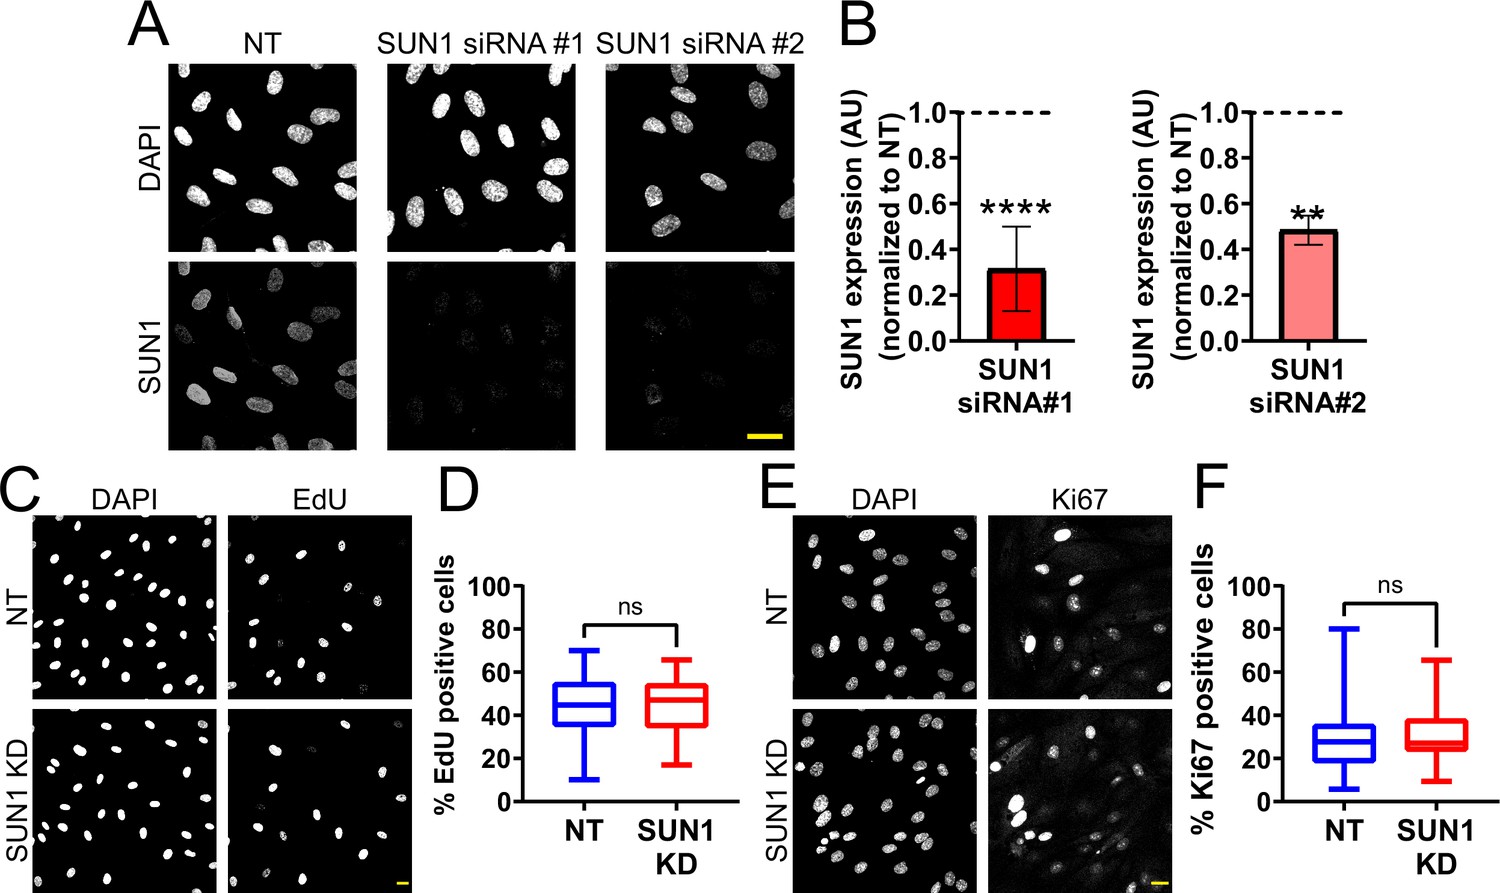
SUN1 is nuclear localized in endothelial cells and does not regulate proliferation.
(A) Representative images of human umbilical vein endothelial cells (HUVEC) with indicated siRNAs and stained with the indicated antibodies. Endothelial cells were stained for DAPI (DNA) and SUN1. Scale bar, 20 µm. (B) Quantification of SUN1 expression shown in (A). Expression is normalized to non-targeting (NT). n=9 replicates (SUN1 siRNA#1) and 2 replicates (SUN1 siRNA#2). **, p<0.01; ****, p<0.0001 by Student’s two-tailed unpaired t-test. (C) Representative images of HUVEC with indicated siRNAs and EdU incorporation. Endothelial cells were stained for DAPI (DNA) and EdU. Scale bar, 20 µm. (D) Quantification of percent EdU positive cells shown in (C). n=30 ROIs (NT) and 30 ROIs (SUN1 knockdown [KD]) compiled from two replicates. ns, not significant by Student’s two-tailed unpaired t-test. (E) Representative images of HUVEC with indicated siRNAs and Ki67 staining. Endothelial cells were stained for DAPI (DNA) and Ki67. Scale bar, 20 µm. (F) Quantification of percent Ki67 positive cells shown in (E). n=24 ROIs (NT) and 15 ROIs (SUN1 KD) compiled from three replicates. ns, not significant by Student’s two-tailed unpaired t-test. For B, error bars represent standard deviation. For D and F, boxes represent the upper quartile, lower quartile, and median; whiskers represent the minimum and maximum values.
Figure 3
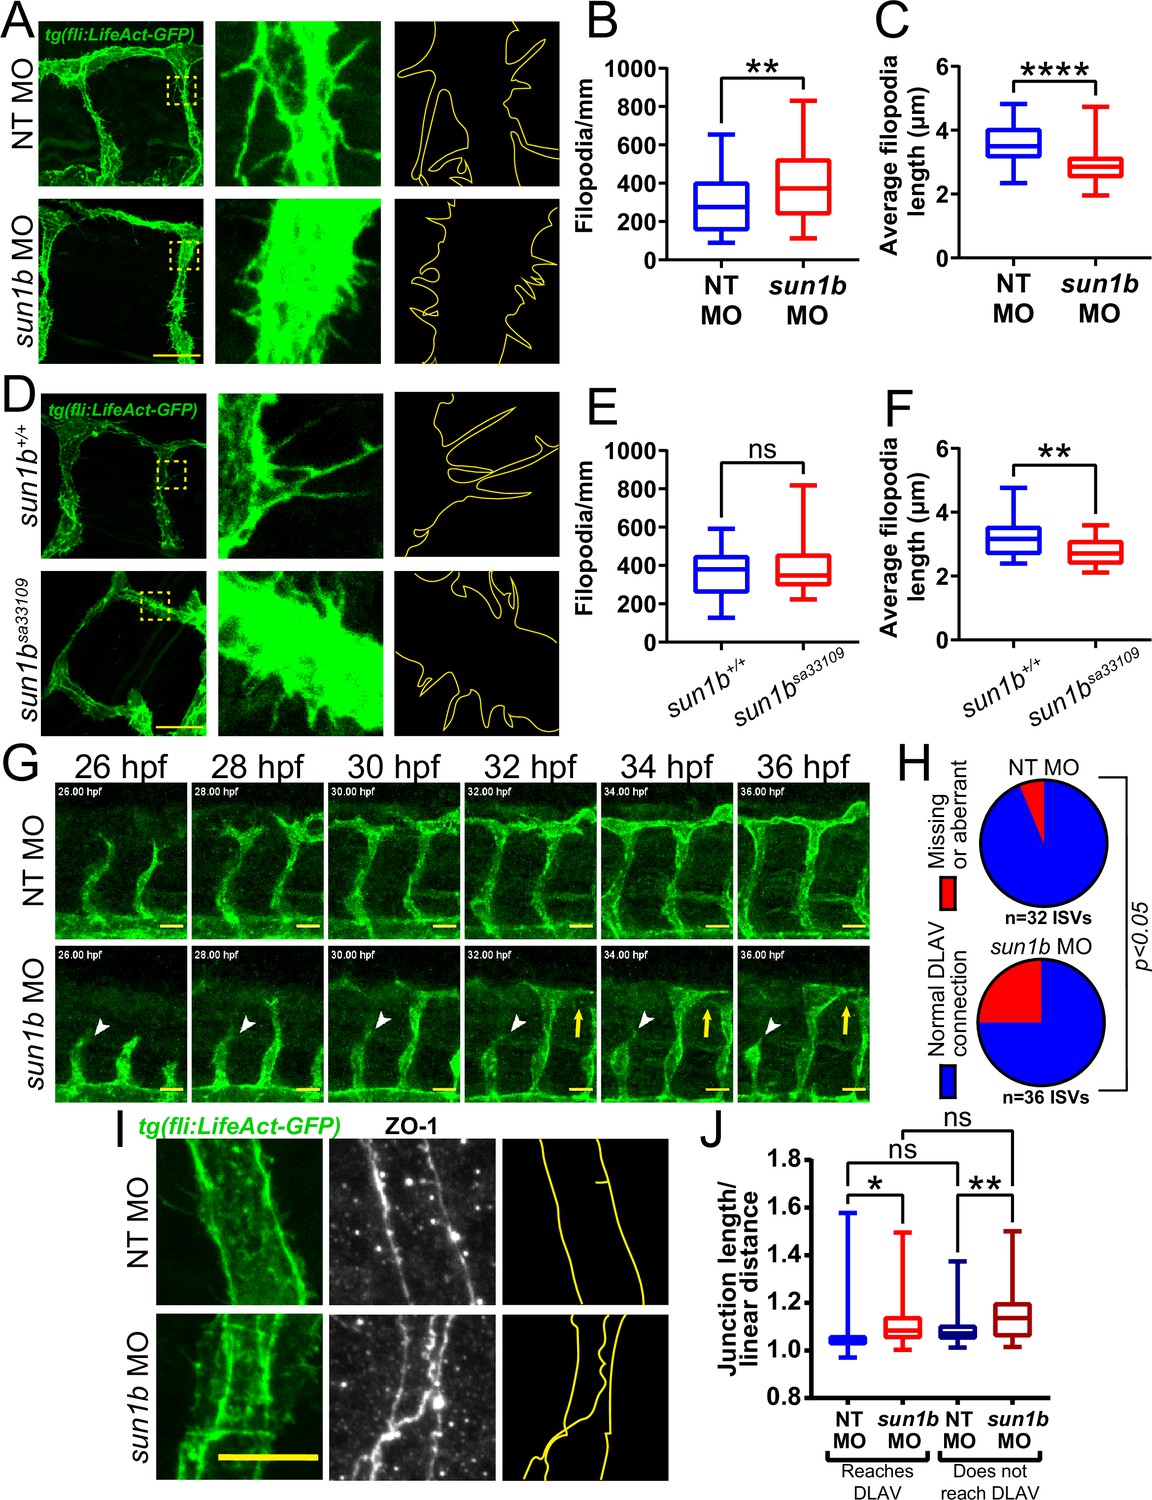
SUN1 regulates actin dynamics and angiogenic sprout extension in vivo.
(A) Representative images of zebrafish embryos at 34 hpf (hours post fertilization) with indicated morpholino treatments; anterior to left. Tg(fli:LifeAct-GFP) (green, vessels). Insets show inter-segmental vessels (ISVs) with filopodia, outlines highlighted to show filopodia. Scale bar, 20 µm. (B) Quantification of filopodia number shown in (A). n=39 ROIs (15 fish, non-targeting [NT] morpholino [MO]) and 56 ROIs (20 fish, sun1b MO) compiled from three replicates. **, p<0.01 by Student’s two-tailed unpaired t-test. (C) Quantification of average filopodia length shown in (A). n=39 ROIs (15 fish, NT MO) and 56 ROIs (20 fish, sun1b MO) compiled from three replicates. ****, p<0.0001 by Student’s two-tailed unpaired t-test. (D) Representative images of zebrafish embryos at 34 hpf with indicated genotypes; anterior to left. Tg(fli:LifeAct-GFP) (green, vessels). Insets show ISVs with filopodia, outlines highlighted to show filopodia. Scale bar, 20 µm. (E) Quantification of filopodia number shown in (D). n=27 ROIs (9 fish, sun1b+/+) and 30 ROIs (10 fish, sun1b sa33109) compiled from two replicates. ns, not significant by Student’s two-tailed unpaired t-test. (F) Quantification of average filopodia length shown in (D). n=27 ROIs (9 fish, sun1b +/+) and 30 ROIs (10 fish, sun1b sa33109) compiled from two replicates. **, p<0.01 by Student’s two-tailed unpaired t-test. (G) Stills from Video 3 and Video 4 showing ISV sprouting from 26 to 36 hpf in zebrafish embryos with indicated morpholino treatment; anterior to left. Tg(fli:LifeAct-GFP) (green, vessels). White arrowhead points to ISV that does not extend or connect to dorsal longitudinal anastomotic vessel (DLAV). Yellow arrow points to ISV that extends but does not connect to DLAV. Scale bar, 20 µm. (H) Quantification of ISV connection to DLAV shown in (G). n=32 ISVs (6 fish, NT MO) and 36 ISVs (6 fish, sun1b MO) compiled from two replicates. p<0.05 by χ2 analysis. (I) Representative images of zebrafish embryos at 34 hpf with indicated morpholino treatments; anterior to left. Tg(fli:LifeAct-GFP) (green, vessels); ZO-1 (white junctions). Outlines highlighted to show junction shapes. Scale bar, 10 µm. (J) Quantification of junction morphology shown in (I). n=80 junctions that reach DLAV and 68 junctions that do not reach DLAV (21 fish, NT MO) and 47 junctions that reach DLAV and 37 junctions that do not reach DLAV junctions (22 fish, sun1b MO). ns, not significant; *, p<0.05; **, p<0.01 by two-way ANOVA with Tukey’s multiple comparisons test. For all graphs, boxes represent the upper quartile, lower quartile, and median; whiskers represent the minimum and maximum values.
Figure 4 with 1 supplement
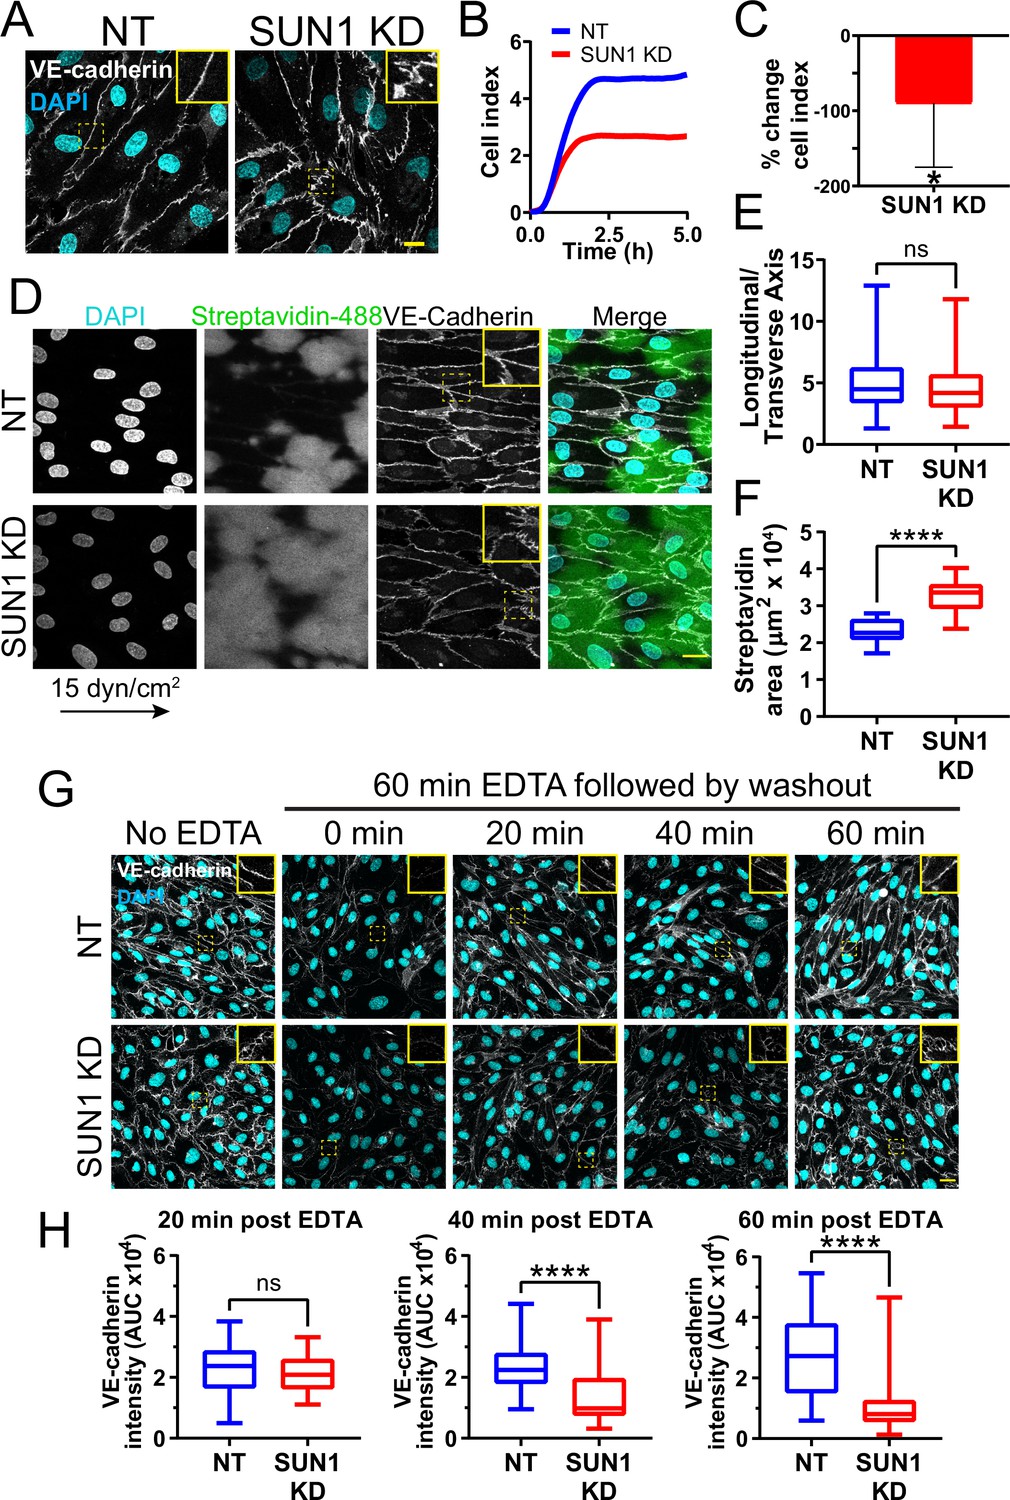
SUN1 stabilizes endothelial cell-cell junctions and regulates junction integrity.
(A) Representative images of human umbilical vein endothelial cells (HUVEC) with indicated knockdowns (KD) in monolayers. Endothelial cells were stained for DAPI (cyan, DNA) and VE-cadherin (white, junctions). Insets show junctions. Scale bar, 10 µm. (B) Representative graph of impedance measured by real time cell analysis (RTCA). (C) Quantification of % change in cell index for RTCA measured at 5 hr. Normalized to non-targeting (NT) cell index. n=5 replicates. *, p<0.05 by Student’s two-tailed unpaired t-test. (D) Representative images of HUVEC with indicated siRNAs plated on biotinylated fibronectin and exposed to 15 dyn/cm2 shear stress for 72 hr then treated with streptavidin. Endothelial cells were stained for DAPI (cyan, DNA), streptavidin (green), and VE-cadherin (white, junctions). Arrow indicates flow direction. Insets show junctions. Scale bar, 20 µm. (E) Quantification of cell alignment shown in (D). n=59 cells (NT) and 73 cells (SUN1 KD) compiled from three replicates. (F) Quantification of streptavidin area shown in (D). n=15 ROIs (NT) and 15 ROIS (SUN1 KD) compiled from three replicates. (G) Representative images of HUVEC with indicated siRNAs showing adherens following EDTA washout. Endothelial cells were stained for DAPI (cyan, DNA) and VE-cadherin (white, junctions). Insets show junctions. Scale bar, 20 µm. (H) Quantification of VE-cadherin line scans at 20, 40, and 60 min post EDTA washout in (G). 20 min: n=31 junctions (NT) and 23 junctions (SUN1 KD); 40 min: n=49 junctions (NT) and 33 junctions (SUN1 KD); 60 min: n=33 junctions (NT) and 33 junctions (SUN1 KD) compiled from three replicates. ns, not significant; ****, p<0.0001 by Student’s two-tailed unpaired t-test. For C, error bars represent standard deviation. For E, F, and H, boxes represent the upper quartile, lower quartile, and median; whiskers represent the minimum and maximum values.
Figure 4—figure supplement 1
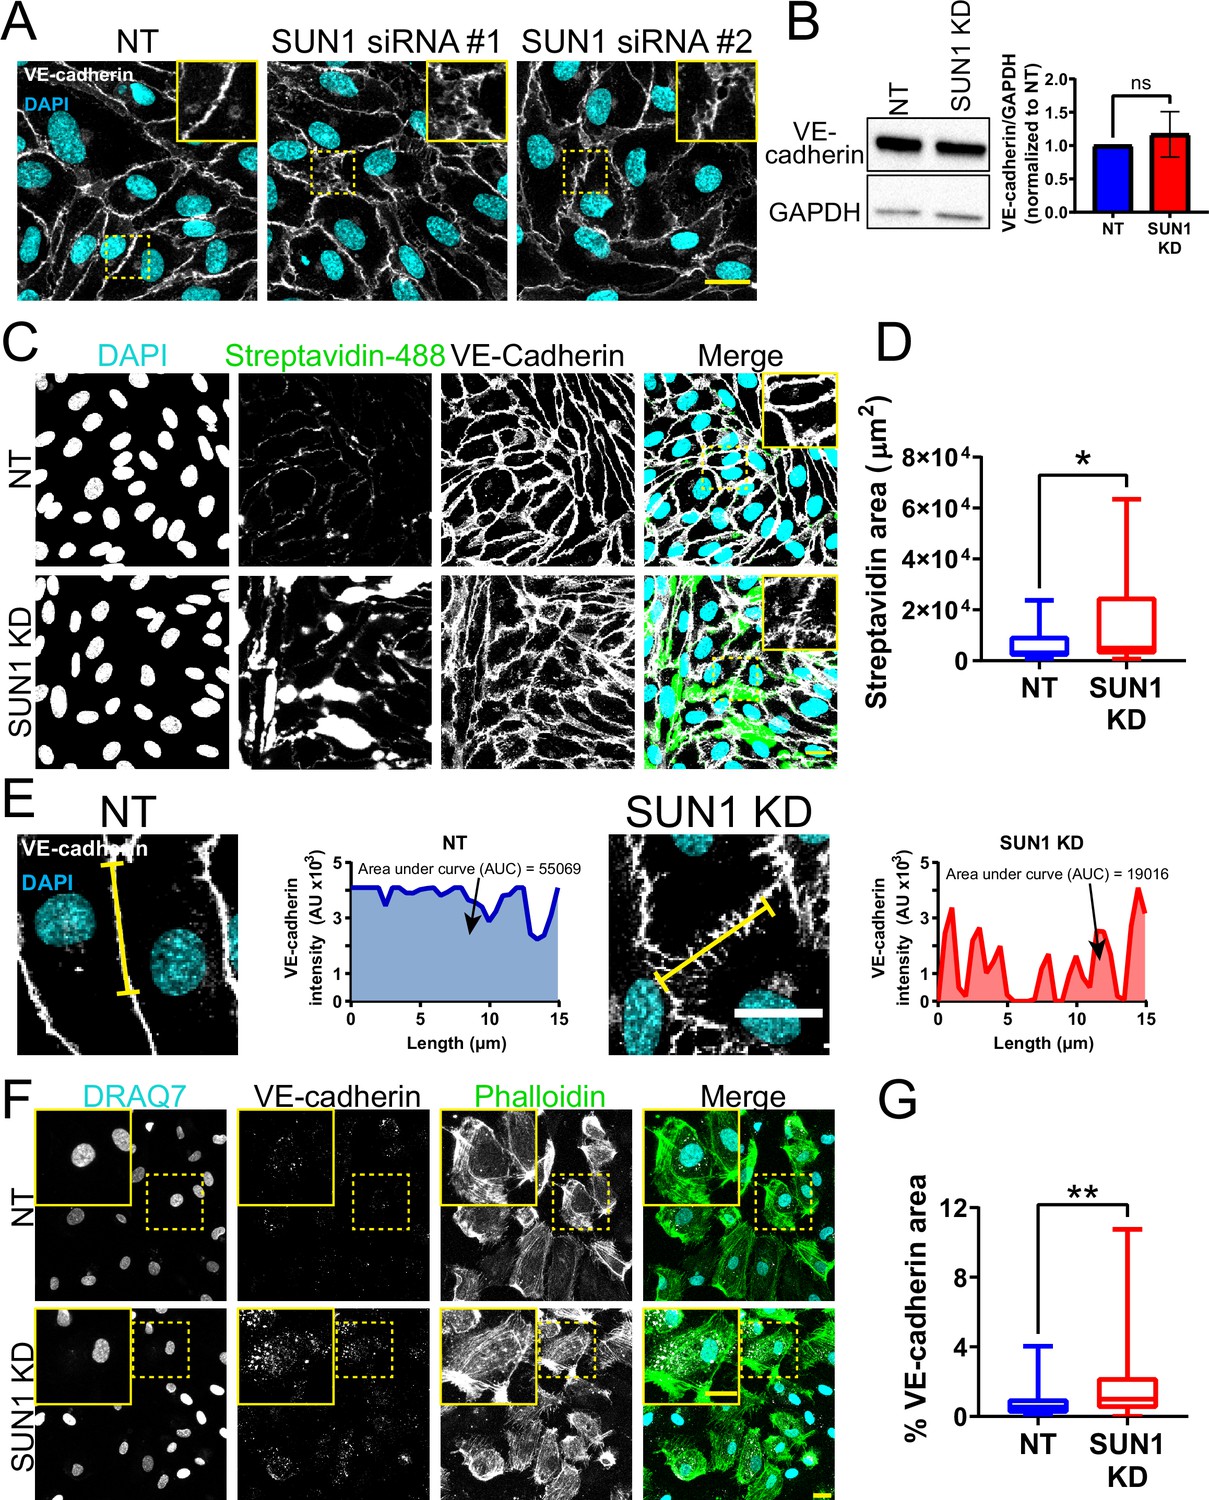
SUN1 regulates endothelial junction integrity.
(A) Representative images of human umbilical vein endothelial cells (HUVEC) with indicated siRNAs. Endothelial cells were stained for DAPI (cyan, DNA) and VE-cadherin (white, junctions). Insets show junctions. Scale bar, 20 µm. (B) Representative western blot showing levels of VE-cadherin protein in HUVEC with indicated siRNAs. GAPDH was used as a loading control. Quantification of VE-cadherin levels compiled from four replicates. ns, not significant by Student’s two-tailed t-test. (C) Representative images of HUVEC with indicated siRNAs cultured on biotinylated fibronectin and treated with streptavidin upon confluence. Endothelial cells were stained for DAPI (cyan, DNA), streptavidin (green), and VE-cadherin (white, junctions). Insets show junctions. Scale bar, 20 µm. (D) Quantification of streptavidin area shown in (C). n=29 ROIs (non-targeting [NT]) and 29 ROIs (SUN1 knockdown [KD]) compiled from four replicates. *, p<0.05 by Student’s two-tailed unpaired t-test. (E) Representative images and graphs of HUVEC with indicated siRNAs showing VE-cadherin line scan quantification. Endothelial cells were stained with DAPI (cyan, DNA) and VE-cadherin (white, junctions). Yellow line indicates where line scan was taken. Arrows point to the area under the curve (AUC). Scale bar, 20 µm. (F) Representative images of HUVEC with indicated siRNAs showing VE-cadherin staining after internalization assay. Endothelial cells were stained for DRAQ7 (cyan, DNA), VE-cadherin (white, junctions), and Phalloidin (green, actin). Scale bar, 20 µm. (G) Quantification of area of internalized VE-cadherin in (F). n=57 cells (NT) and 82 cells (SUN1 KD) compiled from three replicates. **, p<0.01 by Student’s two-tailed unpaired t-test. For B, error bars represent standard deviation. For D and G, boxes represent the upper quartile, lower quartile, and median; whiskers represent the minimum and maximum values.
-
Figure 4—figure supplement 1—source data 1
Western blot showing four experimental replicates.
Protein was extracted from human umbilical vein endothelial cells (HUVEC) with indicated siRNAs. Blot was probed for VE-cadherin (top band) and GAPDH (bottom band) as a loading control. Red box indicates lanes used for Figure 4—figure supplement 1B.
- https://cdn.elifesciences.org/articles/83652/elife-83652-fig4-figsupp1-data1-v1.zip
Figure 5 with 2 supplements

SUN1 regulates microtubule localization and dynamics in endothelial cells.
(A) Representative images of human umbilical vein endothelial cells (HUVEC) with indicated siRNAs and indicated treatments. Endothelial cells were stained for DAPI (cyan, DNA) and VE-cadherin (white, junctions). Insets show junctions. Scale bar, 20 µm. (B) Quantification of VE-cadherin line scans for treatments shown in (A). n=106 junctions (non-targeting [NT], vehicle), 101 junctions (NT, Nocodazole), 105 junctions (SUN1 knockdown [KD], vehicle), and 96 junctions (SUN1 KD, Nocodazole) compiled from three replicates. ns, not significant; ****, p<0.0001 by two-way ANOVA with Tukey’s multiple comparisons test. (C) Representative images of HUVEC with indicated siRNAs. Endothelial cells were stained for α-tubulin (cyan, microtubules) and VE-cadherin (red, junctions). Red insets show α-tubulin at the MTOC (microtubule organizing center), yellow insets show α-tubulin contacts at junctions. Arrows denote contact sites. Scale bar, 20 µm. (D) Quantification of α-tubulin area at the MTOC shown in (C). n=19 cells (NT) and 10 cells (SUN1 KD) compiled from three replicates. ns, not significant by Student’s two-tailed unpaired t-test. (E) Quantification of peripheral α-tubulin area shown in (C). n=39 cells (NT) and 46 cells (SUN1 KD) compiled from three replicates. ****, p<0.0001 by Student’s two-tailed unpaired t-test. (F) Quantification of contacts between α-tubulin and VE-cadherin shown in (C). n=75 junctions (NT) and 48 junctions (SUN1 KD) compiled from three replicates. ***, p<0.001 by Student’s two-tailed unpaired t-test. (G) Stills from Video 5 and Video 6 showing microtubule growth in EB3-mCherry labeled HUVEC. White dot indicates start of track. Yellow line indicates growth, red line indicates shrinkage. Scale bar, 10 µm. (H) Quantification of microtubule growth rate from EB3-mCherry microtubule tracking. N=120 microtubules (12 cells, NT) and 117 microtubules (12 cells, SUN1 KD) compiled from two replicates. ns, not significant by Student’s two-tailed unpaired t-test. (I) Quantification of microtubule shrink rate from EB3-mCherry microtubule tracking. n=120 microtubules (12 cells, NT) and 117 microtubules (12 cells, SUN1 KD) compiled from two replicates. **, p<0.01 by Student’s two-tailed unpaired t-test. (J) Quantification of catastrophe rate from EB3-mCherry microtubule tracking. n=120 microtubules (12 cells, NT) and 117 microtubules (12 cells, SUN1 KD) compiled from two replicates. ****, p<0.0001 by Student’s two-tailed unpaired t-test. (K) Quantification of percent of time spent shrinking from EB3-mCherry microtubule tracking. n=120 microtubules (12 cells, NT) and 117 microtubules (12 cells, SUN1 KD) compiled from two replicates. ****, p<0.0001 by Student’s two-tailed unpaired t-test. For all graphs, boxes represent the upper quartile, lower quartile, and median; whiskers represent the minimum and maximum values.
Figure 5—figure supplement 1
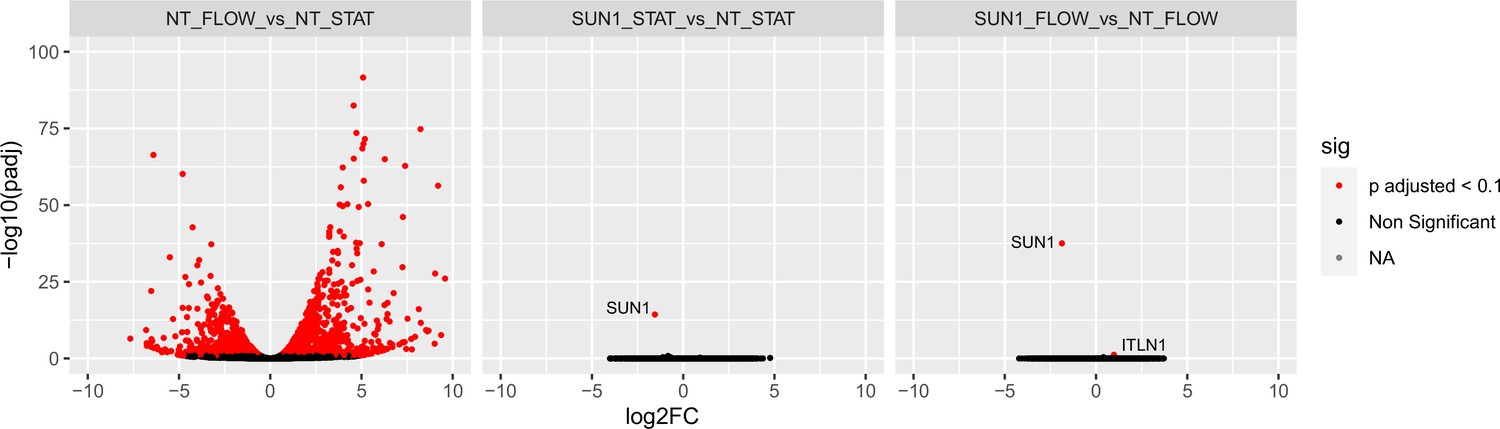
SUN1 does not affect transcription in endothelial cells.
Volcano plots showing transcriptional changes in HUVEC from bulk RNASeq data in NT (non-targeting) under flow vs. NT under static conditions (left), SUN1 KD under static vs. NT under static conditions (middle), and SUN1 KD under flow vs. NT under flow conditions (right). Differentially expressed genes were determined by DESeq2 and considered significant with an adjusted p-value <0.01. Red dots, significant genes; black dots, non-significant genes; gray dots, NA.
Figure 5—figure supplement 2
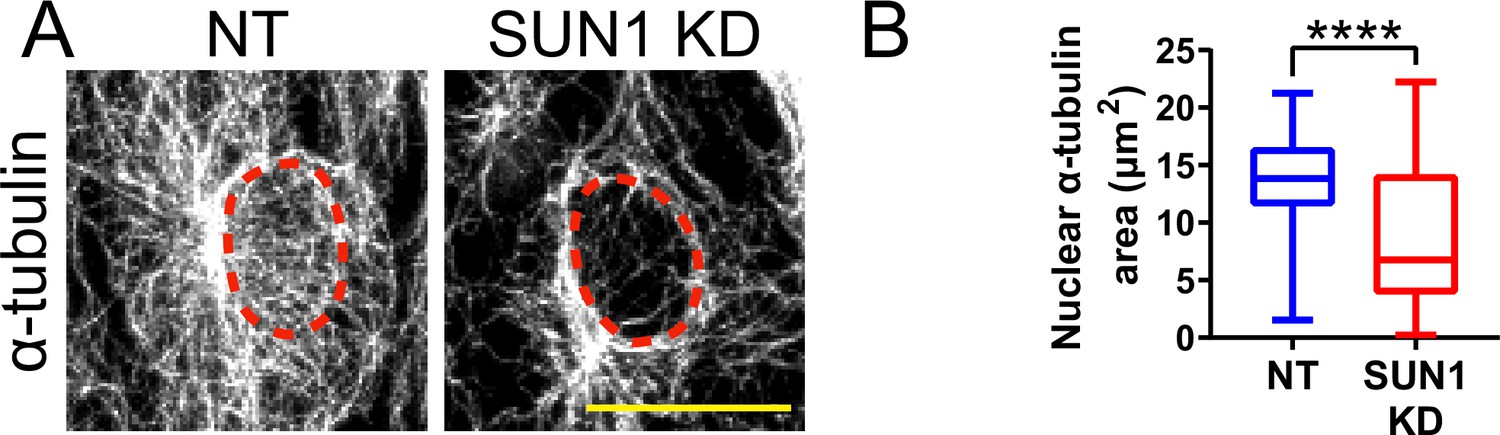
SUN1 regulates the microtubule cytoskeleton in endothelial cells.
(A) Representative images of human umbilical vein endothelial cells (HUVEC) with indicated siRNAs showing changes in microtubules at nucleus. Endothelial cells were stained for α-tubulin (white, microtubules). Red dashed line shows outline of nucleus. Scale bar, 20 µm. (B) Quantification of nuclear α-tubulin area shown in (A). n=80 cells (non-targeting [NT]) and 72 cells (SUN1 knockdown [KD]) compiled from three replicates. ****, p<0.0001 by Student’s two-tailed unpaired t-test. For B, boxes represent the upper quartile, lower quartile, and median; whiskers represent the minimum and maximum values.
Figure 6 with 3 supplements
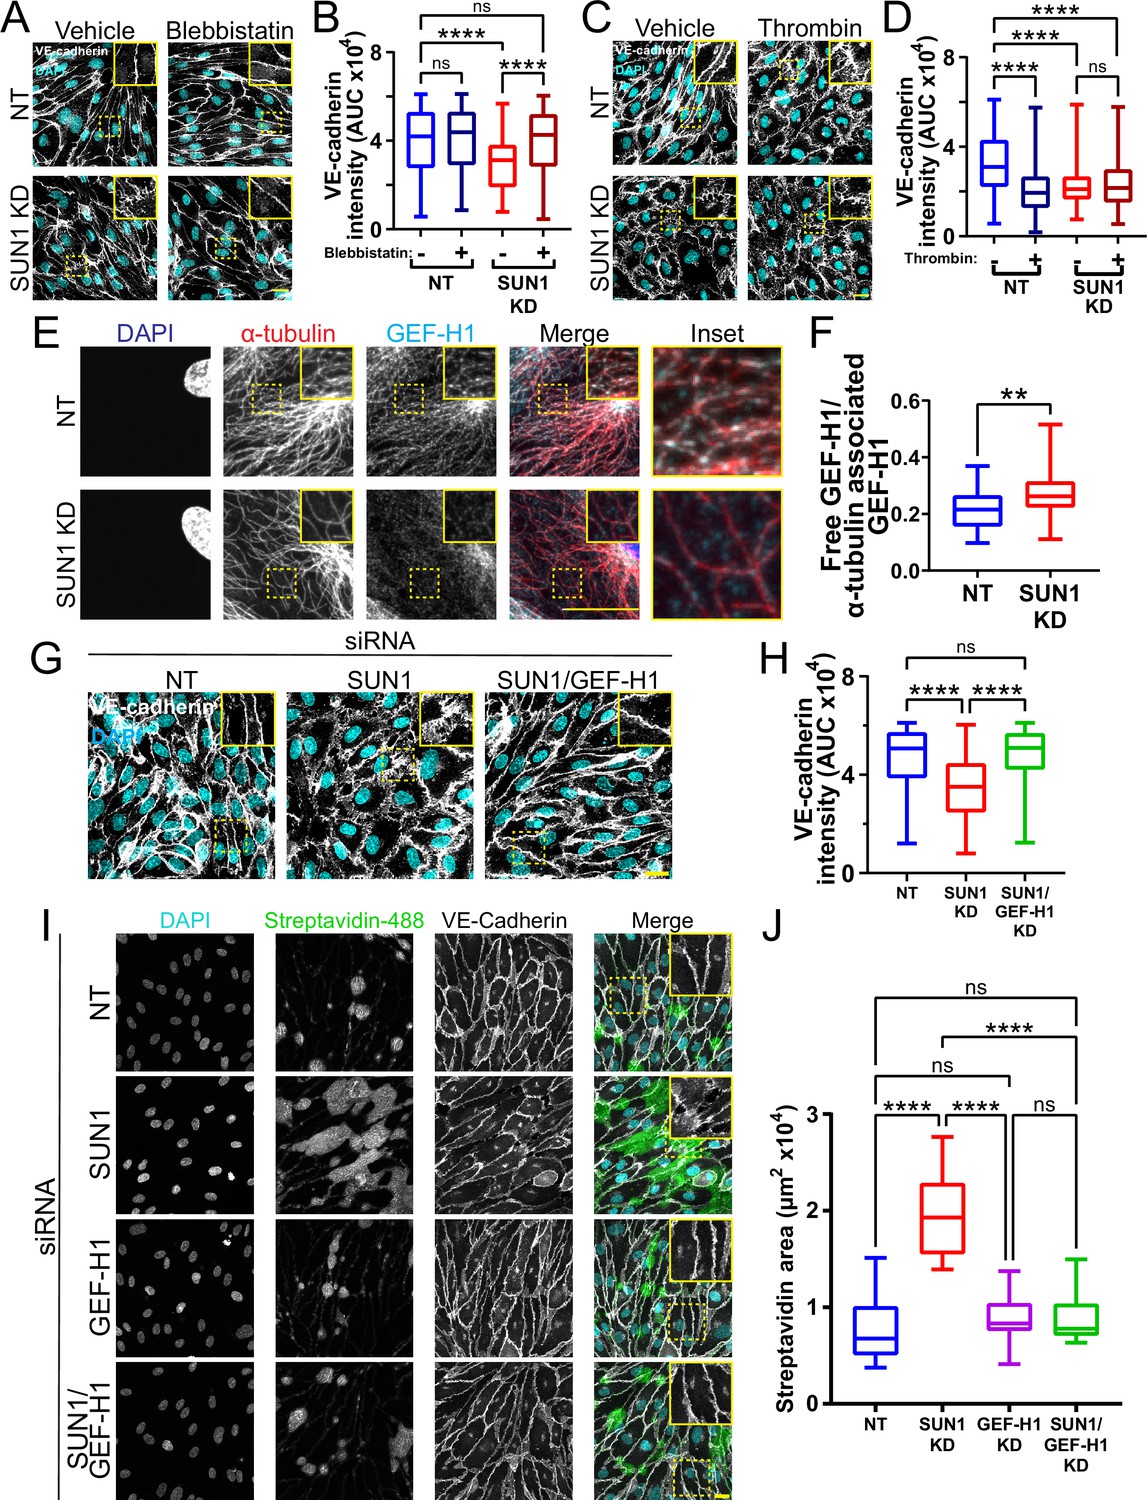
SUN1 regulates endothelial cell contractility and exerts its effects on junctions through the microtubule-associated GEF-H1.
(A) Representative images of human umbilical vein endothelial cells (HUVEC) with indicated siRNAs and indicated treatments. Endothelial cells were stained for DAPI (cyan, DNA) and VE-cadherin (white, junctions). Insets show junctions. Scale bar, 20 µm. (B) Quantification of VE-cadherin line scans for treatments shown in (A). n=159 junctions (non-targeting [NT], vehicle), 154 junctions (NT, blebbistatin), 151 junctions (SUN1 knockdown [KD], vehicle), and 149 junctions (SUN1 KD, blebbistatin) compiled from three replicates. ns, not significant; ****, p<0.0001 by two-way ANOVA with Tukey’s multiple comparisons test. (C) Representative images of HUVEC with indicated siRNAs and indicated treatments. Endothelial cells were stained for DAPI (cyan, DNA) and VE-cadherin (white, junctions). Insets show junctions. Scale bar, 20 µm. (D) Quantification of VE-cadherin line scans for treatments shown in (C). n=75 junctions (NT, vehicle), 70 junctions (NT, thrombin), 71 junctions (SUN1 KD, vehicle), and 73 junctions (SUN1 KD, thrombin) compiled from three replicates. ns, not significant; ****, p<0.0001 by two-way ANOVA with Tukey’s multiple comparisons test. (E) Representative images of HUVEC with indicated siRNAs. Endothelial cells were stained for DAPI (blue, DNA), α-tubulin (red, microtubules), and GEF-H1 (cyan). Insets show α-tubulin and GEF-H1 colocalization. Scale bar, 20 µm. (F) Quantification of free GEF-H1 normalized to α-tubulin associated GEF-H1 shown in (E). n=30 cells (NT) and 30 cells (SUN1 KD) compiled from three replicates. **, p<0.01 by Student’s two-tailed unpaired t-test. (G) Representative images of HUVEC with indicated siRNAs and indicated treatments. Endothelial cells were stained for DAPI (cyan, DNA) and VE-cadherin (white, junctions). Insets show junctions. Scale bar, 20 µm. (H) Quantification of VE-cadherin line scans from KD shown in (G). n=169 junctions (NT), 166 junctions (SUN1 KD), 170 junctions (SUN1/GEF-H1 KD) compiled from three replicates. ns, not significant; ****, p<0.0001 by one-way ANOVA with Tukey’s multiple comparisons test. (I) Representative images of HUVEC with indicated siRNAs cultured on biotinylated fibronectin and treated with streptavidin upon confluence. Endothelial cells were stained for DAPI (cyan, DNA), streptavidin (green), and VE-cadherin (white, junctions). Insets show junctions. Scale bar, 20 µm. (J) Quantification of streptavidin area shown in (I). n=15 ROIs (NT), 15 ROIs (SUN1 KD), 15 ROIs (GEF-H1 KD), and 15 ROIs (SUN1/GEF-H1 KD) compiled from three replicates. ns, not significant; ****, p<0.0001 by one-way ANOVA with Tukey’s multiple comparisons test. For all graphs, boxes represent the upper quartile, lower quartile, and median; whiskers represent the minimum and maximum values.
Figure 6—figure supplement 1
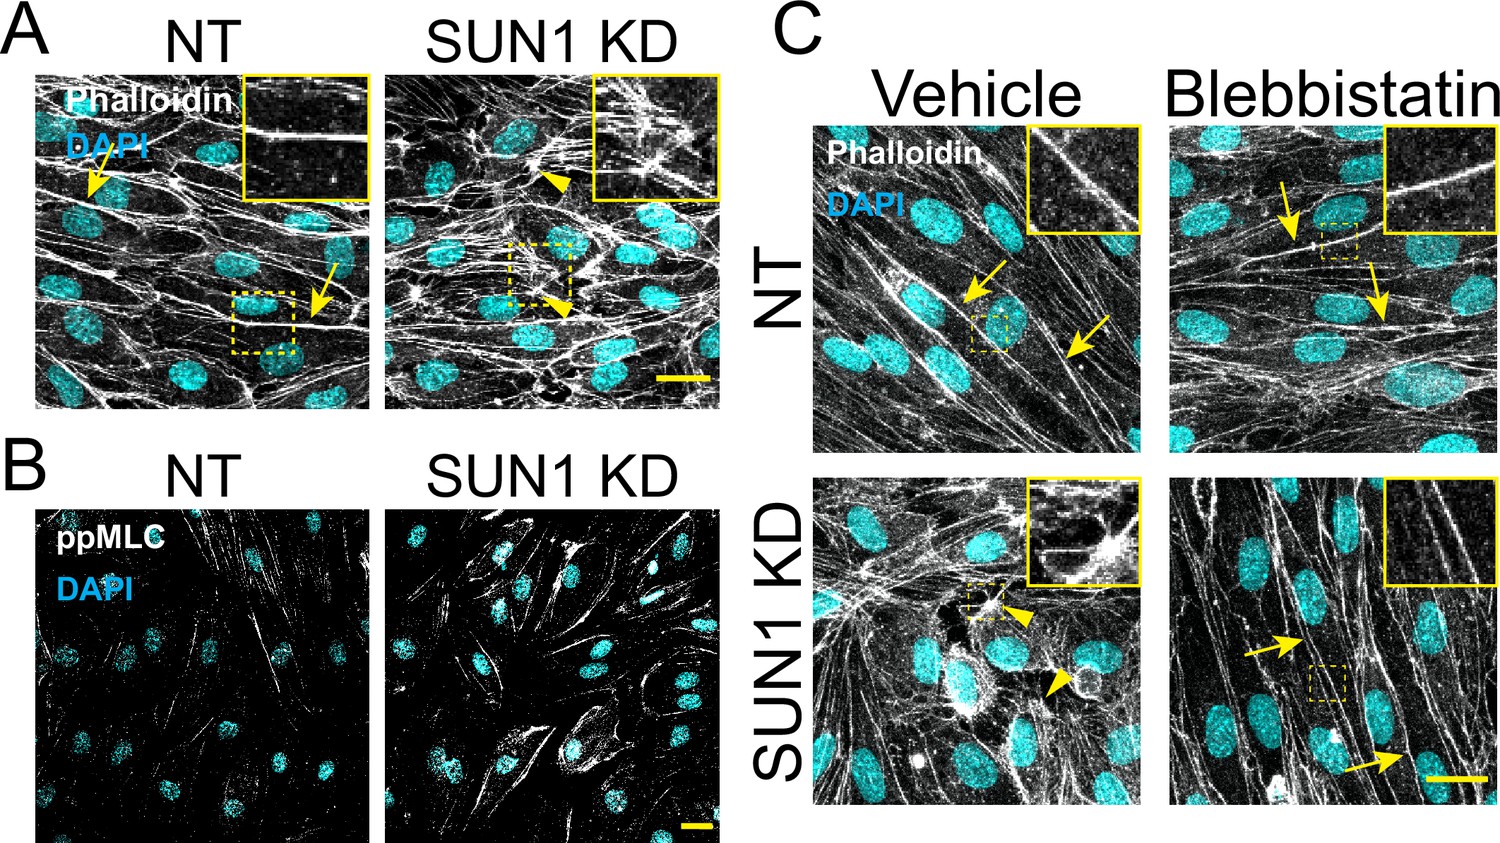
SUN1 regulates the actin cytoskeleton in endothelial cells.
(A) Representative images of human umbilical vein endothelial cells (HUVEC) with indicated siRNAs showing changes in actin structures at the cell periphery. Endothelial cells were stained for DAPI (cyan, DNA) and VE-cadherin (white, junctions). Insets show actin structures at periphery. Scale bar, 20 µm. (B) Representative images of HUVEC with indicated siRNAs stained for phosphorylated myosin light chain (ppMLC). Endothelial cells were stained for DAPI (cyan, DNA) and ppMLC (white). Scale bar, 20 µm. (C) Representative images of HUVEC with indicated siRNAs and indicated treatments. Endothelial cells were stained for DAPI (cyan, DNA) and Phalloidin (white, actin). Insets show actin structures at periphery. Scale bar, 20 µm.
Figure 6—figure supplement 2
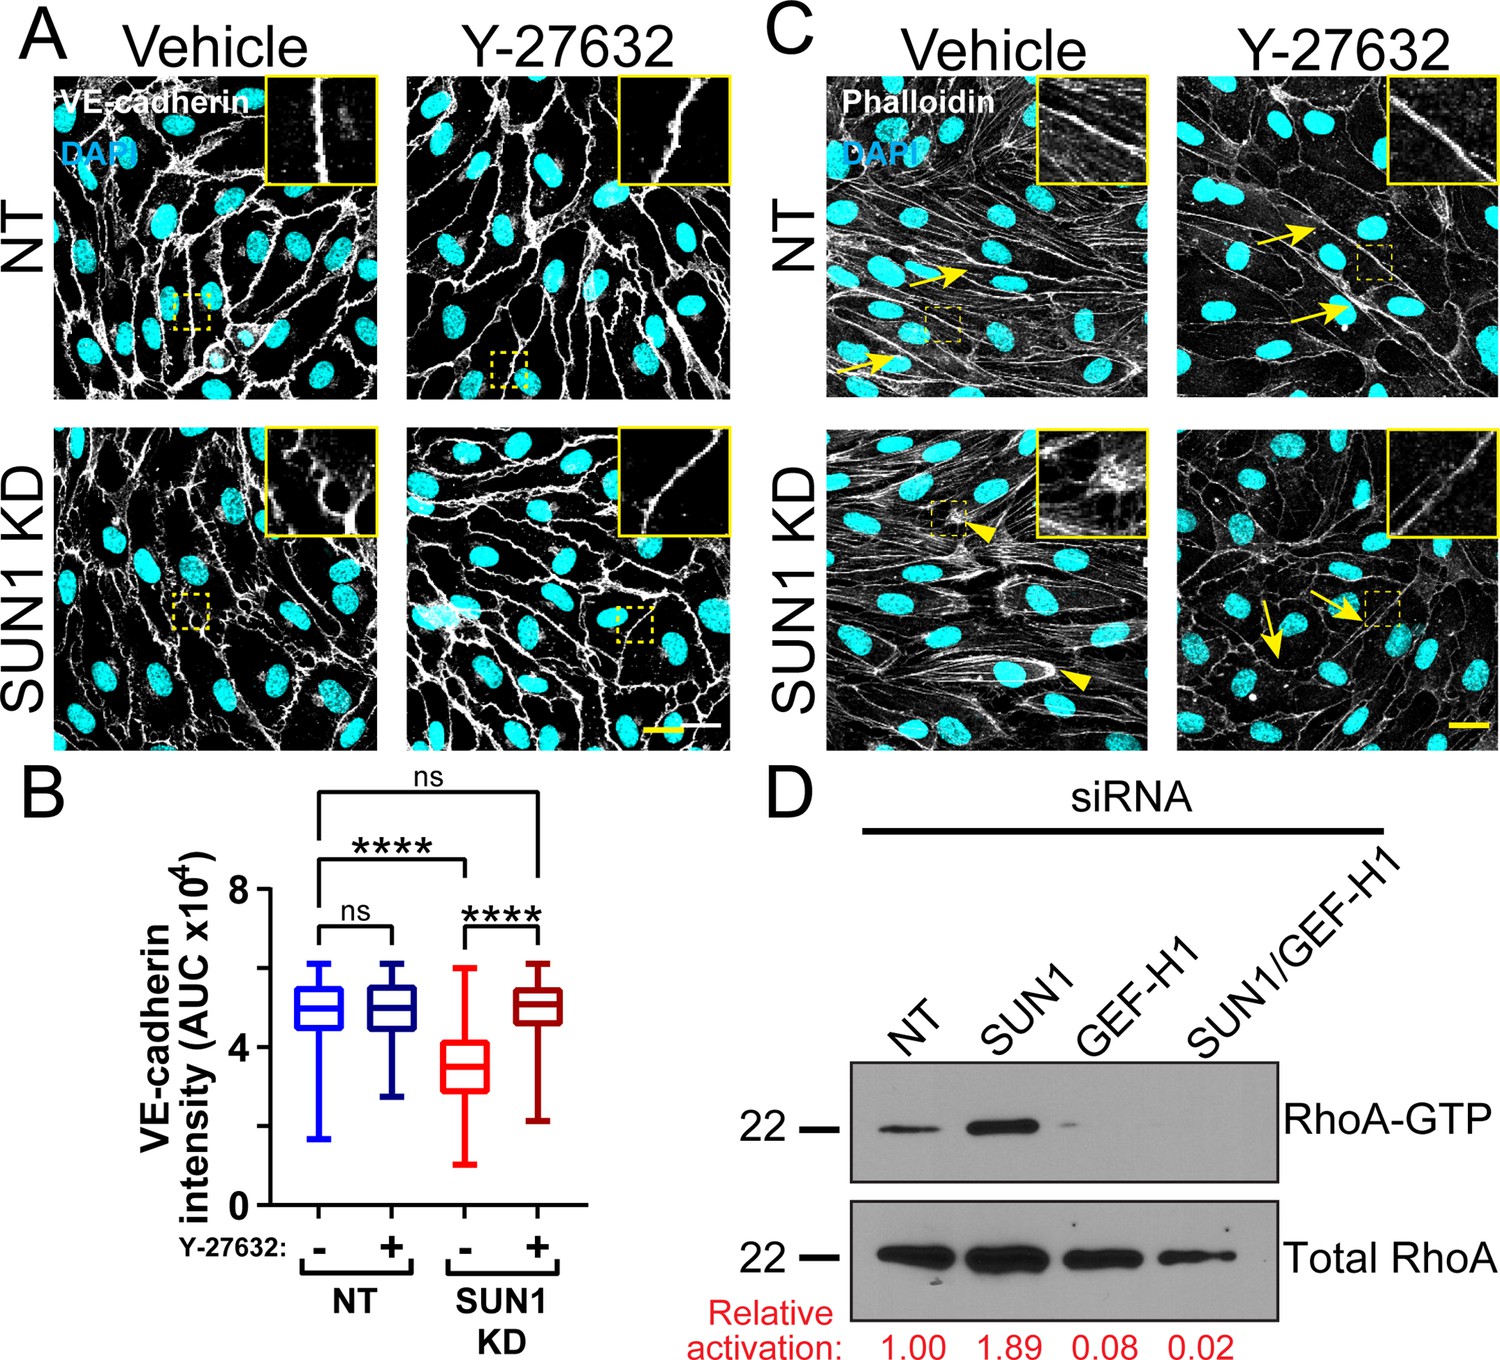
SUN1 acts through RhoA to affect junctions.
(A) Representative images of human umbilical vein endothelial cells (HUVEC) with indicated siRNAs. Endothelial cells were stained for DAPI (cyan, DNA) and VE-cadherin (white, junctions). Insets show junctions. Scale bar, 20 µm. (B) Quantification of VE-cadherin line scans for treatments shown in (A). n=185 junctions (non-targeting [NT], vehicle), 165 junctions (NT, Y-27632), 175 junctions (SUN1 knockdown [KD], vehicle), and 173 junctions (SUN1 KD, Y-27632) compiled from three replicates. ns, not significant; ****, p<0.0001 by two-way ANOVA with Tukey’s multiple comparisons test. (C) Representative images of HUVEC with indicated siRNAs and indicated treatments. Endothelial cells were stained for DAPI (cyan, DNA) and Phalloidin (white, actin). Insets show actin structures at periphery. Scale bar, 20 µm. Arrows denote cortical actin; arrowheads denote radial actin bundles. (D) Representative western blot (N=3) showing levels of RhoA-GTP in HUVEC with indicated siRNAs and treatments. Total RhoA was used as a loading control. RhoA-GTP normalized to NT is shown in red. For B, boxes represent the upper quartile, lower quartile, and median; whiskers represent the minimum and maximum values.
-
Figure 6—figure supplement 2—source data 1
Western blots showing representative replicate.
Protein was extracted from human umbilical vein endothelial cells (HUVEC) with indicated siRNAs and treatments. Blots were probed for RhoA from whole cell lysates (Total RhoA, right blot) or following RBD pulldown (RhoA-GTP, left blot). Thrombin treatment was used as positive control and serum starvation was used as a negative control. Red boxes indicate portions of blots used for Figure 6—figure supplement 2D.
- https://cdn.elifesciences.org/articles/83652/elife-83652-fig6-figsupp2-data1-v1.zip
Figure 6—figure supplement 3
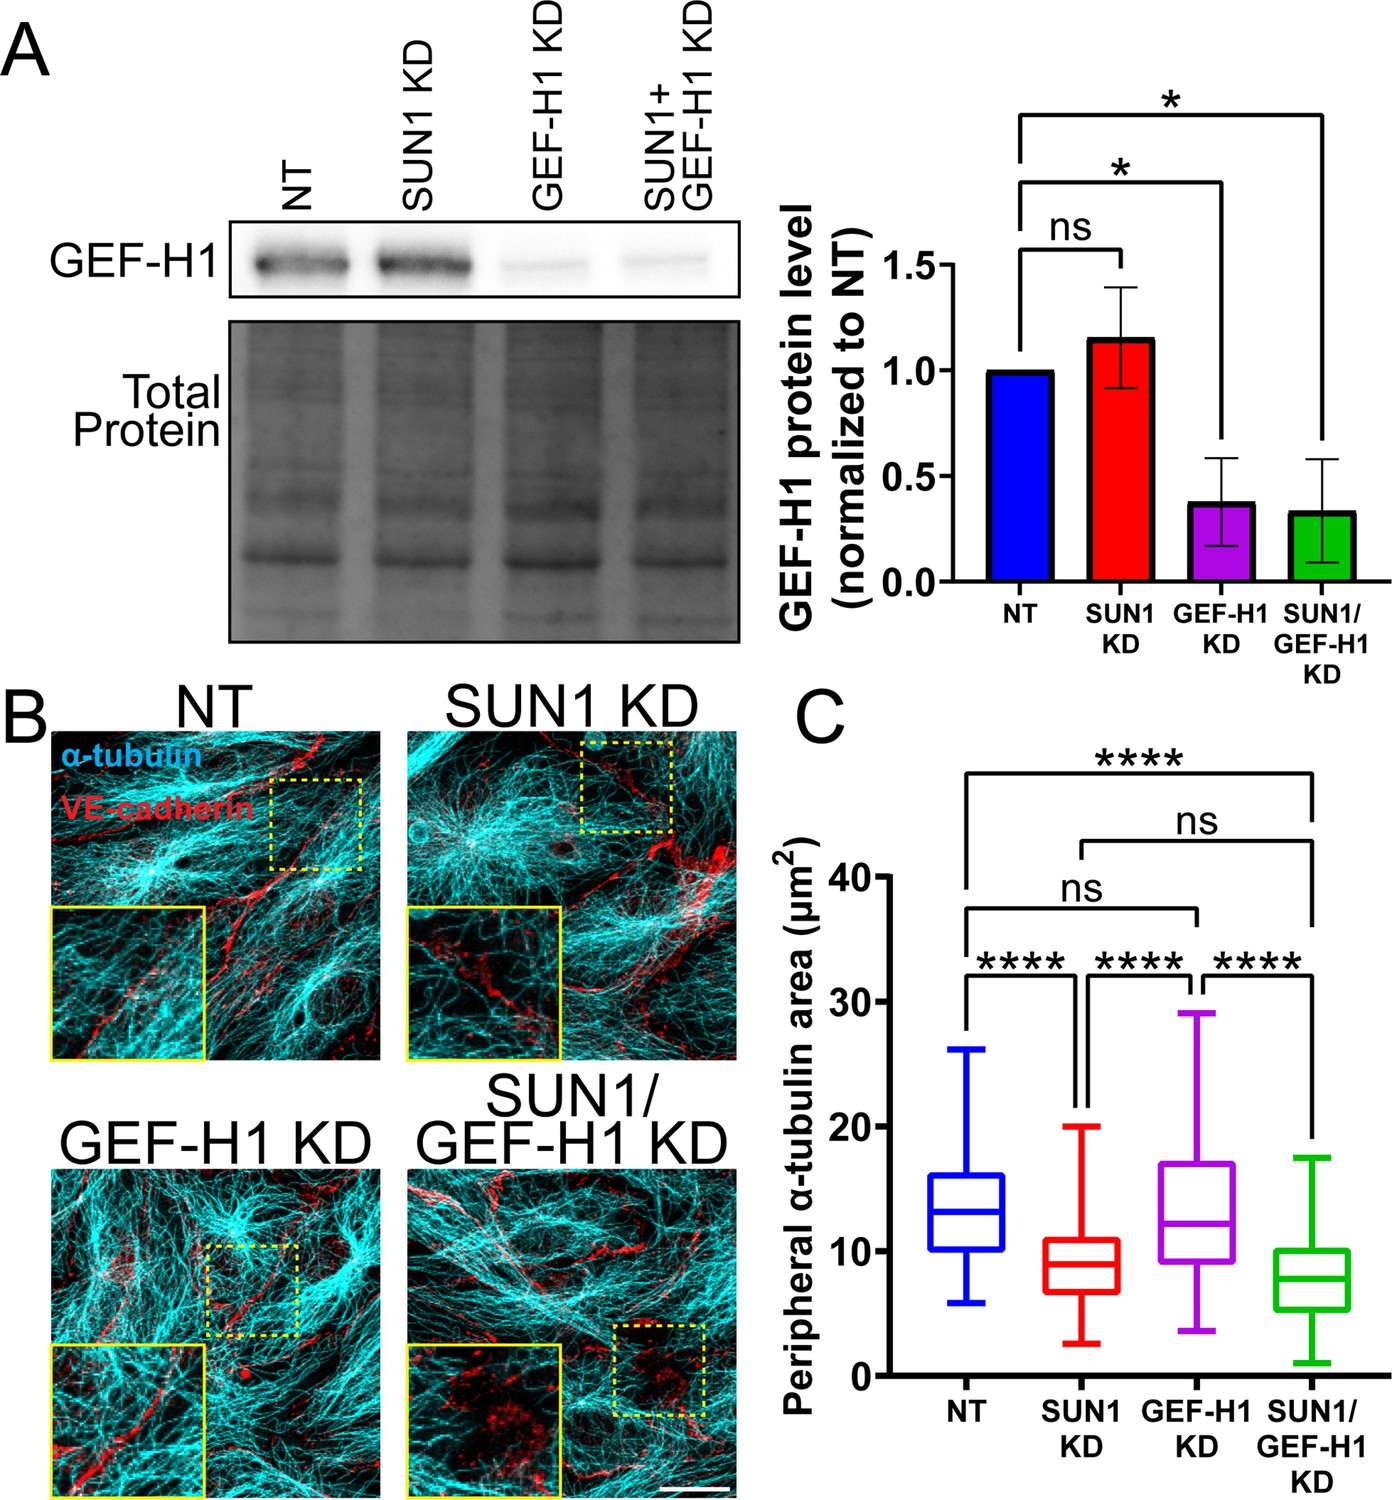
GEF-H1 signaling is downstream of SUN1 and microtubules.
(A) Representative western blot showing total levels of GEF-H1 protein in human umbilical vein endothelial cells (HUVEC) with indicated siRNAs. Total protein was used as a loading control. Quantification of GEF-H1 levels compiled from three replicates. ns, not significant; *, p<0.05 by one-way ANOVA with Tukey’s multiple comparisons test. (B) Representative images of HUVEC with indicated siRNAs. Endothelial cells were stained for α-tubulin (cyan, microtubules) and VE-cadherin (red, junctions). Insets show α-tubulin contacts at junctions. Scale bar, 20 µm. (C) Quantification of peripheral α-tubulin area shown in (B). n=60 cells (non-targeting [NT]), 60 cells (SUN1 knockdown [KD]), 60 cells (GEF-H1 KD), and 64 cells (SUN1/GEF-H1 KD) compiled from three replicates. ns, not significant; ****, p<0.0001 by one-way ANOVA with Tukey’s multiple comparisons test. For A, error bars represent standard deviation. For C, boxes represent the upper quartile, lower quartile, and median; whiskers represent the minimum and maximum values.
-
Figure 6—figure supplement 3—source data 1
Western blot showing representative replicate.
Protein was extracted from human umbilical vein endothelial cells (HUVEC) with indicated siRNAs. Blot was probed for GEF-H1 (labeled GEF-H1 in source file). Total protein from transfer was used as a loading control (labeled total protein in source file). Red boxes indicate portions of blots used for Figure 6—figure supplement 3A.
- https://cdn.elifesciences.org/articles/83652/elife-83652-fig6-figsupp3-data1-v1.zip
Figure 7 with 1 supplement
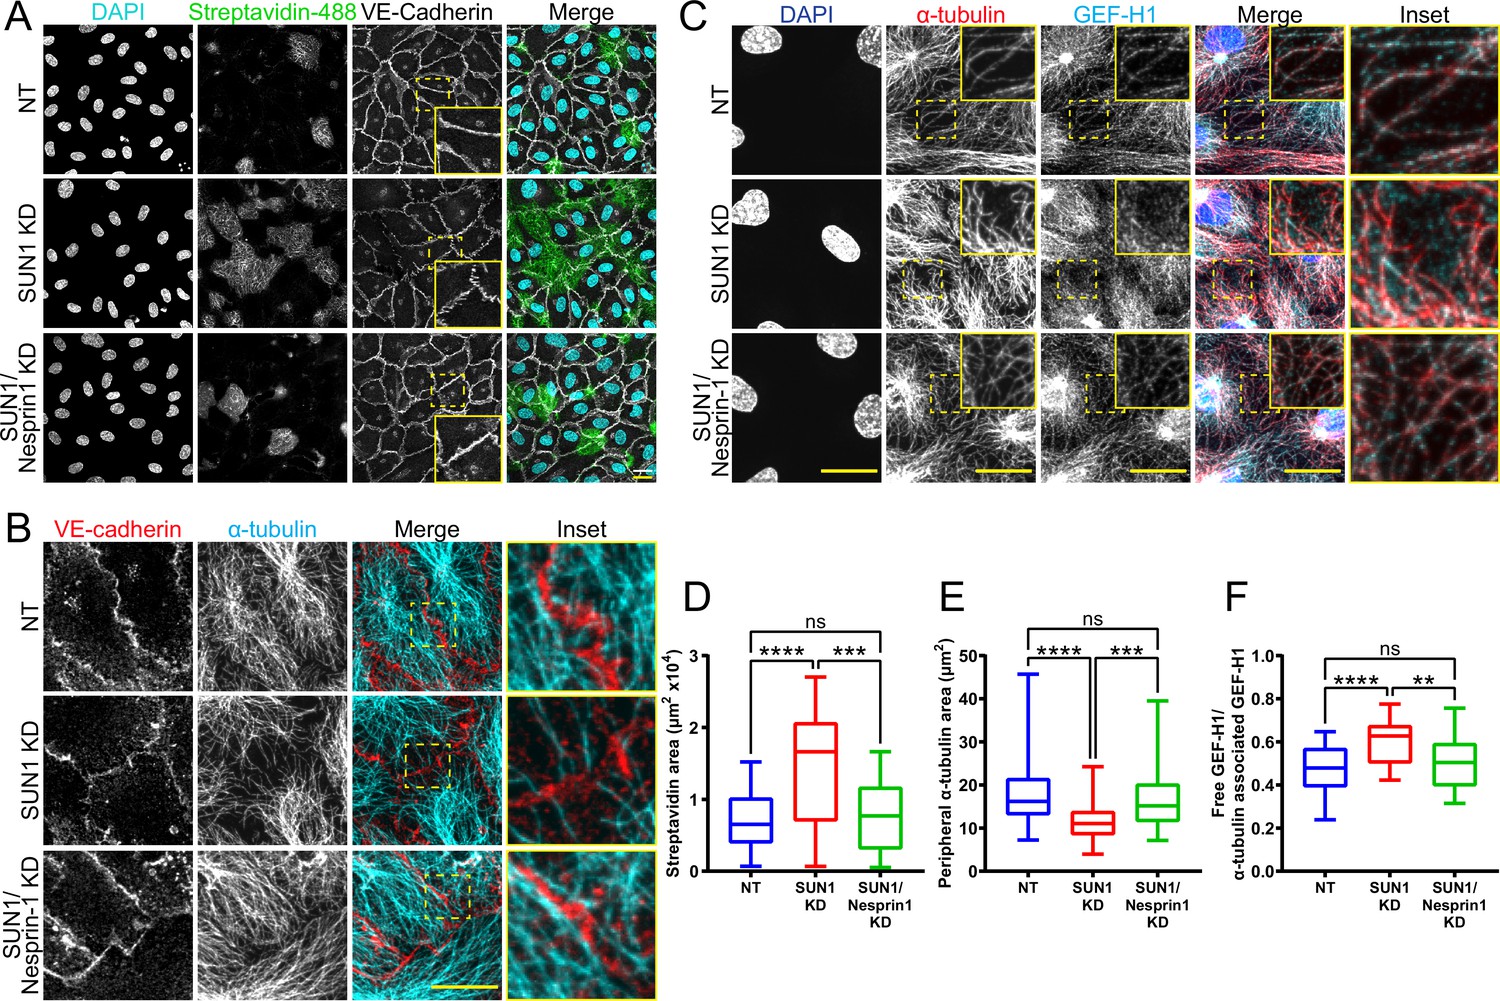
SUN1 regulates endothelial cell junctions through nesprin-1.
(A) Representative images of human umbilical vein endothelial cells (HUVEC) with indicated siRNAs cultured on biotinylated fibronectin and treated with streptavidin upon confluence. Endothelial cells were stained for DAPI (cyan, DNA), streptavidin (green), and VE-cadherin (white, junctions). Insets show junctions. Scale bar, 20 µm. (B) Representative images of HUVEC with indicated siRNAs. Endothelial cells were stained for α-tubulin (cyan, microtubules) and VE-cadherin (red, junctions). Insets show α-tubulin contacts at junctions. Scale bar, 20 µm. (C) Representative images of HUVEC with indicated siRNAs. Endothelial cells were stained for DAPI (blue, DNA), α-tubulin (red, microtubules), and GEF-H1 (cyan). Insets show α-tubulin and GEF-H1 colocalization. Scale bar, 20 µm. (D) Quantification of streptavidin area shown in (A). n=22 ROIs (non-targeting [NT]), 22 ROIs (SUN1 knockdown [KD]), and 22 ROIs (SUN1/nesprin-1 KD) compiled from four replicates. ns, not significant; ***, p<0.001; ****, p<0.0001 by one-way ANOVA with Tukey’s multiple comparisons test. (E) Quantification of peripheral α-tubulin area shown in (B). n=52 cells (NT), 52 cells (SUN1 KD), and 52 cells (SUN1/nesprin-1 KD) compiled from three replicates. ns, not significant; ***, p<0.001; ****, p<0.0001 by one-way ANOVA with Tukey’s multiple comparisons test. (F) Quantification of free GEF-H1 normalized to α-tubulin associated GEF-H1 shown in (C). n=32 cells (NT), 32 cells (SUN1 KD), and 32 cells (SUN1/nesprin-1 KD) compiled from three replicates. ns, not significant; **, p<0.01; ****, p<0.0001 by one- way ANOVA with Tukey’s multiple comparisons test. For all graphs, boxes represent the upper quartile, lower quartile, and median; whiskers represent the minimum and maximum values.
Figure 7—figure supplement 1
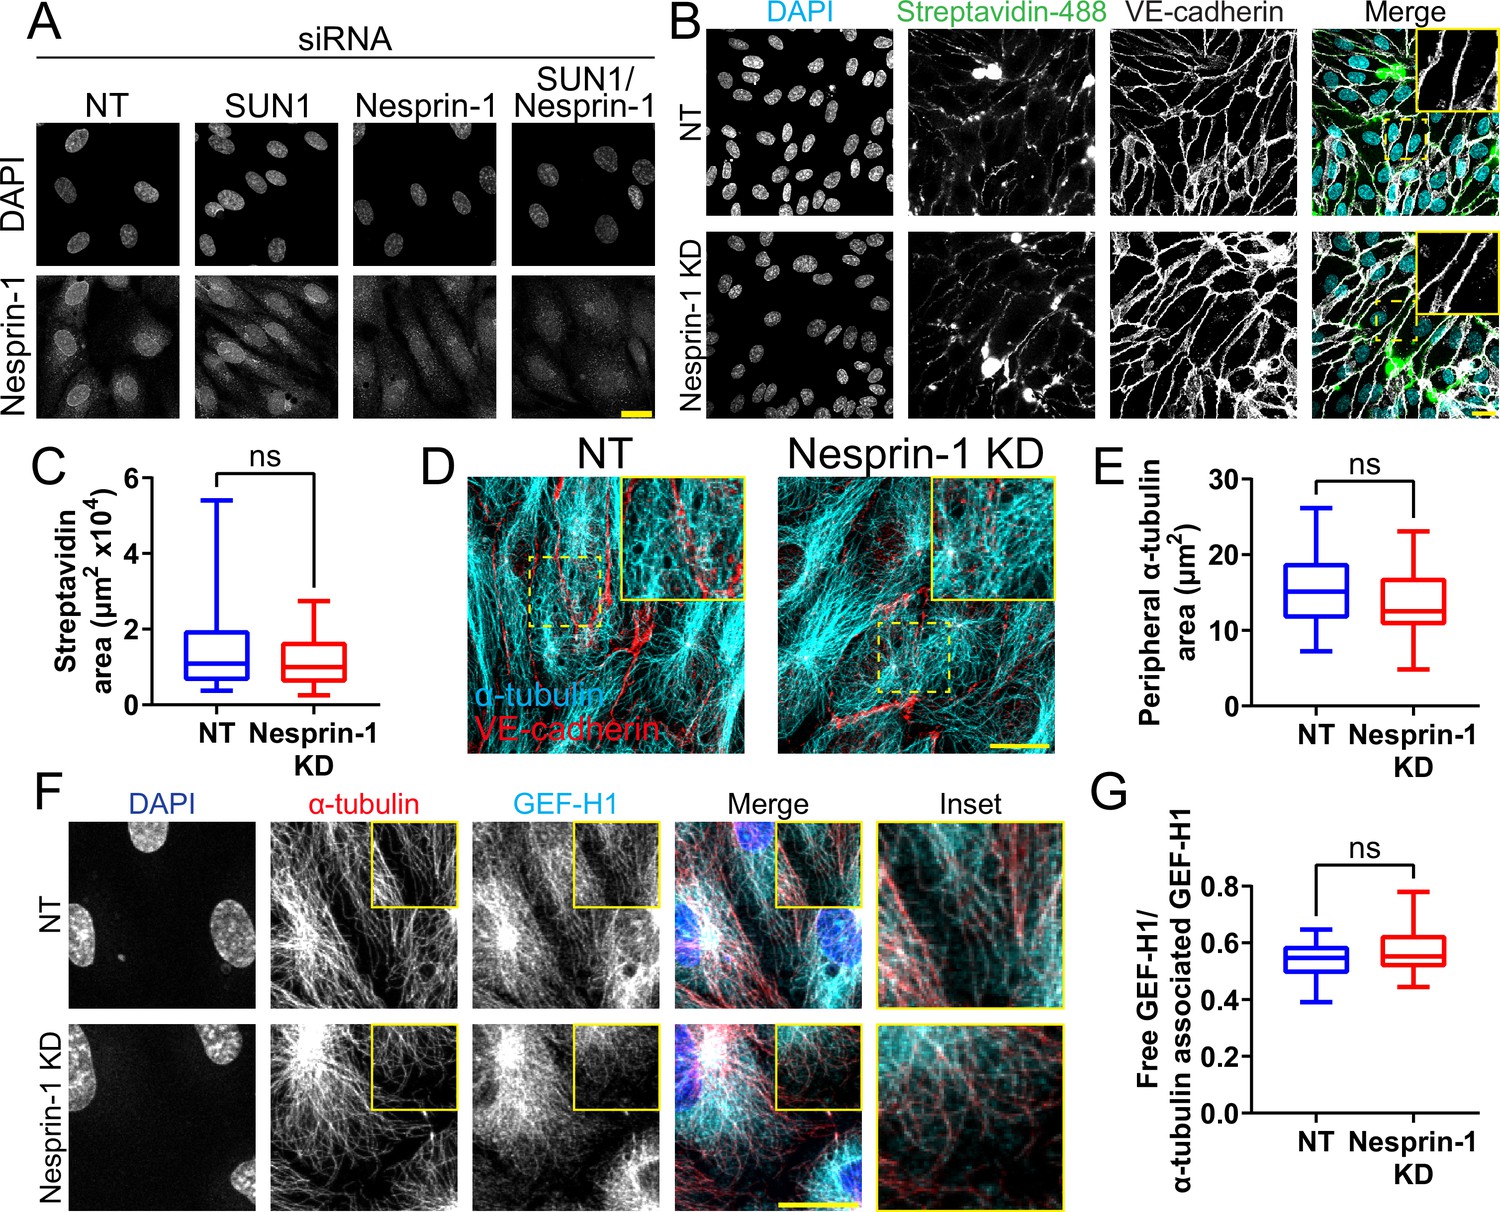
Loss of nesprin-1 alone does not impact endothelial junctions or microtubules.
(A) Representative images of human umbilical vein endothelial cells (HUVEC) with indicated siRNAs and indicated antibodies. Endothelial cells were stained for DAPI (DNA) and nesprin-1. Scale bar, 20 µm. (B) Representative images of HUVEC with indicated siRNAs cultured on biotinylated fibronectin and treated with streptavidin upon confluence. Endothelial cells were stained for DAPI (cyan, DNA), streptavidin (green), and VE-cadherin (white, junctions). Insets show junctions. Scale bar, 20 µm. (C) Quantification of streptavidin area shown in (B). n=24 ROIs (non-targeting [NT]) and 21 ROIs (nesprin-1 knockdown [KD]) compiled from three replicates. ns, not significant by Student’s two-tailed unpaired t-test. (D) Representative images of HUVEC with indicated siRNAs. Endothelial cells were stained for α-tubulin (cyan, microtubules) and VE-cadherin (red, junctions). Insets show α-tubulin contacts at junctions. Scale bar, 20 µm. (E) Quantification of peripheral α-tubulin area shown in (D). n=40 cells (NT) and 40 cells (nesprin-1 KD) compiled from two replicates. ns, not significant by Student’s two-tailed unpaired t-test. (F) Representative images of HUVEC with indicated siRNAs. Endothelial cells were stained for DAPI (blue, DNA), α-tubulin (red, microtubules), and GEF-H1 (cyan). Insets show α-tubulin and GEF-H1 colocalization. Scale bar, 20 µm. (G) Quantification of free GEF-H1 normalized to α-tubulin associated GEF-H1 shown in (F). n=20 cells (NT) and 20 cells (nesprin-1 KD) compiled from two replicates. ns, not significant by Student’s two-tailed unpaired t-test. For all graphs, boxes represent the upper quartile, lower quartile, and median; whiskers represent the minimum and maximum values.
Figure 8
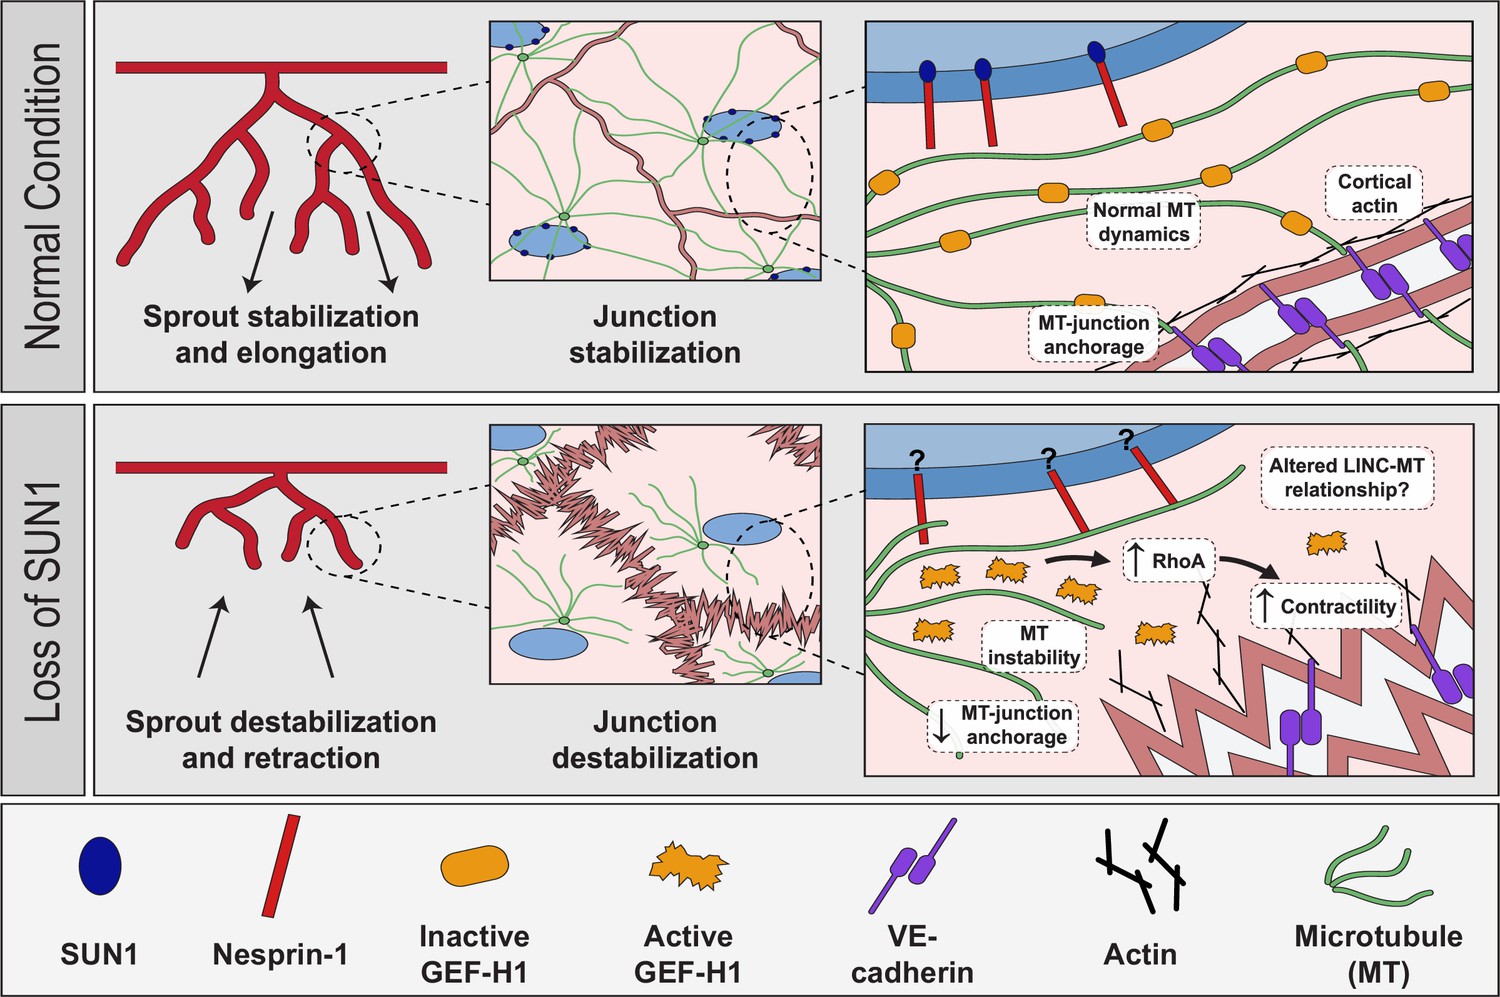
Proposed role of SUN1 in angiogenic sprouting and endothelial cell junction stabilization.
Model describing proposed role of SUN1 in angiogenic sprouting and endothelial cell junction stabilization.
Author response image 1
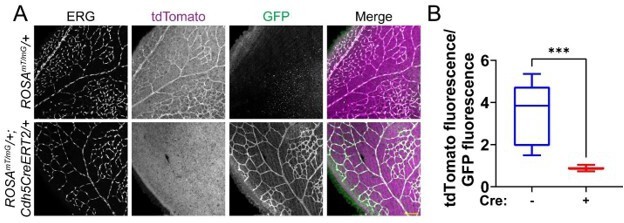
Cdh5CreERT2 efficiently excises in endothelial cells of the mouse postnatal retina.
(A) Representative images of P7 mouse retinas with the indicated genotypes, stained for ERG (white, nucleus). tdTomato (magenta) is expressed in cells that have not undergone Cre-mediated excision, while GFP (green) is expressed in excised cells. Scale bar, 100μm. (B) Quantification of tdTomato fluorescence relative to GFP fluorescence as shown in A. tdTomato and GFP fluorescence of endothelial cells was measured by creating a mask of the ERG channel. n=3 mice per genotype. ***, p<0.001 by student’s two-tailed unpaired t-test.
Author response image 2

Cdh5CreERT2 does not affect radial expansion.
Reproduced graph from Figure 1—figure supplement 1D with additional statistical comparisons. There is no significant difference in radial expansion between Cdh5CreERT2/+ mice and WT mice.
Videos
Video 1
Control endothelial cells elongate in 3D sprouting assay.
3D sprouting angiogenesis of control (non-targeting [NT]) human umbilical vein endothelial cells (HUVEC) over 60 hr, showing elongation of NT sprouts. Scale bar, 50 µm. Frames acquired every 30 min.
Video 2
SUN1-depleted endothelial cells retract in 3D sprouting assay.
3D sprouting angiogenesis of SUN1 knockdown (KD) sprouts over 60 hr, showing retraction of SUN1 KD sprouts. Scale bar, 50 µm. Frames acquired every 30 min.
Video 3
Control zebrafish have normal inter-segmental vessel (ISV) growth.
Movie taken from 26 to 36 hpf (hours post fertilization) in Tg(fli:LifeAct-GFP) zebrafish embryos injected with a non-targeting (NT) morpholino, showing elongation of ISVs and connection to the dorsal longitudinal anastomotic vessel (DLAV). A, anterior; P, posterior. Scale bar, 20 µm. Frames acquired every 15 min.
Video 4
Loss of SUN1 in zebrafish leads to abnormal inter-segmental vessel (ISV) growth.
Movie taken from 26 to 36 hpf in Tg(fli:LifeAct-GFP) zebrafish embryos injected with a sun1b morpholino, showing an ISV that fails to elongate and connect to the dorsal longitudinal anastomotic vessel (DLAV) and an ISV that elongates but does not connect to the DLAV. A, anterior; P, posterior. Arrow points to ISV that does not elongate. Scale bar, 20 µm. Frames acquired every 15 min.
Video 5
Control endothelial cells have normal microtubule dynamics.
Movie taken for 120 s in human umbilical vein endothelial cells (HUVEC) with non-targeting (NT) siRNA labeled with EB3-mCherry. Quantified microtubule tracks are indicated. Scale bar, 5 µm. Frames acquired every 500 ms.
Video 6
Loss of SUN1 in endothelial cells leads to impaired microtubule dynamics.
Movie taken for 120 s in human umbilical vein endothelial cells (HUVEC) with SUN1 siRNA labeled with EB3-mCherry. Quantified microtubule tracks are indicated. Scale bar, 5 µm. Frames acquired every 500 ms.
Tables
Table 1
SUN1 depletion does not alter endothelial gene expression.
| Condition | # Upregulated DEG | # Downregulated DEG |
|---|---|---|
| NT_FLOW vs. NT_STAT | 1323 | 1109 |
| SUN1_STAT vs. NT_STAT | 0 | 1 |
| SUN1_FLOW vs. NT_FLOW | 1 | 1 |
-
Bold numbers indicate that single downregulated gene was SUN1.
-
Abbreviation: NT, non-targeting; STAT, static; DEG, differentially expressed genes.
Appendix 1—key resources table
| Reagent type (species) or resource | Designation | Source or reference | Identifiers | Additional information |
|---|---|---|---|---|
| Gene (Mus musculus) | Sun1 | Ensembl | Ensembl_ID: ENSMUSG00000036817 | |
| Gene (Homo sapiens) | SUN1 | Ensembl | Ensemble_ID: ENSG00000164828 | |
| Gene (Danio rerio) | sun1b | ZFIN | ZFIN_ID:ZDB -GENE-050522–551 | |
| Strain, strain background (M. musculus) | B6NJ;B6N-Sun1tm1a(EUCOMM)/Wtsi/ CipheOrl | European Mouse Mutant Archive (EMMA) | EMMA_ID:EM:09532 | |
| Strain, strain background (M. musculus) | FlpO-B6N-Albino (Rosa26-FlpO/+) | Other | UNC Animal Models Core | |
| Strain, strain background (M. musculus) | Tg(Cdh5-cre/ERT2)1Rha | Sörensen et al., 2009 (PMID: 19144989) | Dr Ralf Adams | |
| Strain,strain background (D. rerio) | Tg(fli:LifeAct-GFP) | Other | Dr Wiebke Herzog | |
| Strain,strain background (D. rerio) | sun1bsa33109 | Zebrafish International Resource Center (ZIRC) | Cat#:ZL12625.02 | |
| Cell line (Homo sapiens) | Human Umbilical Vein Endothelial Cells (HUVEC) | Lonza | Cat#:C2519A | Human primary endothelial cells, mixed sex |
| Cell line (H. sapiens) | Normal Human Lung Fibroblasts (NHLF) | Lonza | Cat#:CC2512 | Human primary lung fibroblast cells, mixed sex |
| Transfected construct (H. sapiens) | Non-targeting (NT) siRNA | Life Technologies | Cat#:4390847 | Silencer select |
| Transfected construct (H. sapiens) | SUN1 siRNA #1 | Life Technologies | Cat#:439240; #s23630 | Silencer select |
| Transfected construct (H. sapiens) | SUN1 siRNA #2 | Life Technologies | Cat#:439240; #s23629 | Silencer select |
| Transfected construct (H. sapiens) | GEF-H1 siRNA | Life Technologies | Cat#:439240; #s17546 | Silencer select |
| Transfected construct (H. sapiens) | Nesprin-1 siRNA | Dharmacon | Cat#: M-014039-02-0005 | SMARTpool |
| Transfected construct (H. sapiens) | EB3-mCherry | Kushner et al., 2014 (PMID: 25049273) | Lentiviral construct | |
| Antibody | Anti-mouseCD144 (rat monoclonal) | BD Pharmingen | Cat#:550548 | Primary antibody, detects VE-cadherin in mouse tissue IF mouse (1:100) |
| Antibody | Anti-ERG (rabbit monoclonal) | Abcam | Cat#:ab196149 | Primary antibody conjugated to AlexaFluor647, detects nuclei in endothelial cells IF mouse (1:500) |
| Antibody | Anti-VE-cadherin (rabbit monoclonal) | Cell Signaling | Cat#:2500S | Primary antibody, detects human VE-cadherin IF cells 3D(1:1000) IF cells 2D (1:500) Western (1:14000) |
| Antibody | Anti-ZO1 (mouse monoclonal) | Thermo Fisher | Cat#:33-9100 | Primary antibody, detects ZO1 in zebrafish IF zebrafish (1:500) |
| Antibody | Anti-SUN1 (rabbit monoclonal) | Abcam | Cat#:ab124770 | Primary antibody, detects human SUN1 IF cells (1:500) |
| Antibody | Anti-Ki67 (rabbit polyclonal) | Abcam | Cat#:ab15580 | Primary antibody IF cells (1:500) |
| Antibody | Anti-phospho-myosin light chain 2 (Thr18/Ser19) (rabbit polyclonal) | Cell Signaling | Cat#:3674S | Primary antibody IF cells (1:500) |
| Antibody | Anti-alpha-tubulin (mouse monoclonal) | Cell Signaling | Cat#:3873 S | Primary antibody IF cells (1:500) |
| Antibody | Anti-GEF-H1 (rabbit polyclonal) | Abcam | Cat#:ab155785 | Primary antibody IF cells (1:500) Western (1:1000) |
| Antibody | Anti-SYNE1 (rabbit polyclonal) | Atlas Antibodies | Cat#:HPA019113 | Primary antibody IF cells (1:500) |
| Antibody | Anti-GAPDH (mouse monoclonal) | Cell Signaling | Cat#:97166S | Primary antibody Western (1:5000) |
| Antibody | Anti-VE-cadherin BV6 (mouse monoclonal) | Enzo | Cat#:ALX-803-305C100 | Primary antibody, detects the extracellular region of VE-cadherin IF cells (1:100) |
| Antibody | Anti-RhoA (rabbit monoclonal) | Cell Signaling | Cat#:2117 | Primary antibody Western (1:1000) |
| Antibody | Goat anti-mouse AlexaFluor 488 (goat polyclonal) | Life Technologies | Cat#:A11029 | Secondary antibody IF cells (1:500) |
| Antibody | Goat anti-rabbit AlexaFluor 594 (goat polyclonal) | Life Technologies | Cat#:A11037 | Secondary antibody IF cells (1:500) |
| Antibody | Goat anti-rat AlexaFluor 647 (goat polyclonal) | Life Technologies | Cat#:A21247 | Secondary antibody IF mouse (1:500) |
| Antibody | Goat anti-mouse AlexaFluor 647 (goat polyclonal) | Life Technologies | Cat#:A21236 | Secondary antibody IF zebrafish (1:1000) IF cells (1:500) |
| Antibody | Goat anti-rabbit AlexaFluor 647 (goat polyclonal) | Life Technologies | Cat#:A21245 | Secondary antibody IF cells (1:500) |
| Antibody | Donkey anti-rabbit HRP (donkey polyclonal) | Thermo Fisher | Cat#:A16035 | Secondary antibody Western (1:10,000) |
| Antibody | Goat anti-rabbit HRP (goat polyclonal) | Jackson ImmunoResearch | Cat#:111-035-144 | Secondary antibody Western |
| Sequence-based reagent | LacZ_F | This paper | PCR primers | ACTATCCCGACCGCCTTACT |
| Sequence-based reagent | LacZ_R | This paper | PCR primers | TAGCGGCTGATGTTGAACTG |
| Sequence-based reagent | Sun1fl_F | This paper | PCR primers | GCTCTCTGAAACATGGCTGA |
| Sequence-based reagent | Sun1fl_R | This paper | PCR primers | ATCCGGGGTGTTTGGATTAT |
| Sequence-based reagent | Sun1excised_F | This paper | PCR primers | CTTTTGGGCTGCTCTGTTGT |
| Sequence-based reagent | Sun1excised_R | This paper | PCR primers | ATCCGGGGTGTTTGGATTAT |
| Sequence-based reagent | FlpO_F | This paper | PCR primers | TGAGCTTCGACATCGTGAAC |
| Sequence-based reagent | FlpO_R | This paper | PCR primers | TCAGCATCTTCTTGCTGTGG |
| Sequence-based reagent | Cdh5Cre_F | This paper | PCR primers | TCCTGATGGTGCCTATCCTC |
| Sequence-based reagent | Cdh5Cre_R | This paper | PCR primers | CCTGTTTTGCACGTTCACCG |
| Sequence-based reagent | sun1b_F | This paper | PCR primers | GGCTGCGTCAGACTCCATTA |
| Sequence-based reagent | sun1b_R | This paper | PCR primers | TTGAGTTAAACCCAGCGCCT |
| Sequence-based reagent | Non-targeting (NT) morpholino (MO) | This paper | CCTCTTACCTCAGTTACAATTTATA | |
| Sequence-based reagent | sun1b morpholino (MO) | This paper | CGCAGTTTGACCATCAGTTTCTACA | |
| Peptide, recombinant protein | Isolectin B4 AlexaFluor 488 | Thermo Fisher | Cat#:I21411 | IF(1:100) |
| Peptide, recombinant protein | AlexaFluor 488 Phalloidin | Life Technologies | Cat#:A12379 | IF cells 3D (1:50) |
| Peptide, recombinant protein | Streptavidin-488 | Invitrogen | Cat#:S11223 | 25 μg/ml |
| Peptide, recombinant protein | 10 kDa Dextran-Texas Red | Invitrogen | Cat#:D1863 | 100 μl injected at 5 mg/ml |
| Peptide, recombinant protein | Fibrinogen | Fisher | Cat#:820224 | 500 μl at 2.2 mg/ml |
| Peptide, recombinant protein | Fibronectin | Sigma | Cat#:F2006-2MG | 5 μg/ml |
| Peptide, recombinant protein | EZ-Link Sulfo-NHS-LC-Biotin | Thermo Fisher | Cat#:A39257 | 0.5 mM |
| Chemical compound, drug | Tamoxifen | Sigma | Cat#:T5648 | 50 μl injected at 1 mg/ml |
| Chemical compound, drug | Thrombin | Sigma | Cat#:T7201-500UN | For bead assay: 7 μl at 50 U/ml For cell treatments: 0.5 U/ml for 10 min at 37°C |
| Chemical compound, drug | (-) Blebbistatin | Sigma | B0560-1MG | 10 μM for 15 min at 37°C |
| Chemical compound, drug | Y-27632 | VWR | Cat#:10187-694 | 10 μM for 30 min at 37°C |
| Chemical compound, drug | Nocodazole | Sigma | Cat#:M1404 | 10 μM for 20 min at 37°C |
| Chemical compound, drug | EDTA | Sigma-Aldrich | Cat#:EDS-100G | 3 mM |
| Commercial assay or kit | KAPA mRNA HyperPrep Kit | Roche | Cat#:7961901001 | |
| Commercial assay or kit | Click-It EdU Kit 488 | Invitrogen | Cat#:C10337 | |
| Software, algorithm | Fiji | Linkert et al., 2010 (PMID: 20513764); Schindelin et al., 2012 (PMID: 22743772) | ||
| Software, algorithm | STAR | Dobin et al., 2013 (PMID: 23104886) | ||
| Software, algorithm | HTSeq 2.0 | Putri et al., 2022 (PMID: 35561197) | ||
| Software, algorithm | DESeq2 | Love et al., 2014 (PMID: 25516281) | ||
| Software, algorithm | Visual Basic algorithm for tip tracking | Other | Dr Dan Buster | |
| Software, algorithm | Prism 9 | GraphPad | ||
| Software, algorithm | Fluoview FV31S-SW | Olympus | ||
| Software, algorithm | MetaMorph | MetaMorph | ||
| Other | DAPI | Sigma | Cat#:10236276001 | DNA stain, 0.3 μM |
| Other | DRAQ7 | Abcam | Cat#:ab109202 | DNA stain, 1:1000 |
| Other | xCELLigence Real-Time Cell Analyzer | Acea Biosciences/ Roche Applied Science | Equipment to assess electrical resistance across cell monolayer | |
| Other | Ibidi pump system | Ibidi | Cat#:10902 | Pump system to generate laminar flow across cells |
Additional files
Download links
A two-part list of links to download the article, or parts of the article, in various formats.
Downloads (link to download the article as PDF)
Open citations (links to open the citations from this article in various online reference manager services)
Cite this article (links to download the citations from this article in formats compatible with various reference manager tools)
Nuclear SUN1 stabilizes endothelial cell junctions via microtubules to regulate blood vessel formation
eLife 12:e83652.
https://doi.org/10.7554/eLife.83652


