CYRI-B-mediated macropinocytosis drives metastasis via lysophosphatidic acid receptor uptake
- CRUK Scotland Institute, Switchback Road, Bearsden, United Kingdom
- Institute of Cancer Sciences, University of Glasgow, United Kingdom
Figures
Figure 1
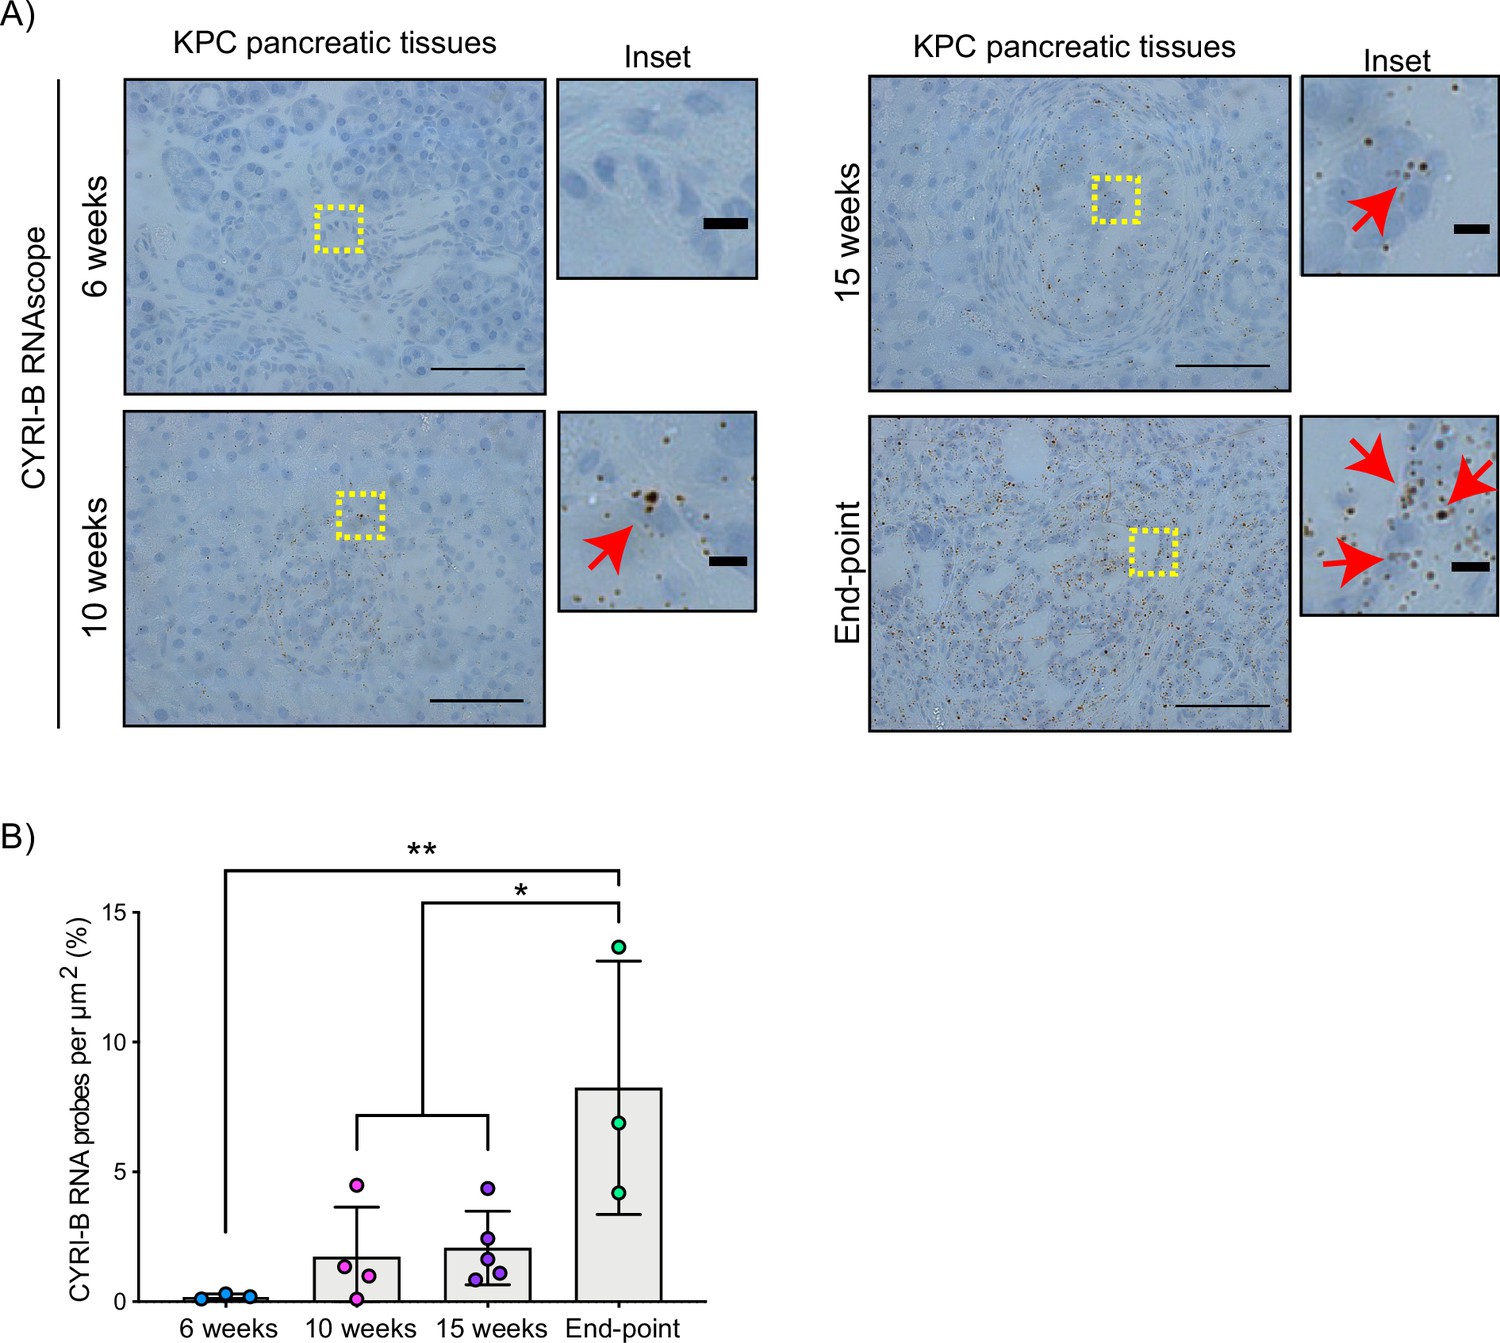
CYRI-B is expressed during pancreatic ductal adenocarcinoma (PDAC) progression.
(A) Representative images of Cyrib RNAScope in situ hybridisation from 6-, 10-, 15-week-old and end-point KPC mouse tissues. RNA probes are visualised as brown dots. Haematoxylin was also used to stain the nuclei. Scale bars, 50 μm. Yellow boxes show the region of interest for magnified images (inset). Red arrows denote positive RNA probes. Scale bars, 5 µm. (B) Quantification of the CYRI-B RNA probes per μm2 from (A). Mean ± SD; one-way ANOVA with Tukey’s test was performed in n≥3 mice. *p<0.01, **p<0.001.
-
Figure 1—source data 1
Cyrib RNA probes detected per µm2 in KPC mouse pancreatic tissues at 6, 10, 15 weeks and end-point tumours.
Excel data and Prism analysis to support Figure 1B.
- https://cdn.elifesciences.org/articles/83712/elife-83712-fig1-data1-v2.zip
Figure 2 with 1 supplement
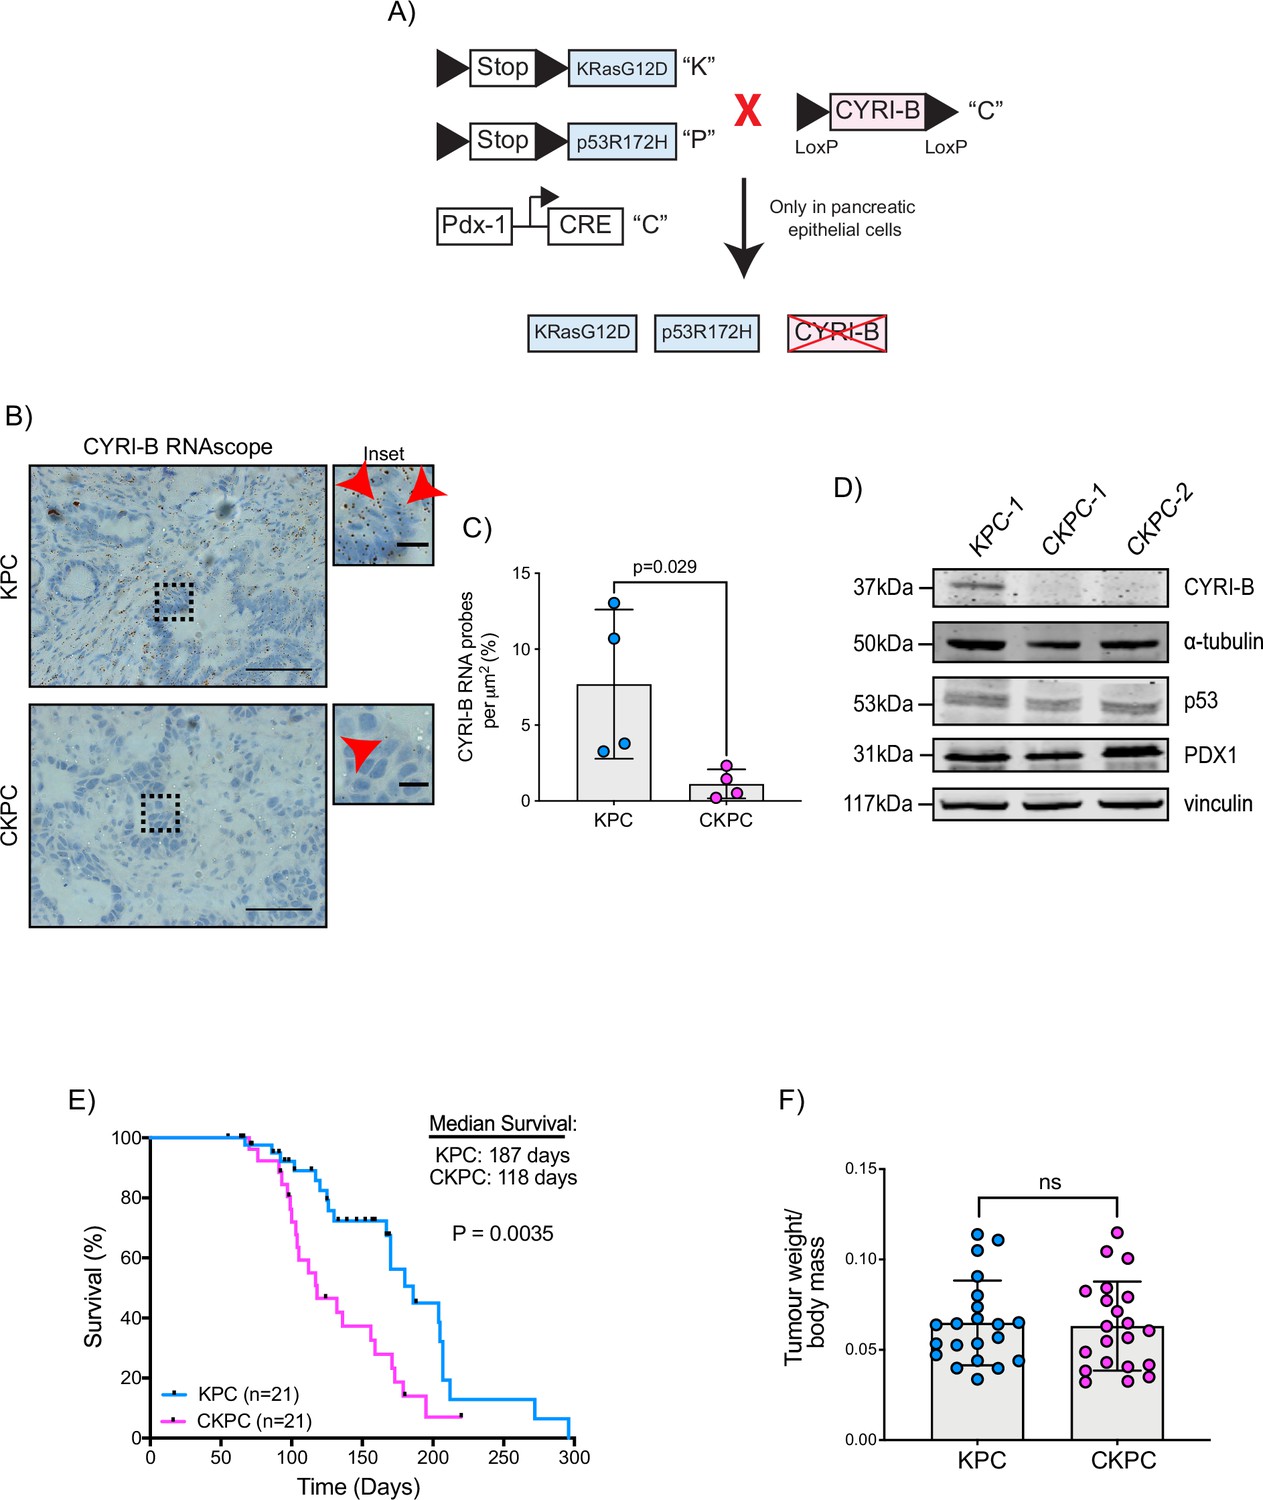
Loss of CYRI-B accelerates progression in the KPC mouse model of pancreatic ductal adenocarcinoma (PDAC).
(A) Schematic representation of the CKPC mouse model. (B) Representative images for Cyrib RNAScope staining of end-point tumours from KPC and CKPC mice. Scale bars, 50 µm. Inset panels are magnified from the black dashed box. Scale bars, 10 µm. Red arrows indicate the positive Cyrib RNA. (C) Histograms showing the Cyrib RNA probes per μm2 at end-point tumours in KPC and CKPC mice. Mean ± SD; unpaired t-test, n=4 KPC and 4 CKPC mice. (D) Representative western blot images of CYRI-B in cell lines established from one KPC (KPC-1) and two CKPC (CKPC-1 and CKPC-2) tumours. Membranes were also probed for anti-p53 and anti-PDX1 to validate the CKPC cells. α-Tubulin and vinculin were used as loading controls. Molecular weights as indicated on the side. (E) Survival (to end-point) curve (n=21 KPC, 21 CKPC independent mice). Log-rank (Mantel Cox) test used for comparing the KPC with CKPC survival curves. p-Value as indicated. (F) Histogram showing tumour to body mass ratios at sacrifice. Mean ± SD; unpaired t-test was performed in n=21 KPC and 21 CKPC mice. p-Value: not significant (ns).
-
Figure 2—source data 1
Cyrib RNA probes detected per µm2 in KPC mouse pancreatic tumours vs CKPC tumours at end-point.
Excel data and Prism analysis to support Figure 2C.
- https://cdn.elifesciences.org/articles/83712/elife-83712-fig2-data1-v2.zip
-
Figure 2—source data 2
Scans of original western blots unlabelled and labelled to support Figure 2D.
- https://cdn.elifesciences.org/articles/83712/elife-83712-fig2-data2-v2.zip
-
Figure 2—source data 3
Data from Kaplan-Meier plot for survival of mice.
Excel data and Prism analysis to support Figure 2E.
- https://cdn.elifesciences.org/articles/83712/elife-83712-fig2-data3-v2.zip
-
Figure 2—source data 4
Tumour weight to body mass ratios for KPC and CKPC cohort mice.
Excel data and Prism analysis to support Figure 2F.
- https://cdn.elifesciences.org/articles/83712/elife-83712-fig2-data4-v2.zip
Figure 2—figure supplement 1
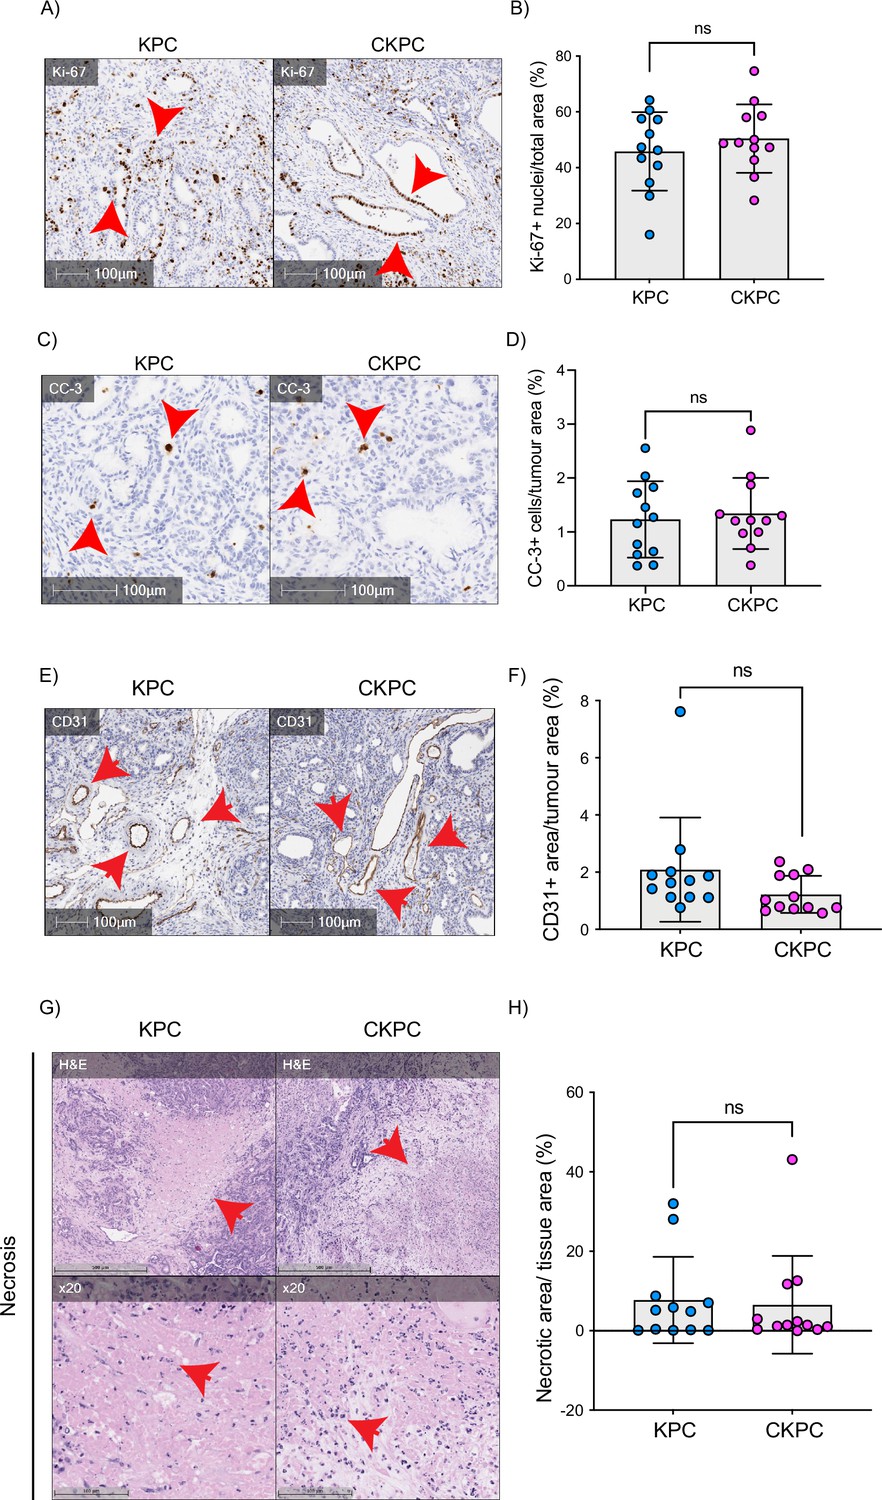
End-point CKPC tumours show comparable proliferation, apoptosis vascularisation, and necrosis to KPC tumours.
(A) Representative images of pancreatic ductal adenocarcinoma (PDAC) sections in KPC and CKPC end-point mice, stained for Ki-67 (proliferation). Scale bars, 100 µm. Red arrows indicate the positive cells. (B) Quantification of Ki-67 positive nuclei per area from (A). Mean ± SD; unpaired t-test was performed in n=12 KPC and 12 CKPC independent mice. p-Value: not significant (ns). (C) Representative images of PDAC sections in KPC and CKPC end-point mice, stained for cleaved caspase 3 (CC-3, apoptosis). Scale bars, 100 µm. Red arrows indicate the positive cells. (D) Quantification of CC-3 positive cells per area from (C). Mean ± SD; unpaired t-test was performed in n=12 KPC and 12 CKPC independent mice. p-Value: ns. (E) Representative images of PDAC sections in KPC and CKPC end-point mice, stained for CD31 (endothelial marker). Scale bars, 100 µm. Red arrows indicate the positive area for CD31. (F) Quantification of CD31 positive area per tumour area from (E). Mean ± SD; Mann-Whitney test was performed in n=12 KPC and 12 CKPC independent mice. p-Value: ns. (G) Representative images of PDAC section in KPC and CKPC end-point mice, stained for haematoxylin and eosin (H&E) to identify necrotic areas. Scale bar, 500 µm. Red arrows indicate the positive area for necrosis. ×20 objective used to show the fragmented nuclei within the necrotic areas (red arrows). Scale bar, 100 µm. (H) Quantification of necrotic area per tumour area from (G). Mean ± SD; Mann-Whitney test was performed in n=12 KPC and 12 CKPC independent mice. p-Value: ns.
-
Figure 2—figure supplement 1—source data 1
Percent area stained with Ki67+ nuclei in tumours from KPC vs CKPC mice.
Excel data and Prism analysis to support Figure 2—figure supplement 1B.
- https://cdn.elifesciences.org/articles/83712/elife-83712-fig2-figsupp1-data1-v2.zip
-
Figure 2—figure supplement 1—source data 2
Cleaved caspase 3 positive cells per area in tumours from KPC vs CKPC mice.
Excel data and Prism analysis to support Figure 2—figure supplement 1D.
- https://cdn.elifesciences.org/articles/83712/elife-83712-fig2-figsupp1-data2-v2.zip
-
Figure 2—figure supplement 1—source data 3
CD31 positive area in tumours from KPC vs CKPC mice.
Excel data and Prism analysis to support Figure 2—figure supplement 1F.
- https://cdn.elifesciences.org/articles/83712/elife-83712-fig2-figsupp1-data3-v2.zip
-
Figure 2—figure supplement 1—source data 4
Necrotic area in tumours from KPC vs CKPC mice.
Excel data and Prism analysis to support Figure 2—figure supplement 1H.
- https://cdn.elifesciences.org/articles/83712/elife-83712-fig2-figsupp1-data4-v2.zip
Figure 3 with 1 supplement
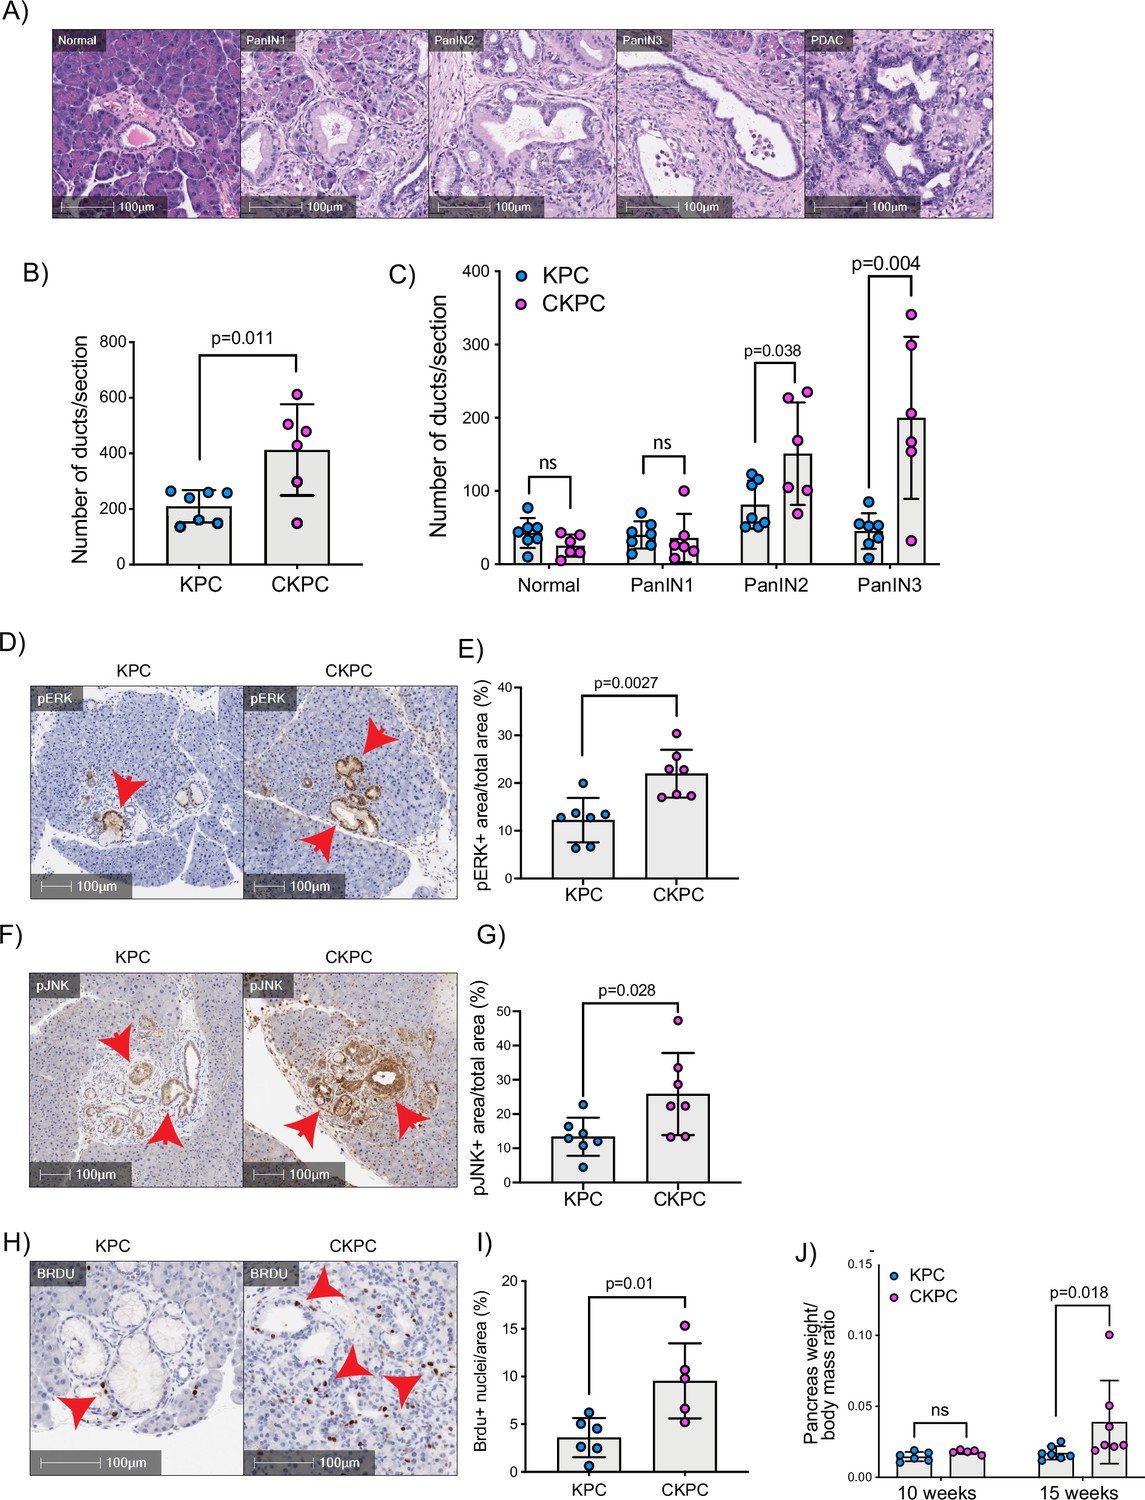
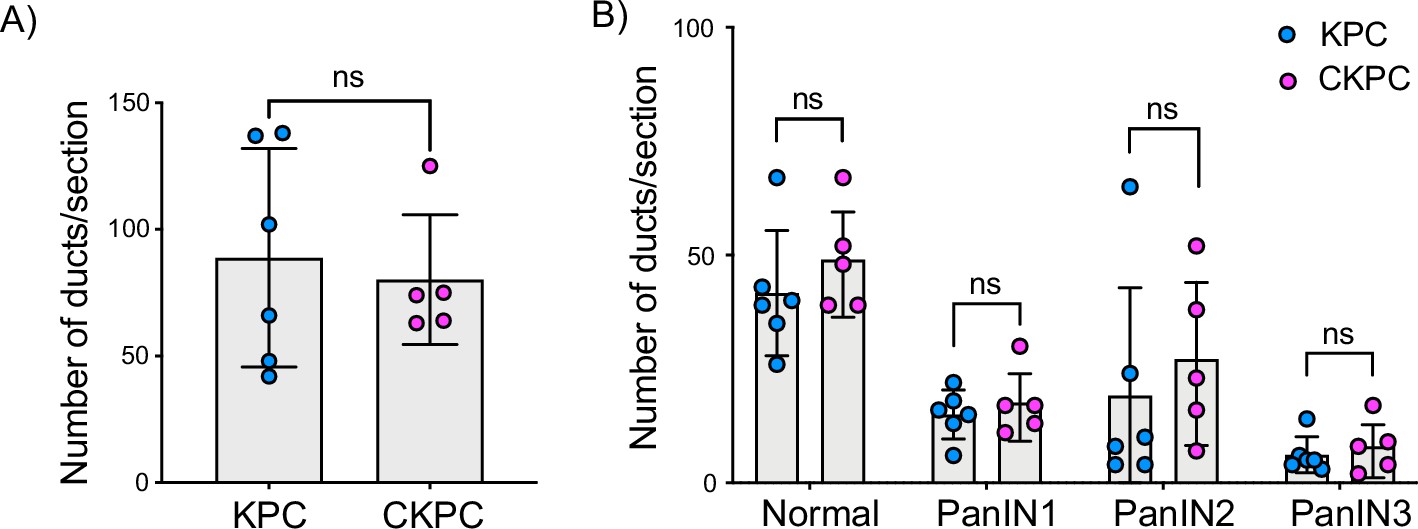
Loss of CYRI-B accelerates pancreatic intraepithelial neoplasm (PanIN) formation and increases pJNK, pERK, and proliferation.
(A) Representative haematoxylin and eosin (H&E) images from KPC mice of normal pancreatic ducts, PanIN1, -2, -3 and pancreatic ductal adenocarcinoma (PDAC) lesions. Scale bars, 100 µm. (B) Number of ducts present in pancreas from 15-week-old KPC and CKPC mice (n≥6 mice). Mean ± SD; unpaired t-test was performed. p-Value as indicated. (C) Classification and scoring of pancreatic ducts in pancreas from 15-week-old KPC and CKPC mice (n≥6 mice). Mean ± SD; unpaired t-test was performed. ns = not significant, p-value as indicated. (D) Representative images of pancreata from 15-week-old mice stained with pERK and haematoxylin (nuclei). Red arrows indicate the positive pERK staining. Scale bars, 100 µm. (E) pERK positive area from the total quantified area from (D). Mean ± SD; unpaired t-test was performed in n=7 KPC and CKPC independent mice. p-Value as indicated. (F) Representative images of pancreata from 15-week-old-mice stained with pJNK and haematoxylin (nuclei). Red arrows indicate the positive pJNK staining. Scale bars, 100 µm. (G) pJNK positive area from the total quantified area from (F). Mean ± SD; unpaired t-test was performed in n=7 KPC and CKPC independent mice. p-Value as indicated. (H) Representative images of pancreatic tissue from 15-week-old KPC and CKPC mice stained for BrdU (proliferation) and haematoxylin. Red arrows show the BrdU positive nuclei. Scale bars, 100 µm. (I) Quantification of BrdU positive nuclei from KPC and CKPC 15-week-old pancreatic tissues. Mean ± SD; unpaired t-test was performed in n=6 KPC and 5 CKPC independent mice. p-Value as indicated. (J) Quantification of the pancreas to body mass ratio at 10 weeks (n=6 mice in each mouse model) and 15 weeks (n=7 in each mouse model) in KPC and CKPC mice. Mean ± SD; unpaired t-test was performed. ns = not significant, p-value as indicated.
-
Figure 3—source data 1
Number of ductal structures per section for KPC and CKPC mice at 15 weeks.
Excel data and Prism analysis to support Figure 3B.
- https://cdn.elifesciences.org/articles/83712/elife-83712-fig3-data1-v2.zip
-
Figure 3—source data 2
Number of ductal structures per section for KPC and CKPC mice which have the grading of ‘normal’, pancreatic intraepithelial neoplasm (PanIN)1, PanIN2, PanIN3 at 15 weeks to support Figure 3C.
- https://cdn.elifesciences.org/articles/83712/elife-83712-fig3-data2-v2.zip
-
Figure 3—source data 3
Percent area stained pERK+ in tumours from KPC vs CKPC mice to support Figure 3E.
- https://cdn.elifesciences.org/articles/83712/elife-83712-fig3-data3-v2.xlsx
-
Figure 3—source data 4
Percent area stained pJNK+ in tumours from KPC vs CKPC mice.
Excel data and Prism analysis to support Figure 3G.
- https://cdn.elifesciences.org/articles/83712/elife-83712-fig3-data4-v2.zip
-
Figure 3—source data 5
Percentage area with BrdU+ nuclei in tumours from KPC vs CKPC mice.
Excel data and Prism analysis to support Figure 3I.
- https://cdn.elifesciences.org/articles/83712/elife-83712-fig3-data5-v2.zip
-
Figure 3—source data 6
Pancreas weight to body mass ratio in KPC and CKPC mice at 10 and 15 weeks.
Excel data and Prism analysis to support Figure 3J.
- https://cdn.elifesciences.org/articles/83712/elife-83712-fig3-data6-v2.zip
Figure 3—figure supplement 1
Loss of CYRI-B does not alter the formation of pancreatic intraepithelial neoplasm (PanIN) lesions in 10-week-old mice.
(A) Quantification of the number of ducts present in 10-week-old pancreas in KPC and CKPC mice (n≥5 mice). Mean ± SD; unpaired t-test was performed. ns = not significant. (B) Classification and scoring of pancreatic ducts in pancreas from 10-week-old KPC and CKPC mice (n≥5 mice). Mean ± SD; unpaired t-test was performed. ns = not significant.
-
Figure 3—figure supplement 1—source data 1
Number of ducts present in 10-week-old pancreas in KPC and CKPC mice.
Excel data and Prism analysis to support Figure 3—figure supplement 1A and B.
- https://cdn.elifesciences.org/articles/83712/elife-83712-fig3-figsupp1-data1-v2.zip
Figure 4 with 3 supplements
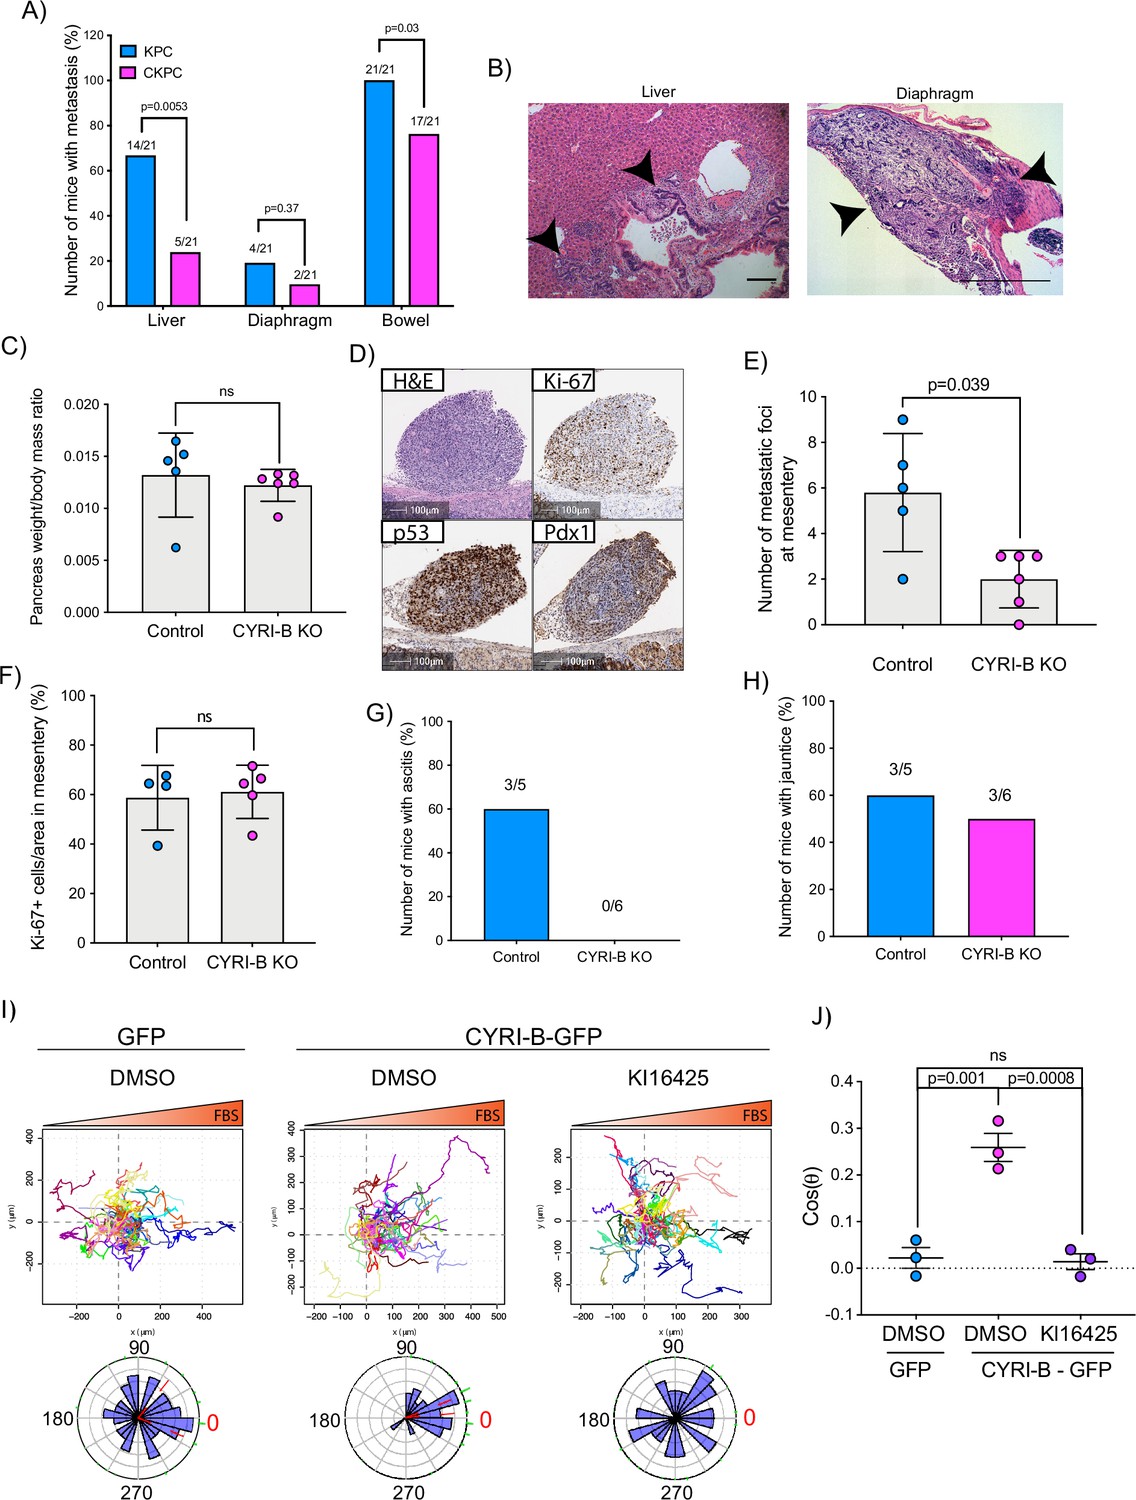
Loss of CYRI-B reduces metastasis and chemotactic potential.
(A) Incidence of KPC or CKPC mice presenting with metastasis in liver, diaphragm, and bowel. Numbers above the bars show the fraction of mice with metastasis to the indicated site. Chi-square test was performed in n=21 KPC and CKPC mice. p-Value as indicated. (B) Representative haematoxylin and eosin (H&E) images of metastasis in the liver (scale bar, 50 µm) and diaphragm (scale bar, 100 µm). Black arrowheads denote metastatic lesions. (C) Histogram showing pancreas to body mass ratios at sacrifice. Mean ± SD; Mann-Whitney test was performed in n=5 for KPC control and n=6 mice for KPC Cyrib knockout (KO) cells. p-Value: not significant (ns). (D) Representative images of the mesenteric tumour foci from the in vivo transplantation assay. The metastatic foci were stained for H&E, Ki-67 (proliferation), p53, and PDX1 (for control). Scale bars, 100 µm. (E) Histogram of the number of metastatic foci at mesentery for KPC control and KPC Cyrib KO mice. Mean ± SD; Mann-Whitney test was performed in n≥5 mice for either control or Cyrib KO KPC injected cells. p-Value as indicated. (F) Quantification of the Ki-67 positive cells in the metastatic tumour foci. Mean ± SD; Mann-Whitney test was performed in n=4 for KPC control and n=5 mice for Cyrib KO KPC cells. p-Value: not significant (ns). (G) Incidence of mice presenting ascites (n≥5). (H) Incidence of mice presenting jaundice (n≥5). (I) Representative spider plots from n=3 independent chemotaxis assays of CKPC Cyrib KO and rescued cells. A chemotactic gradient of 10% foetal bovine serum (FBS) was established and cells were imaged for 16 hr (1 frame/15 min). Cells were also treated with either DMSO or the LPAR1/3 inhibitor KI16425 (10 mM) for 1 hr prior to imaging. Each cell trajectory is displayed with a different colour and the displacement of each cell is reported in the x- and y-axis. Orange gradient above shows the FBS gradient. Rose plot data are displayed for each condition below. Red dashed lines show the 95% confidence interval for the mean direction in the rose plots. The numbers represent degrees of the angle of migration relative to the chemoattractant gradient, with zero (red) denoting the direction of the chemoattractant gradient. (J) Quantification of the results in (I) showing the cos(θ) data (chemotactic index). Mean ± SEM from the average cos(θ) data of every repeat; one-way ANOVA followed by Tukey’s multiple comparisons test was performed. p-Values as indicated on the graph, ns = not significant.
-
Figure 4—source data 1
Spreadsheet with numerical data from Figure 4C, E–H.
Pancreas weight to body mass ratio in mice transplanted intraperitoneally with control KPC cells vs Cyrib knockout cells (Figure 4C). Number of mesenteric metastatic foci in mice transplanted intraperitoneally with control KPC cells vs Cyrib knockout cells (Figure 4E). Percentage of Ki67+ tumour cells in mesentery of mice transplanted intraperitoneally with control KPC cells vs Cyrib knockout cells (Figure 4F). Number of mice with ascites (Figure 4G). Number of mice with jaundice (Figure 4H). Excel data and Prism analysis to support Figure 4C, E–H.
- https://cdn.elifesciences.org/articles/83712/elife-83712-fig4-data1-v2.zip
-
Figure 4—source data 2
Cos(θ) calculated for the chemotaxis assays shown in Figure 4I.
Excel data and Prism analysis to support Figure 4J.
- https://cdn.elifesciences.org/articles/83712/elife-83712-fig4-data2-v2.zip
Figure 4—figure supplement 1

Deletion of CYRI-B in KPC-1 cells does not affect proliferation.
(A) Representative western blot from KPC-1 cells for CYRI-B knockout (KO). Empty vector was used as control. For Cyrib KO, Ex3 and Ex4 sequences were used. Alpha-tubulin was used as loading control. Molecular weights as indicated on the side. (B) Proliferation assay of control or Cyrib KO KPC-1 cells from (A). 104 cells were seeded on day 1 and manually counted every day. Error bars represent mean ± SEM from n=3 independent repeats.
-
Figure 4—figure supplement 1—source data 1
Scans of original western blots unlabelled and labelled to support Figure 4—figure supplement 1A.
- https://cdn.elifesciences.org/articles/83712/elife-83712-fig4-figsupp1-data1-v2.zip
-
Figure 4—figure supplement 1—source data 2
Growth curve displaying number of cells over time for control or EX3, EX4 CYRI knockout cells.
Excel data and Prism analysis to support Figure 4—figure supplement 1B.
- https://cdn.elifesciences.org/articles/83712/elife-83712-fig4-figsupp1-data2-v2.zip
Figure 4—figure supplement 2
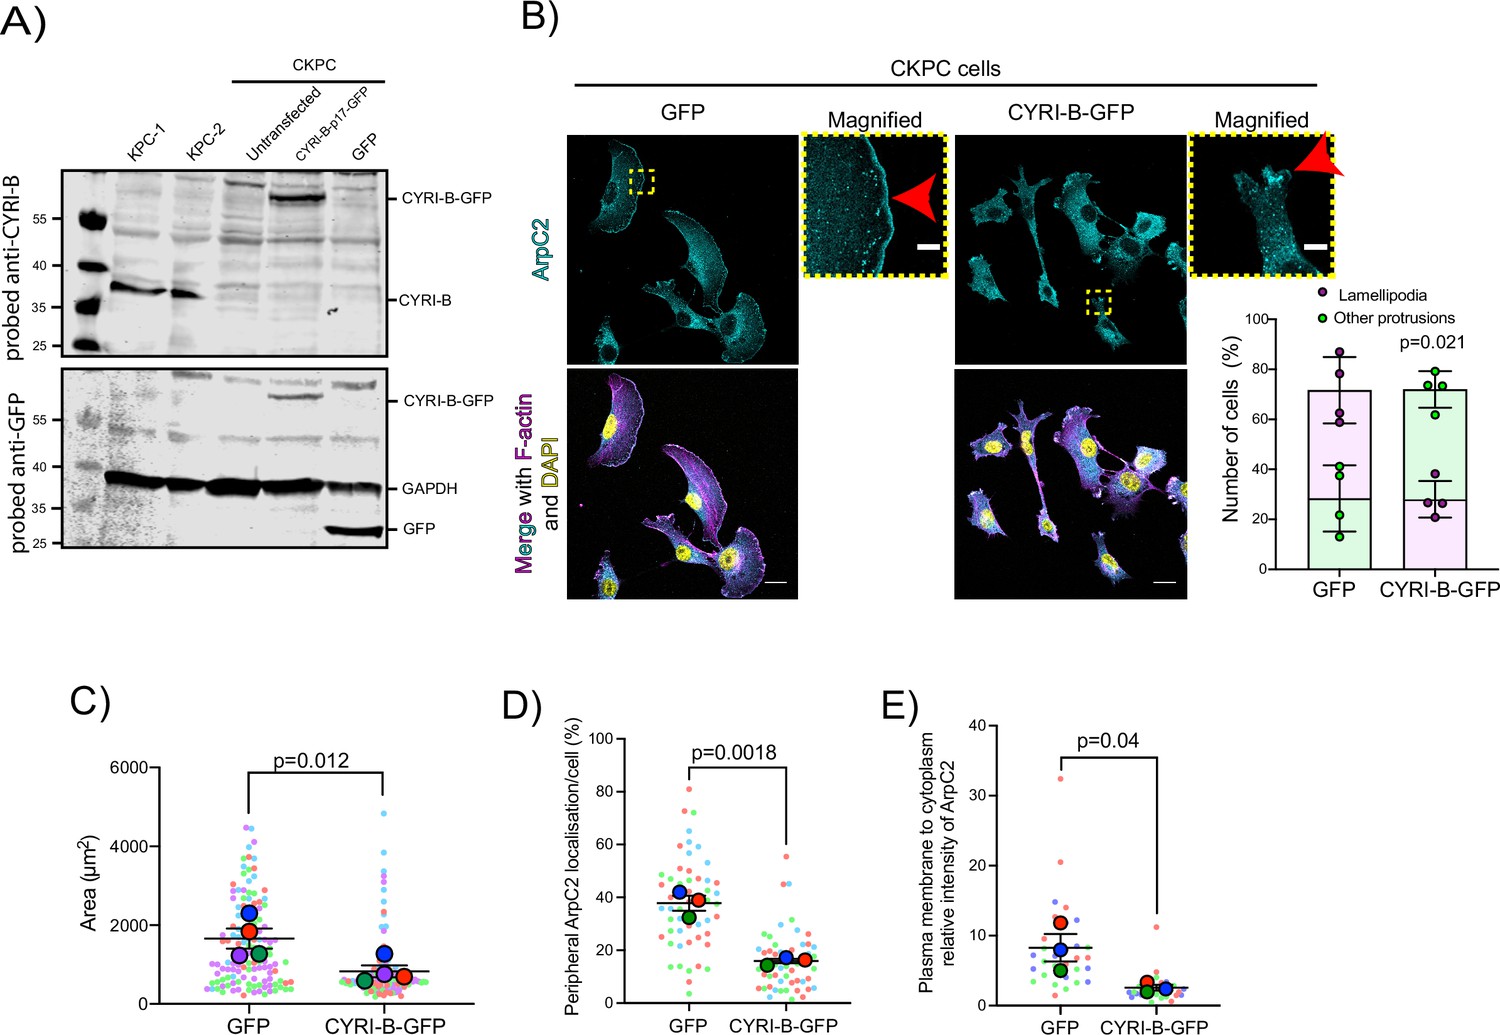
Loss of CYRI-B results in enhanced spreading and Arp2/3 leading edge recruitment in pancreatic ductal adenocarcinoma (PDAC) cells.
(A) Western blot images of CKPC-1 cells stably expressing CYRI-B-p17-GFP or GFP. KPC-1 and KPC-2 cell lines were used as control. Untransfected CKPC cells were also used as a control. Membranes were probed for anti-GFP (bottom blot) and anti-CYRI-B (top blot). GAPDH was used as loading control. Molecular weights are displayed on the side. (B) Representative immunofluorescence images of CKPC Cyrib knockout (KO) and rescued cells. Cells were seeded on fibronectin-coated coverslips, fixed and stained for F-actin (magenta), ArpC2 (cyan), and DAPI for nuclei (yellow). Scale bars, 20 μm. Yellow dotted boxes show the sites for the magnified images. Red arrows show the positive area for ArpC2 staining at the leading edge. Scale bars, 5 μm. Graph shows manual quantification of the number of cells presenting with lamellipodia (purple) or other protrusions (green) from (B). Mean ± S.D; paired t-test was performed in n=4. p-Value as indicated. (C) Quantification of cell area per cell from (B) based on the F-actin staining. Scatter plot here is presented as super plot and every independent biological repeat is coloured differently. Mean ± SEM; paired t-test was performed in n=4. p-Value as indicated. (D) Manual quantification of the length of the cell periphery showing strong ArpC2 accumulation, normalised to the total cell periphery. Scatter plot here is presented as a super plot and every independent biological repeat is coloured differently. Mean ± SEM; unpaired t-test was performed in n=3 (from a total of 30 cells). p-Value as indicated. (E) Manual quantification of the relative intensity of ArpC2 on the plasma membrane to cytoplasmic average intensity. Scatter plot here is presented as a super plot and every independent biological repeat is coloured differently. Mean ± SEM; unpaired t-test was performed in n=3. p-Value as indicated.
-
Figure 4—figure supplement 2—source data 1
Scans of original western blots unlabelled and labelled to support Figure 4—figure supplement 2A.
- https://cdn.elifesciences.org/articles/83712/elife-83712-fig4-figsupp2-data1-v2.zip
-
Figure 4—figure supplement 2—source data 2
Number of cells presenting with lamellipodia or other protrusions in CYRI-B knockout (GFP) vs CYRI-B-GFP rescued (CYRI-B-GFP) cells.
Excel data and Prism analysis to support Figure 4—figure supplement 2B.
- https://cdn.elifesciences.org/articles/83712/elife-83712-fig4-figsupp2-data2-v2.zip
-
Figure 4—figure supplement 2—source data 3
Area per cell in CYRI-B knockout (GFP) vs CYRI-B-GFP rescued (CYRI-B-GFP) cells (Figure 4, Figure 4—figure supplement 2C).
- https://cdn.elifesciences.org/articles/83712/elife-83712-fig4-figsupp2-data3-v2.zip
-
Figure 4—figure supplement 2—source data 4
Percentage of the periphery staining positive for ArpC2 in CYRI-B knockout (GFP) vs CYRI-B-GFP rescued (CYRI-B-GFP) cells.
Excel data and Prism analysis to support Figure 4—figure supplement 2D.
- https://cdn.elifesciences.org/articles/83712/elife-83712-fig4-figsupp2-data4-v2.zip
-
Figure 4—figure supplement 2—source data 5
Plasma membrane to cytoplasm relative intensity of ArpC2 in CYRI-B knockout (GFP) vs CYRI-B-GFP rescued (CYRI-B-GFP) cells.
Excel data and Prism analysis to support Figure 4—figure supplement 2E.
- https://cdn.elifesciences.org/articles/83712/elife-83712-fig4-figsupp2-data5-v2.zip
Figure 4—figure supplement 3
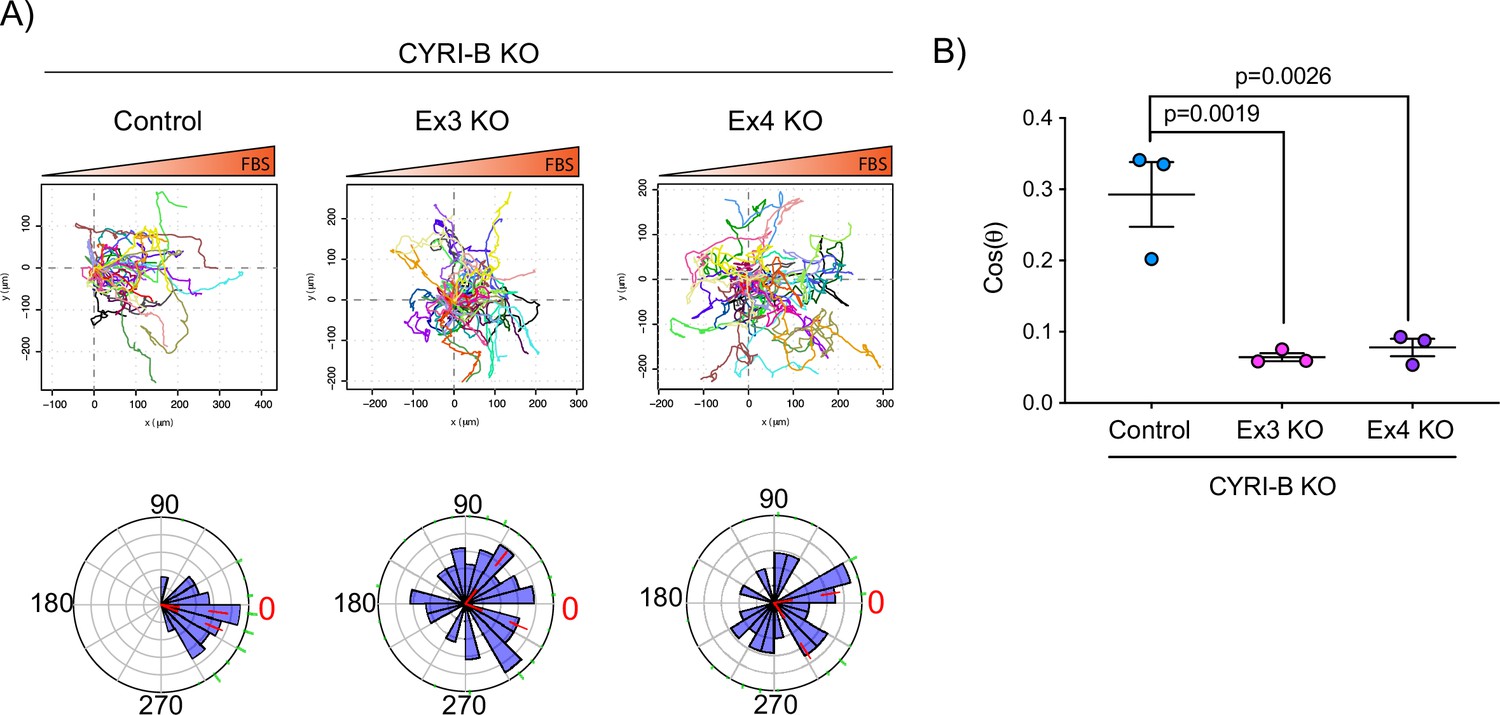
Deletion of CYRI-B abolishes chemotaxis.
(A) Representative spider plots from n=3 independent chemotaxis assays of KPC-1 control or Cyrib knockout (KO) (EX3 and EX4) cells. Cells were seeded on fibronectin-coated coverslips and the ‘Insall’ chamber was assembled. A chemotactic gradient of 10% foetal bovine serum (FBS) was established and cells were imaged for 16 hr (1 frame/15 min). Every cell trajectory is displayed with a different colour and the displacement of each cell is reported in the x- and y-axis. Orange gradient above shows the FBS gradient. Rose plot data are displayed for each condition below. Red dashed lines show the 95% confidence interval for the mean direction in the rose plots. The numbers represent degrees of the angle of migration relative to the chemoattractant, with zero (red) denoting the direction of the chemoattractant gradient. (B) Quantification of the results in (A) showing the cos(θ) data (chemotactic index). Mean ± SEM from the average cos(θ) data of every repeat; one-way ANOVA followed by Tukey’s multiple comparisons test was performed. Red dashed lines were indicated and show the 95% confidence interval for the mean direction in the rose plots. p-Values as indicated on the graph.
-
Figure 4—figure supplement 3—source data 1
Cos(θ) calculated from the chemotaxis assays shown in Figure 4—figure supplement 3A.
- https://cdn.elifesciences.org/articles/83712/elife-83712-fig4-figsupp3-data1-v2.zip
Figure 5 with 2 supplements
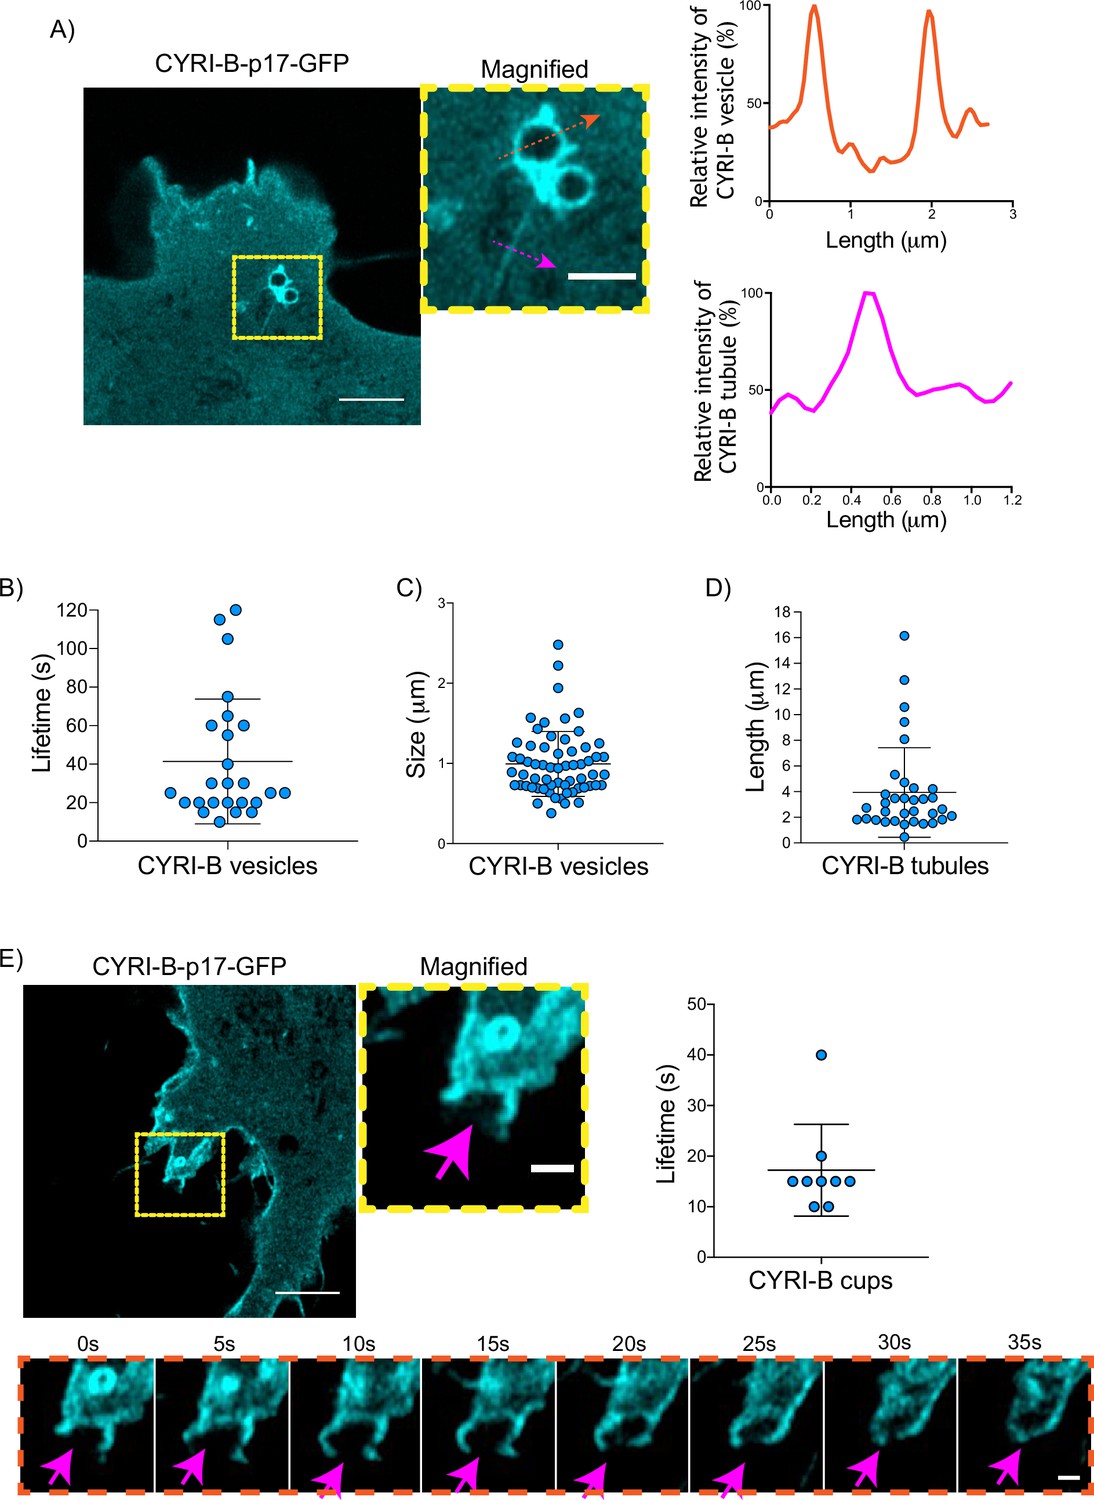
CYRI-B is localised at intracellular vesicles, tubules, and membrane cups.
(A) Still image from live-cell videos of COS-7 Cyrib knockout (KO) cells transfected with CYRI-B-p17-GFP (cyan) - see Figure 5—video 1. Scale bar, 5 μm. Yellow box denotes magnified area. Magenta and orange arrows show the quantification area. Scale bar, 1 μm. Right panels show the quantifications of the relative intensity of the vesicles/cups and tubules. Image and quantification are representative of n=25 vesicles from a total of 10 cells, over 3 independent biological repeats. (B) Scatter plot of the lifetime of vesicles from (A). Error bars show the mean ± SD. (C) Scatter plot of the size (diameter) of CYRI-B positive vesicles from (A). Error bars show the mean ± SD. (D) Scatter plot of the length of CYRI-B tubules from (A). Error bars show the mean ± SD. (E) Still image from live-cell videos of COS-7 CYRI-B KO cells transfected with CYRI-B-p17-GFP (cyan), showing a macropinocytic cup - see Figure 5—video 2. Scale bar, 5 μm. Yellow box denotes magnified area. Magenta arrows show the quantification area. Scale bar, 1 μm. Scatter plot on the right panel shows the lifetime of the CYRI-B cups. Error bars show the mean ± SD. Orange dotted box shows the montage of the CYRI-B cup over time (s). Scale bar, 1 μm. Magenta arrows show the area of interest. Image and quantification are representative of n=9 events from a total of 4 cells.
-
Figure 5—source data 1
Lifetime in seconds of CYRI-B+ vesicles (Figure 5B).
- https://cdn.elifesciences.org/articles/83712/elife-83712-fig5-data1-v2.zip
-
Figure 5—source data 2
Size in µm of CYRI-B+ vesicles (Figure 5C).
- https://cdn.elifesciences.org/articles/83712/elife-83712-fig5-data2-v2.zip
-
Figure 5—source data 3
Length in µm of CYRI-B+ tubules (Figure 5D).
- https://cdn.elifesciences.org/articles/83712/elife-83712-fig5-data3-v2.zip
-
Figure 5—source data 4
Lifetime in seconds of CYRI-B cups.
Excel data and Prism analysis to support Figure 5E.
- https://cdn.elifesciences.org/articles/83712/elife-83712-fig5-data4-v2.zip
Figure 5—video 1
CYRI-B is localised at internal vesicles and tubules.
Live-cell video of COS-7 Cyrib knockout (KO) cells transfected with CYRI-B-p17-GFP (cyan).
Time interval, 5 s. Scale bar, 5 μm.
Figure 5—video 2
CYRI-B is localised at membrane cups.
Live-cell video of COS-7 CYRI-B knockout (KO) cells transfected with CYRI-B-p17-GFP (cyan).
Time interval, 5 s. Scale bar, 2 μm.
Figure 6 with 3 supplements
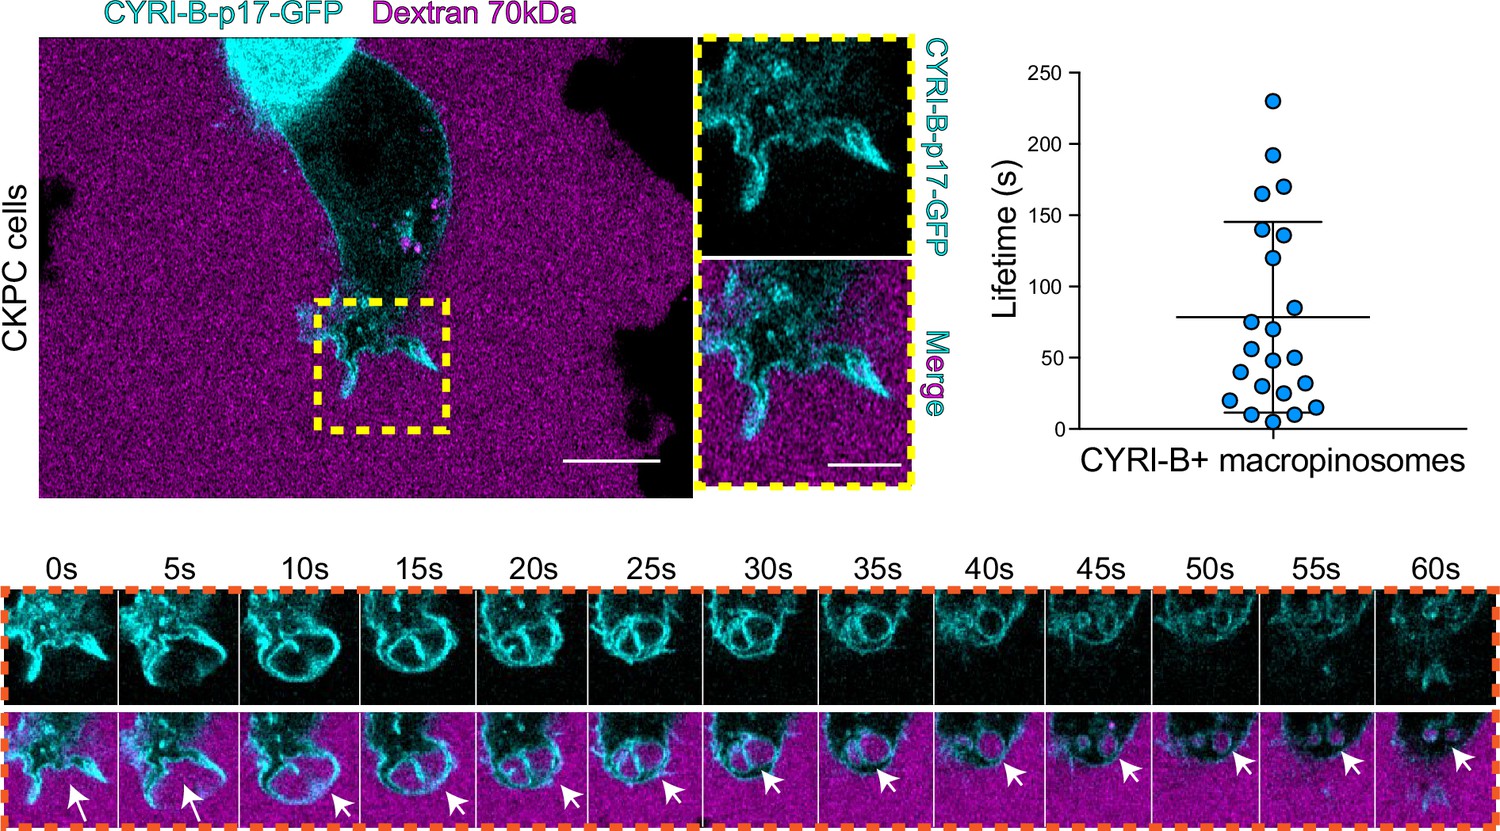
CYRI-B is recruited to macropinocytic cups.
Still image from live-cell imaging of CKPC-CYRI-B-GFP stable cell lines (cyan) - see Figure 6—video 1. 70 kDa Dextran was added to the medium to visualise macropinocytic events (magenta). Scale bar, 10 μm. Yellow box shows the magnified area of interest, showing the macropinocytic cups. Scale bar, 5 μm. Scatter plot represents the lifetime of CYRI-B+ macropinosomes once internalised. Mean ± SD. Orange box shows a representative montage of CYRI-B internalisation via macropinocytosis. Scale bar, 1 μm. White arrows show CYRI-B localisation at the cups and the macropinosomes once internalised. n=21 events from a total of 6 cells.
-
Figure 6—source data 1
Lifetime in seconds of CYRI-B+ macropinosomes.
Excel data and Prism analysis to support Figure 6.
- https://cdn.elifesciences.org/articles/83712/elife-83712-fig6-data1-v2.zip
Figure 6—figure supplement 1
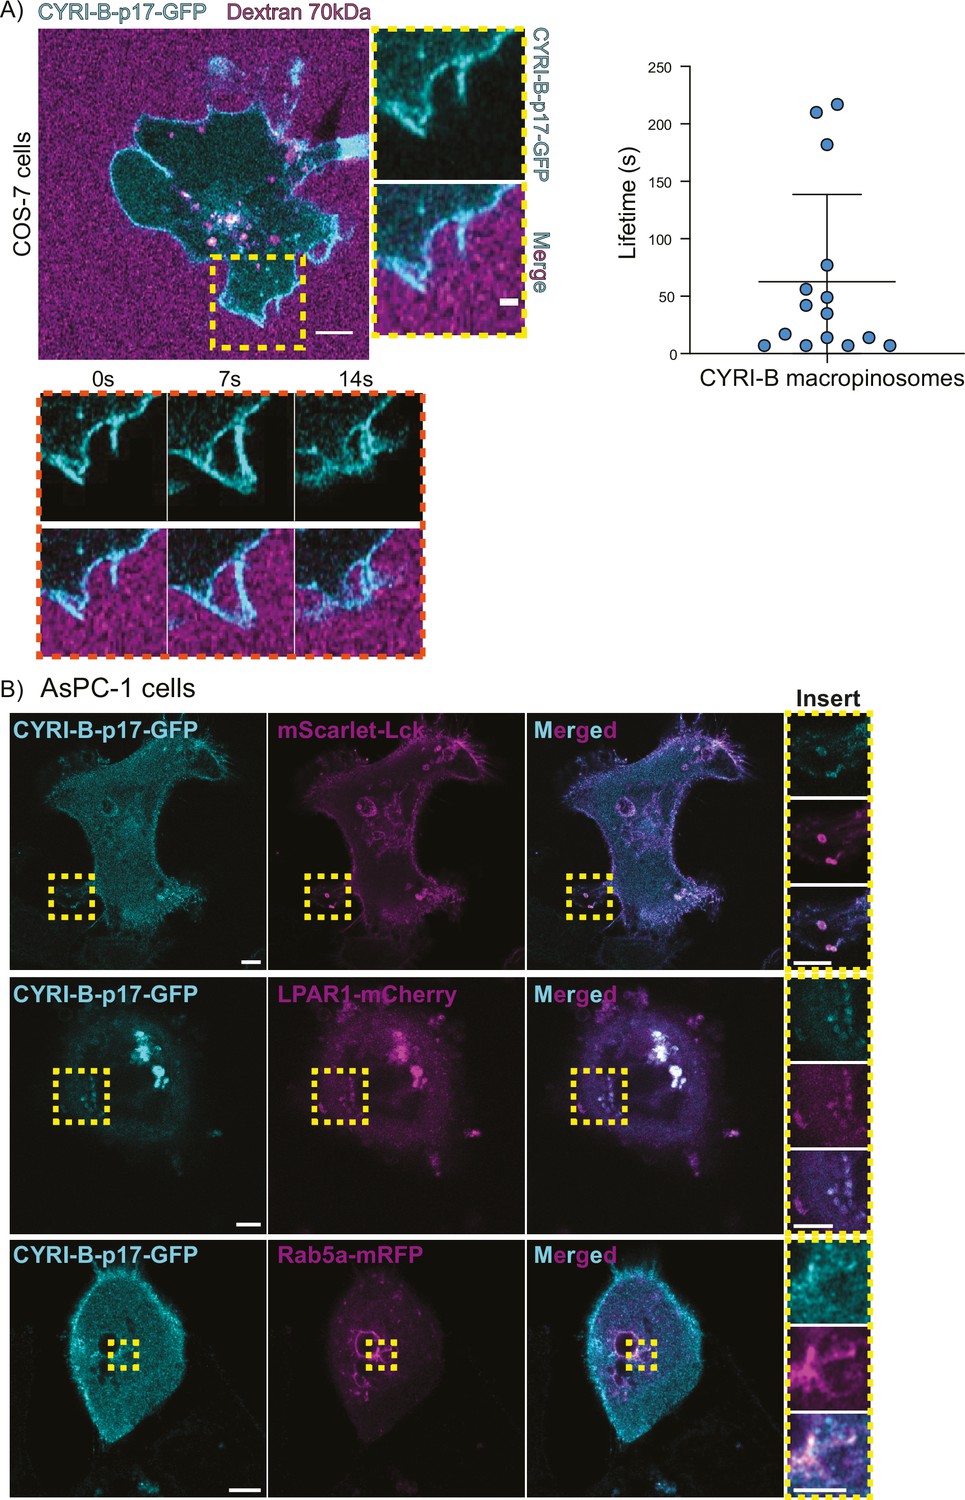
CYRI-B localises at macropinocytic cups in COS-7 cells.
(A) Still image from live-cell imaging of COS-7 Cyrib knockout (KO) cells transfected with CYRI-B-p17-GFP (cyan) (see also Figure 6—video 1). 70 kDa Dextran was added to the medium to visualise the macropinocytic events (magenta). Scale bar, 5 μm. Yellow box shows the magnified area of interest, showing the macropinocytic cups. Scale bar, 5 μm. Scatter plot represents the lifetime of CYRI-B+ macropinosomes once internalised. Mean ± SD. Orange box shows a representative montage of CYRI-B internalisation via macropinocytosis. n=15 events from a total of 6 cells. (B) Representative confocal images of AsPC1 cells transiently transfected with a combination of CYRI-B-p17-GFP (cyan) and mScarlet-Lck (top panel), LPAR1-mCherry (middle panel), or Rab5a-mCherry (bottom panel) (magenta) (see also Figure 6—video 2). Scale bar, 5 μm. Yellow boxes show the magnified area of interest, showing the co-localisation between CYRI-B and mScarlet-Lck, LPAR1-mCherry, or Rab5a-mCherry at macropinosomes. Scale bar, 5 μm except for Rab5a-mCherry. Scale bar, 2.5 μm.
-
Figure 6—figure supplement 1—source data 1
Lifetime in seconds of CYRI-B+ macropinosomes to support Figure 6—figure supplement 1A.
- https://cdn.elifesciences.org/articles/83712/elife-83712-fig6-figsupp1-data1-v2.zip
Figure 6—video 1
CYRI-B is localised at macropinocytic cups in COS-7 cells.
Live-cell video of COS-7 Cyrib knockout (KO) cells transfected with CYRI-B-p17-GFP (cyan). 70 kDa Dextran (magenta) was added to the medium as a marker of macropinocytosis. Time interval, 7 s. Scale bar, 2 μm.
Figure 6—video 2
CYRI-B is recruited to macropinocytic cups.
Live-cell video of AsPC-1 cells transfected with CYRI-B-p17-GFP (cyan) and mScarlet-Lck (magenta). Time interval, 10 s. Scale bar, 5 μm.
Figure 7 with 2 supplements
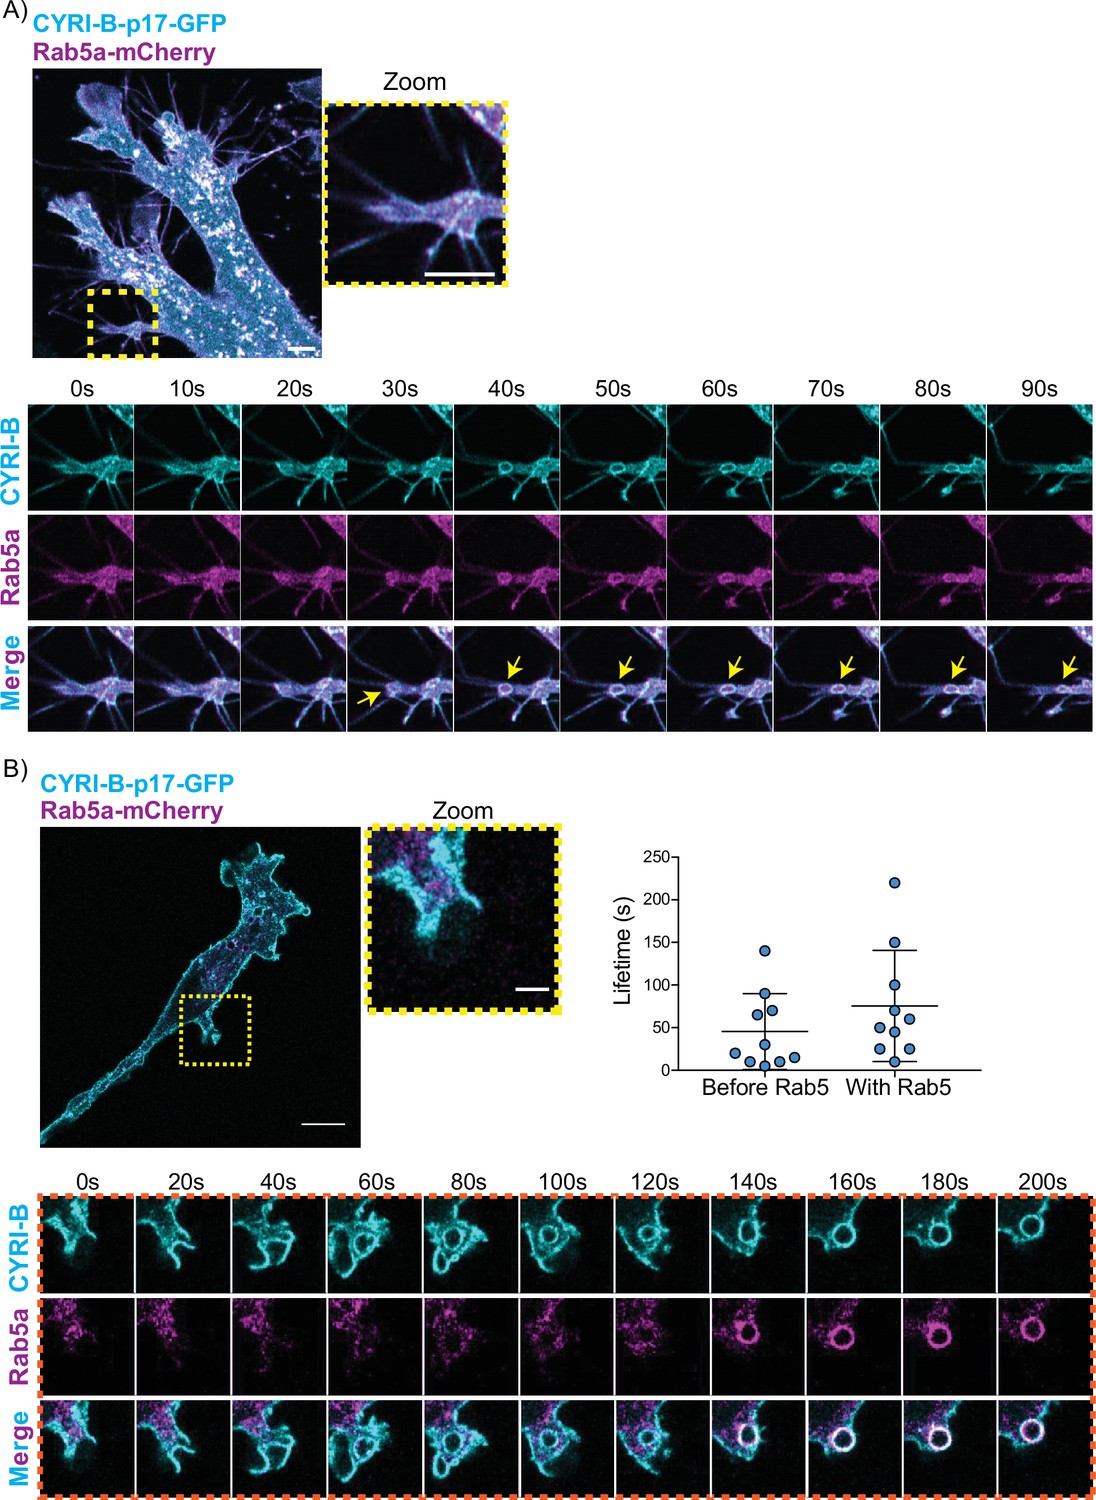
CYRI-B precedes Rab5 recruitment.
(A) Still image from live-cell imaging of AsPC1 cells transiently transfected with CYRI-B-p17-GFP (cyan) and Rab5-mCherry (magenta) - see Figure 7—video 1. Scale bar, 5 μm. Yellow box shows the magnified area of interest, showing the macropinocytic cups. Scale bar, 5 μm. Yellow arrows show macropinosome. (B) Still image from live-cell imaging of COS-7 Cyrib knockout (KO) cells transfected with CYRI-B-p17-GFP (cyan) and mRFP-Rab5 (magenta) - see Figure 7—video 2. Scale bar, 10 μm. Yellow box show the magnified area of interest, showing the macropinocytic cups. Scale bar, 5 μm. Orange boxes show a representative montage of CYRI-B internalisation and the recruitment of Rab5 at the nascent macropinosomes. Scale bar, 5 μm. Scatter plots represent the lifetime of CYRI-B+ macropinosomes once internalised before and after Rab5 recruitment. Error bars show the mean ± SD; n=10 events from a total of 6 cells.
-
Figure 7—source data 1
Lifetime in seconds of CYRI-B+ macropinocytic structures before Rab5 arrival and after Rab5 arrival.
Excel data and Prism analysis to support Figure 7B.
- https://cdn.elifesciences.org/articles/83712/elife-83712-fig7-data1-v2.zip
Figure 7—video 1
CYRI-B is localised at Rab5a positive macropinosomes in AsPC-1 cells.
Live-cell video of AsPC-1 cells transfected with CYRI-B-p17-GFP (cyan) and Rab5a-mCherry (magenta). Time interval, 10 s. Scale bar, 5 μm.
Figure 7—video 2
CYRI-B is recruited to macropinocytic cups and precedes Rab5 recruitment.
Live-cell video of COS-7 Cyrib knockout (KO) cells transfected with CYRI-B-p17-GFP (cyan) and mRFP-Rab5 (magenta). Time interval, 10 s. Scale bar, 5 μm.
Figure 8 with 3 supplements
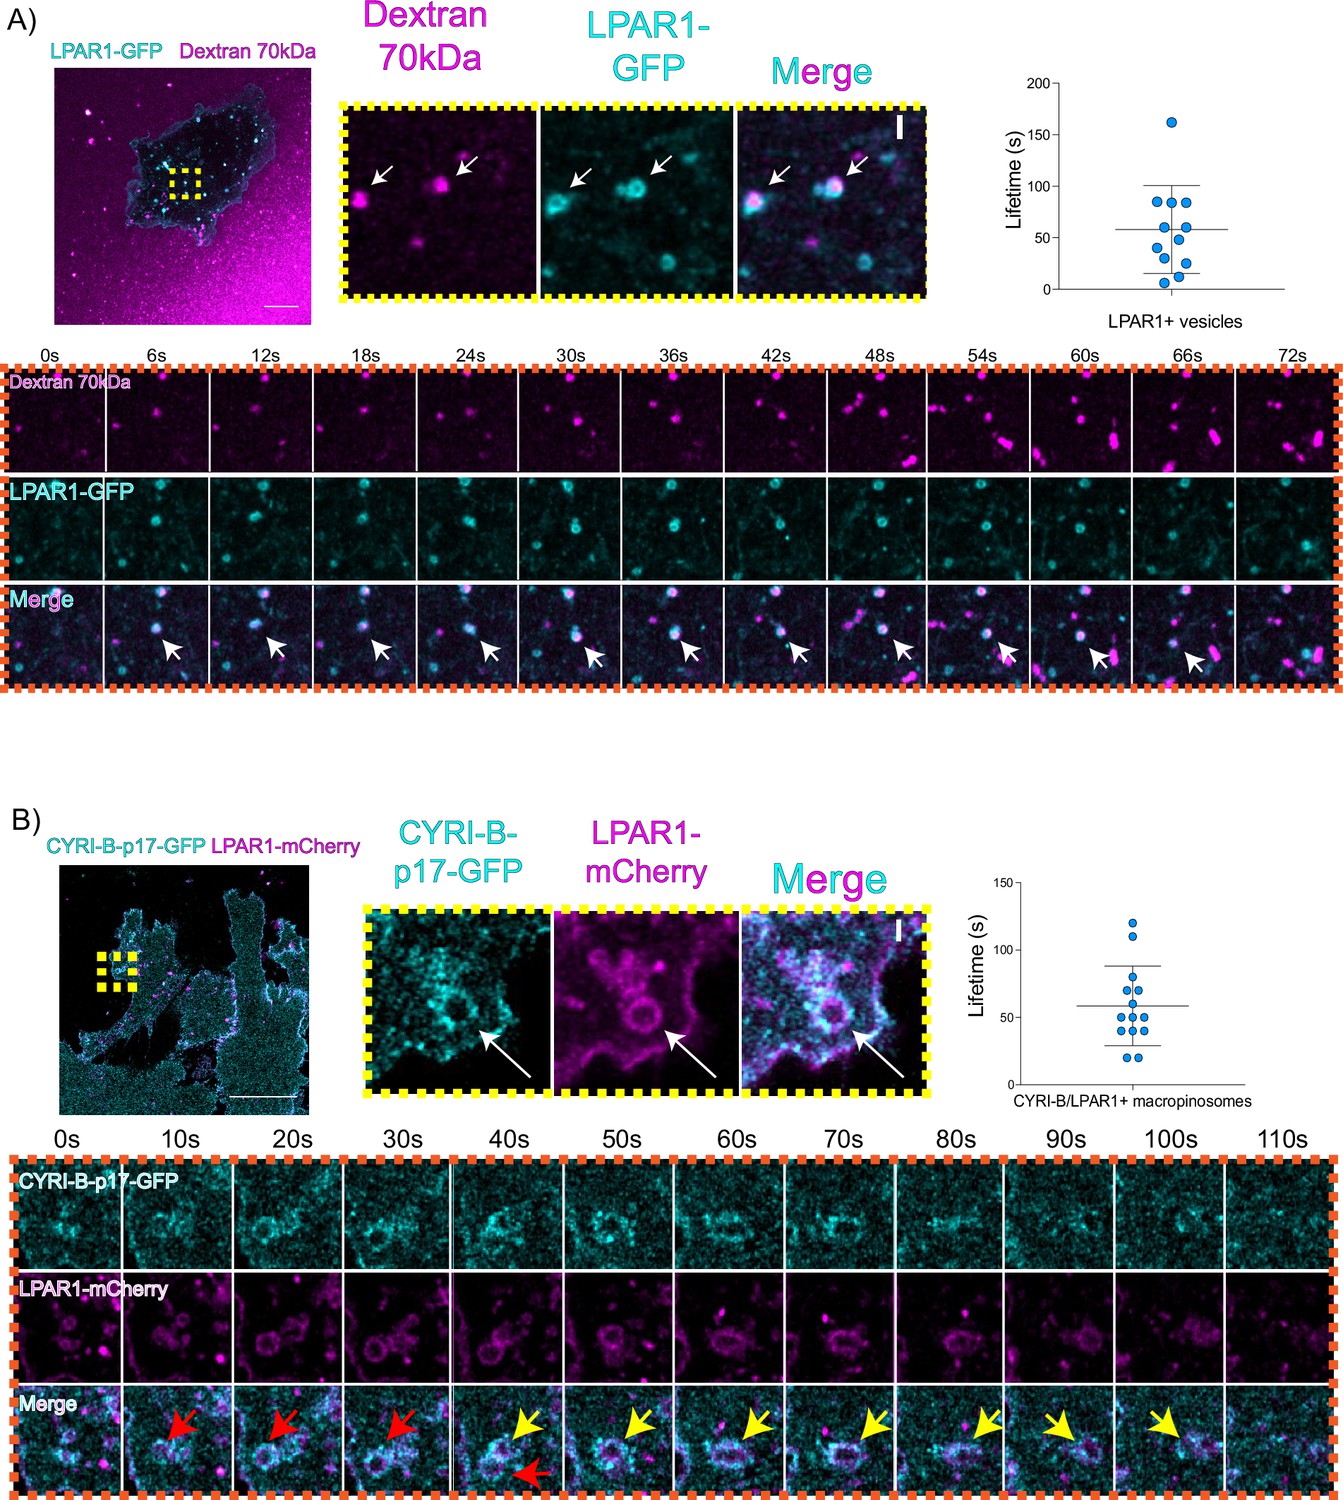
LPAR is internalised via CYRI-B positive macropinocytosis.
(A) Still images from live-cell imaging of COS-7 cells transfected with LPAR1-GFP (cyan) - see Figure 8—video 1. 70 kDa Dextran was added to the medium to visualise the macropinosomes (magenta). Scale bar, 10 μm. Yellow box shows the magnified area of interest, showing the LPAR1+ macropinocytic vesicles/cups. White arrows denote structures of interest. Scale bar, 1 μm. Scatter plot represents the lifetime of LPAR1+ vesicles once internalised. Mean ± SD. Orange box shows a representative montage of LPAR1 internalisation via macropinocytosis. Scale bar, 1 μm. White arrows show the vesicle of interest. n=12 events from a total of 3 cells. (B) Still image from live-cell imaging of CKPC-1 cells transfected with CYRI-B-p17-GFP (cyan) and LPAR1-mCherry (magenta) - see Figure 8—video 2. Scale bar, 20 μm. Yellow box shows the magnified area of interest, showing the LPAR1 co-localisation with CYRI-B+ macropinosomes. White arrows show the vesicle of interest. Scale bar, 1 µm. Scatter plot represents the lifetime of LPAR1 and CYRI-B vesicles once internalised. Mean ± SD. Orange box shows a representative montage of LPAR1 and CYRI-B internalisation. Red and yellow arrows show the vesicles of interest. n=14 events from a total of 4 cells.
-
Figure 8—source data 1
Lifetime data for LPAR1+ vesicles.
Excel data and Prism analysis to support Figure 8A.
- https://cdn.elifesciences.org/articles/83712/elife-83712-fig8-data1-v2.zip
-
Figure 8—source data 2
Lifetime data for LPAR1/CYRI-B+ vesicles.
Excel data and Prism analysis to support Figure 8B.
- https://cdn.elifesciences.org/articles/83712/elife-83712-fig8-data2-v2.zip
Figure 8—figure supplement 1
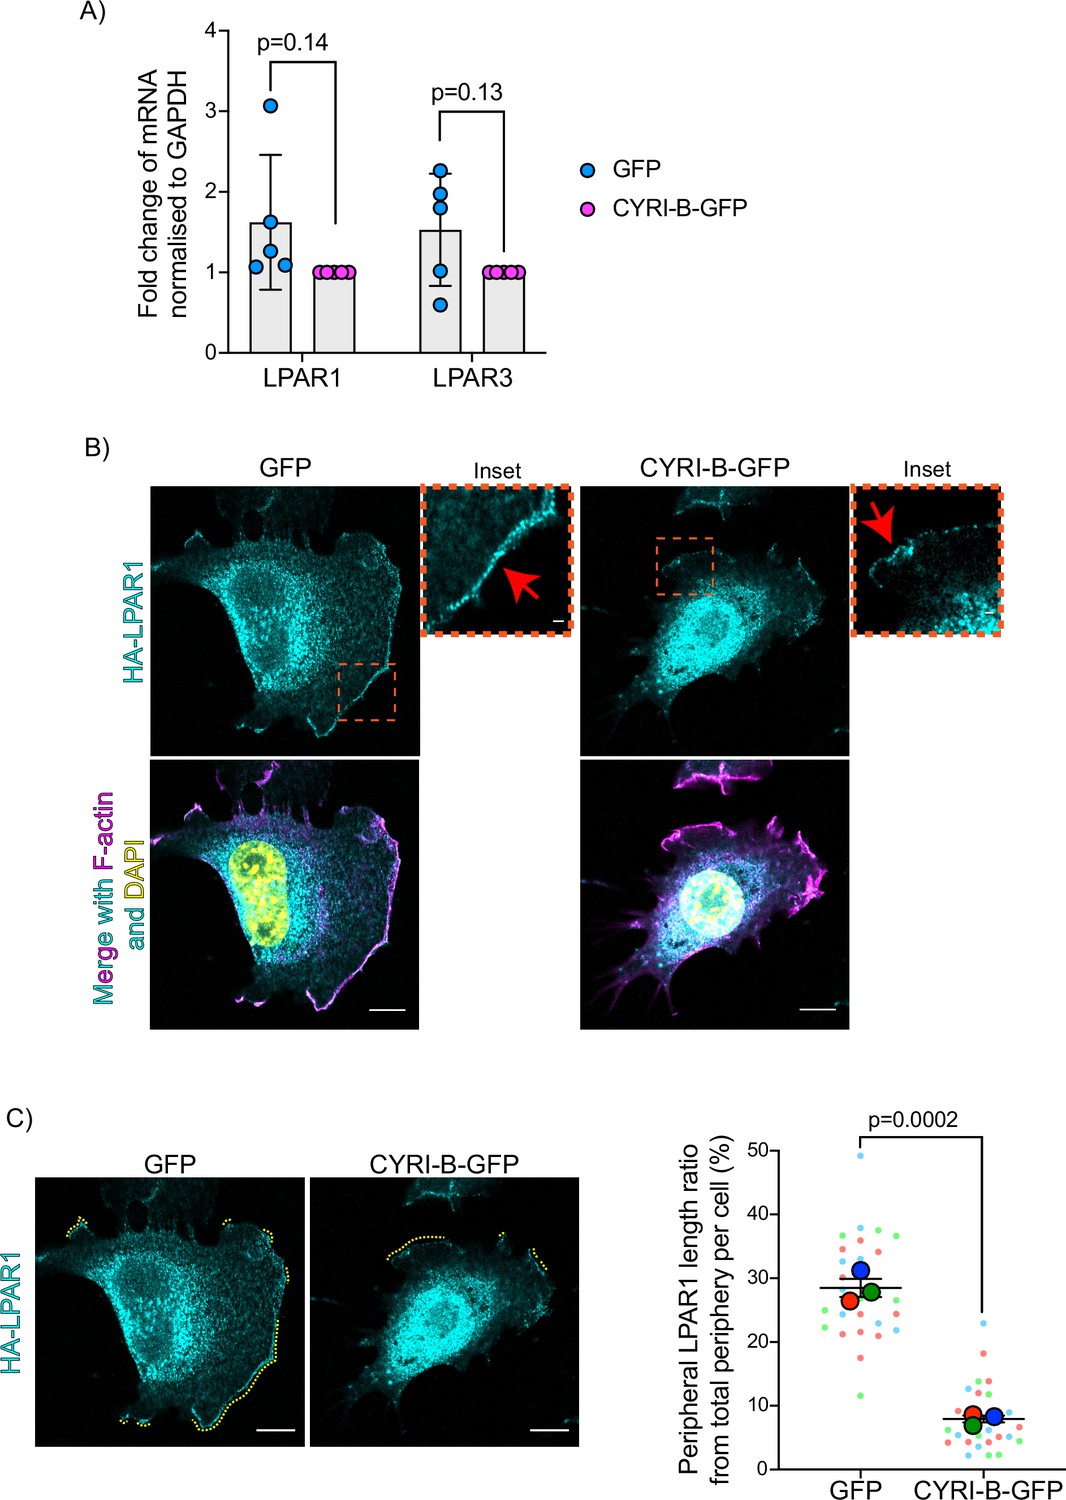
Loss of CYRI-B alters membrane localisation of LPAR1 but not its expression.
(A) Quantitative polymerase chain reaction (qPCR) analysis for endogenous gene expression of LPAR1 and LPAR3 in CKPC-1 stable cells either transfected with GFP or CYRI-B-GFP. The histogram shows the relative mRNA expression from rescued CYRI-B-GFP and normalised from GAPDH expression. Error bars show the mean ± SD; unpaired t-test was performed in n=5 independent repeats. p-Value as indicated. (B) Representative immunofluorescence images of CKPC-1 Cyrib knockout (KO) and rescued cells. Cells were transfected with LPAR1-HA, then seeded on fibronectin-coated coverslips, fixed and stained for F-actin (magenta), anti-HA (cyan), and DAPI for nuclei (yellow). Scale bars, 10 μm. Orange dotted boxes show the sites for the magnified images (inset). Red arrows show the positive area for LPAR1 staining at the leading edge. Scale bars, 1 μm. (C) Representative immunofluorescence images from (B) as an example of how analysis was performed. Yellow dotted lines show the LPAR1-positive area at the periphery of the cells. Right panel shows the manual quantification of the length of LPAR1 in the periphery of the cells, normalised to the total cell length. Scatter plot here is presented as super plots and every independent biological repeat is coloured differently. Mean ± SEM; unpaired t-test was performed in n=3 (from a total of 28 cells). p-Value as indicated. Scale bars, 10 μm.
-
Figure 8—figure supplement 1—source data 1
Fold-change of mRNA for LPAR1/LPAR1 normalised to GAPDH for CYRI-B knockout (GFP) and CYRI-B rescued (CYRI-B-GFP) cells.
Excel and Prism data to support Figure 8—figure supplement 1A.
- https://cdn.elifesciences.org/articles/83712/elife-83712-fig8-figsupp1-data1-v2.zip
-
Figure 8—figure supplement 1—source data 2
Percent of cell periphery showing LPAR1+ staining in CYRI-B knockout (GFP) vs CYRI-B rescue (CYRI-B-GFP) cells.
Excel and Prism data to support Figure 8—figure supplement 1C.
- https://cdn.elifesciences.org/articles/83712/elife-83712-fig8-figsupp1-data2-v2.xlsx
Figure 8—video 1
LPAR1 internalises via macropinocytosis.
Live-cell video of COS-7 cells transfected with LPAR1-GFP (cyan). 70 kDa Dextran was added to the medium to visualise the macropinosomes (magenta). Time interval, 6 s. Scale bar, 2 μm.
Figure 8—video 2
LPAR1 internalises via CYRI-B positive macropinosomes.
Live-cell video of CKPC-1 cells transfected with CYRI-B-p17-GFP (cyan) and LPAR1-mCherry (magenta). Time interval, 10 s. Scale bar, 5 μm.
Figure 9
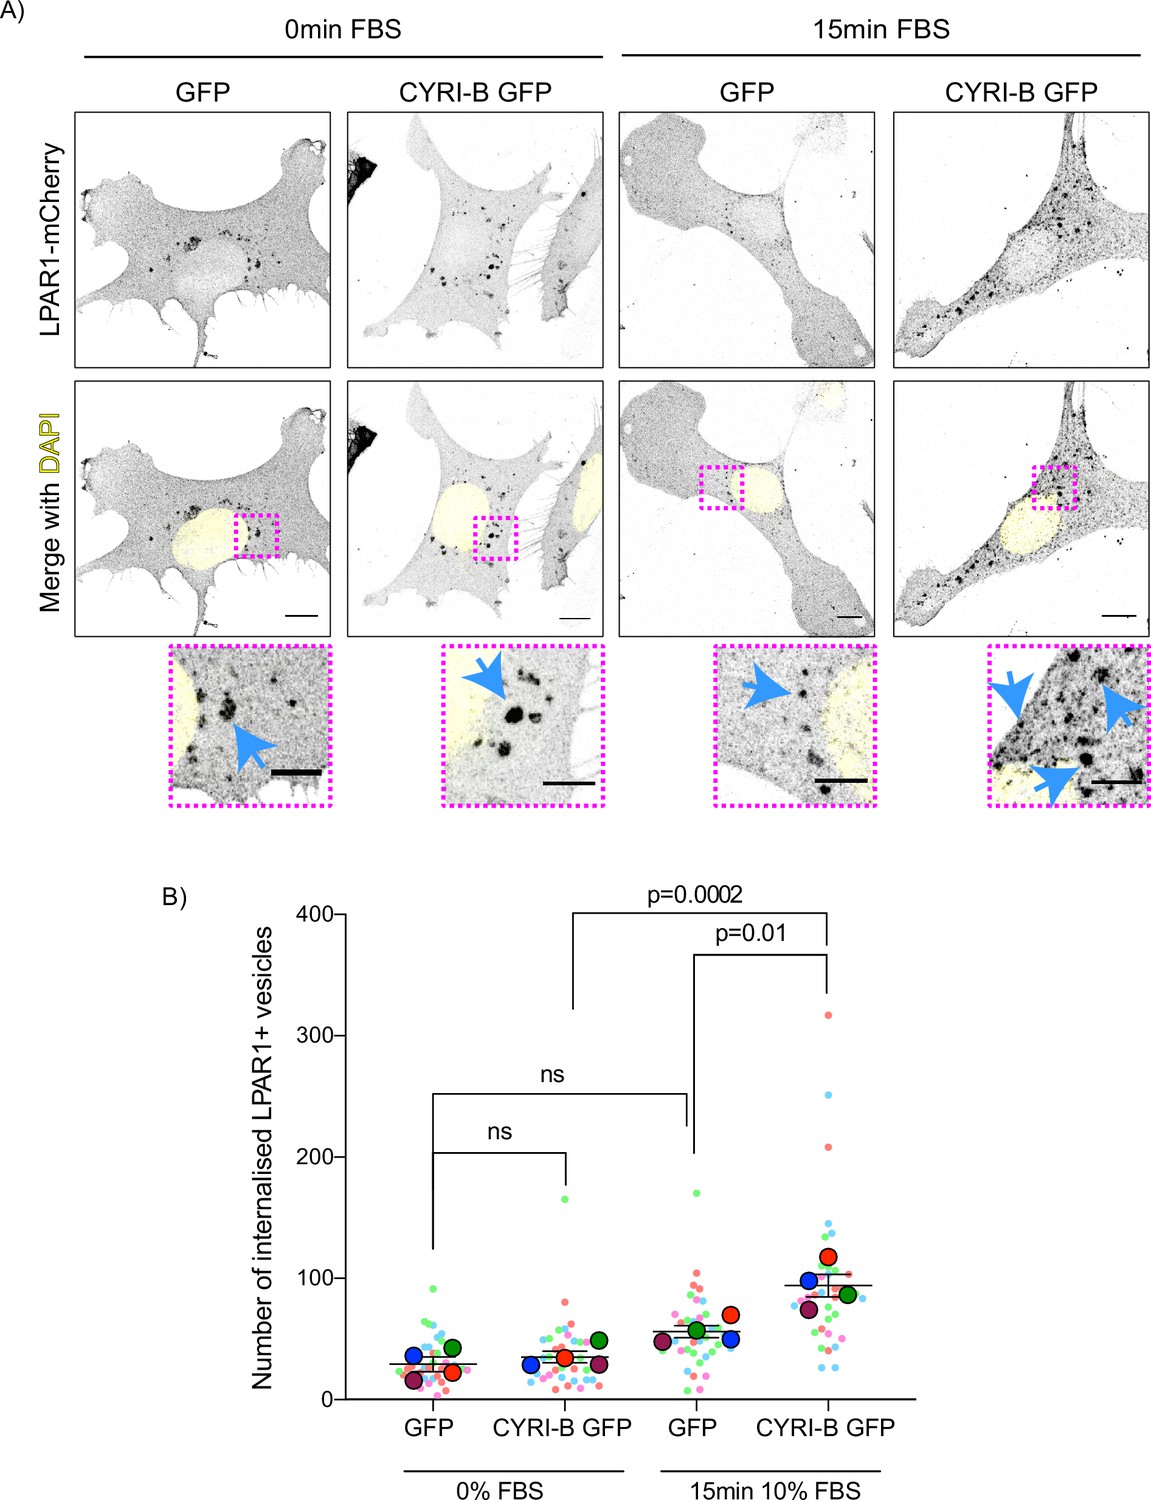
Loss of CYRI-B reduces LPAR1 internalisation upon serum stimulation.
(A) Immunofluorescence images of CKPC-1 stable cells transfected with GFP or CYRI-B-p17-GFP. Cells were transfected with LPAR1-mCherry and seeded on fibronectin-coated coverslips. Cells were starved overnight and the next day 10% foetal bovine serum (FBS) was used to stimulate the uptake of LPAR1. Vesicles (marked by LPAR1-mCherry) are shown as black dots, DAPI (yellow) was used to visualise the nuclei. Scale bars, 10 µm. Magenta dotted boxes show the magnified area of interest and cyan arrows show the internalised vesicles. Scale bars, 5 µm. (B) Quantification of the number of LPAR1-positive vesicles in each condition. Scatter plot is presented as super plots and every independent biological repeat is coloured differently. Mean ± SEM; one-way ANOVA followed by Tukey’s multiple comparisons test was performed, n=4 (from a total of ≥35 cells for each condition). p-Value as indicated, ns = not significant.
-
Figure 9—source data 1
Data for LPAR1+ vesicles as indicated with Excel and Prism data to support Figure 9B.
- https://cdn.elifesciences.org/articles/83712/elife-83712-fig9-data1-v2.zip
Tables
Key resources table
| Reagent type (species) or resource | Designation | Source or reference | Identifiers | Additional information |
|---|---|---|---|---|
| Strain, strain background (Mus musculus) | Mouse: Pdx-1::Cre;KrasG12D; p53R172H (KPC) mice | Hingorani et al., 2003 | Can be obtained from CRUK Scotland Institute, Glasgow, UK | |
| Strain, strain background (Mus musculus) | Mouse: Fam49bfl/fl | This study | Can be obtained from CRUK Scotland Institute, Glasgow, UK | |
| Strain, strain background (Mus musculus) | CD-1 Nude Mice | Charles River | ||
| Cell line (Cercopithecus aethiops) | COS-7 cells | ATCC | CRL-1651 | |
| Cell line (Homo sapiens) | HEK293T | ATCC | CRL-3216 | |
| Cell line (Homo sapiens) | AsPC-1 | ATCC | CRL-1682 | |
| Transfected construct (human) | CYRI-B-p17-GFP | Le et al., 2021 | Can be obtained from Machesky Lab, Cambridge | |
| Transfected construct (human) | pEGFP-N1 | Clontech- discontinued | Can be obtained from Novopro, Catalogue number V012021 or Machesky Lab, Cambridge | |
| Transfected construct (human) | LPAR1-mCherry | Juin et al., 2019 | Can be obtained from Machesky Lab, Cambridge | |
| Transfected construct (human) | LPAR1-GFP | Juin et al., 2019 | Can be obtained from Machesky Lab, Cambridge | |
| Transfected construct (human) | HA-LPAR1 | Kind gift from Dr. Heidi Welch | Can be obtained from Machesky Lab, Cambridge | |
| Transfected construct (human) | Rab5a-mCherry | Addgene | #55126, RRID Addgene 55126 | |
| Transfected construct (human) | mScarlet-Lck | Le et al., 2021 | Can be obtained from Machesky Lab, Cambridge | |
| Transfected construct (human) | empty lentiCRISPRv1-puro | Addgene | #49535 | |
| Biological sample (Mus musculus) | Mouse KPC-1 cells (pdx-1::Cre;KrasG12D;p53R172) | Kind gift from Prof. J Morton | Freshly isolated from KPC Mus musculus, see Materials and methods section | |
| Biological sample (Mus musculus) | Mouse CKPC-1 and CKPC-2 PDAC cells (from BSNA9.4a male mouse) | This paper | Freshly isolated from CKPC Mus musculus, see Materials and methods section | |
| Biological sample (Mus musculus) | Mouse CKPC-2 PDAC cells (BSNA15.1a female mouse) | This paper | Freshly isolated from CKPC Mus musculus, see Materials and methods section | |
| Antibody | Anti-α-tubulin (DM1A) (Mouse monoclonal) | Sigma-Aldrich | CAT. #T6199 | WB: 1:1000 |
| Antibody | Anti-HA tag (C29F4) (Rabbit monoclonal) | Cell Signaling | CAT. #3724S | IF: 1:800 |
| Antibody | Anti-Fam49B (Rabbit polyclonal) | ProteinTech | CAT. #20127–1-AP | WB: 1:500 |
| Antibody | Anti-GAPDH (Mouse monoclonal) | Millipore | CAT. #MAB374 | WB: 1:2000 |
| Antibody | Anti-GFP (4B10) (Mouse monoclonal) | Cell Signaling | CAT. #2955 | WB: 1:1000 |
| Antibody | Anti-p53 antibody [PAb 240] (Mouse polyclonal) | Abcam | CAT. #Ab26 | WB: 2.5 µg/ml |
| Antibody | Anti-Pdx1 (D59H3) XP (Rabbit monoclonal) | Cell Signaling | CAT. #5679 | WB: 1:1000 |
| Antibody | Anti-ArpC2 (EPR8533) (Rabbit monoclonal) | Abcam | CAT. #133315 | IF: 1:500 |
| Antibody | Anti-BrdU (B44) (Mouse monoclonal) | BD Biosciences | CAT. #347580 RRID: AB_400326 | IHC: 1:250 |
| Antibody | Anti-Caspase 3 (ASP-175) (Rabbit polyclonal) | Cell Signaling | CAT. #9661 | IHC: 1:500 |
| Antibody | Anti-Ki67 (D3B5) (Rabbit monoclonal) | Cell Signaling | #12202 | IHC: 1:1000 |
| Antibody | Anti- p44/42 MAPK (ERK1/2) (Rabbit polyclonal) | Cell Signaling | #9101 | IHC: 1:400 |
| Antibody | Anti-pdx (Rabbit polyclonal) | Abcam | #ab47267 | IHC: 1:400 |
| Antibody | Anti-pSapk/Jnk Thr183/Thr185 (81E11) (Rabbit Monoclonal) | Cell Signaling | #4668 | IHC: 1:20 |
| Antibody | Anti-Rabbit 680 nm stain (Donkey) | Invitrogen | CAT. #A21206 | IF: 1:10,000 |
| Antibody | Anti-Mouse 680 nm stain (Donkey) | Invitrogen | CAT. #A10038 | 1:10,000 |
| Antibody | Anti-Rabbit 594 nm (Donkey) | Invitrogen | CAT. #A21207 | 1:200 |
| Antibody | Anti-Mouse 800 nm (Goat) | Thermo Scientific | CAT. #SA5-35521 | 1:10,000 |
| Antibody | Anti-Rabbit 800 nm (Goat) | Thermo Scientific | CAT. #SA5-35571 | 1:200 |
| Antibody | Anti-Mouse 594 nm (Donkey) | Invitrogen | CAT. #A31203 | 1:200 |
| Sequence-based reagent | sgRNAs Mouse Cyri-b exon3 | This paper | DNA primer encoding sgRNA | CACCGGGTGCAGTCGTGCCACTAGT |
| Sequence-based reagent | sgRNAs Mouse Cyri-b exon4 | This paper | DNA primer encoding sgRNA | CACCGCGAGTATGGCGTACTAGTCA |
| Commercial assay or kit | Intense R Kit | Leica | DS9263 | |
| Commercial assay or kit | Rat ImmPRESS kit | Vector Labs | #MP-7404 | |
| Commercial assay or kit | RNAScope 2.5 LS (Brown) detection kit | Advanced Cell Diagnostics, Hayward, CA, USA | #322100 | |
| Commercial assay or kit | AMAXA-V kit | Lonza | VCA-1003 | |
| Commercial assay or kit | CRISPR-Cas9 calcium phosphate transfection | Invitrogen | CAT. #K2780-01 | |
| Commercial assay or kit | RNeasy Mini Kit | QIAGEN | CAT. #74104 | |
| Commercial assay or kit | DyNAmo HS SYBR Green qPCR kit | Thermo Fisher Scientific | CAT. #F410L | |
| Commercial assay or kit | Enzyme pre-treatment kit | Leica | CAT. #AR9551 | |
| Chemical compound, drug | KI16425 inhibitor | Cayman Chemicals | #10012659 | 1:1000 |
| Chemical compound, drug | Dextran, tetramethylrhodamine, 70,000 MW, lysine fixable (25MG) | Thermo Fisher | CAT. #D1818 | 50 µg/ml |
| Chemical compound, drug | Dextran, Fluorescein, 70,000 MW, Anionic, Lysine fixable | Thermo Fisher | CAT. #D1818 | 50 µg/ml |
| Chemical compound | Phalloidin 647 nm stain | Thermo Fisher | CAT. #A22287 | IF: 1:200 |
| Chemical compound | Phalloidin 594 nm stain | Thermo Fisher | CAT. #A12382 | IF: 1:200 |
| Chemical compound | Flex Wash buffer | Agilent | CAT. #K8007 | Use as per manufacturer's instructions |
| Chemical compound | High pH Target Retrieval Solution (TRS) | Agilent | CAT. #K8004 | Use as per manufacturer's instructions |
| Chemical compound | Liquid DAB | Agilent | CAT. #K3468 | Use as per manufacturer's instructions |
| Chemical compound | Low pH Target Retrieval Solution (TRS) | Agilent | CAT. #K8005 | Use as per manufacturer's instructions |
| Chemical compound | Mouse EnVision | Agilent | CAT. #4001 | Use as per manufacturer's instructions |
| Chemical compound | Peroxidase block | Agilent | CAT. #S2023 | Use as per manufacturer's instructions |
| Chemical compound | Rabbit EnVision | Agilent | CAT. #K4003 | Use as per manufacturer's instructions |
| Chemical compound | Rabbit signal boost (HRP) | Cell Signaling | CAT. #8114 | Use as per manufacturer's instructions |
| Chemical compound | Bond Wash | Leica | CAT. #AR9590 | Use as per manufacturer's instructions |
| Chemical compound | Epitope Retrieval Solution 1 (ER1) | Leica | CAT. #AR9551 | Use as per manufacturer's instructions |
| Chemical compound | Epitope Retrieval Solution 2 (ER2) | Leica | CAT. #AR9640 | Use as per manufacturer's instructions |
| Chemical compound | Mouse Ig Blocking reagent | Vector Labs | CAT. #MKB-2213 | Use as per manufacturer's instructions |
| Chemical compound | Fluoromount-G | Southern Biotech | CAT. #0100-01 | Use as per manufacturer's instructions |
| Software, algorithm | Fiji software | RRID: SCR_002285 | ||
| Software, algorithm | HALO software | Indica Labs | RRID:SCR_018350 | |
| Software, algorithm | Algorithm using R software | Fort et al., 2018 | RRID:SCR_001905 |
Additional files
-
Supplementary file 1
Spreadsheet with data on cohort animals.
Table outlining data on mouse cohorts used in the experiments.
- https://cdn.elifesciences.org/articles/83712/elife-83712-supp1-v2.xlsx
-
MDAR checklist
- https://cdn.elifesciences.org/articles/83712/elife-83712-mdarchecklist1-v2.docx
Download links
A two-part list of links to download the article, or parts of the article, in various formats.
Downloads (link to download the article as PDF)
Open citations (links to open the citations from this article in various online reference manager services)
Cite this article (links to download the citations from this article in formats compatible with various reference manager tools)
CYRI-B-mediated macropinocytosis drives metastasis via lysophosphatidic acid receptor uptake
eLife 13:e83712.
https://doi.org/10.7554/eLife.83712


