Development of a versatile high-throughput mutagenesis assay with multiplexed short-read NGS using DNA-barcoded supF shuttle vector library amplified in E. coli
- Graduate School of Biomedical and Health Sciences, Hiroshima University, Japan
- School of Pharmaceutical Sciences, Hiroshima University, Japan
- Analysis Center of Life Science, Natural Science Center for Basic Research and Development, Hiroshima University, Japan
Figures
Figure 1 with 1 supplement
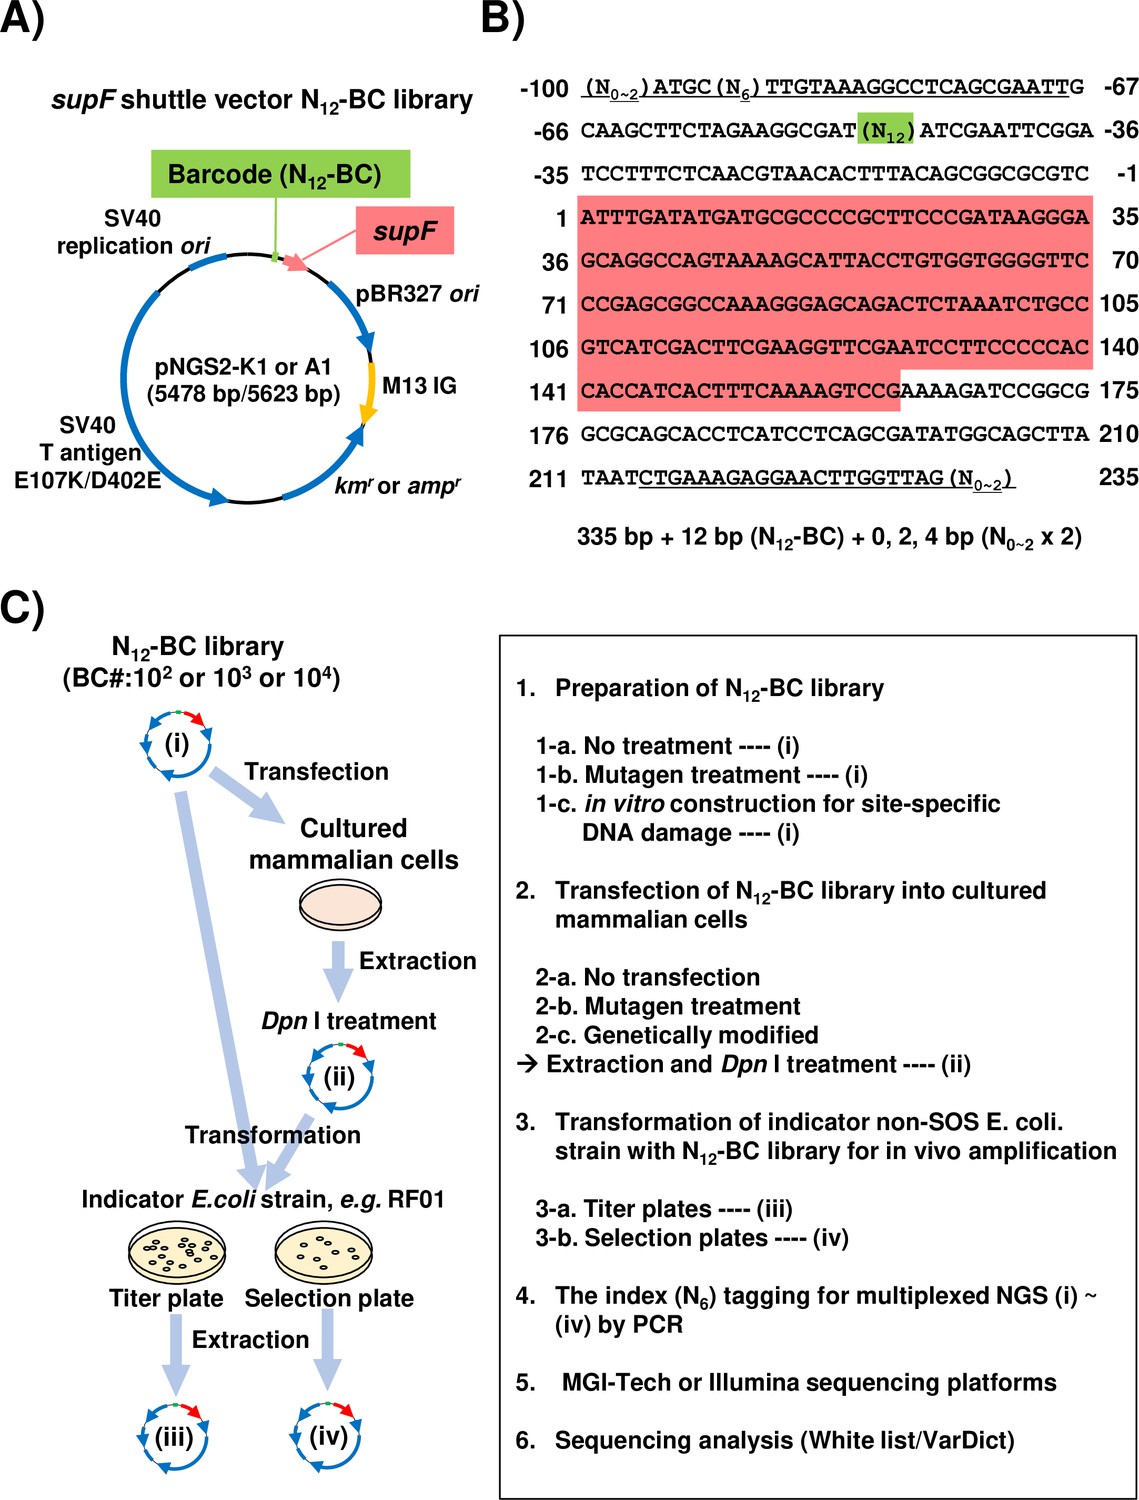
Strategy for the supF mutagenicity next-generation sequencing (NGS) assay.
(A) Schematic map of the shuttle vector pNGS2-K1 or -A1. The shuttle vector plasmid DNA encodes the amber suppressor transfer RNA (tRNA) (supF) gene, the TP53-/Rb-binding-deficient mutant SV40 large T antigen (E107K/D402E) gene, the SV40 replication origin, the pBR327 origin of replication, the M13 intergenic region, the kanamycin or ampicillin resistance gene (kmr and ampr), and the randomized 12-nucleotide barcode DNA sequence (N12–BC). (B) Nucleotide sequence of the non-transcribed strand (sense strand) of the DNA fragment from N12-BC libraries amplified by PCR in preparation for NGS. The underlined letters indicate the primer set for PCR amplification (Figure 1—source data 1). All primer sets contain 0, 1, or 2 random nucleotides at the 5' end to ensure proper signal detection for amplicon sequencing with a short-read NGS platform. A pre-designed 6-nucleotide sequence (N6) in one of the primers serves as an index sequence for distinguishing multiplex samples in a single sequencing run. The N12 (green background color) represents the N12-BC DNA sequence used for deep-sequencing data analysis to identify variants from identical template shuttle vectors. The sequence with red background indicates the supF gene starting at position 1. (C) Schematic illustration of the mutagenicity NGS assay procedure. One or more of the N12-BC libraries (i)–(iv) can be applied for the sequencing analysis.
-
Figure 1—source data 1
The nucleotide sequences of primer sets for multiplexing sample preparation for next-generation sequencing (NGS).
The each N12-BC library was independently amplified by PCR with a forward primer (BC12-IDXX-NX-F) and a reverse primer (BC12-NX-R). Pre-designed 6-nucleotide sequence (N6) were shown in red color.
- https://cdn.elifesciences.org/articles/83780/elife-83780-fig1-data1-v2.xlsx
Figure 1—figure supplement 1
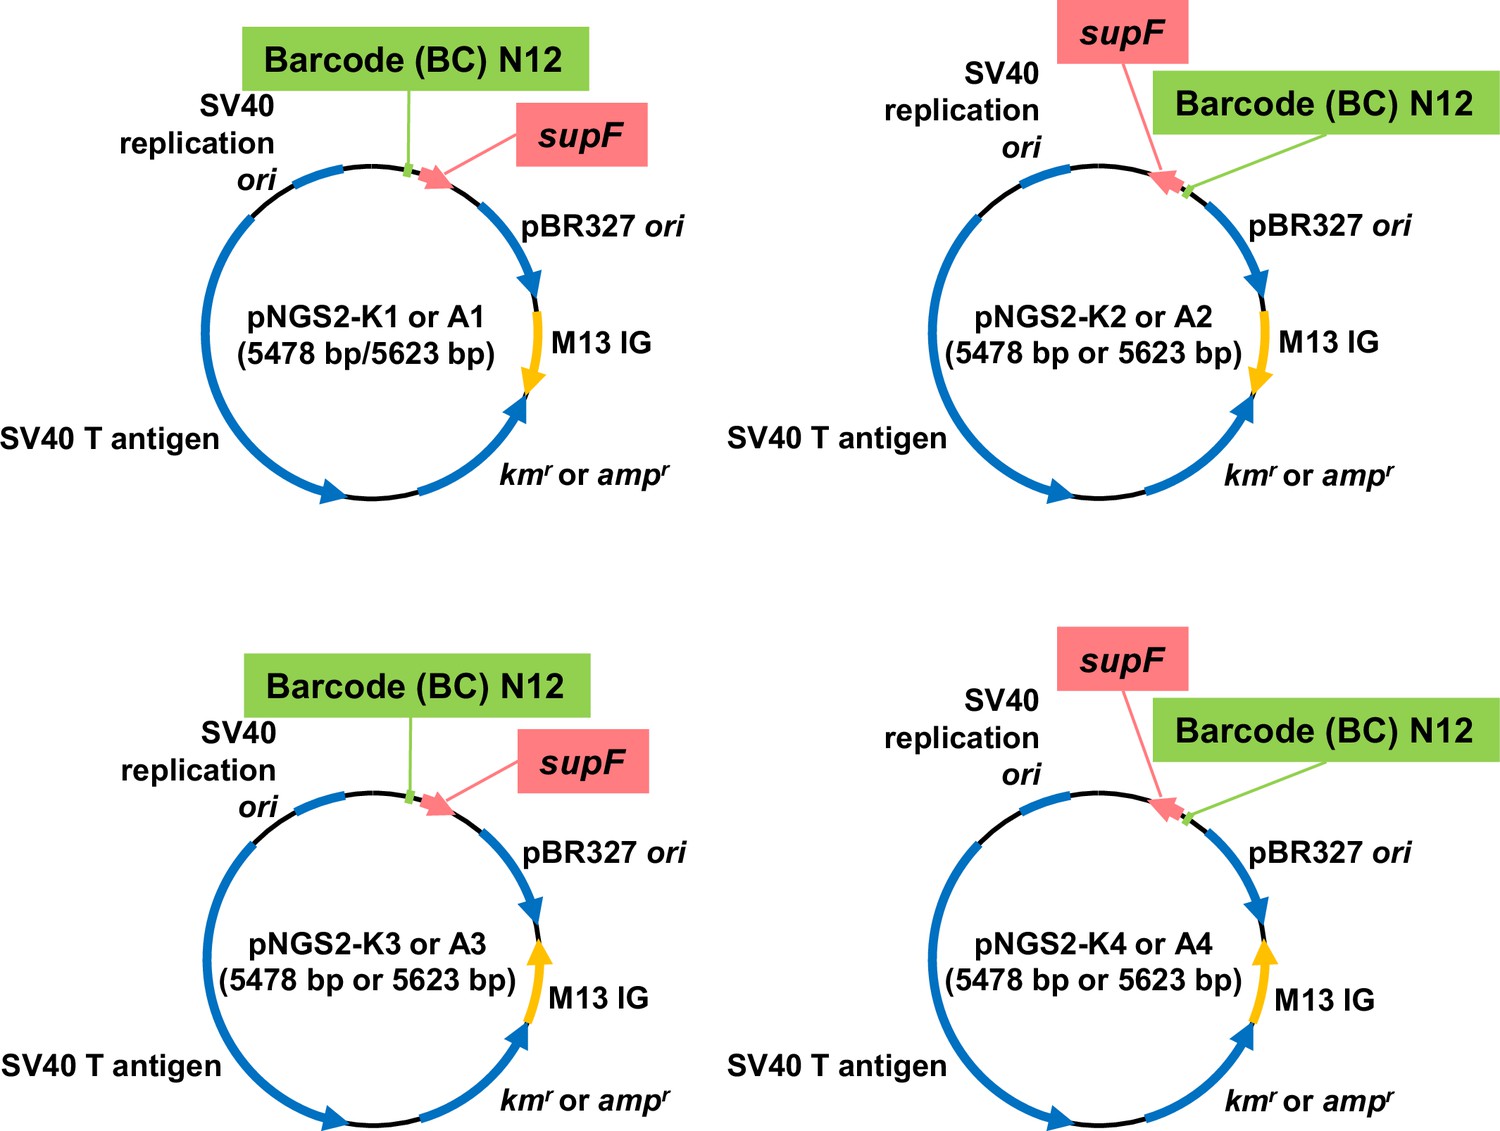
SupF shuttle vector N12-BC library.
The circular maps of eight series of supF shuttle vector plasmids, pNGS2 -K1, -K2, -K3, -K4, -A1, -A2, -A3, -A4. Each plasmid vector contains an amber suppressor transfer RNA (tRNA) gene (supF), a TP53-/Rb-binding-deficient mutant SV40 large T antigen (E107K/D402E) with an SV40 replication origin, a pBR327 origin of replication, an M13 intergenic region, and either an ampicillin resistance gene (ampr) or kanamycin resistance gene (kmr) in the indicated direction.
Figure 2 with 1 supplement
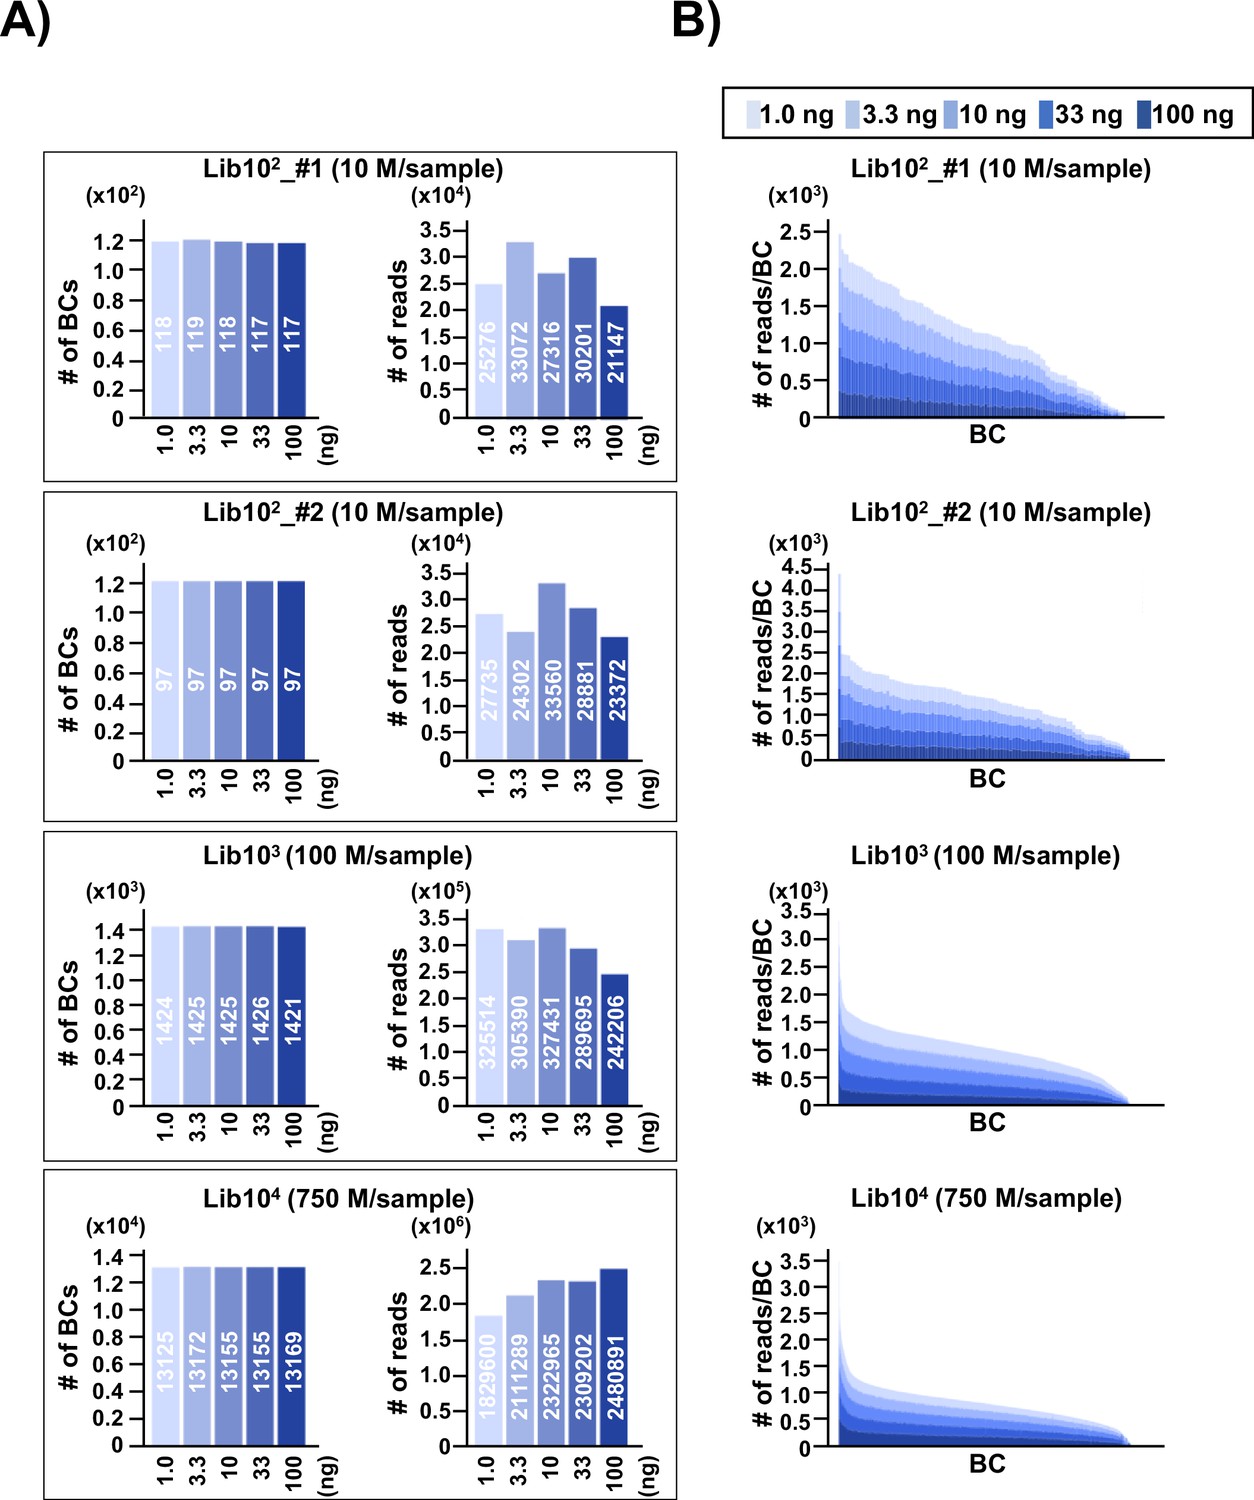
Number of classified unique N12-BC sequences in the multiplexed next-generation sequencing (NGS) libraries prepared by PCR.
(A) In the caption of each pair of graphs, the ‘10n’ (Lib102_#1, Lib102_#2, Lib103, and Lib104) indicates the approximate number of colonies used for the N12-BC library preparation from pNGS2-K1, and the ‘n M/sample’ indicates expected ‘n’ million reads per individual sample in the multiplexed NGS. The left-side graph in each of the four pairs represents the number of classified N12-BC sequences in indexed samples prepared by PCR with different amounts of template (1.0, 3.3, 10, 33, and 100 ng, indicated by graded blue colors). The right-side graph shows the observed number of reads for each indexed sample. Source data is available in Supplementary file 1A-1D. (B) Coverage distributions for each unique N12-BC sequence for the samples in (A).
Figure 2—figure supplement 1
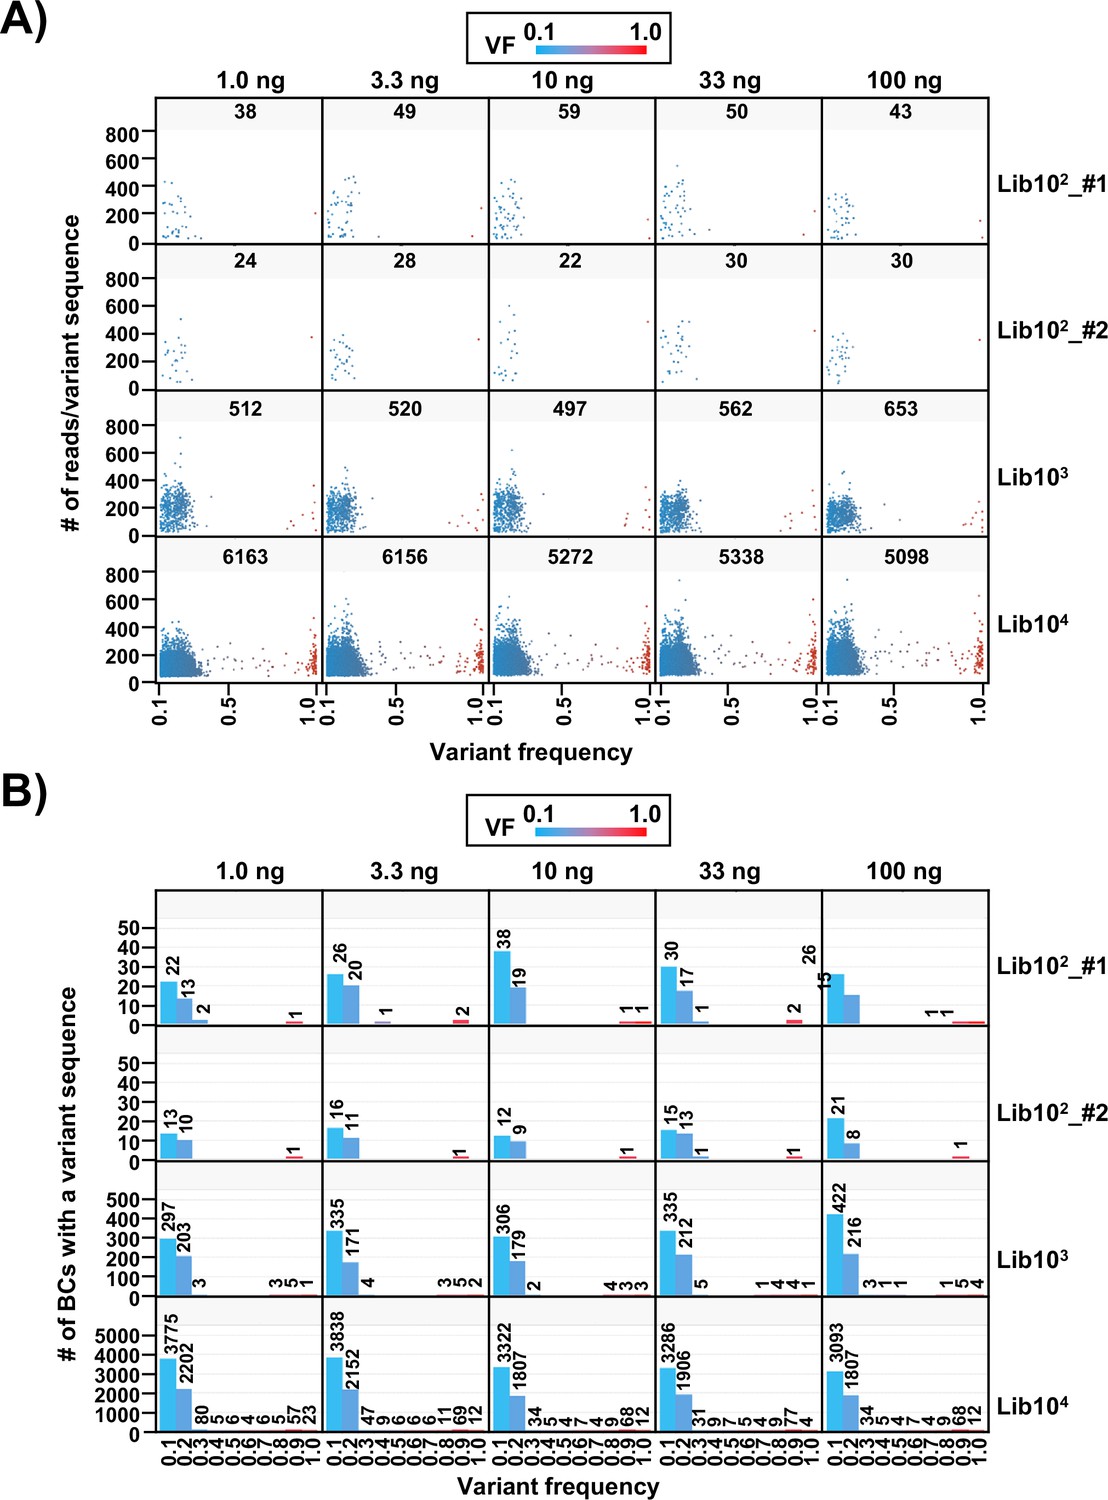
Variant frequency (VF) in N12-BC sequences from the multiplexed next-generation sequencing (NGS) libraries.
(A) Dot plots of the distribution of the number of reads for each variant sequence according to their VF for the samples in Figure 2. The number in each segment represents the total number of N12-BC sequences with a variant sequence. Source data is available in Supplementary file 2. (B) Distribution of the number of N12-BC sequences with a variant by VF, shown as histograms with bin width 0.1 of the VF.
Figure 3
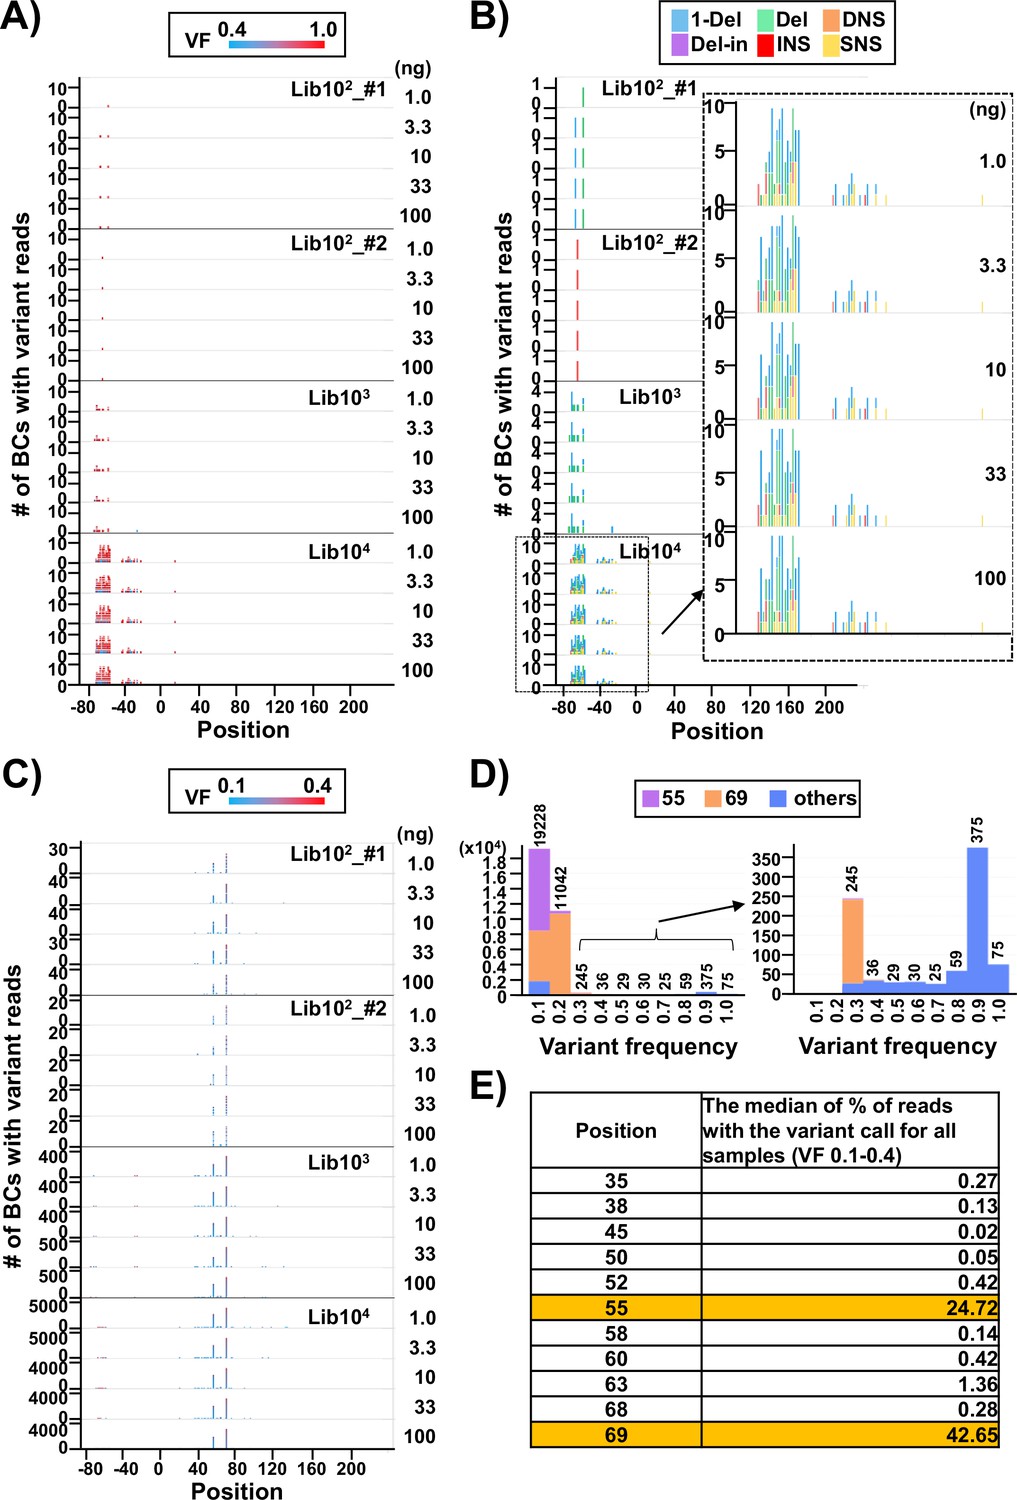
Discrimination between true mutations and sequencing errors at the nucleotide positions.
(A) Number of N12-BC sequences with a variant exceeding 0.4 variant frequency (VF) according to their nucleotide positions. The bar colors reflect the VF, as indicated by the heatmap at the top of panel (A). Source data is available in Supplementary file 2. (B) The same dataset as in panel (A), with the bar colors reflecting different variant types. The variant calls are categorized into six types: one-nucleotide deletion (1-Del), deletions larger than one nucleotide (Del), deletions with insertions (Del-in), dinucleotide substitutions (DNSs), insertions (INS), and single nucleotide substitutions (SNSs). The data for the BC104 library is outlined with a dashed line and enlarged. (C) Number of N12-BC sequences with a variant in the 0.1–0.4 VF range according to their nucleotide positions. (D) Histograms of the distribution of the number of N12-BC sequences by VF. The data for the 0.3–1.0 VF range are enlarged on the right side. Different colors indicate the positions of the variant sequence: position 55 (violet), 69 (orange), or other (blue). (E) Comparison of the possible sequencing errors at different nucleotide positions in the supF gene, presented as percentage of BC sequences with variants below VF 0.4. The value in the right-hand side column of the table is the median from all analyzed samples (n=20).
Figure 4 with 1 supplement
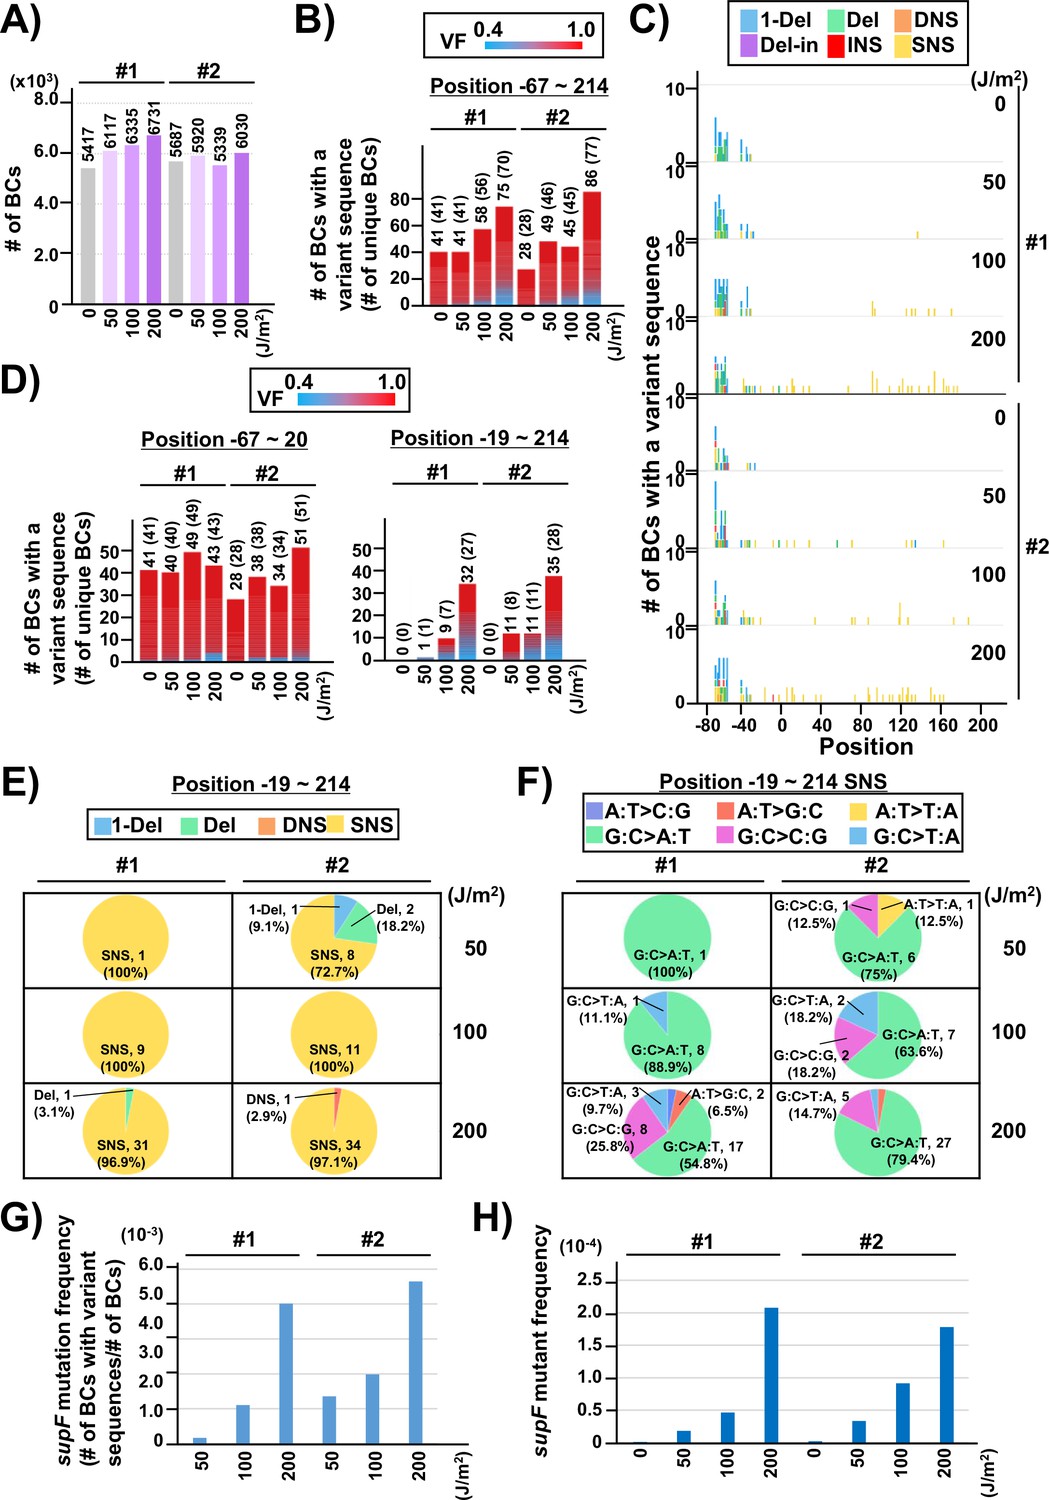
Performance of the supF mutagenicity next-generation sequencing (NGS) assay in bacterial cells (data from titer plates).
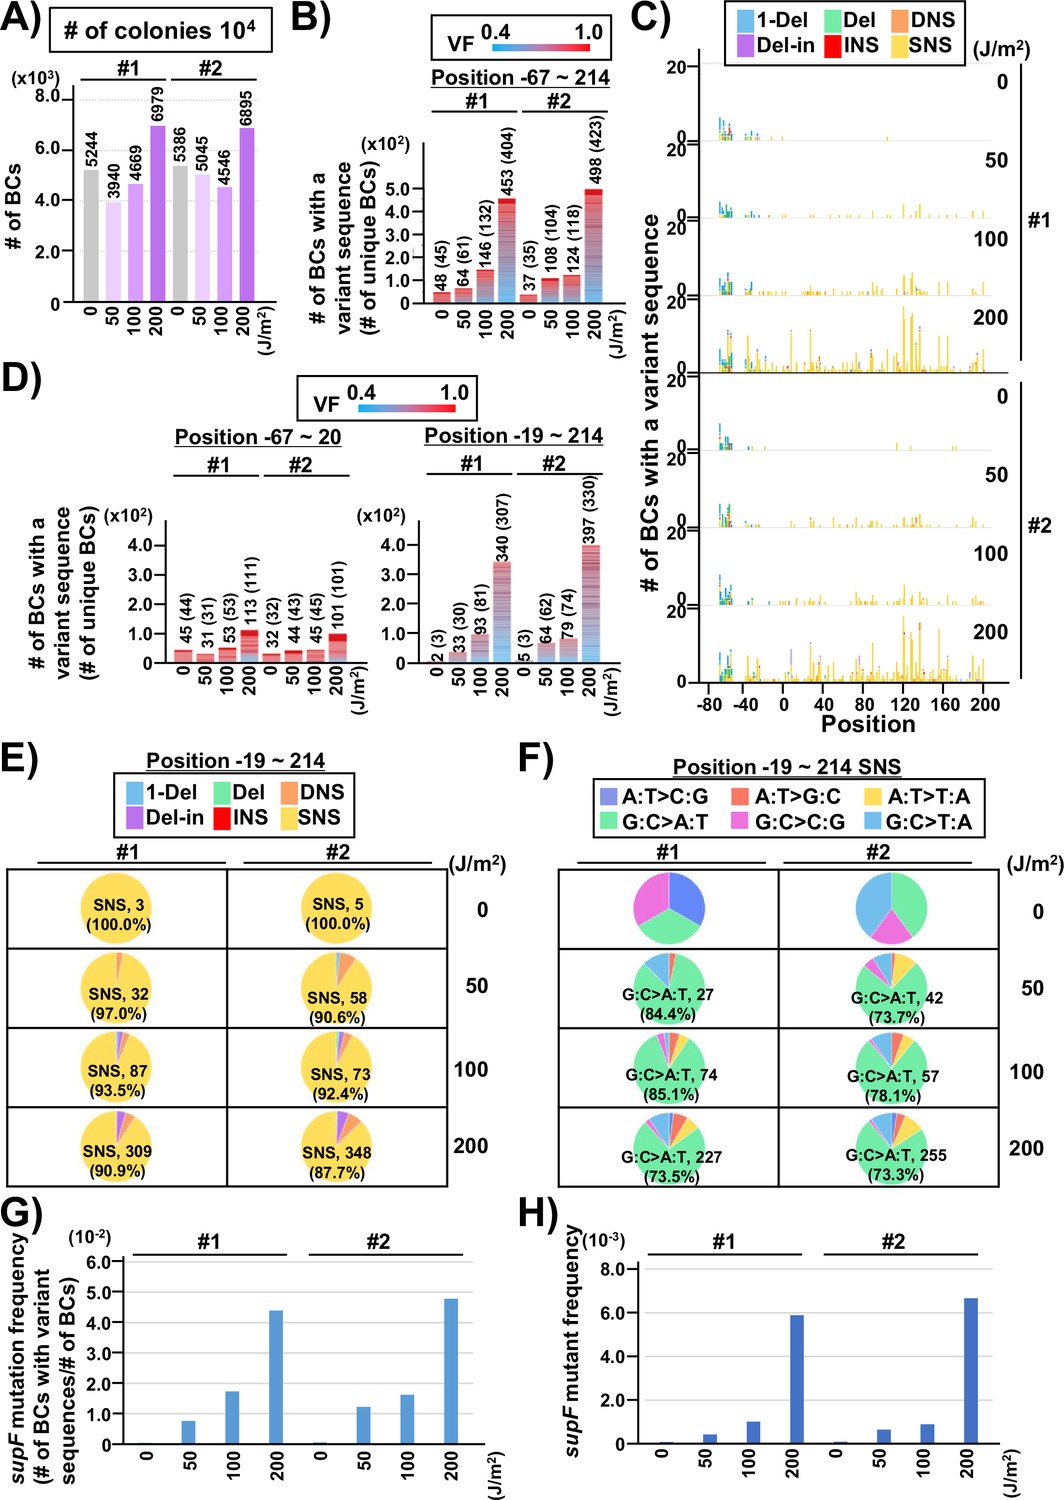
(A) Number of classified N12-BC sequences analyzed from approximately 104 colonies from titer plates (see Figure 1C (iii)). Lib104_#1 (#1) and Lib104_#2 (#2) represent two independently prepared BC104 libraries from pNGS2-K3 irradiated with UV-C at doses of 0, 50, 100, and 200 J/m2 and used for transformation of the indicator Escherichia coli strain RF01. Source data is available in Supplementary file 3A. (B) Number of N12-BC sequences with a variant sequence exceeding VF 0.4. The number in brackets refers to the number of unique BCs with variant sequences. (C) Number of N12-BC sequences with a variant exceeding VF 0.4 at different UV-C doses and their distribution by nucleotide position. The variant types are shown in different colors as indicated in the legend. (D) The same dataset shown in (B) is now separated into two graphs: the graph on the left side represents positions from –67 to –20, and the graph on the right side – positions from –19 to 214 containing the supF gene. (E) Pie charts of the proportions of mutation types: one-nucleotide deletion (1-Del), deletions larger than one nucleotide (Del), dinucleotide substitutions (DNSs), deletions with insertions (Del-in), insertions (INS), single nucleotide substitution (SNS), categorized as in Figure 3B. Source data is available in Supplementary file 3B. (F) Mutation spectrum shown as pie charts of the proportions of different base substitutions. Source data is available in Supplementary file 3C. (G) The supF mutation frequencies determined by NGS. The mutation frequency is determined by dividing the number of N12-BC sequences with a variant sequence at positions from –19 to 214 by the total number of N12-BC sequences in the sample (data shown in (D and A), respectively). (H) The supF mutant frequencies determined by the conventional method, that is, by dividing the number of colonies grown on the selection plate by the number of colonies grown on the titer plate.
Figure 4—figure supplement 1
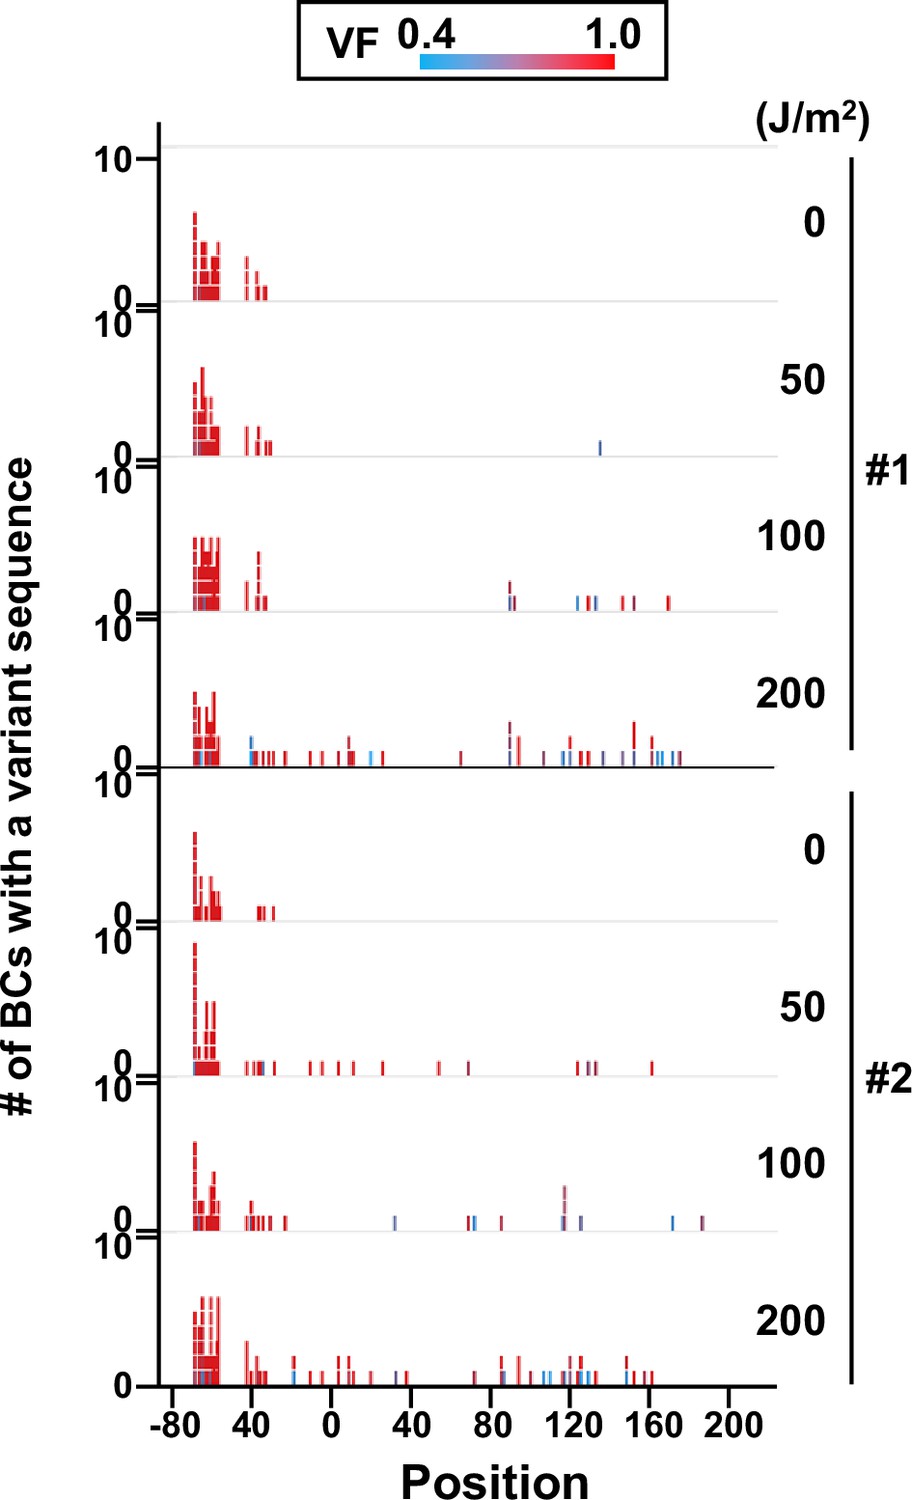
Number of N12-BC sequences with a variant exceeding variant frequency (VF) 0.4 at different UV-C doses and their distribution by nucleotide position (in bacterial cells, data from titer plates).
The colors reflect the VF as indicated by the heatmap on top.
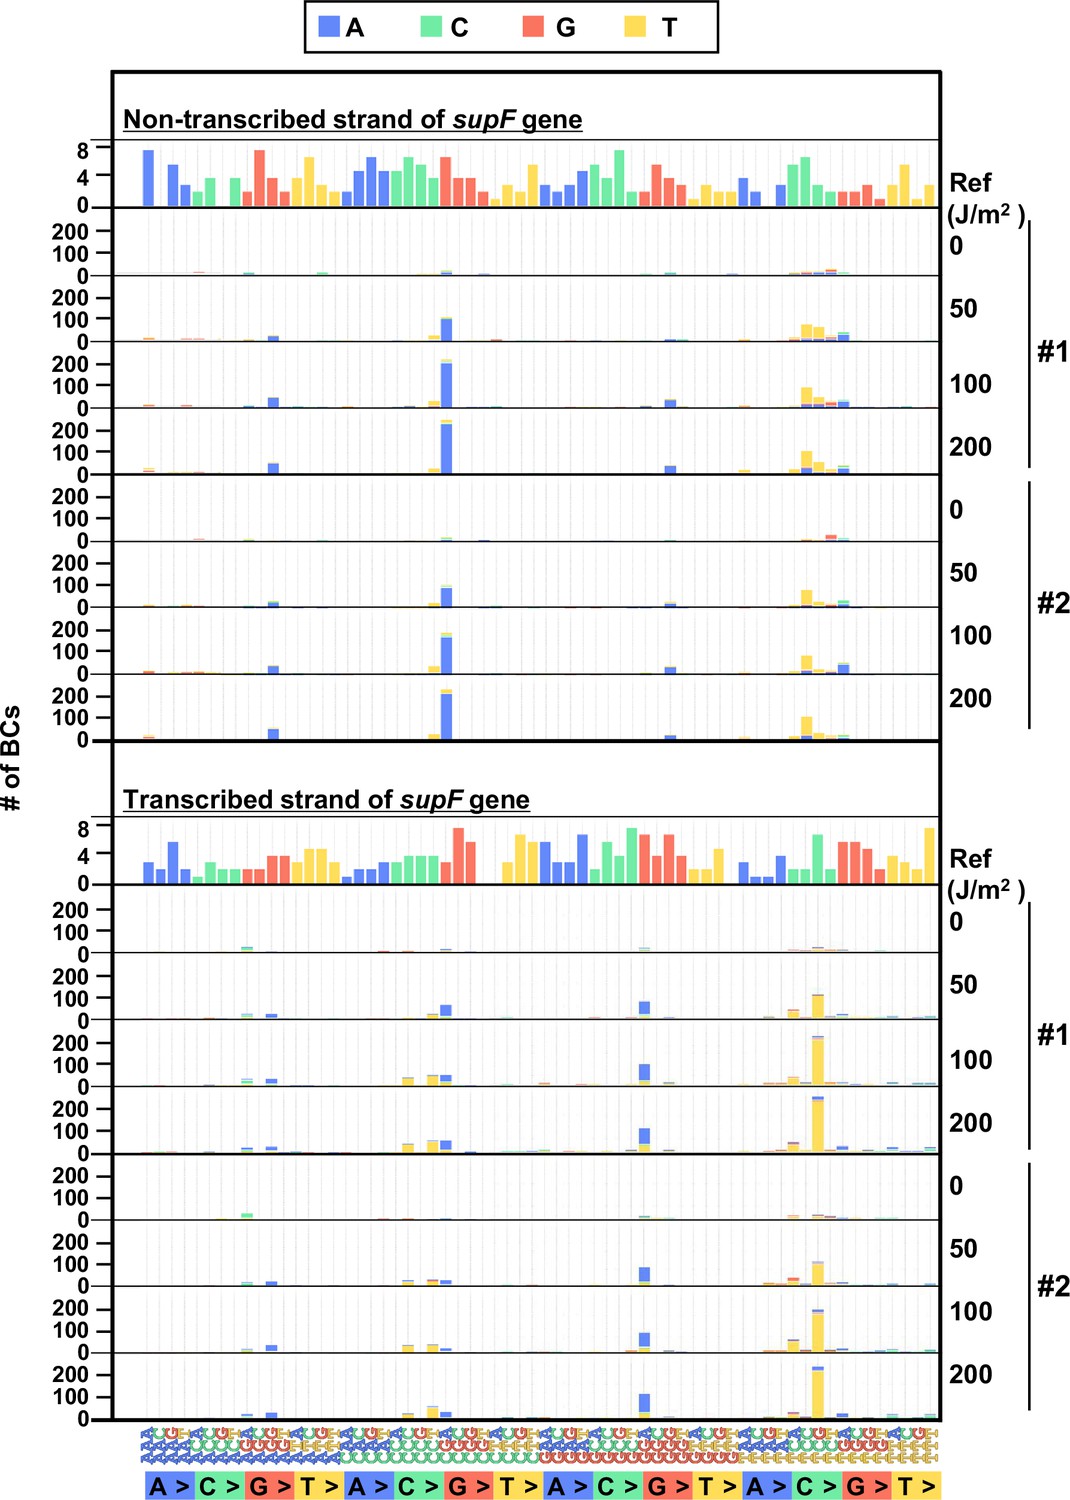
Figure 5
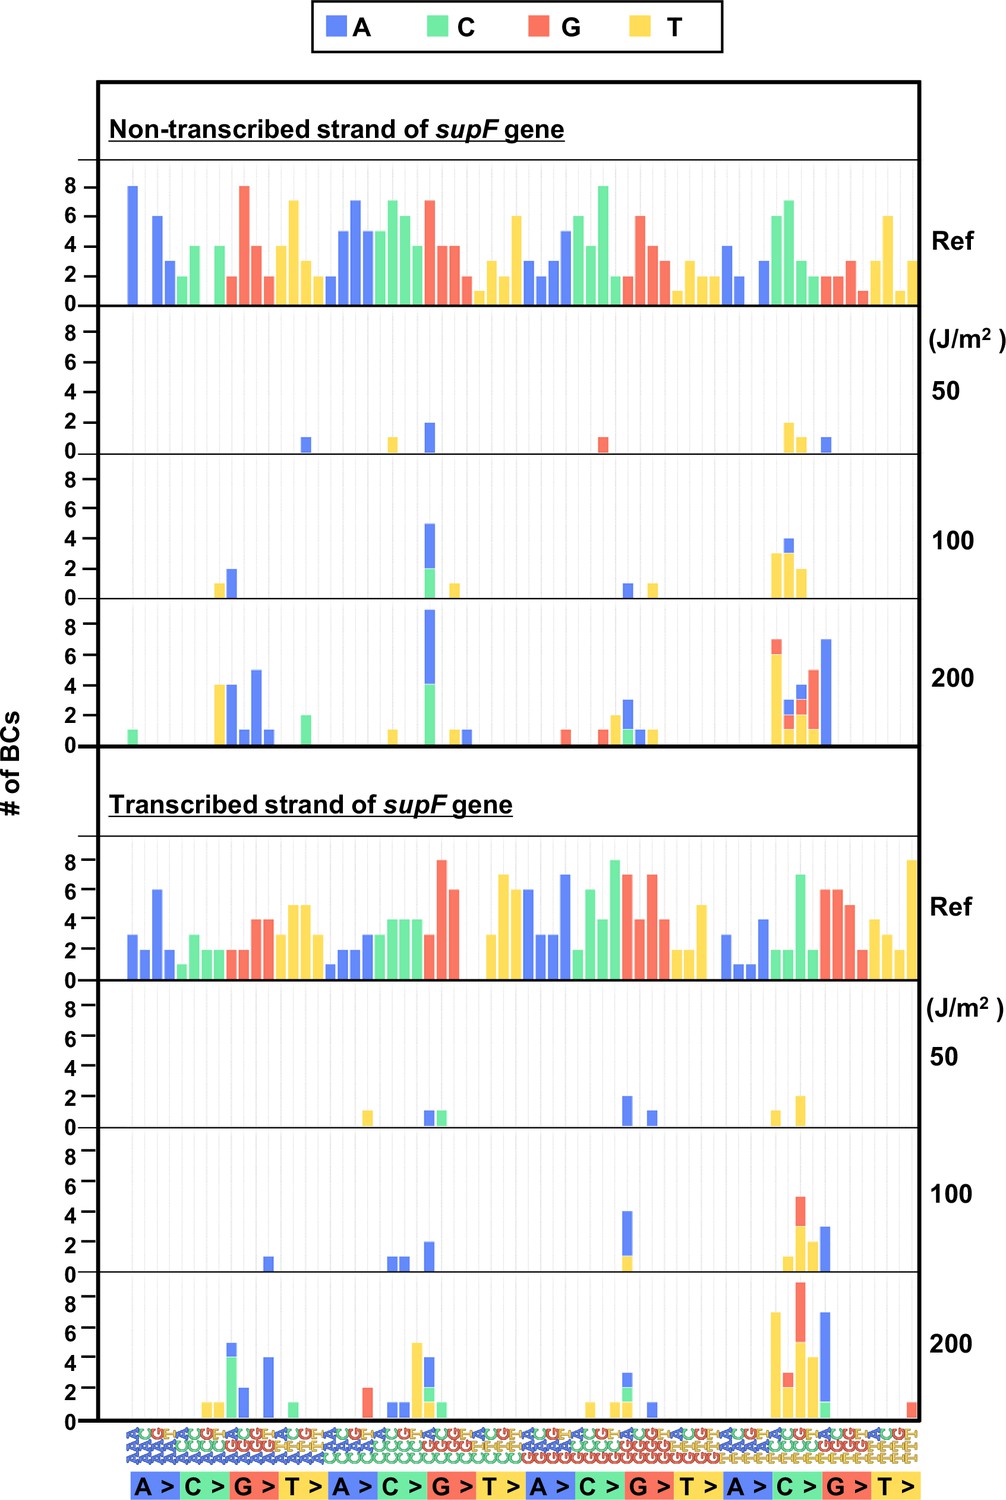
The 192 trinucleotide contexts of ultraviolet (UV) radiation-induced single nucleotide substitutions (SNSs) in bacterial cells (data from titer plates).
UV radiation-induced SNSs shown in 192 trinucleotide contexts for the non-transcribed (top panel) and transcribed (bottom panel) strand of the supF gene (nucleotide positions from –19 to 214). The data is combined from Lib104_#1 and Lib104_#2. The substituted bases are indicated in colors corresponding to the notation on the horizontal axis; the UV doses are shown on the right side of the graph; the reference sequence for the analysis is denoted as Ref Source data is available in Supplementary file 3D.
Figure 6 with 1 supplement
Performance of the supF mutagenicity next-generation sequencing (NGS) assay in bacteria cells (data from selection plates).
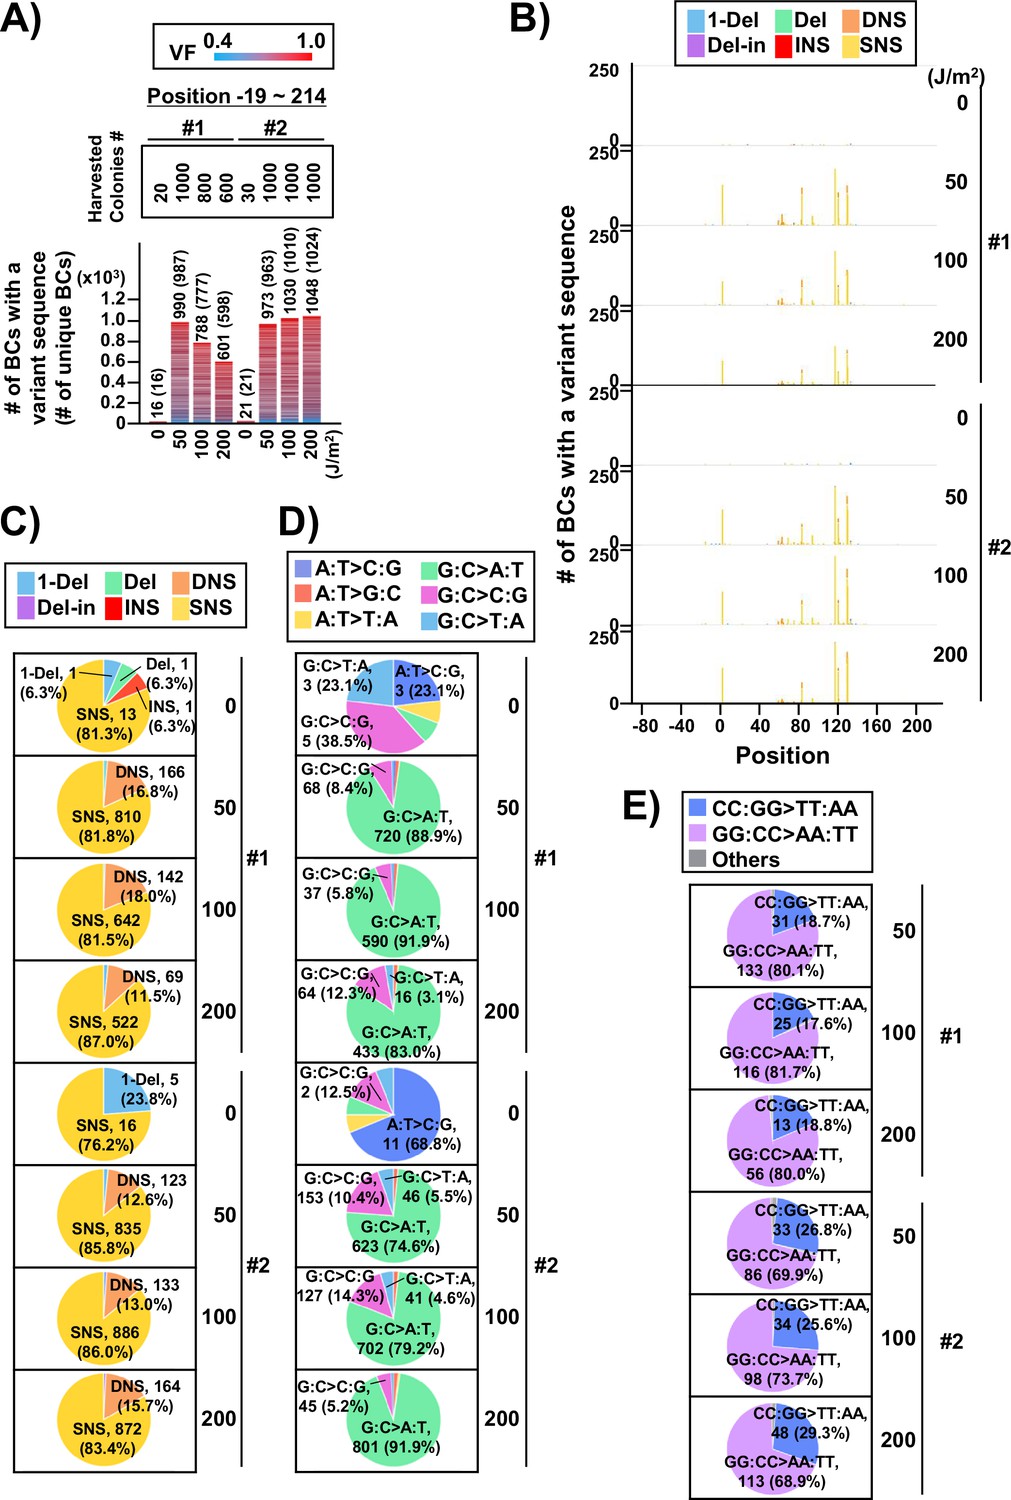
(A) Number of classified N12-BC sequences from colonies in selection plates (see Figure 1C (iv)). The approximate numbers of harvested colonies are shown on top of the graph in a rectangle denoted as ‘Harvested colonies #’. The number above each bar represents the number of classified N12-BC sequences, and the number in the brackets refers to the number of unique BCs with variant sequences. Source data is available in Supplementary file 4A. (B) Number of N12-BC sequences with a variant exceeding variant frequency (VF) 0.4 at different UV doses and their distribution by nucleotide position. The variant types are shown in different colors as indicated in the legend. (C) Pie charts of the percentage distribution of different mutation types. Source data is available in Supplementary file 4B. (D) Pie charts of the percentage distribution of different single nucleotide substitutions (SNSs). Source data is available in Supplementary file 4C. (E) Pie charts of the percentage distribution of different dinucleotide substitutions (DNSs). Source data is available in Supplementary file 4D.
Figure 6—figure supplement 1
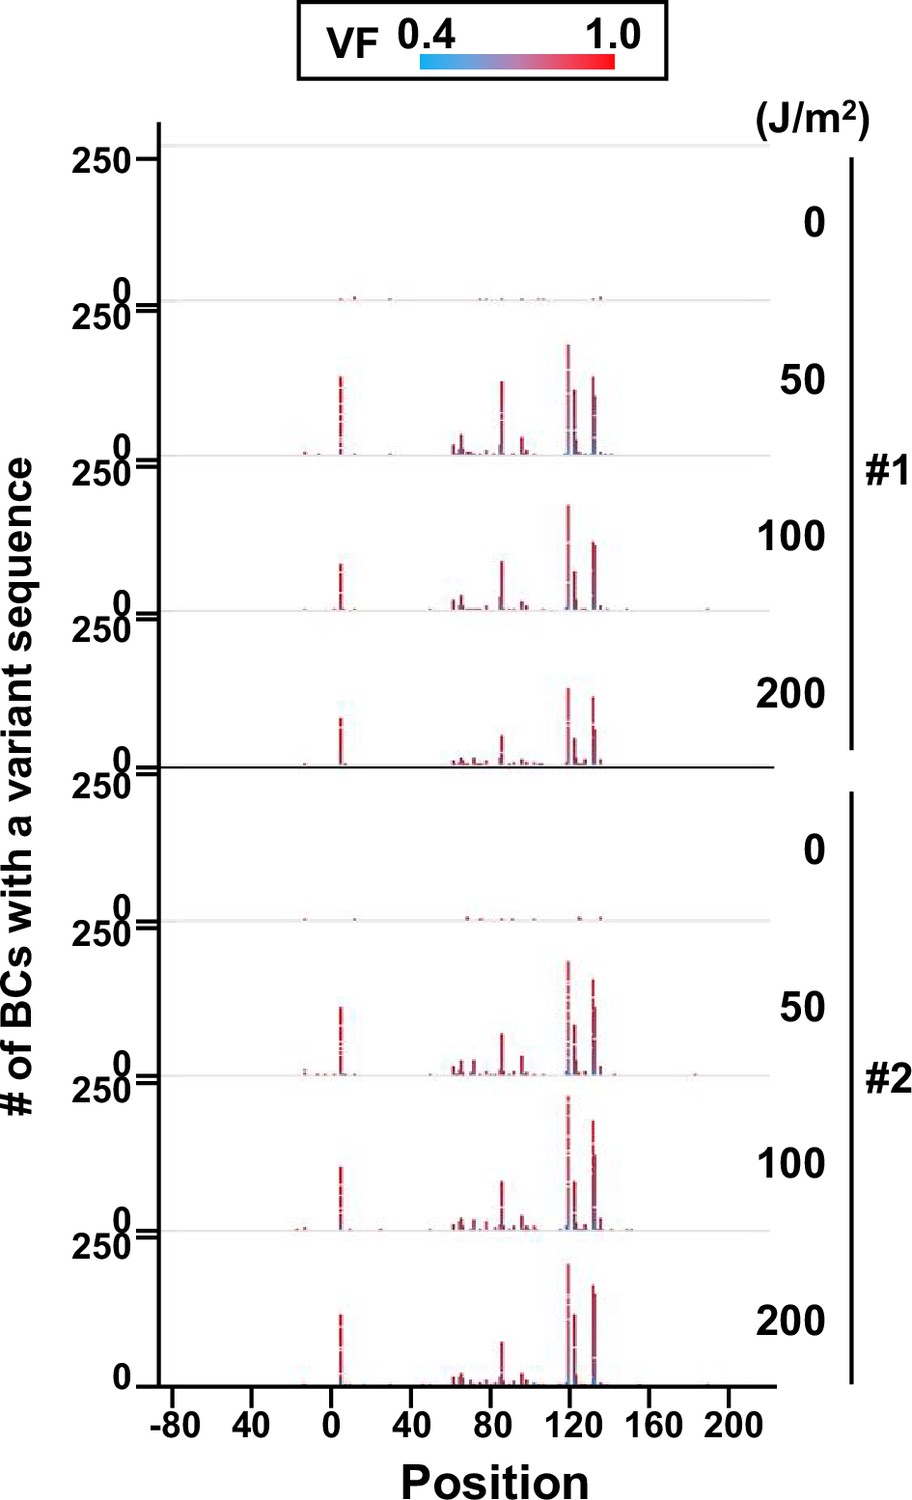
Number of N12-BC sequences with a variant exceeding variant frequency (VF) 0.4 at different UV-C doses and their distribution by nucleotide position (in bacterial cells, data from selection plates).
The colors reflect the VF as indicated by the heatmap on top.
Figure 7
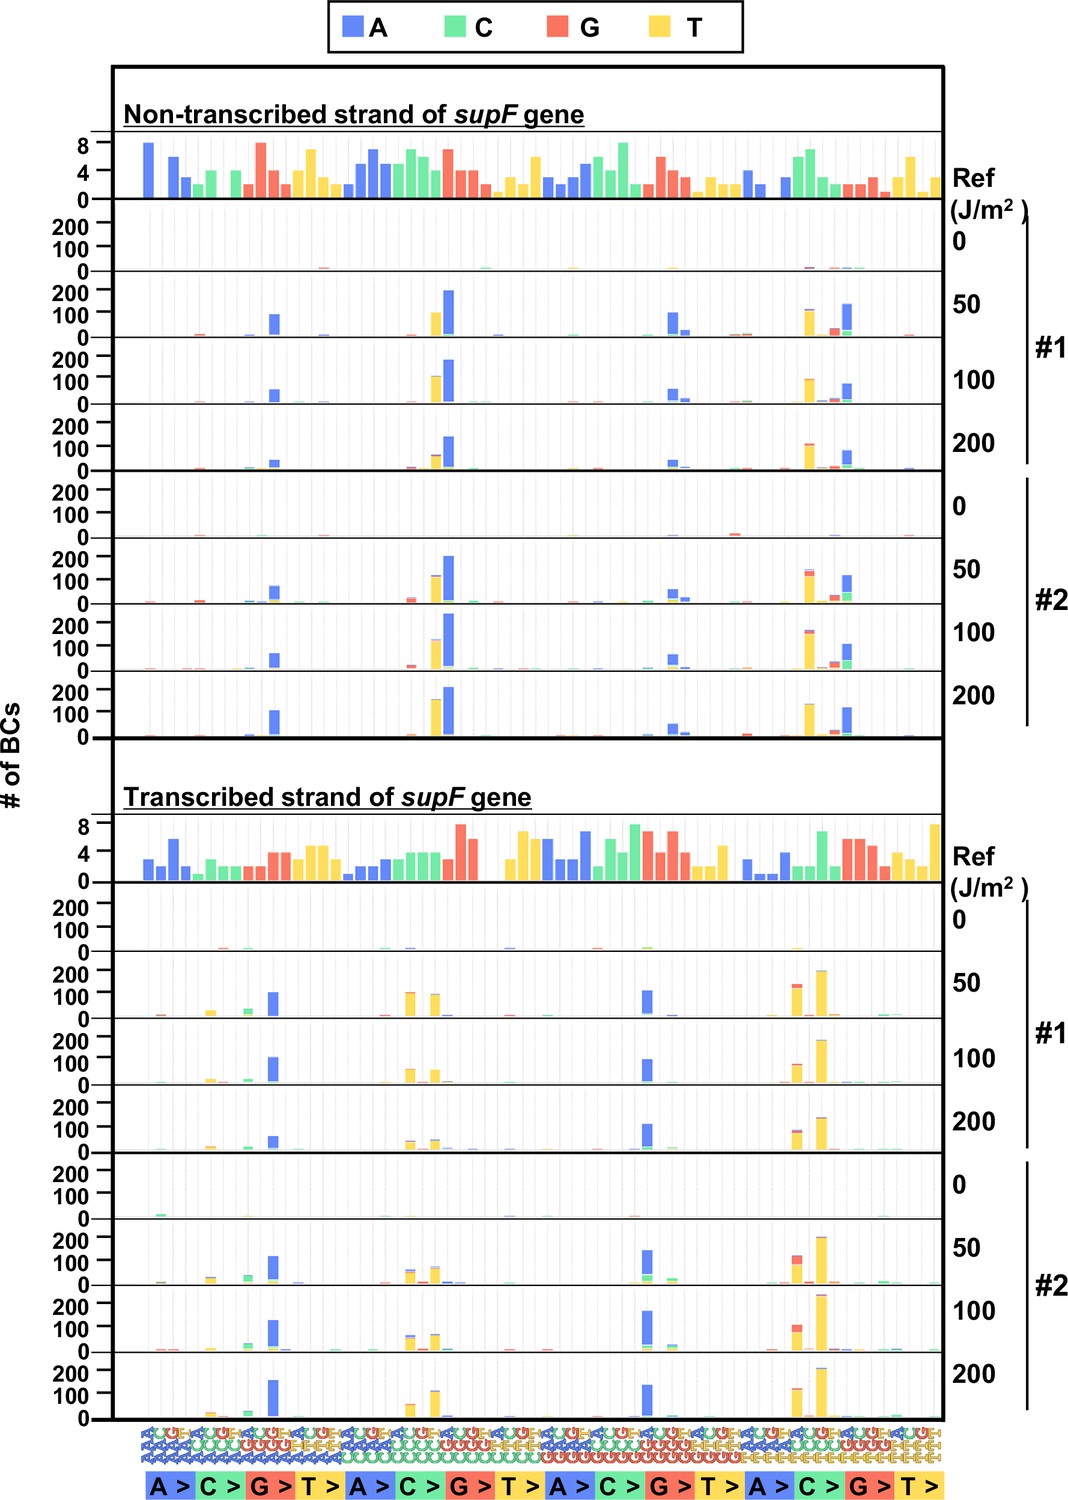
The 192 trinucleotide contexts of ultraviolet (UV) radiation induced single nucleotide substitutions (SNSs) in bacterial cells (data from selection plates).
SNSs induced by UV irradiation in the supF gene in 192 trinucleotide contexts. The strand-specific number of BCs are shown for each SNSs, analogous to Figure 5I, but the data are independently plotted for libraries Lib104_#1 and Lib104_#2. Source data is available in Supplementary file 4E.
Figure 8 with 1 supplement
Performance of the supF mutagenicity next-generation sequencing (NGS) assay in mammalian cells (data from titer plates).
The layout of the figure is analogous to Figure 4, this time for RF01 transformed with libraries extracted from transfected U2OS cells. (A) Numbers of classified N12-BC sequences analyzed from approximately 104 colonies from titer plates. Source data is available in Supplementary file 5A. (B) Number of N12-BC sequences with a variant sequence exceeding variant frequency (VF) 0.4 (nucleotide positions from –67 to 214). (C) Number of N12-BC sequences with a variant sequence exceeding VF 0.4 and their distribution by nucleotide position. (D) The dataset shown in panel B is now separated into two graphs according to nucleotide position relative to the supF gene. The graph on the left side represents positions from –67 to –20, and the graph on the right side represents positions from –19 to 214. (E) Pie charts of the percentage distribution of different mutation types. Source data is available in Supplementary file 5B. (F) Pie charts of the percentage distribution of different single nucleotide substitutions (SNSs). Source data is available in Supplementary file 5C. (G) The supF mutation frequencies determined by the NGS assay. (H) The supF mutant frequencies determined by the conventional method.
Figure 8—figure supplement 1
Number of N12-BC sequences with a variant exceeding variant frequency (VF) 0.4 at different UV-C doses and their distribution by nucleotide position (in mammalian cells, data from titer plates).
The colors reflect the VF as indicated by the heatmap on top.
Figure 9
The 192 trinucleotide contexts of ultraviolet (UV) radiation-induced single nucleotide substitutions (SNSs) in mammalian cells (data from titer plates).
UV-induced SNSs in 192 trinucleotide contexts for the non-transcribed (top panel) and transcribed (bottom panel) strand of the supF gene. Source data is available in Supplementary file 5D.
Figure 10 with 1 supplement
Performance of the supF mutagenicity next-generation sequencing (NGS) assay in mammalian cells (data from selection plates).
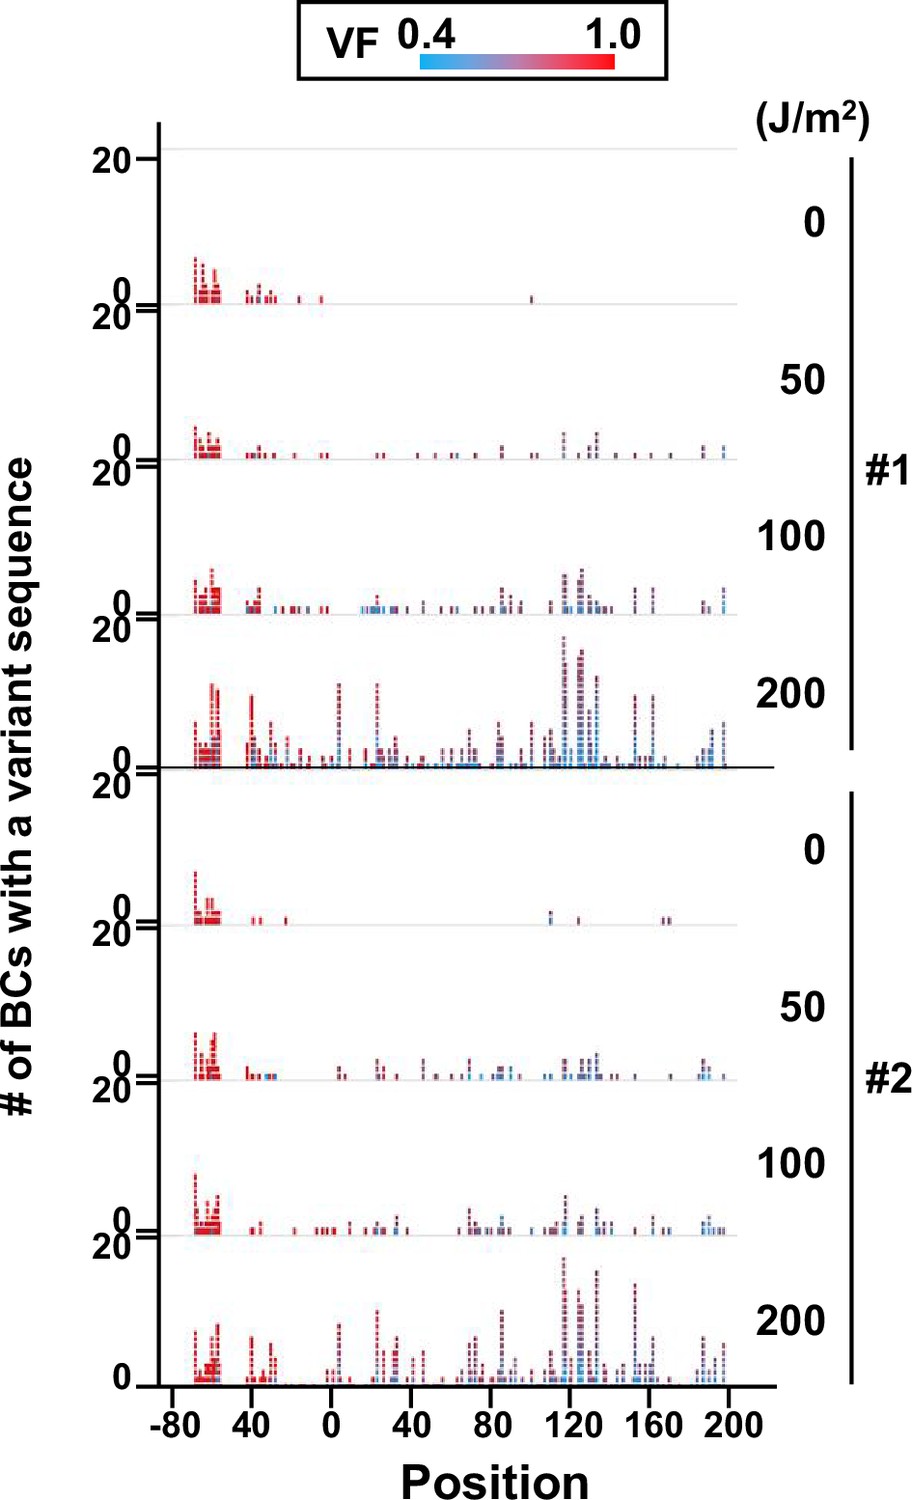
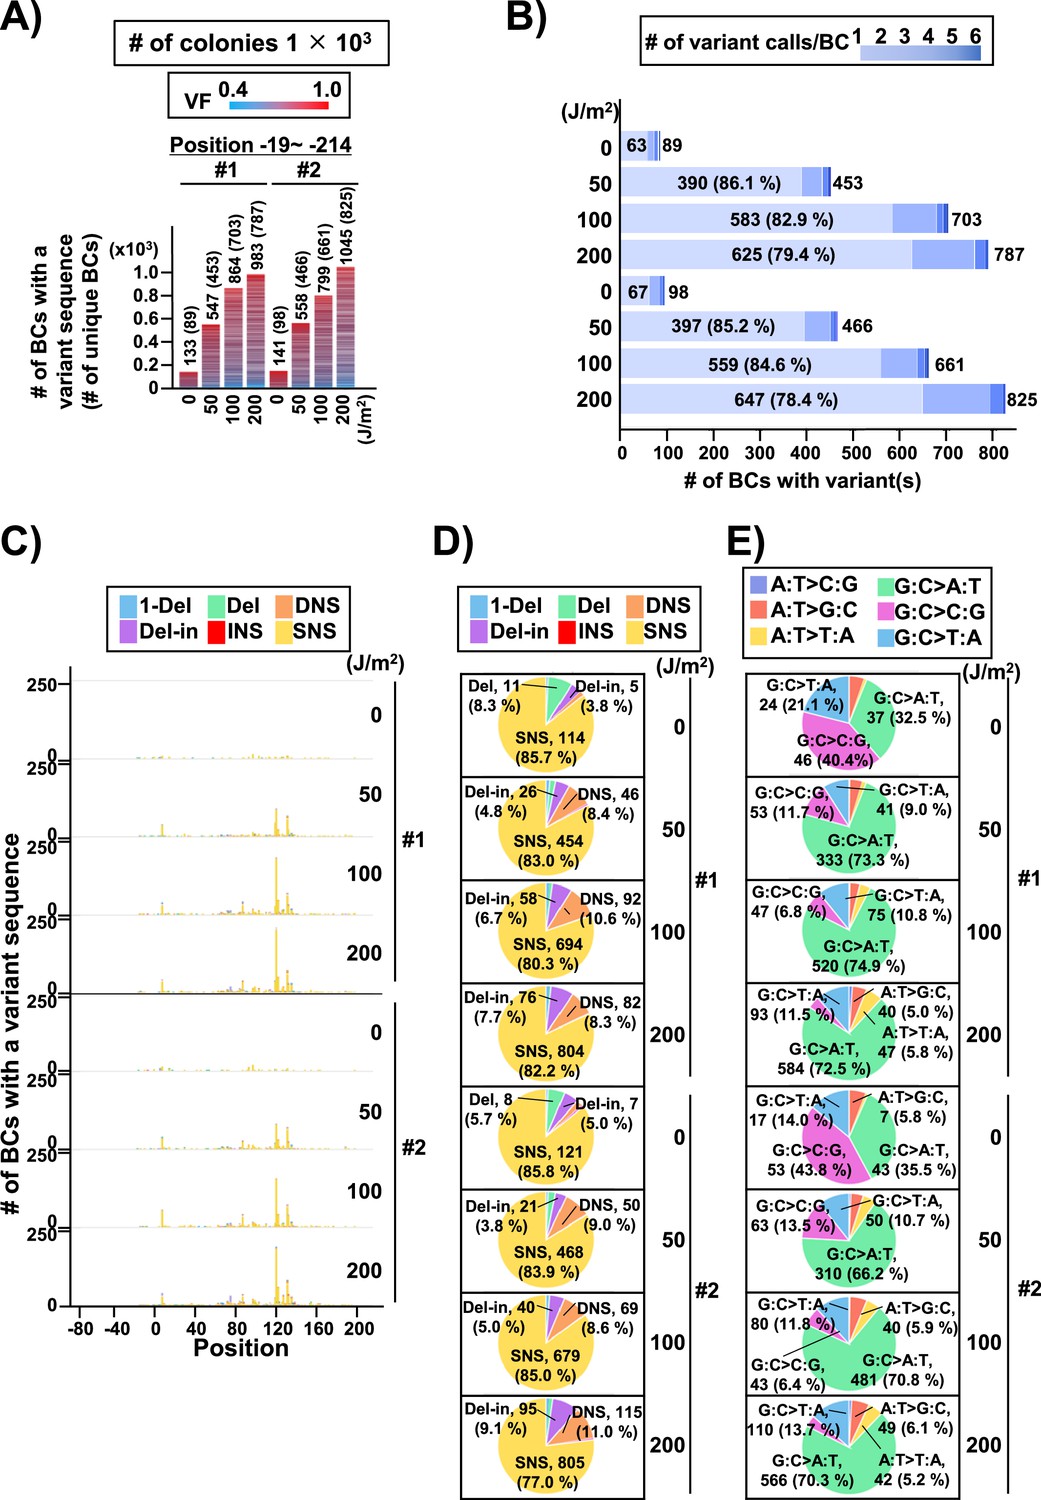
The data represents RF01 transformed with libraries extracted from transfected U2OS cells. For identical N12-BC sequences with variants the data is obtained from duplicate PCR samples. (A) Number of classified N12-BC sequences detected from colonies in selection plates (see Figure 1C (iv)). Approximately 1×10³ colonies were harvested and analyzed. The number above each bar represents the number of classified N12-BC sequences, and the number in the brackets refers to the number of unique BCs with variant sequences. Source data is available in Supplementary file 6A. (B) Number of N12-BC sequences with single or multiple (1–6) mutations. The number of BCs with a single mutation is indicated inside each bar, with their percentage of the total N12-BC sequences added in brackets; the total number of mutations is indicated outside the bars and corresponds to the ‘# of unique BCs’ in panel (A). Source data is available in Supplementary file 6B. (C) Number of N12-BC sequences with a variant exceeding variant frequency (VF) 0.4 according to their nucleotide position. (D) Pie charts of the percentage distribution of mutation types. Source data is available in Supplementary file 6B. (E) Pie charts of the percentage distribution of different single nucleotide substitutions (SNSs). Source data is available in Supplementary file 6D.
Figure 10—figure supplement 1
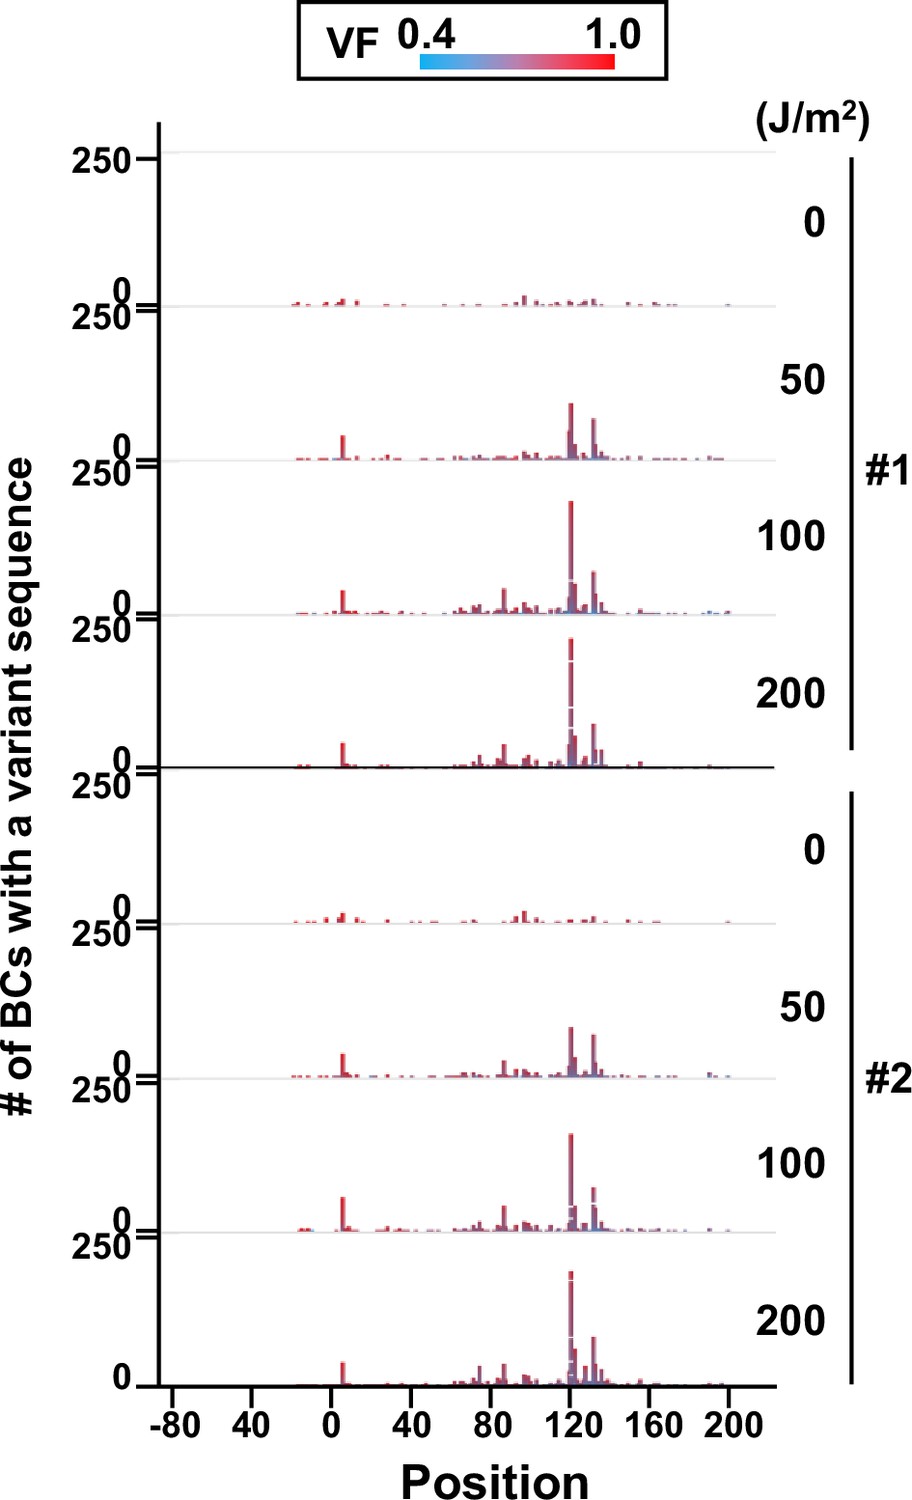
Number of N12-BC sequences with a variant exceeding variant frequency (VF) 0.4 at different UV-C doses and their distribution by nucleotide position (in mammalian cells, data from selection plates).
The colors reflect the VF as indicated by the heatmap on top.
Figure 11
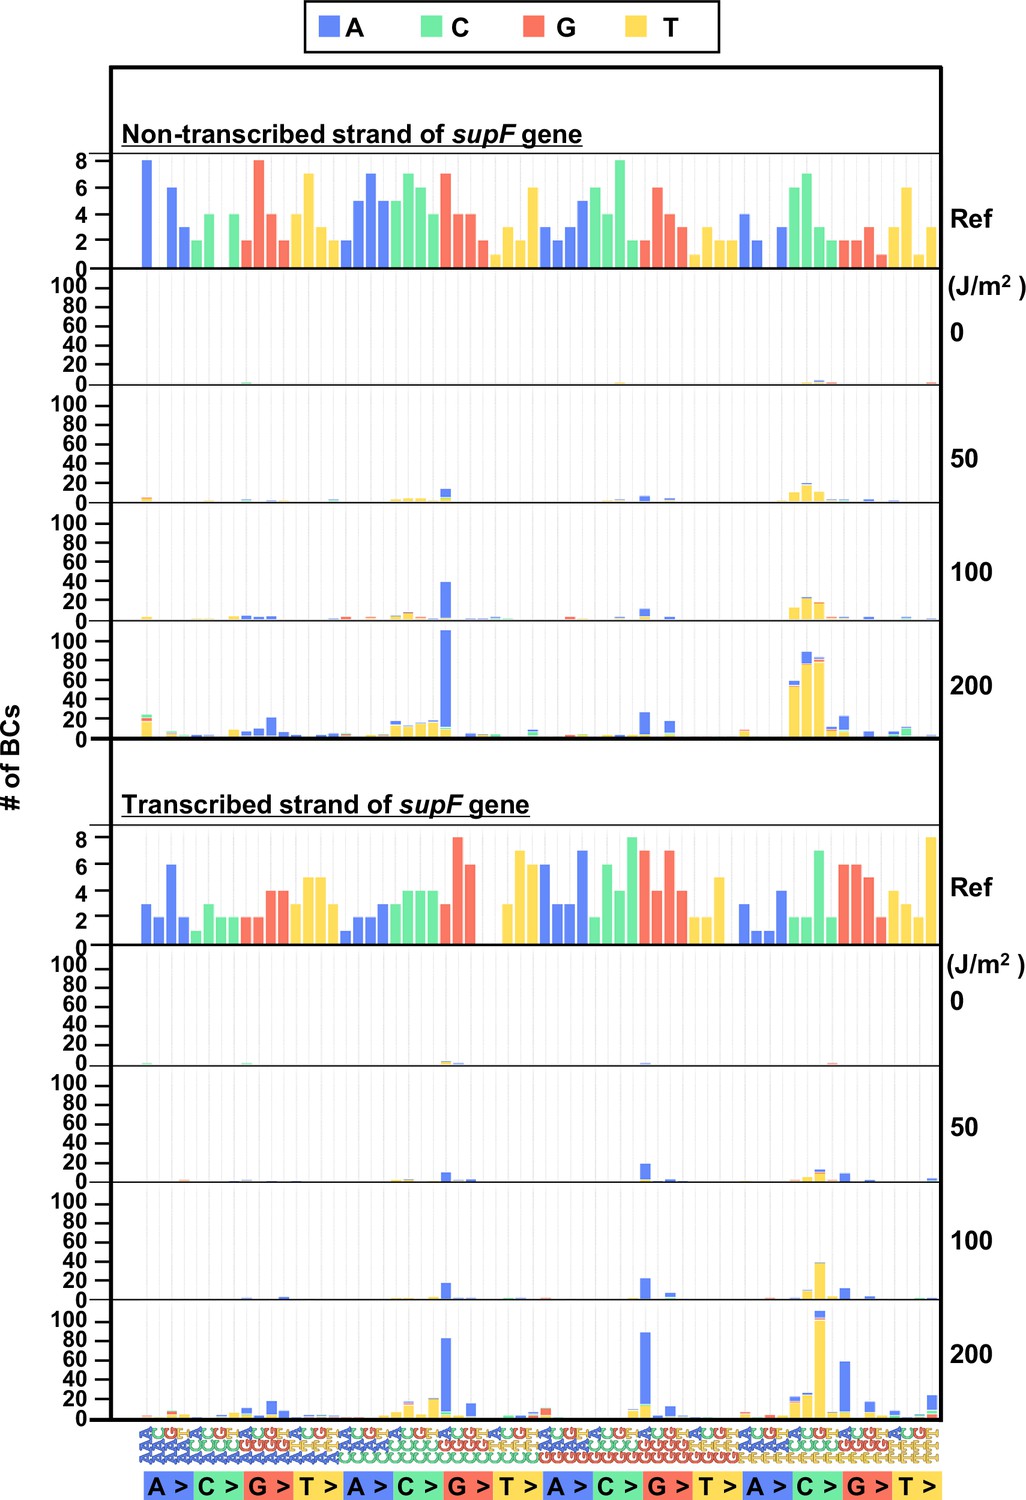
The 192 trinucleotide contexts of ultraviolet (UV) radiation-induced single nucleotide substitutions (SNSs) in mammalian cells (data from selection plates).
SNSs induced by UV irradiation in the supF gene shown in 192 trinucleotide contexts. The data for the non-transcribed (top panel) and transcribed (bottom panel) strand of the supF gene is shown. Source data is available in Supplementary file 6E.
Figure 12 with 2 supplements
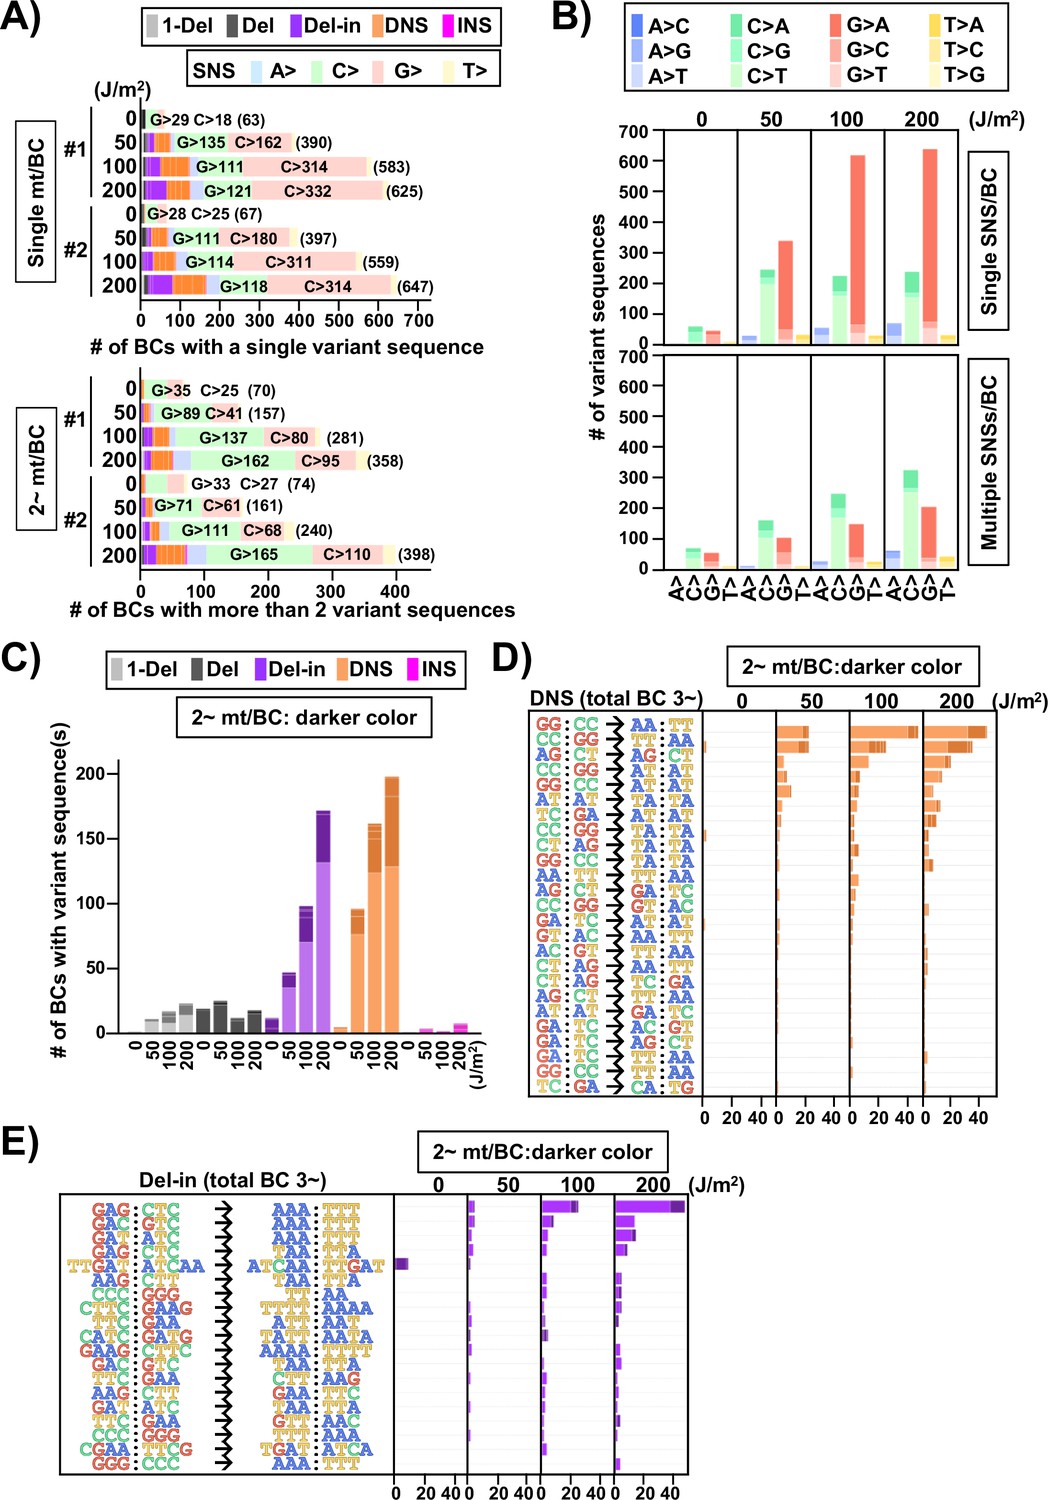
Ultraviolet (UV)-induced mutations in the supF gene in mammalian cells (data from selection plates).
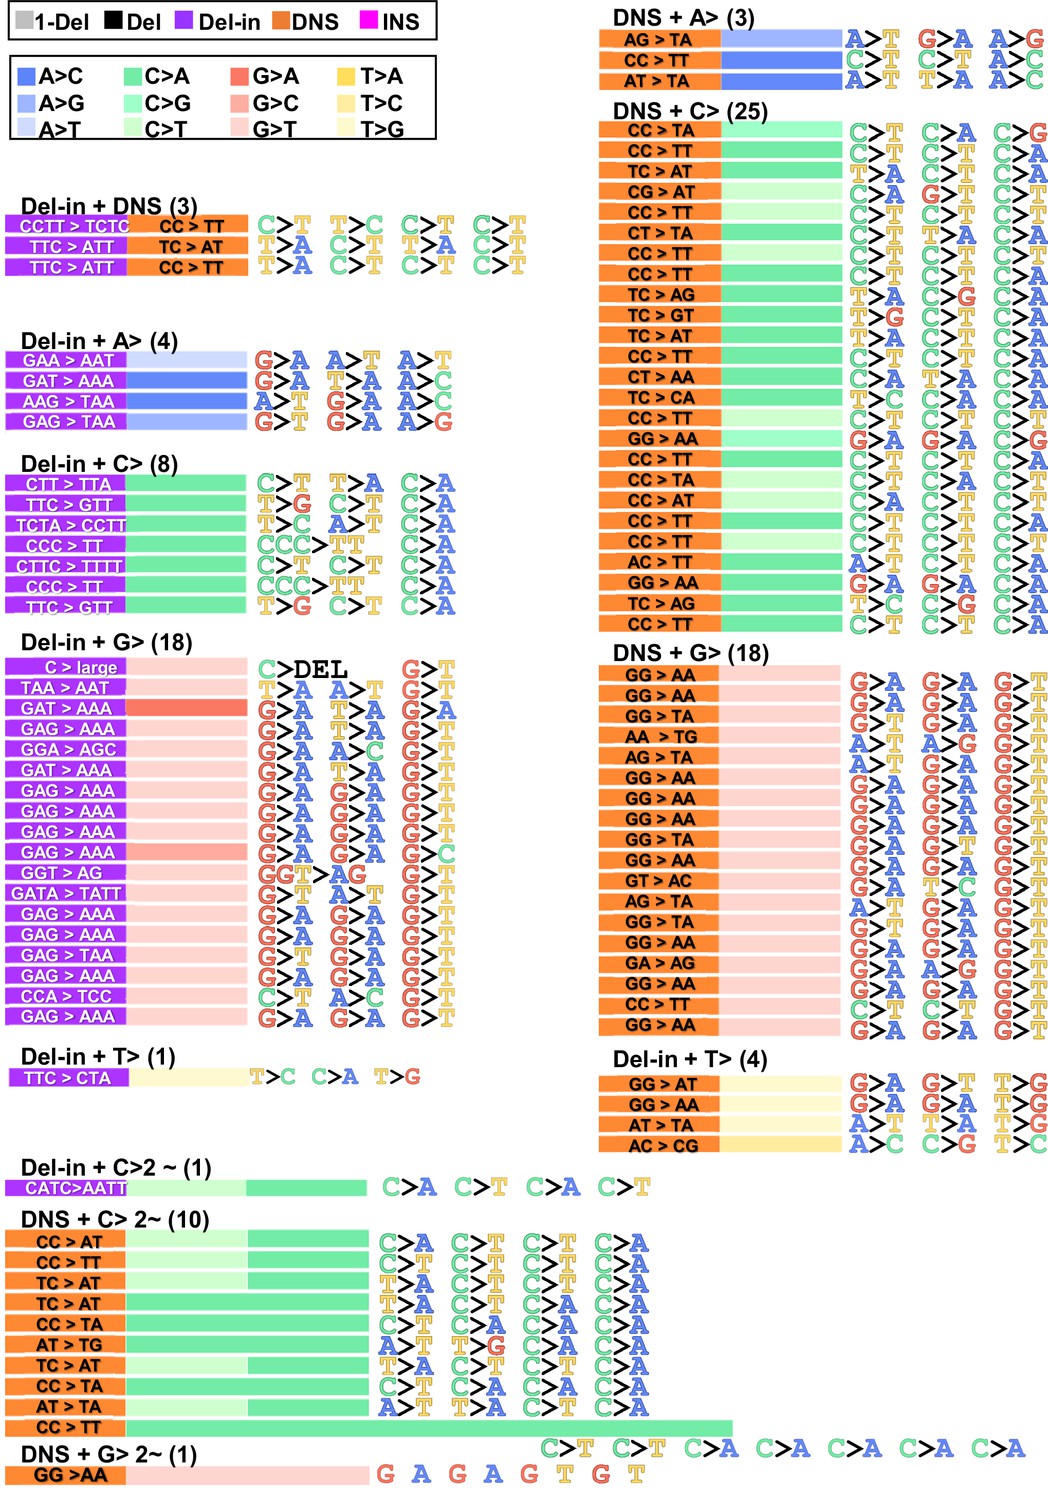
The mutation sequence on the non-transcribed strand of the supF gene is analyzed. (A) Proportions of mutation types in BCs with a single variant sequence (single mt/BC) or more than one variant sequence (2~ mt/BC). Source data is available in Supplementary file 7A. (B) Number of single nucleotide substitutions (SNSs) induced by UV irradiation – one SNS per BC (graph on top), and multiple SNSs (2~) per BC (bottom graph). The nucleotide sequences of SNSs are indicated by colors as shown in the legend. Source data is available in Supplementary file 7B. (C) Number of mutations induced by UV irradiation classified by mutation type, except for SNSs. The mutation types are shown in different colors as indicated in the legend. For each color, the lighter shade indicates single mutation per BC, and the darker shade indicates multiple mutations per BC. Source data is available in Supplementary file 7C. (D) Number of dinucleotide substitutions (DNSs) and their mutation sequences. The mutations have been listed if more than two identical mutation sequences among all samples have been detected. Source data is available in Supplementary file 7D. (E) Number of deletions with insertions (Del-in) mutations and their sequences. The mutations have been listed if more than two identical mutation sequences among all samples have been detected. Source data is available in Supplementary file 7E.
Figure 12—figure supplement 1
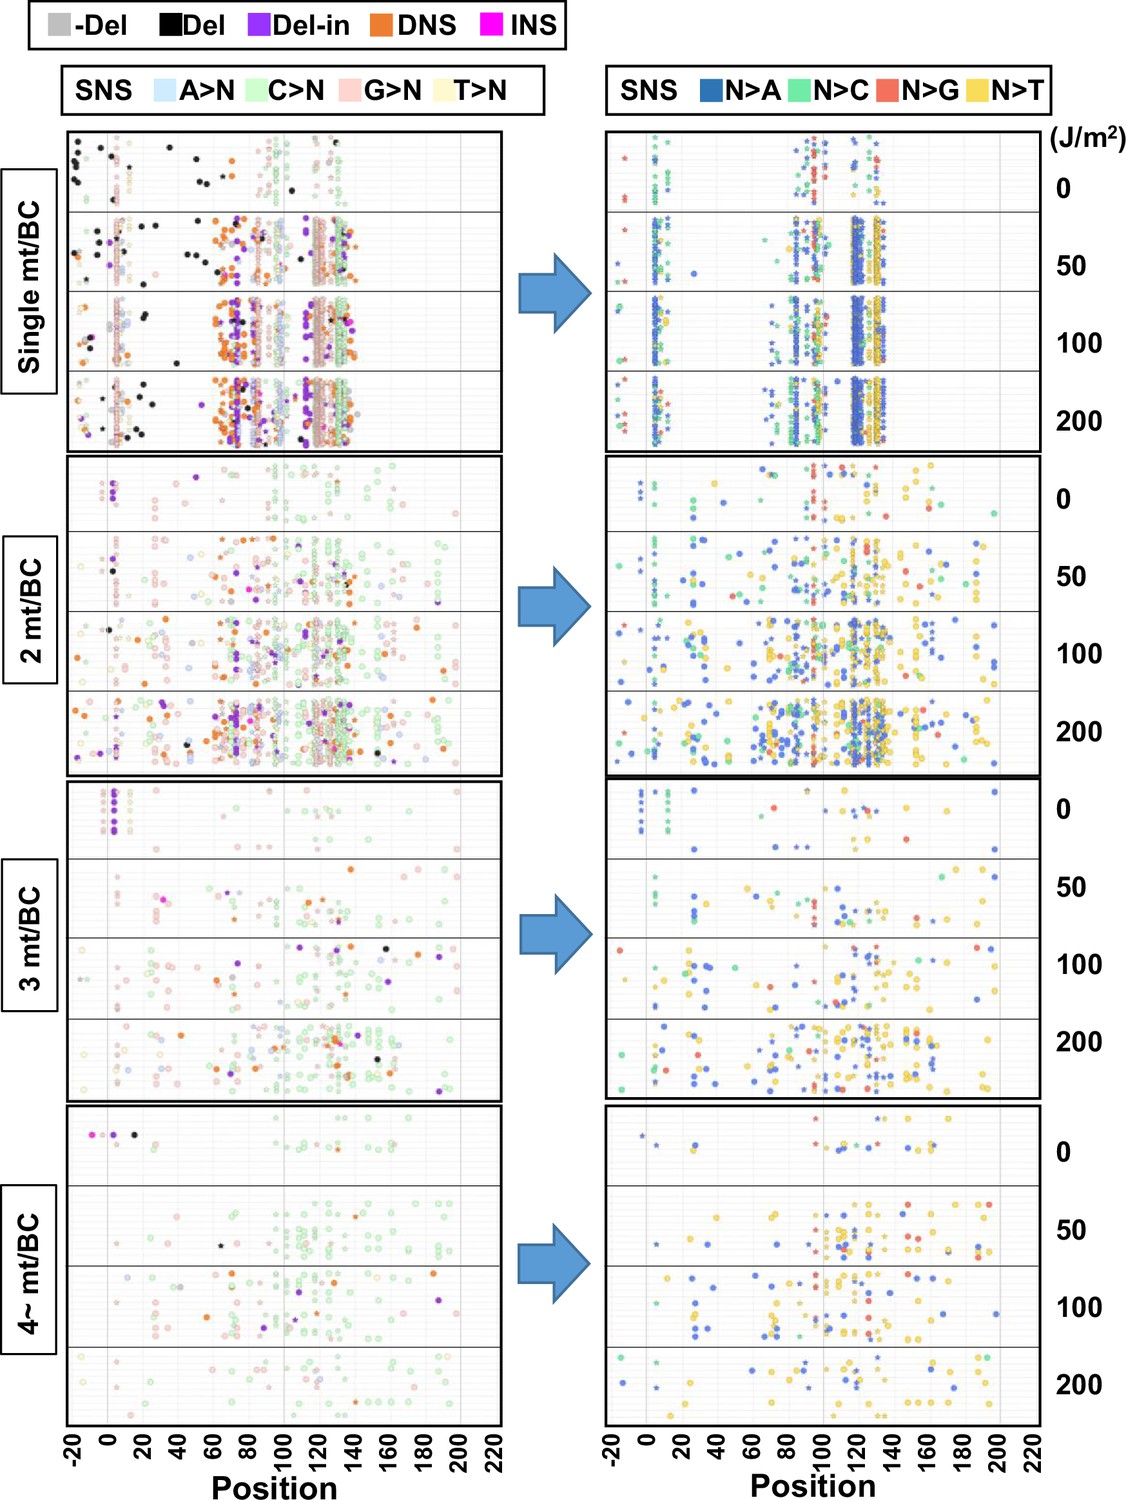
The position and mutation type of each identified mutation (data from selection plates, 0–200 J/m2).
The position and mutation type of each identified mutation are presented in dot plots for the cases of 1, 2, 3, or 4~ mutations per BC. The star symbols indicate the positions of mutations associated with mutant phenotype of the supF gene. Each type of mutation is indicated by a different color in the left-side plots (legend on top). The bases after the substitution are indicated by a different color for only single nucleotide substitutions (SNSs) in the right-side plots (legend on top). The mutations in identical BCs are plotted on the same horizontal line. Data is combined from Lib104_#1 and Lib104_#2.
Figure 12—figure supplement 2

The combinations of ultraviolet (UV)-induced mutation types in the supF gene in mammalian cells (data from selection plates, 0–200 J/m2).
Combinations of mutation sequences for each BC with multiple mutations for each UV dose. Combinations of more than one mutation per BC are shown. Each type of mutation is indicated by a different color and the type of aberration. The number in brackets and the height of stacked horizontal bars represent the number of BCs with the mutation(s).
Figure 13 with 3 supplements
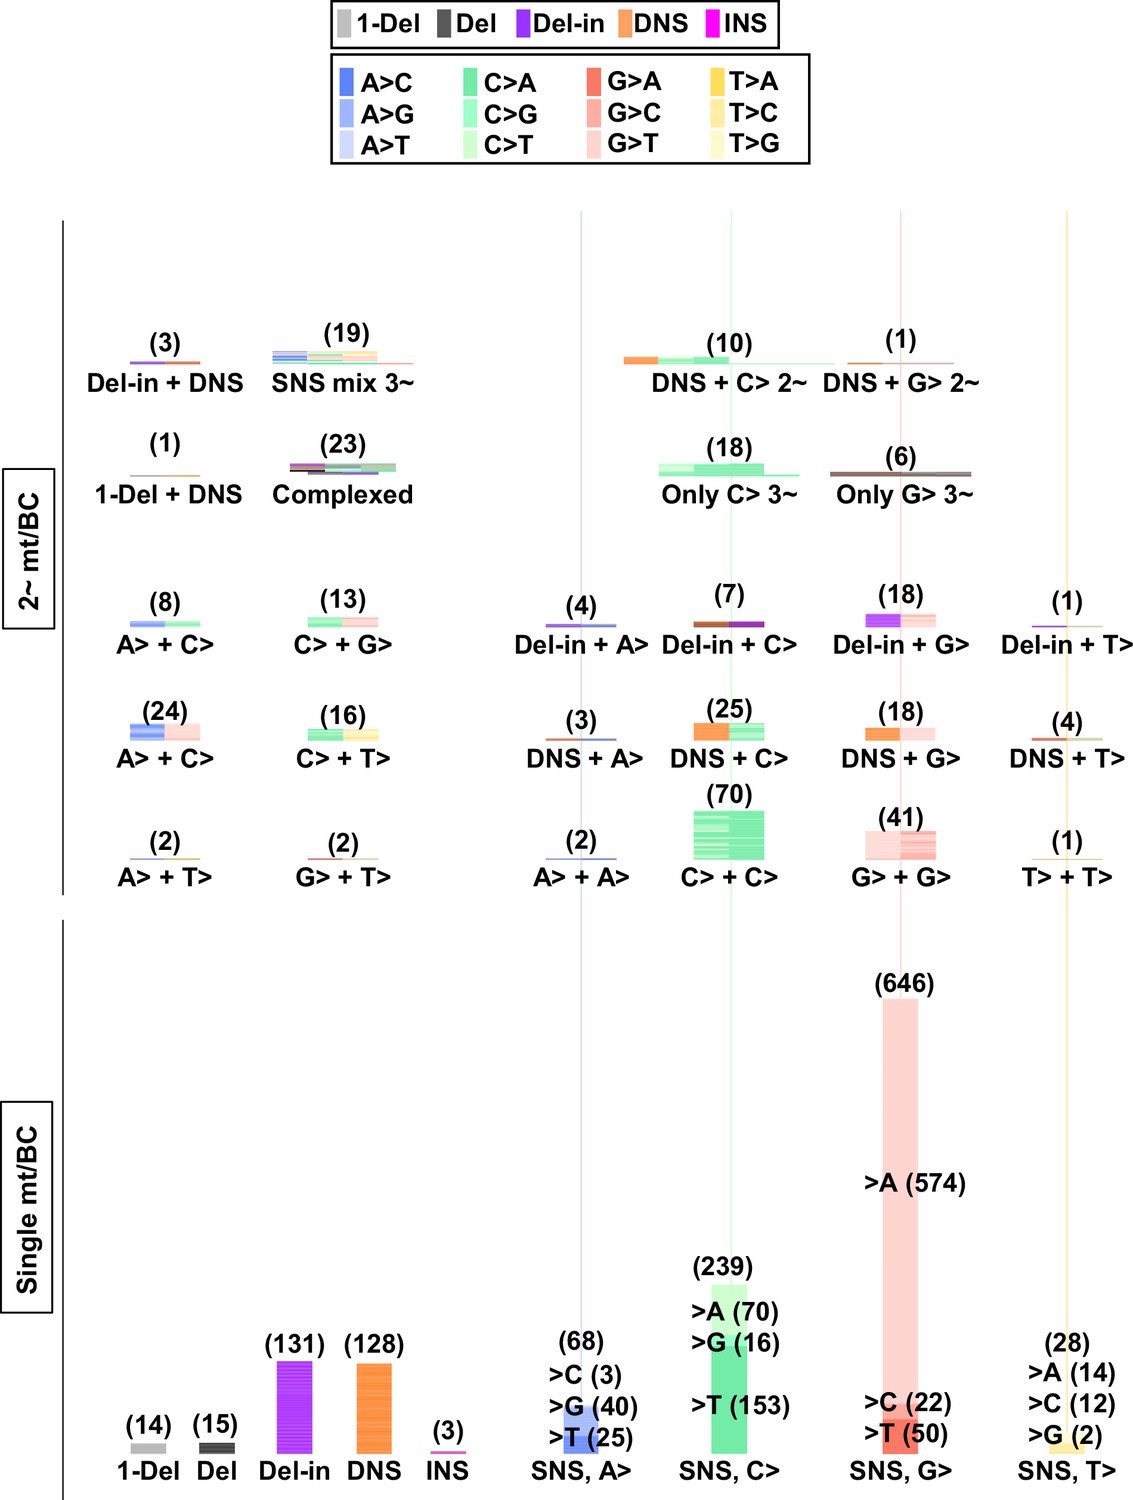
Numbers and combinations of detected mutations per N12-BC in mammalian cells (data from selection plates, 200 J/m2).
The numbers of detected mutations for each single mutation per N12-BC (lower part) and for combinations of more than one mutations per N12-BC (upper and middle part) are shown by stacked thin horizontal bars. The type of mutation is indicated by a different color (legend on top) and by its abbreviation on the horizontal axis. The number in brackets and the height of the stacked horizontal bars represent the number of BCs with the mutation(s).
Figure 13—figure supplement 1
The combinations of ultraviolet (UV)-induced mutation types and mutation spectrum in the supF gene in mammalian cells (data from selection plates, 200 J/m2).
Combinations of mutation sequences for each BC with multiple mutations for 200 J/m2. Each type of mutation is indicated by a different color (legend on top). The horizontal bars reflect the type, sequence, and combinations of mutations, and the number of combinations is indicated next to each categorized group of horizontal bars.
Figure 13—figure supplement 2
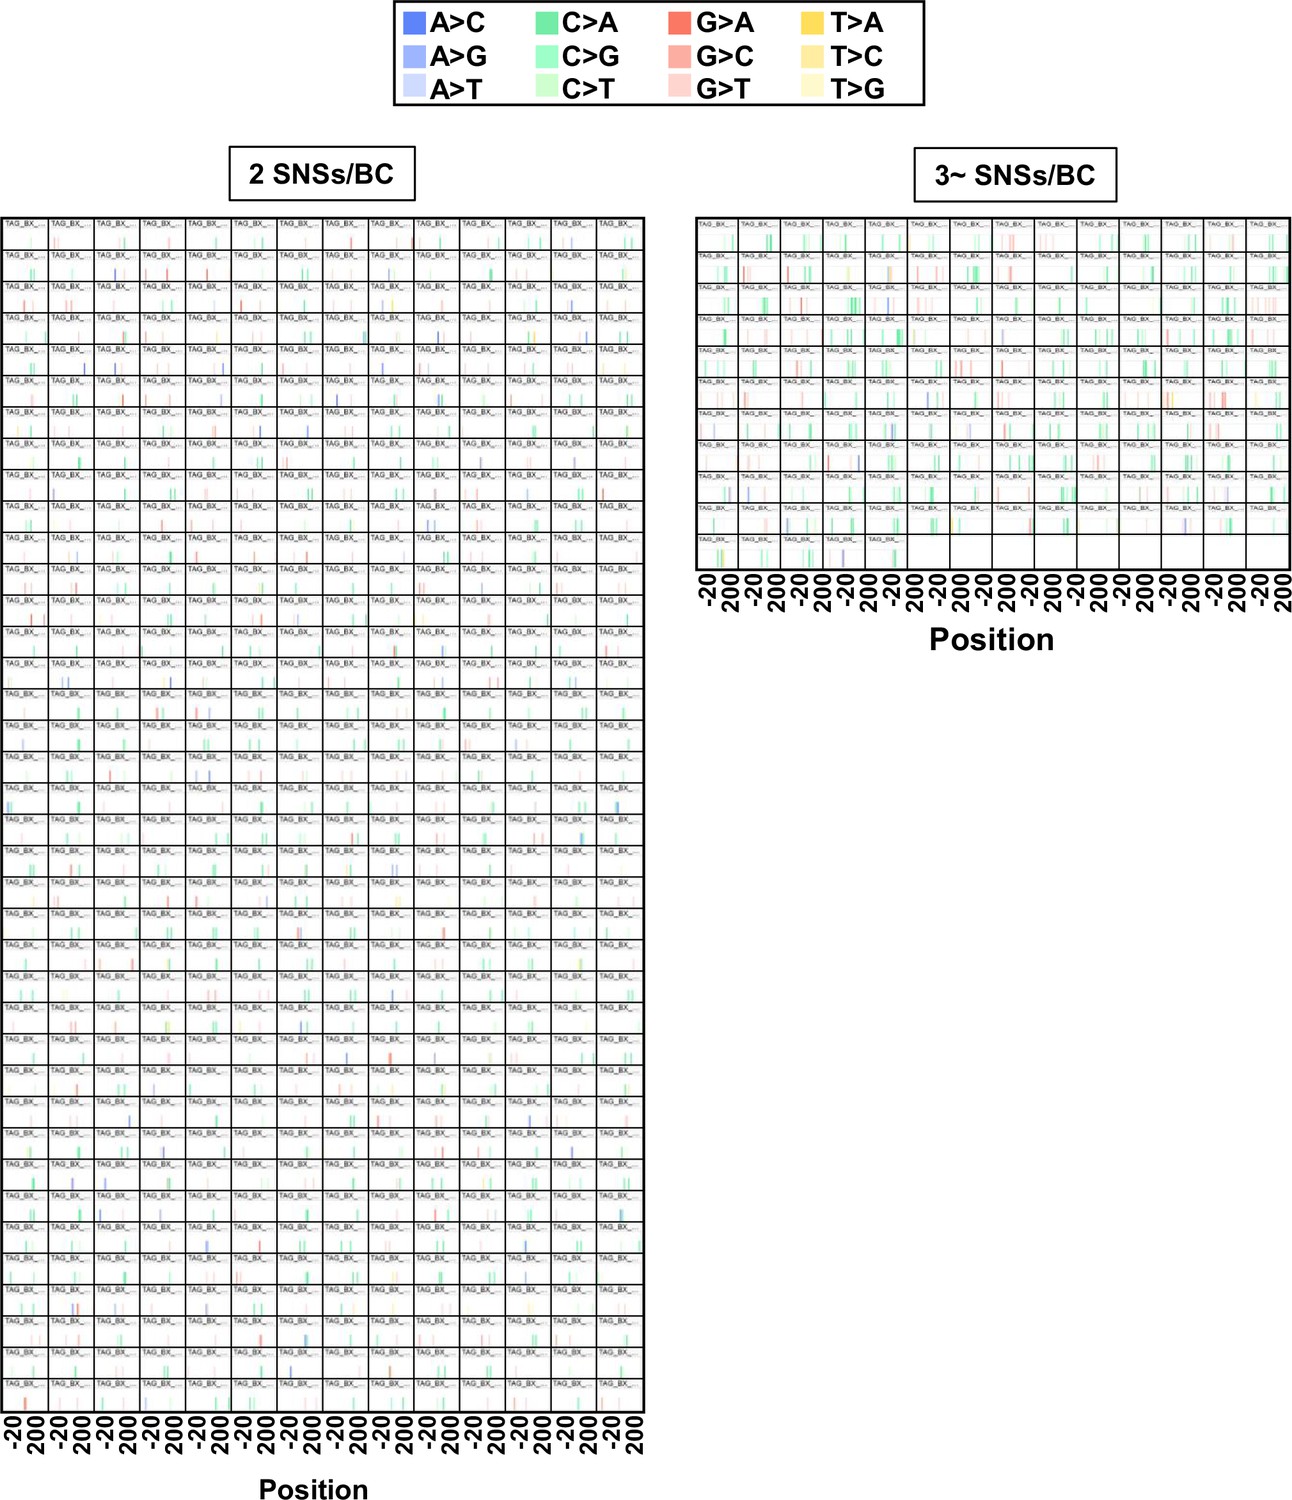
The distance between multiple single nucleotide substitutions (SNSs) per BC (data from selection plates, 50, 100, and 200 J/m2).
The position and type of each identified mutation per BC are presented in bar graphs for the cases of 2 (left-side graph) or 3~ (right-side graph) mutations per BC (233 bp, positions –19 to 214). Each single base substitution is indicated by a different color (legend on top). Data is combined from Lib104_#1 and Lib104_#2.
Figure 13—figure supplement 3
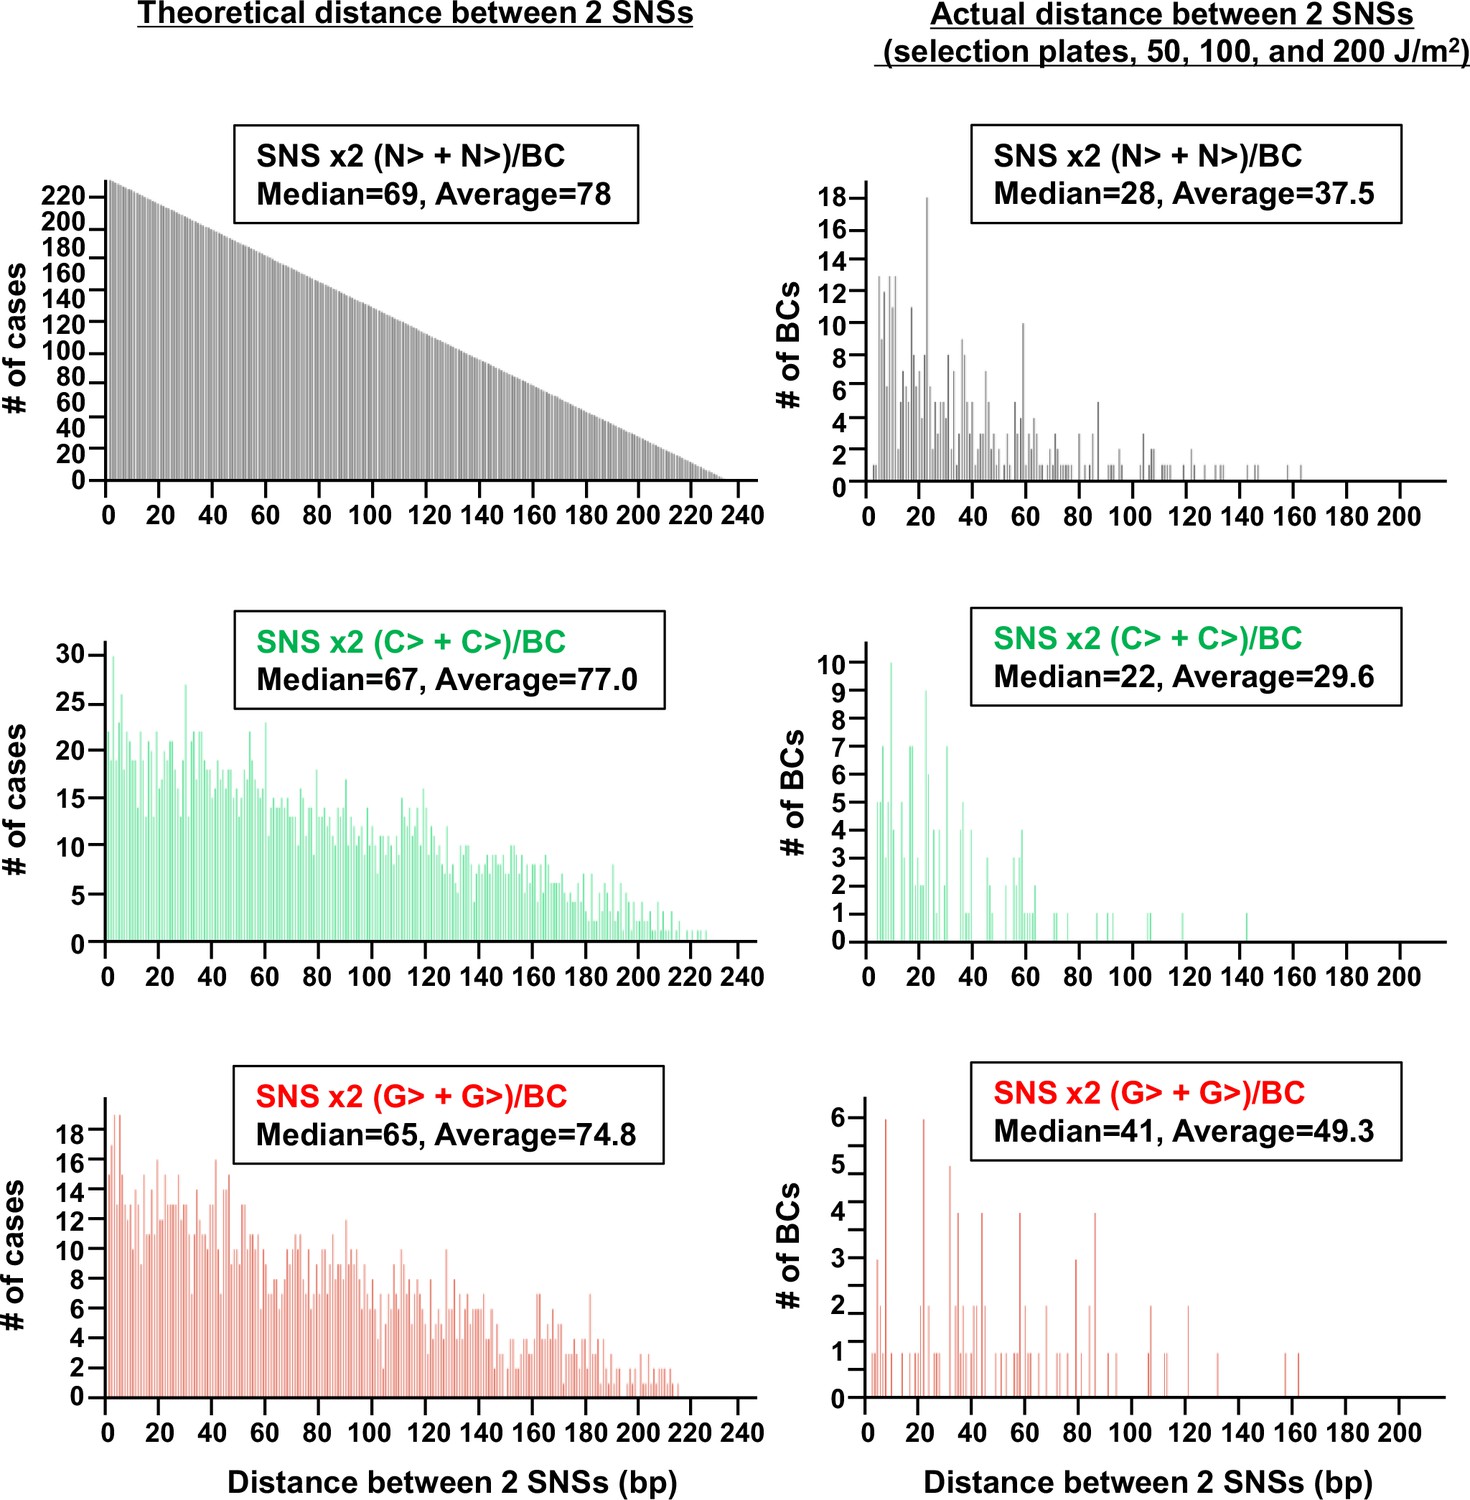
The distribution of the distance between two single nucleotide substitutions (SNSs) per BC (data from selection plates, 50, 100, and 200 J/m2).
The theoretical distances (bp) between two bases based on the sequence (233 bp, positions –19 to 214) are shown in the left-side histograms for all four bases (top), for two cytosines (middle), and for two guanines (bottom). The actual distances between two SNSs induced by ultraviolet (UV) per BC are shown on the right side. Data is combined from Lib104_#1 and Lib104_#2. The median and average distance are shown on the top of each histogram.
Figure 14
Summary of results for ultraviolet (UV)-induced mutagenesis of the supF gene in mammalian cells.
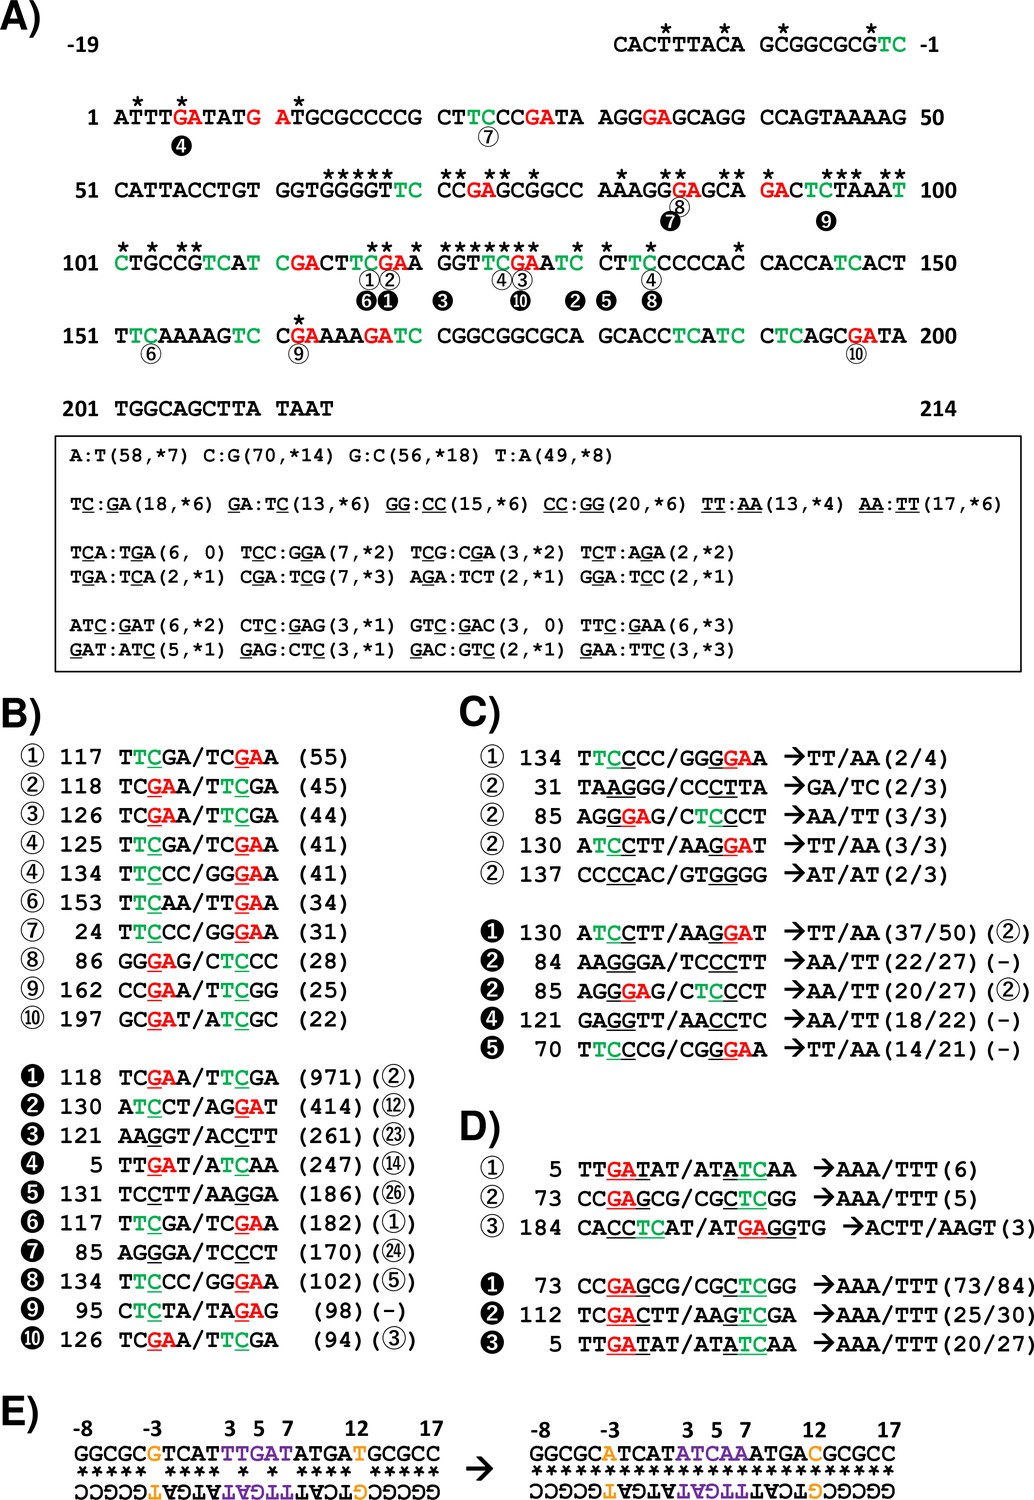
(A) The nucleotide sequence of the non-transcribed strand (sense strand) is analyzed (233 bp, positions –19 to 214). The nucleotides with an asterisk are associated with the supF mutant phenotype resulting from one single nucleotide substitution (SNS) according to our previous experimental data. The 5'-TC-3' sites are shown in green color, and the 5'-GA-3' sites are shown in red color. The nucleotide positions with a number in a circle correspond to the sequences listed in panel (B). A summary of the numbers of indicated 5' to 3' sequences from the non-transcribed strand and their complementary sequences from the transcribed strand are shown in the text box. The first number in the brackets represents the total number of the indicated nucleotide sequences, and the number with an asterisk represents the number of nucleotides associated with the supF mutant phenotype resulting from SNSs at the site of the underlined nucleotide. (B) The UV-induced SNSs at individual positions are sorted by the frequency of their detection (number of BCs) from most to least. The rank of the frequency is shown by the numbers in either a white circle referring to data from titer plates (corresponding to Figures 8 and 9) or a black circle referring to data from selection plates (corresponding to Figures 10 and 11). The SNS is denoted as an underlined nucleotide in a pentanucleotide sequence (including two nucleotides upstream and downstream of the mutation, and the sequence of the non-transcribed strand/transcribed strand). The number next to the rank is the position of each mutation, corresponding to the nucleotide sequence in panel (A). The number in brackets represents the number of BCs with the mutation. (C) Data for double nucleotide substitutions, analogous to panel (B). The majority of converted two-nucleotide sequences for each underlined two nucleotides in a hexanucleotide sequence is shown by arrows. The number of the tandem two-nucleotide substitutions is shown before the slash in the brackets, and the total number of the two-nucleotide substitutions – after the slash. (D) Data for deletion/insertion mutations, analogous to panels (B) and (C). (E) The potential hairpin loop of the quasi-palindromic sequence in the reference sequence (on the left side), and the mutated sequence detected from the selection plate of the non-irradiated sample (on the right side). The numbers represent the nucleotide position in the non-transcribed strand sequence of the supF gene. The potential Watson-Crick hydrogen bonded base pair is shown by an asterisk. The nucleotide sequences detected as SNS mutations at positions –3 and 12 are shown in orange color, and for deletion/insertion at positions 3–7 – in purple color.
Additional files
-
Supplementary file 1
The valid sequences and the numbers of N12-BCs in the library.
- https://cdn.elifesciences.org/articles/83780/elife-83780-supp1-v2.xlsx
-
Supplementary file 2
The data of variant calling analysis by VarDict for the N12-BC libraries used for Figures 2 and 3.
- https://cdn.elifesciences.org/articles/83780/elife-83780-supp2-v2.xlsx
-
Supplementary file 3
The data of variant calling analysis by VarDict for the N12-BC libraries used for Figures 4 and 5.
- https://cdn.elifesciences.org/articles/83780/elife-83780-supp3-v2.xlsx
-
Supplementary file 4
The data of variant calling analysis by VarDict for the N12-BC libraries used for Figures 6 and 7.
- https://cdn.elifesciences.org/articles/83780/elife-83780-supp4-v2.xlsx
-
Supplementary file 5
The data of variant calling analysis by VarDict for the N12-BC libraries used for Figures 8 and 9.
- https://cdn.elifesciences.org/articles/83780/elife-83780-supp5-v2.xlsx
-
Supplementary file 6
The data of variant calling analysis by VarDict for the N12-BC libraries used for Figure 10.
- https://cdn.elifesciences.org/articles/83780/elife-83780-supp6-v2.xlsx
-
Supplementary file 7
The data of variant calling analysis by VarDict for the N12-BC libraries used for Figure 12.
- https://cdn.elifesciences.org/articles/83780/elife-83780-supp7-v2.xlsx
-
MDAR checklist
- https://cdn.elifesciences.org/articles/83780/elife-83780-mdarchecklist1-v2.docx
Download links
A two-part list of links to download the article, or parts of the article, in various formats.
Downloads (link to download the article as PDF)
Open citations (links to open the citations from this article in various online reference manager services)
Cite this article (links to download the citations from this article in formats compatible with various reference manager tools)
Development of a versatile high-throughput mutagenesis assay with multiplexed short-read NGS using DNA-barcoded supF shuttle vector library amplified in E. coli
eLife 11:e83780.
https://doi.org/10.7554/eLife.83780


