Dynamic fibronectin assembly and remodeling by leader neural crest cells prevents jamming in collective cell migration
- Wolfson Centre for Mathematical Biology, Oxford University, United Kingdom
- Children's Mercy Kansas City, United States
- Stowers Institute for Medical Research, United States
- Swanson School of Engineering, University of Pittsburgh, United States
- Department of Anatomy and Cell Biology, University of Kansas School of Medicine, United States
- Department of Biological Sciences, University of Notre Dame, United States
Figures
Figure 1 with 1 supplement

In vivo observations of fibronectin (FN) and results from gain/loss-of-function experiments.
(A) Schematic of a typical neural crest cell (NCC) migratory stream in the vertebrate head of the chick embryo, at developmental stage HH12–13 (Hamburger and Hamilation, 1951) at the axial level of the second branchial arch (ba2). (B) Transverse section through the NCC migratory stream at the axial level of rhombomere 4 (r4) triple-labeled for FN (green), nuclei (DAPI-blue) and migrating NCCs (HNK1-red). NCCs migrate subjacent to the surface ectoderm after emerging from the dorsal neural tube (NT). The arrowhead points to the surface ectoderm. The yellow boxes highlight the tissue subregions that contain the leader NCCs (box 1) and are distal to the leader NCCs (box 2), marking distinct shapes of the FN in each box with an asterisk (box 1) and open circle (box 2). (C) FN only. (D) The fibrous (box 1-asterisk) and punctate (box 2-open circle) appearance of FN in the NCC microenvironment. (E) NCC distance migrated in FN morpholino-injected embryos and (F) percentage area of the NCC migratory stream after microinjection of soluble FN into the r4 paraxial mesoderm prior to NCC emigration. NT = neural tube. The scale bars are 50 µm (B–C) and 10 µm (D).
Figure 1—figure supplement 1
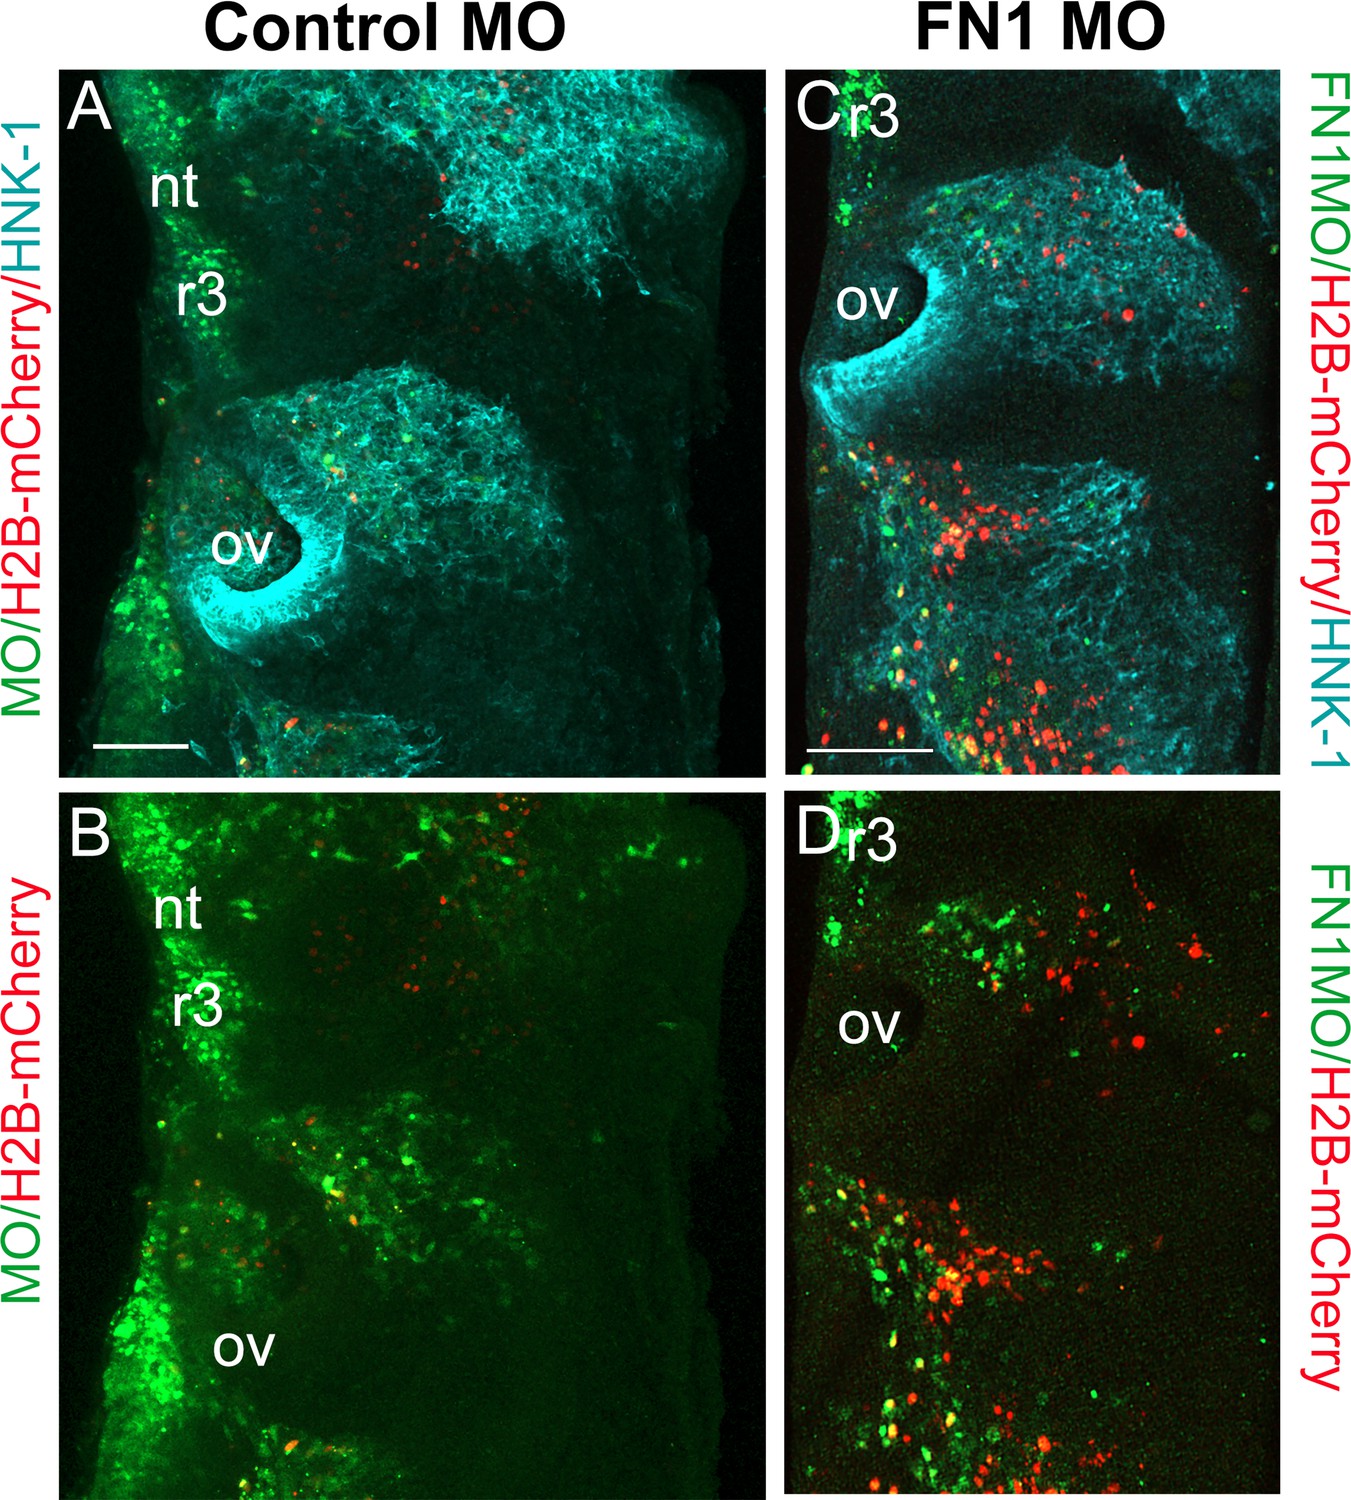
Morpholino knockdown of fibronectin in cranial neural crest cells.
(A) Control fluorescein morpholino (MO; green) co-injected with H2B-mCherry (red) at HH8 into the cranial dorsal neural tube, harvested and stained 24 hr later with HNK-1 (blue) to label all migrating neural crest cells. (B) Control-MO and H2B-mCherry. Dashed line shows entire rhombomere 4 (r4) structure. (C) Fibronectin-1 (FN1) morpholino (green) co-injected with H2B-mCherry (red) and stained with HNK-1 (blue) antibody as above. (D) FN1-MO and H2B-mCherry. Dashed line shows entire r4 structure. Scale bars = 100 µm. nt = neural tube, ov = otic vesicle.
Figure 2 with 13 supplements
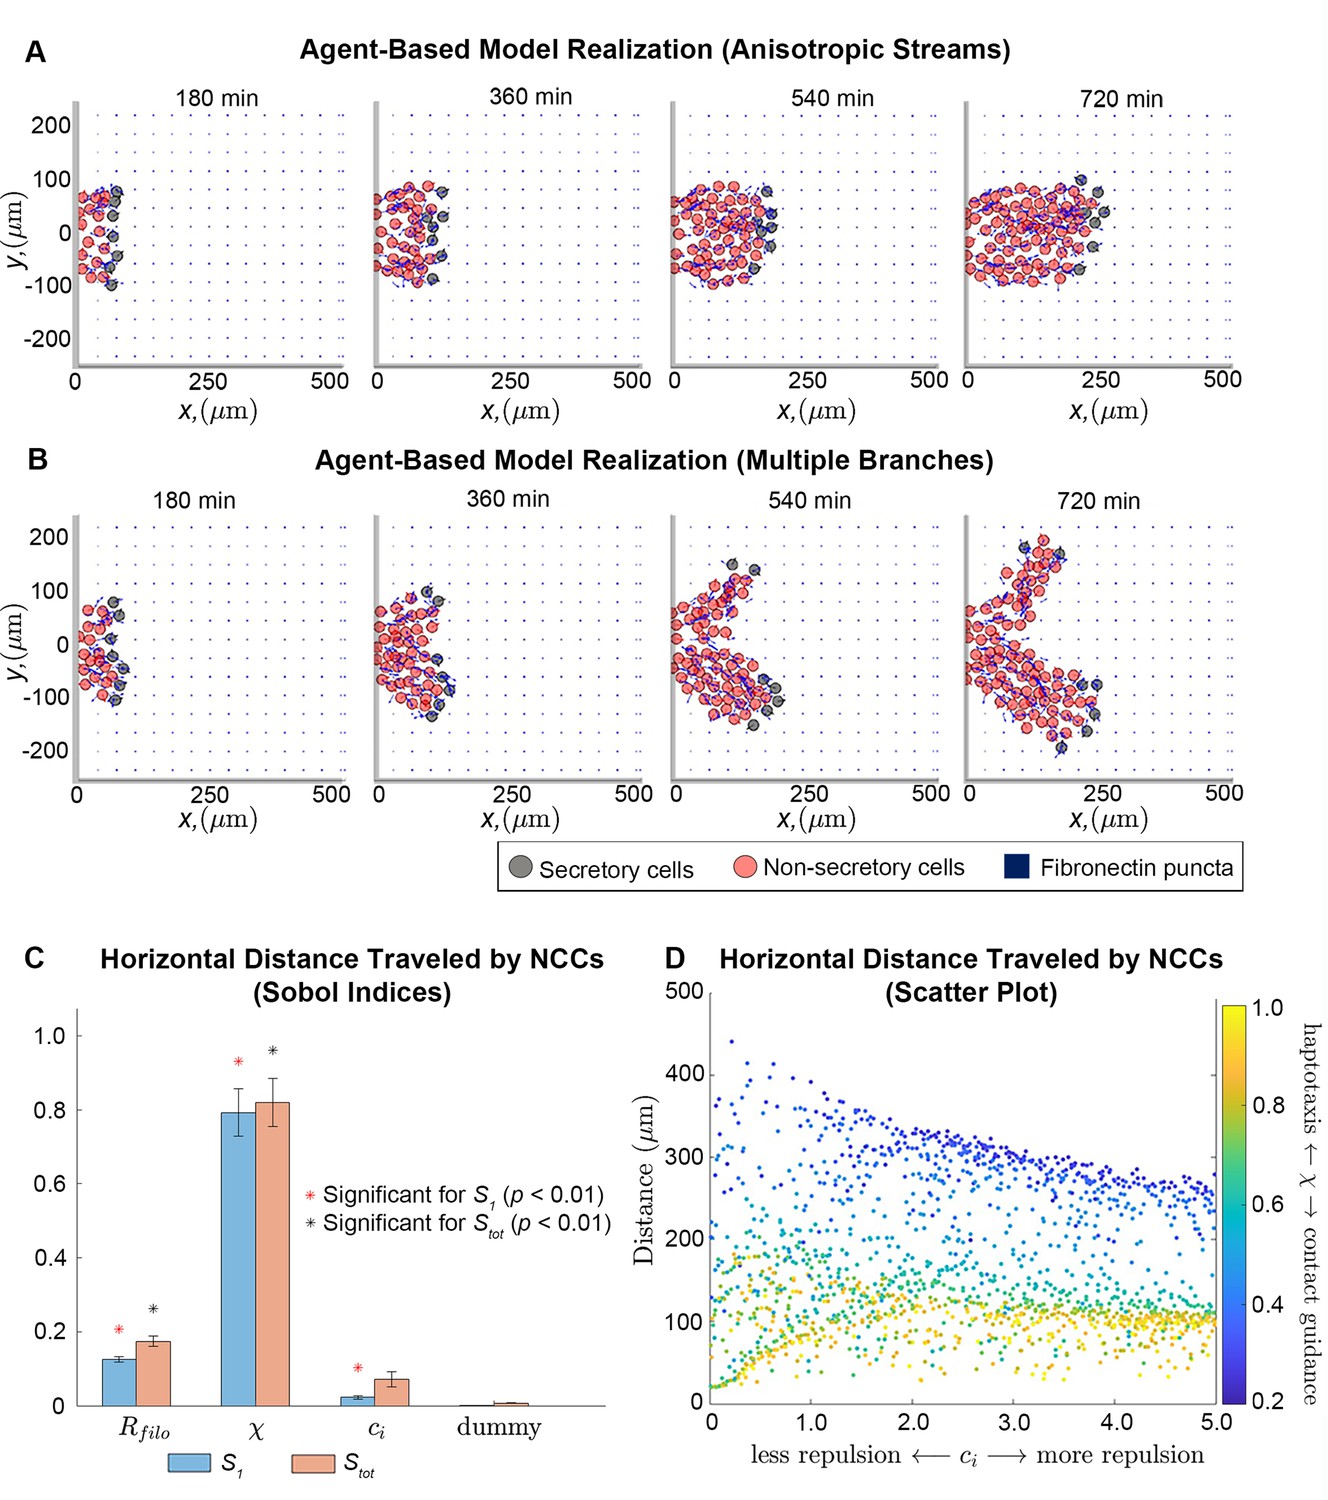
Integration of extracellular matrix (ECM) within an agent-based model (ABM) of neural crest cell (NCC) migration.
Individual snapshots (A) of an example ABM realization reveals that the model can generate a single anisotropically migrating stream over a simulated time of 12 hr. Different realizations generated using the same parameter values but different random seeds (B), however, may produce streams that exhibit the formation of multiple branches and demonstrate the range of possible model behaviors. Black circles denote leader cells, which can secrete new FN, red cells signify follower non-secretory cells, and blue squares correspond to FN puncta. Arrows denote cell velocities or fiber orientations. The extra column of FN at the right boundary is an artifact of visualization. Sobol indices (C) and scatter plots (D) of the horizontal distance traveled by NCCs indicate that this metric is most sensitive to the haptotaxis-contact guidance weight, , and the filopodial length, , but is less dependent on parameters related to cell-cell repulsion (). Statistical significance in (C) is determined from a two-sample -test that compares the Sobol indices produced by the parameter of interest to those obtained from a dummy parameter (red asterisks indicate significant first-order indices, black asterisks indicate significant total order indices, p<0.01). Each data point in (D) represents the average of 20 ABM realizations.
Figure 2—figure supplement 1

Overview of the agent-based model (ABM).
A neural crest cell (NCC) agent (A, blue circle) has a cell body radius, (solid red line), and a filopodial radius, (solid black line). The latter denotes the maximum area of interaction (dashed black circle), in which a cell can sense extracellular matrix (ECM) molecules and its neighbors. The ABM initial condition (B) places leader cells (black circles) along a subset of the left-hand boundary that has a user-specified height, . An equally spaced lattice of FN puncta (blue squares) is placed just to the right of the leader cell column. The parameters used to generate the configuration in (B) are , , and (see the main text and Table 1 of the Materials and methods section for a description of these parameter values). The neural tube entrance strip, along which new cells enter the domain, is denoted by a green rectangle. When new trailing NCCs enter the domain, they will be placed at the locations marked by the black circles, provided they do not overlap with another cell. The flowchart (C) summarizes the relationships between the cell velocity, contact guidance cue, haptotaxis cue, NCC-ECM force, and the cell-cell repulsion force. We refer to the text for a discussion of how each cue is determined from the current NCC/FN configurations.
Figure 2—figure supplement 2
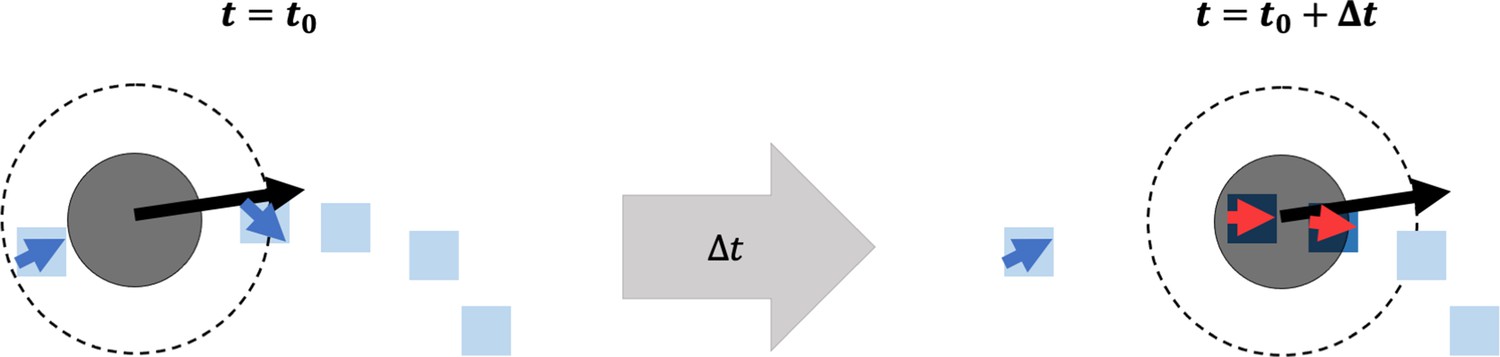
Overview of fibronectin (FN) remodeling in the agent-based model.
A cartoon depiction of a neural crest cell (NCC) (solid black circle) at time (left), moving with a given velocity (black arrow) toward a collection of FN puncta (blue squares) and fibers (blue squares with blue arrowheads). Over a time (right), the NCC passes over an FN punctum and a fiber, remodeling their orientations (red arrowheads). For the punctum, this is done by equipping it with a unit vector aligned in the direction of the current cell velocity. The fiber orientation is updated using the equations listed in the Materials and methods section. The NCC must cover FN puncta and fibers to adjust their orientations. The dashed circle around the NCC represents the maximum length of its filopodial extensions.
Figure 2—figure supplement 3
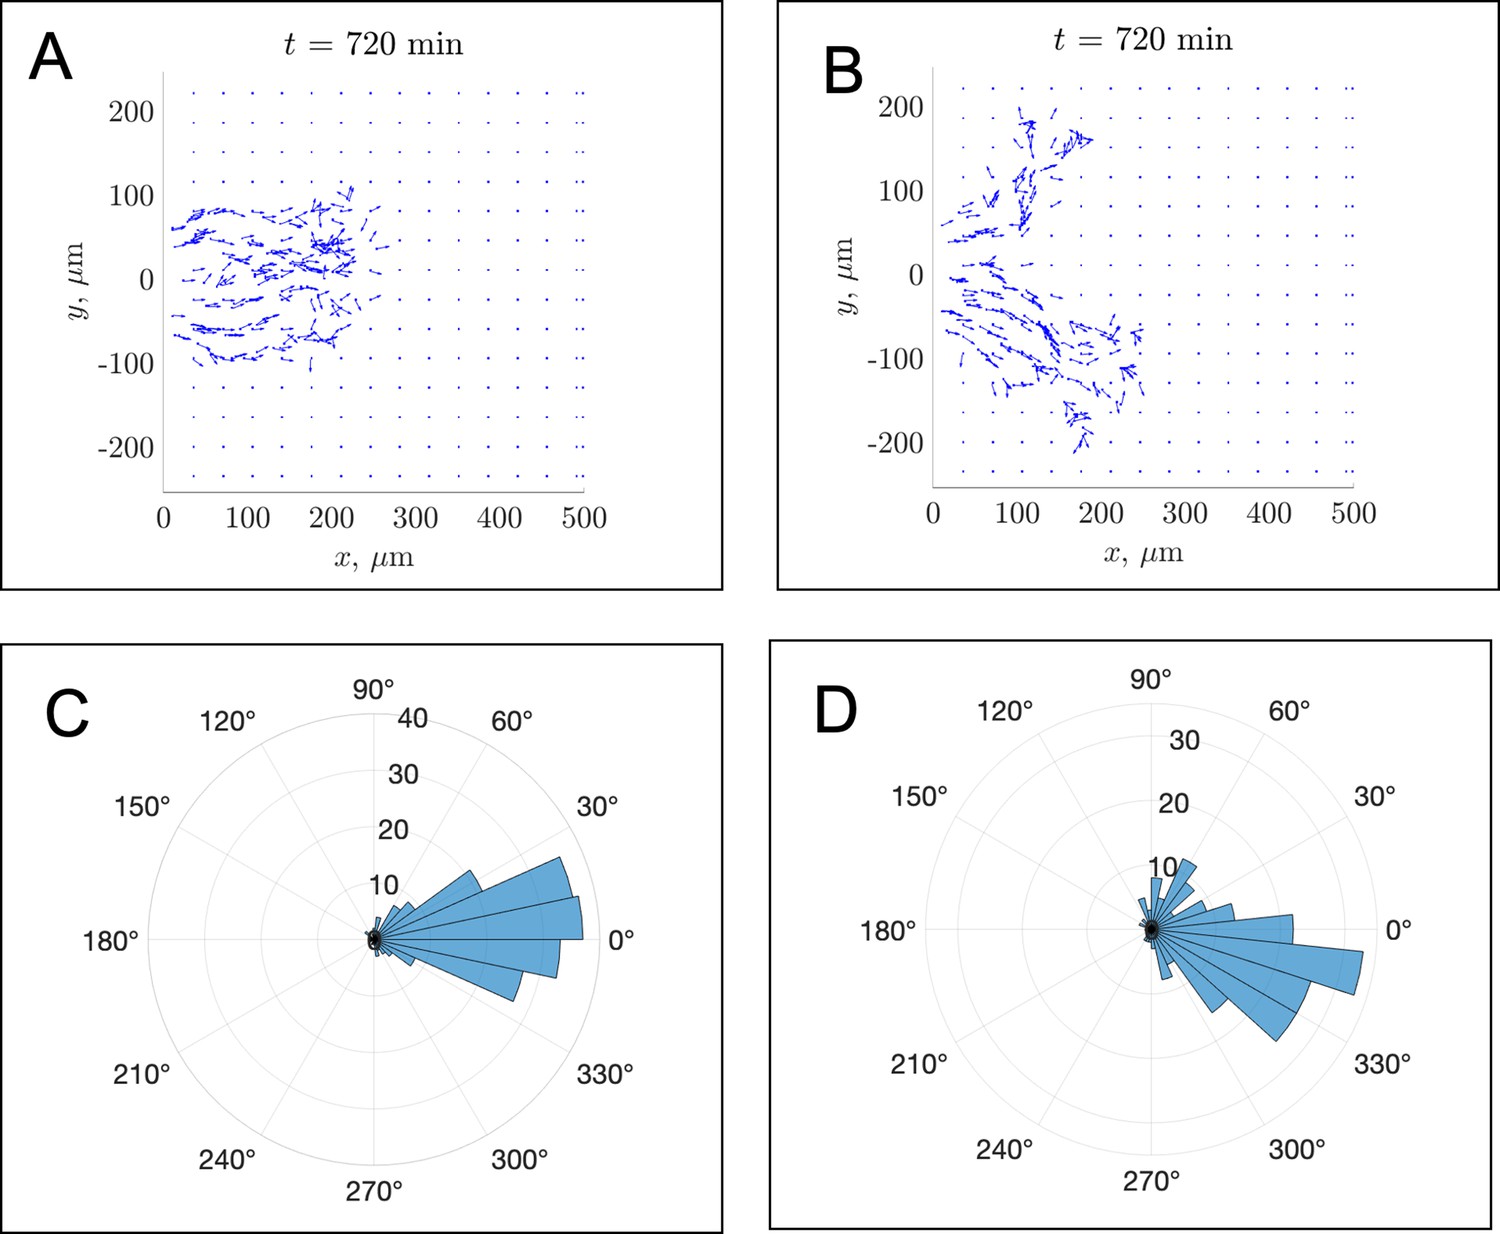
In silico fibronectin distributions in individual realizations.
The distribution of fibronectin is shown at the final time min for (A) the in silico experiment corresponding to Figure 2A and (B) the experiment visualized in Figure 2B of the main text. Blue squares denote fibronectin puncta, while blue arrows show fibronectin fibers and their orientations. Due to the density of fibronectin that is secreted by leader cells, there may be difficulties in visualizing specific arrowheads. Panels (C) and (D) compensate for this by presenting polar histograms of the fibronectin fiber orientations shown in panels (A) and (B), respectively. The distribution in panel (C) suggests that most fibers are oriented along the horizontal axis, while the distribution in panel (D) shows that most fibers are oriented about 15–30 degrees below the horizontal axis (along the direction of the second stream branch). For this parameter regime, the average FN fiber angle with respect to the horizontal axis was equal to –0.01 ± 0.26 radians (–0.5 ± 14 degrees).
Figure 2—figure supplement 4
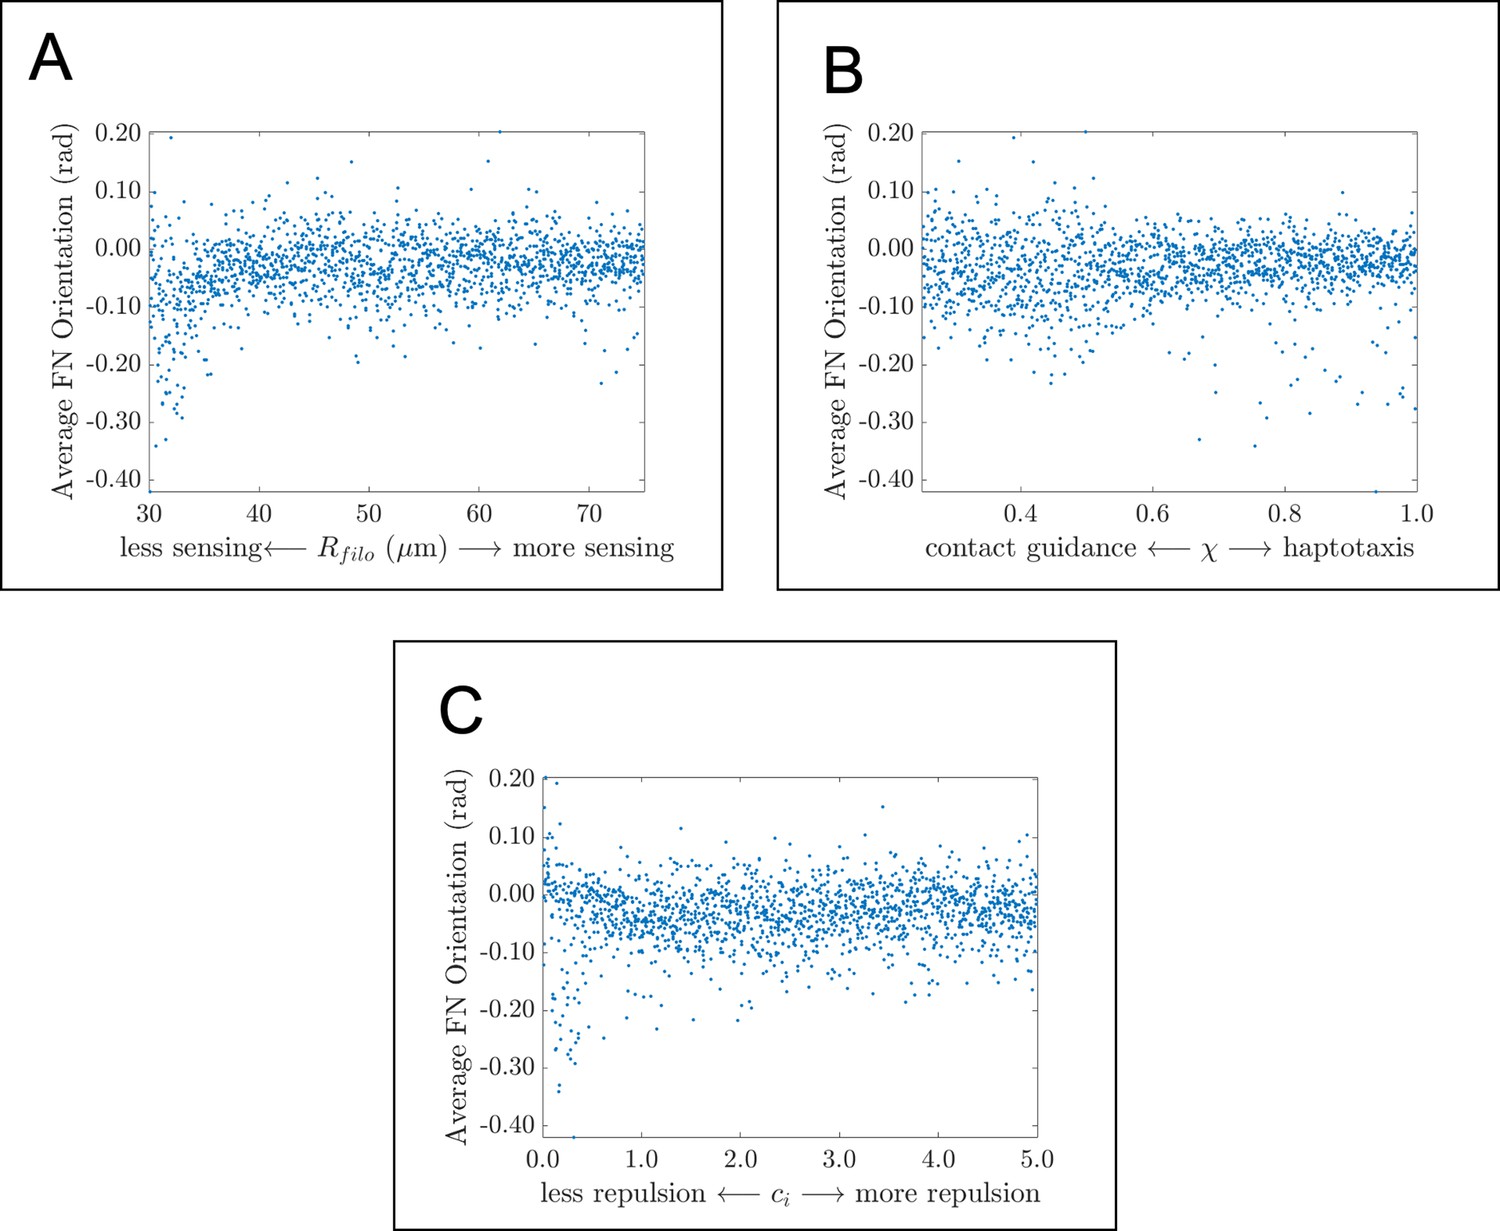
Average fibronectin fiber orientation in global parameter sweep.
Scatter plots demonstrate how the average angle that fibers make with the horizontal axis changes in response to (A) , the filopodial radius, (B) , the parameter controlling the extent to which haptotaxis or contact guidance dominates the direction of the cell-extracellular matrix (ECM) force, and (C) , the parameter controlling the magnitude of the cell-cell repulsion force. There are very few (if any) correlations between the statistic and the three parameter values considered here. Data points represent the average of 20 agent-based model realizations for each parameter regime. The average fiber orientation appears to lie between about 0 and –0.1 radians (0 and –5 degrees), which suggests that fibronectin fibers are largely oriented along the horizontal axis.
Figure 2—figure supplement 5
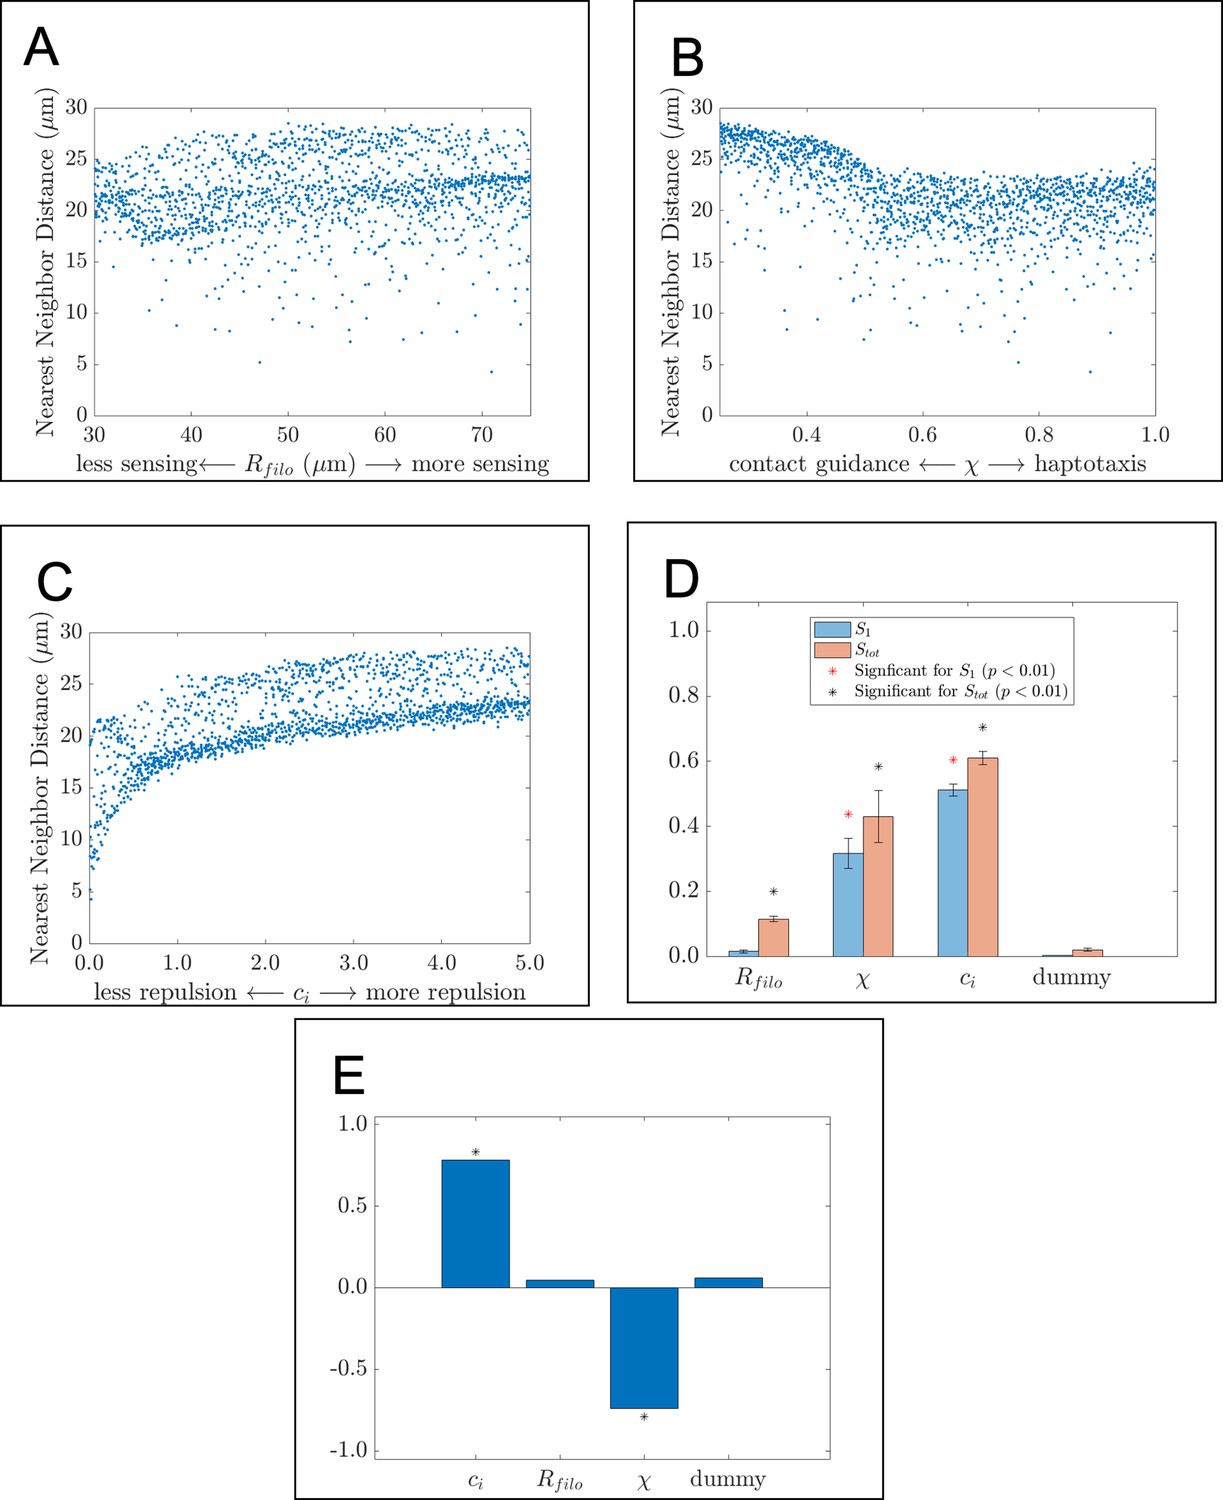
The nearest neighbor distance is affected by parameter values related to cell-cell repulsion and contact guidance.
Scatter plots, Sobol indices, and partial rank correlation coefficient (PRCC) values corresponding to the average nearest neighbor distance. The scatter plots demonstrate how this statistic changes in response to (A) , the filopodial radius, (B) , the parameter controlling the extent to which haptotaxis or contact guidance dominates the direction of the cell-extracellular matrix (ECM) force, and (C) , the parameter controlling the magnitude of the cell-cell repulsion force. Data points in the scatter plots are the average of 20 agent-based model realizations. (D) Bar charts of the first-order (blue) and total-order (orange) Sobol indices present the fraction by which the variance of the summary statistic would be reduced if the respective parameter values were fixed. Differences in heights between the orange and blue bars indicate the presence of synergistic effects that arise from changing multiple parameters simultaneously. Asterisks designate whether the first-order (red) or total-order asterisk (black) are statistically significant (p<0.01) from those obtained from a dummy parameter using a two-sample t-test. Parameters related to cell-cell repulsion and the direction of the cell-ECM force are found to significantly affect the variance of the statistic. (E) Bar charts of the PRCC values for each parameter indicate whether each parameter has a positive or negative monotonic relationship with the statistic. Asterisks indicate whether the PRCC is statistically significant (p<0.01) from that of the dummy parameter, as determined from a two-sample t-test. There is a positive relationship between the statistic and , the cell-cell repulsion force parameter, and a negative monotonic relationship between the statistic and , the parameter controlling the direction of the cell-ECM force.
Figure 2—figure supplement 6
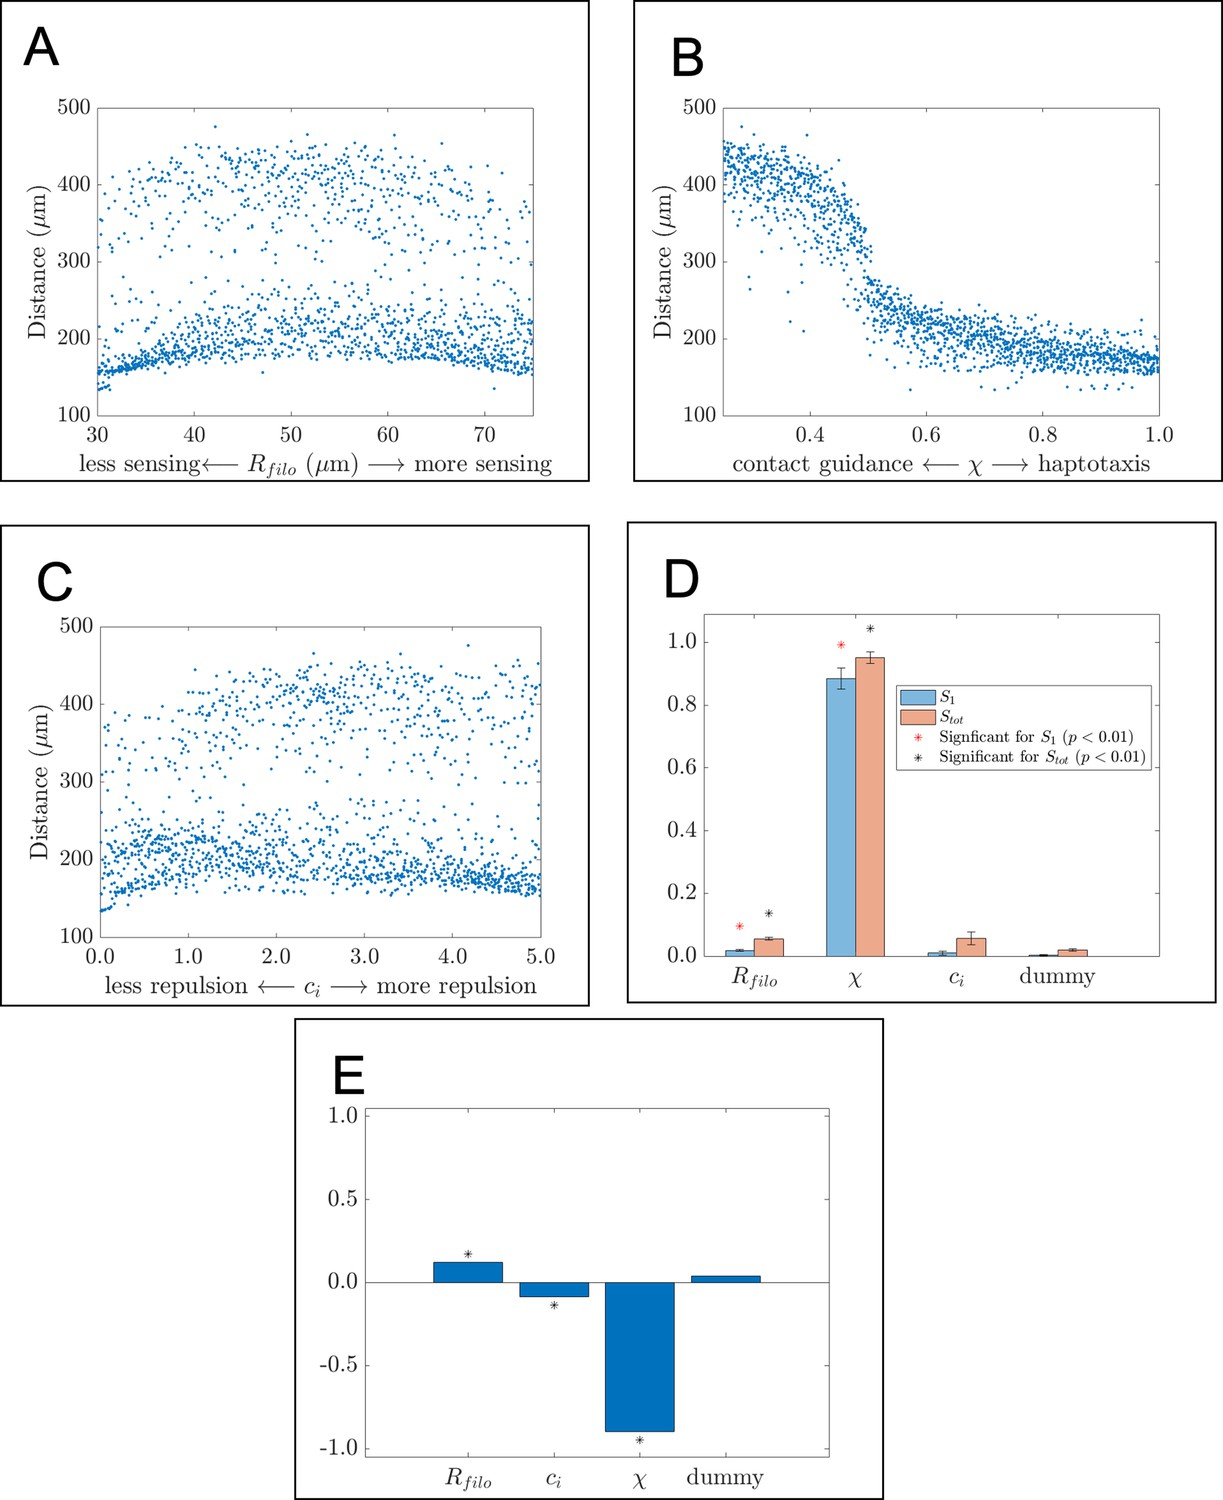
The migration of cells lateral to the target corridor is largely determined by how they respond to the extracellular matrix (ECM).
Scatter plots, Sobol indices, and partial rank correlation coefficient (PRCC) values corresponding to the maximum range of neural crest cells (NCCs) along the vertical axis (the ‘lateral spread’). The scatter plots demonstrate how this statistic changes in response to (A) , the filopodial radius, (B) , the parameter controlling the extent to which haptotaxis or contact guidance dominates the direction of the cell-ECM force, and (C) , the parameter controlling the magnitude of the cell-cell repulsion force. Data points in the scatter plots are each computed from the average of 20 agent-based model realizations. (D) Bar charts of the first-order (blue) and total-order (orange) Sobol indices present the fraction by which the variance of the summary statistic would be reduced if one of these parameters was to be held constant. Differences in heights between the orange and blue bars indicate the presence of synergistic effects that arise from changing multiple parameters simultaneously. Asterisks designate whether the first-order (red) or total-order asterisk (black) are statistically significant (p<0.01) from those obtained from a dummy parameter as determined from a two-sample t-test. Parameters related to the filopodial sensing radius and the direction of the cell-ECM force are found to significantly affect the variance of the statistic. (E) Bar charts of the PRCC values for each parameter indicate whether each parameter has a positive or negative monotonic relationship with the statistic. Asterisks indicate whether the PRCC is statistically significant (p<0.01) from that of the dummy parameter, as determined from a two-sample t-test. There is a weak positive correlation between the statistic and , the filopodial radius, a weak negative relationship with , the cell-cell repulsion force parameter, and a strong negative relationship with , the parameter controlling the direction of the cell-ECM force.
Figure 2—figure supplement 7
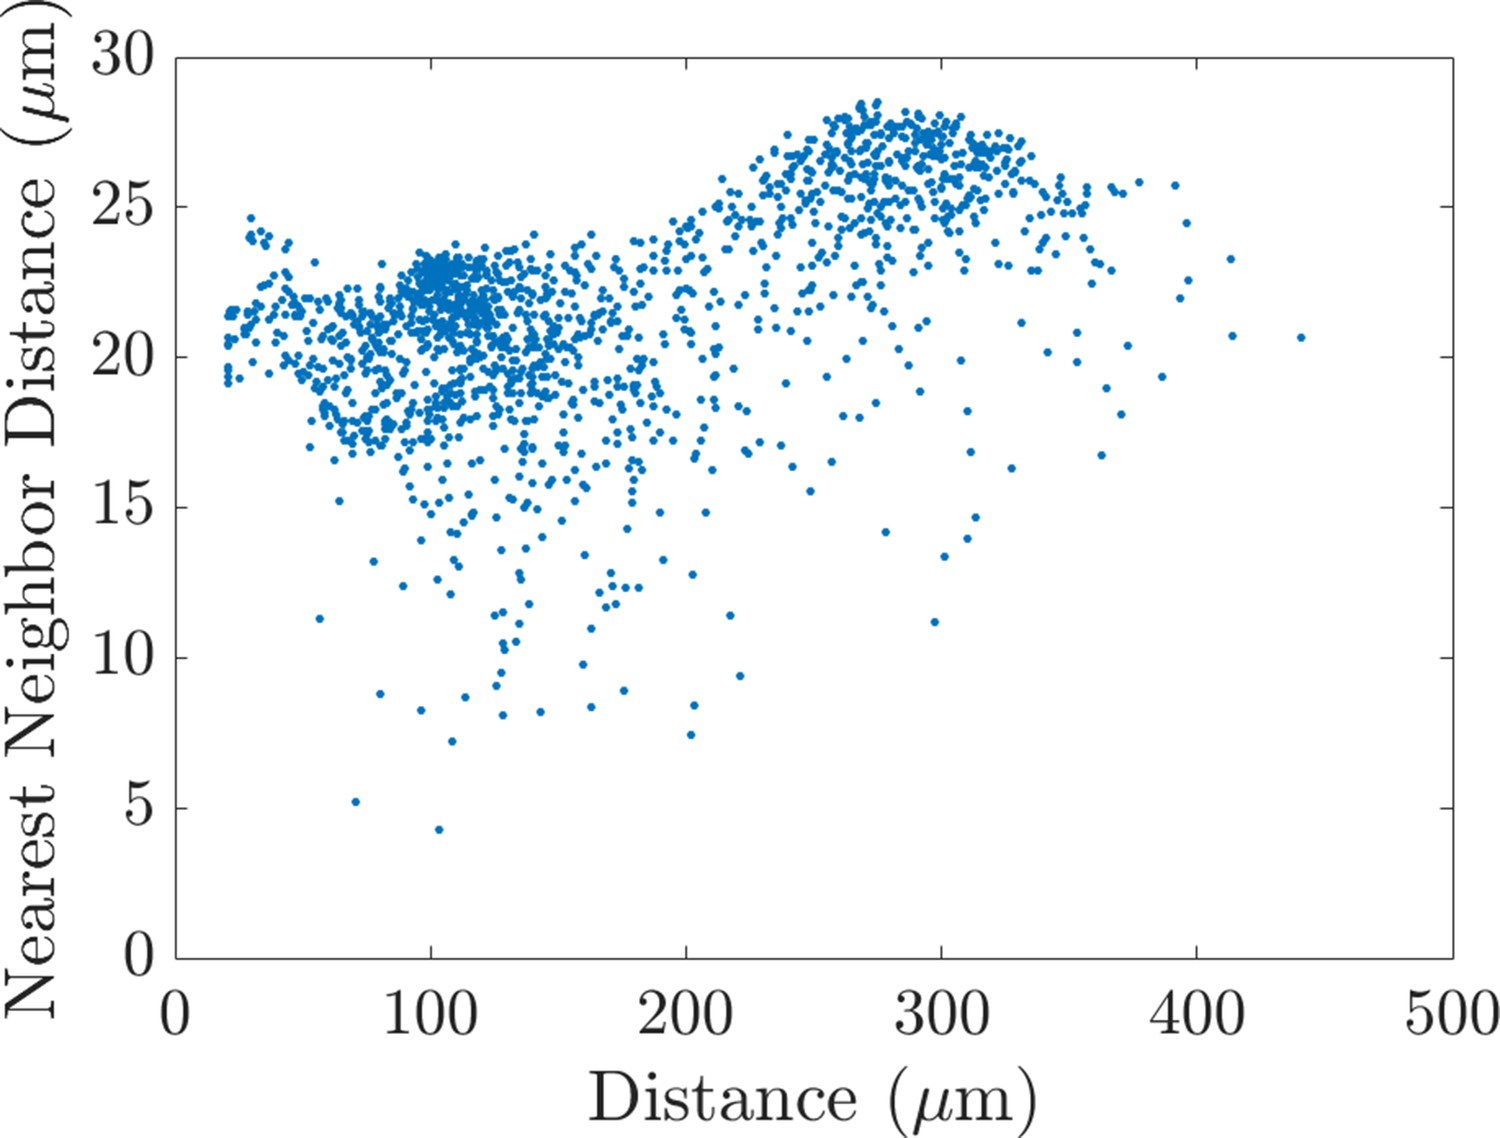
The nearest neighbor distance and the distance that cells travel are correlated.
Scatter plot showing the relationship between the average nearest neighbor distance between cells and the maximum distance that they travel in the horizontal direction. The graph reveals a weak positive correlation (Pearson correlation coefficient: 0.53, p=2.6e-112; partial Spearman rank correlation coefficient: 0.53, p=7.2e-115), such that larger distances typically correspond to larger distances between neighbors and vice versa. Data points in the scatter plots are the average of 20 agent-based model realizations. p-Values were computed from a Student’s t distribution, under the null hypothesis that there is no correlation between the two variables.
Figure 2—figure supplement 8
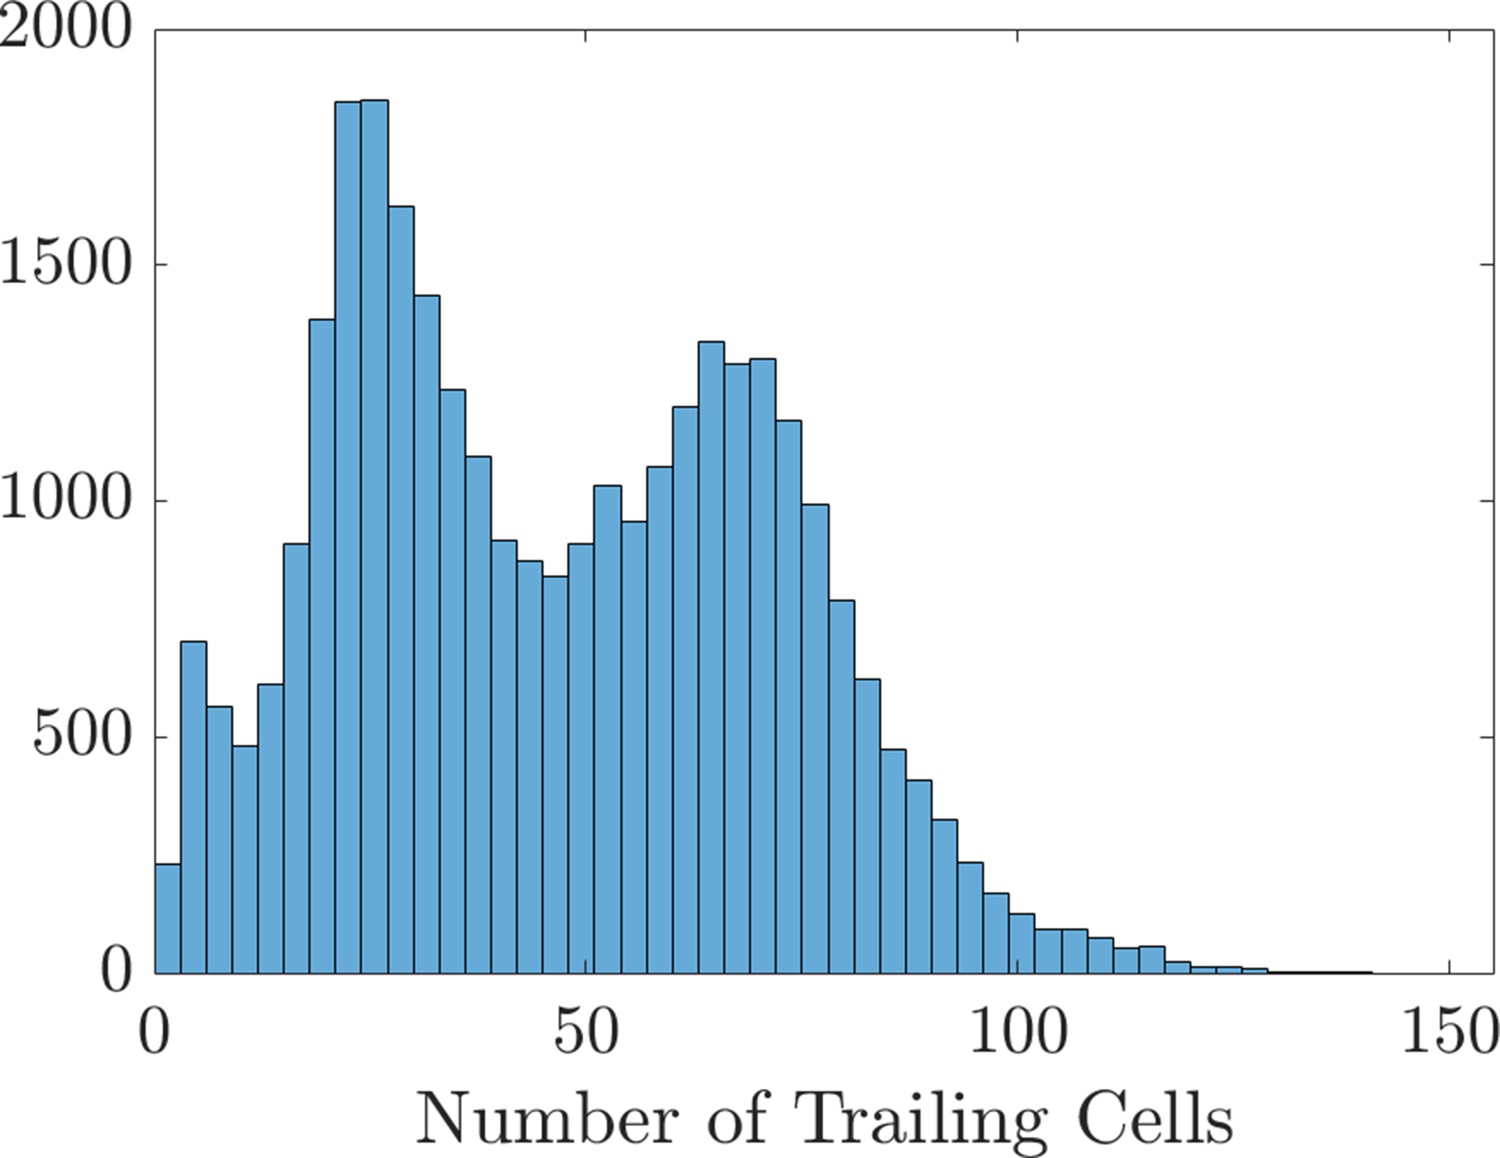
Histogram of the number of trailing cells that enter the domain.
The data creating this histogram were extracted from the 31,440 agent-based model realizations used to create the scatter plots and Sobol indices in Figure 2 of the main text and Figure 2—figure supplements 4–7.
Figure 2—figure supplement 9
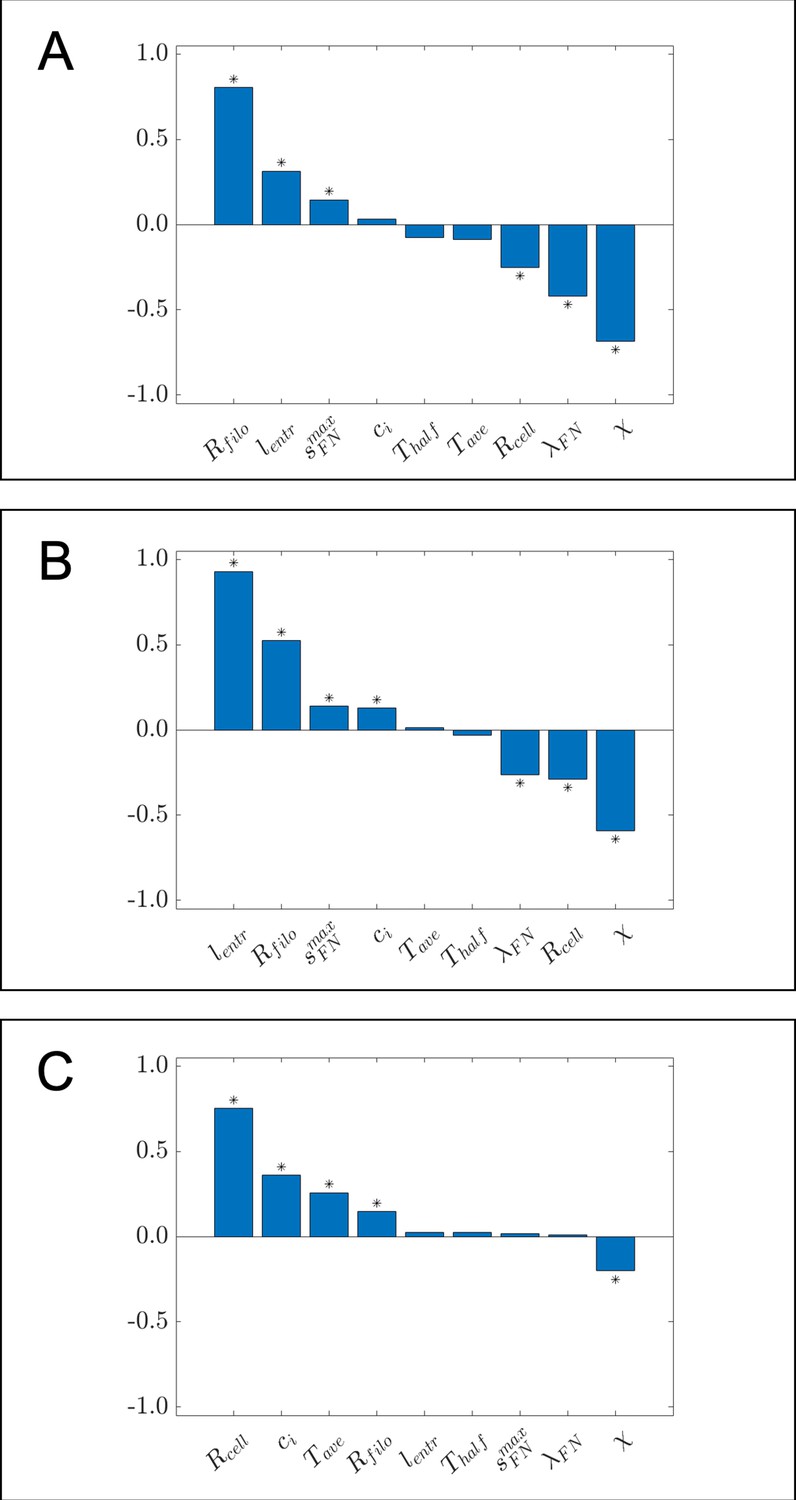
Bar charts of partial rank correlation coefficient (PRCC) values for (A) the maximum distance neural crest cells (NCCs) travel in the horizontal direction, (B) the maximum range of NCCs in the vertical direction, and (C) average nearest neighbor distance, using a larger set of parameter values than the ones considered in the main text.
Asterisks indicate whether the PRCC is statistically significant (p<0.01) from that of the dummy parameter, as determined from a two-sample t-test. Data in this case were generated from 1000 parameter regimes using Latin hypercube sampling (Helton and Davis, 2003). The range of values from which parameter regimes were sampled are as follows: , , , , , , , , . All other parameter values were set to the same values listed in Table 1 of the Materials and methods section in the main text.
Figure 2—video 1
An example agent-based model (ABM) simulation corresponding to Figure 2A of the main text.
For this realization, the cells form a single stream resembling those found in vivo. Black circles denote leader cells, which can secrete new fibronectin (FN), red cells signify follower non-secretory cells, and blue squares correspond to FN puncta. Arrows denote cell velocities and fiber orientations. The extra column of FN at the right boundary is an artifact of visualization.
Figure 2—video 2
An example agent-based model ( ABM) simulation corresponding to Figure 2B of the main text.
For this realization, the cells form two branches despite otherwise using the same parameter regime and initial conditions used to generate Figure 2A and Figure 2—video 1. Black circles denote leader cells, which can secrete new fibronectin (FN), red cells signify follower non-secretory cells, and blue squares correspond to FN puncta. Arrows denote cell velocities and fiber orientations. The extra column of FN at the right boundary is an artifact of visualization.
Figure 2—video 3
An example agent-based model (ABM) simulation showing how only the fibronectin (FN) distribution changes.
The video corresponds to Figure 2A of the main text and Figure 2—video 1. Blue squares correspond to FN puncta, while blue squares with arrows denote the FN fibers and their orientations. The extra column of FN at the right boundary is an artifact of visualization.
Figure 2—video 4
An example agent-based model (ABM) simulation showing how only the fibronectin (FN) distribution changes.
The video corresponds to Figure 2B of the main text and Figure 2—video 2. Blue squares correspond to FN puncta, while blue squares with arrows denote the FN fibers and their orientations. The extra column of FN at the right boundary is an artifact of visualization.
Figure 3 with 4 supplements
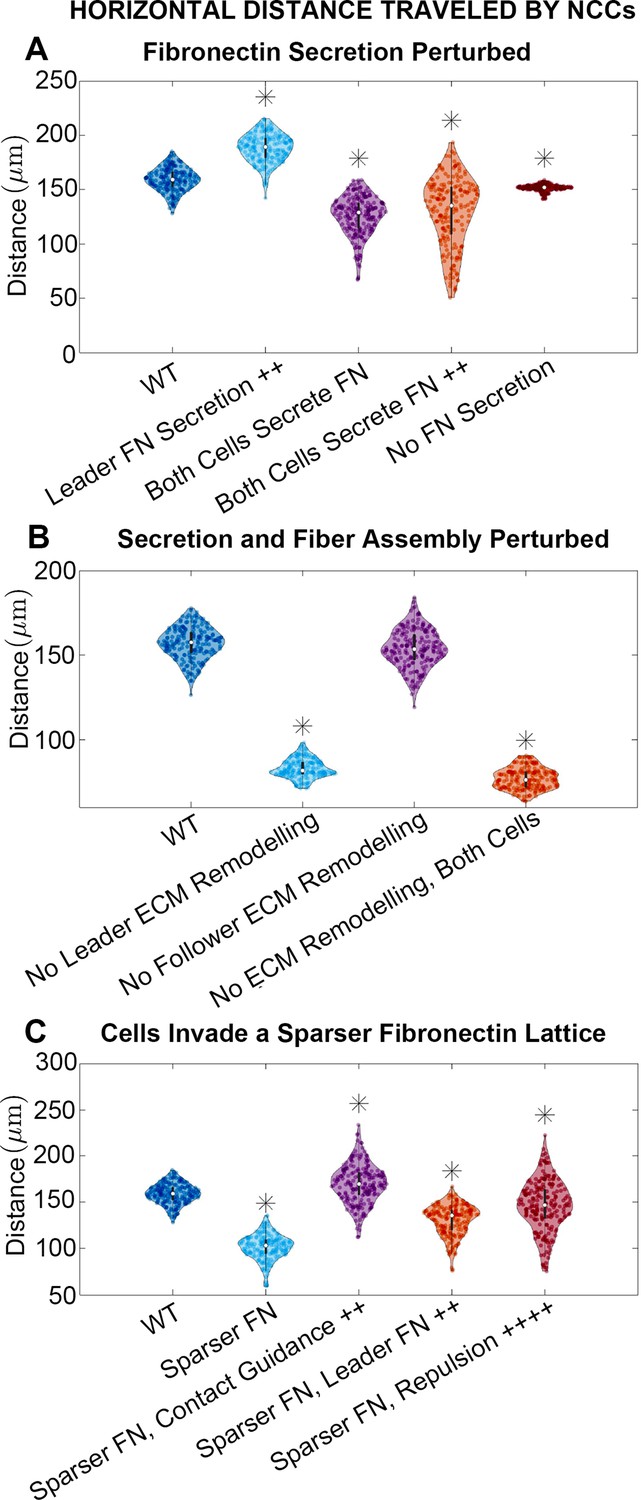
Horizontal distance traveled by neural crest cells (NCCs) after 12 hr.
Violin plots for experiments in which (A) fibronectin (FN) secretion is perturbed, (B) secretion and fiber assembly (FN remodeling) are altered, and (C) cells invade a sparser (60 µm) FN lattice suggest that the extracellular matrix (ECM) plays an important role in NCC migration. Overexpression experiments (++) decrease the average timescale over which a cell makes new FN from 30 to 10 min, respectively. Contact guidance and cell-cell repulsion upregulation in (C) correspond to and , respectively. Asterisks indicate whether distributions are significantly different (p<0.01) from that of the baseline (WT) parameter regime using a Mann-Whitney U-test. Two-hundred agent-based model (ABM) realizations are used to generate each violin plot.
Figure 3—figure supplement 1
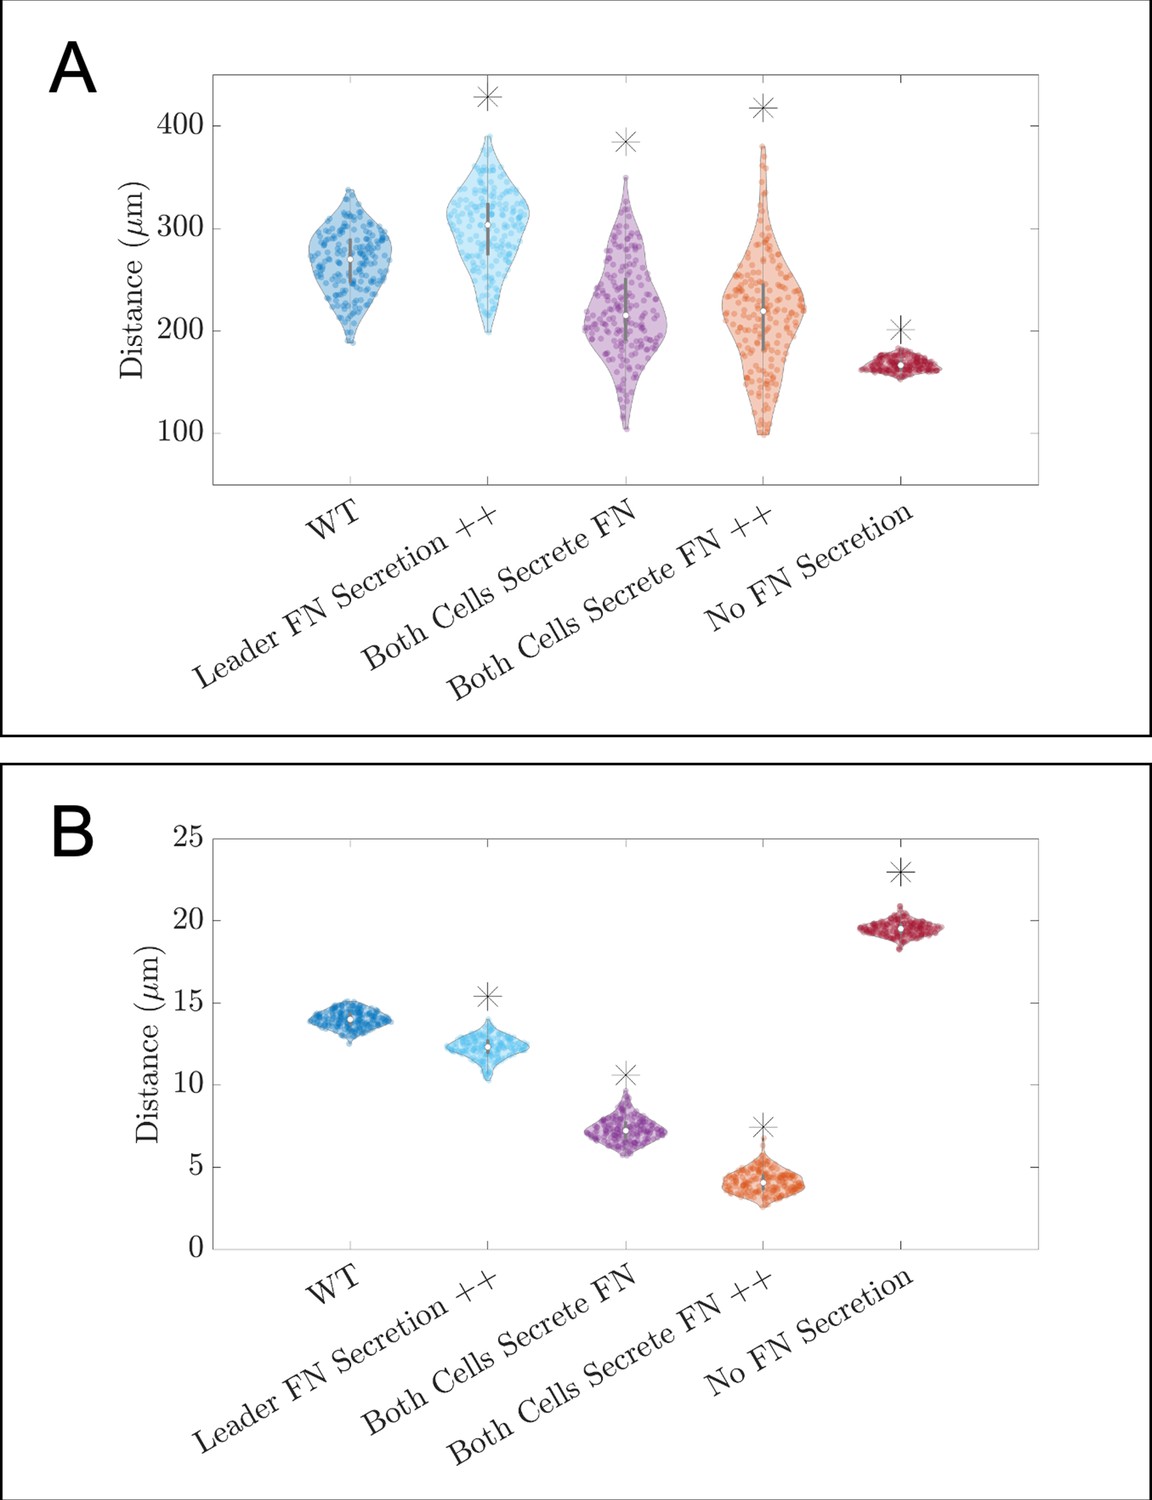
Additional violin plots for in silico knockdown/overexpression experiments of fibronectin (FN).
Violin plots showing how (A) the maximum range of neural crest cells (NCCs) in the vertical direction and (B) average nearest neighbor distance change for the in silico experiments in which FN secretion is perturbed (see Figure 3A of the main text). Overexpression experiments (++) decrease the average time for another FN secretion event to 10 min. Asterisks indicate whether distributions are significantly different (p<0.01) from that of the baseline (WT) parameter regime using a Mann-Whitney U-test. Two-hundred agent-based model (ABM) realizations are used to generate each violin plot.
Figure 3—figure supplement 2
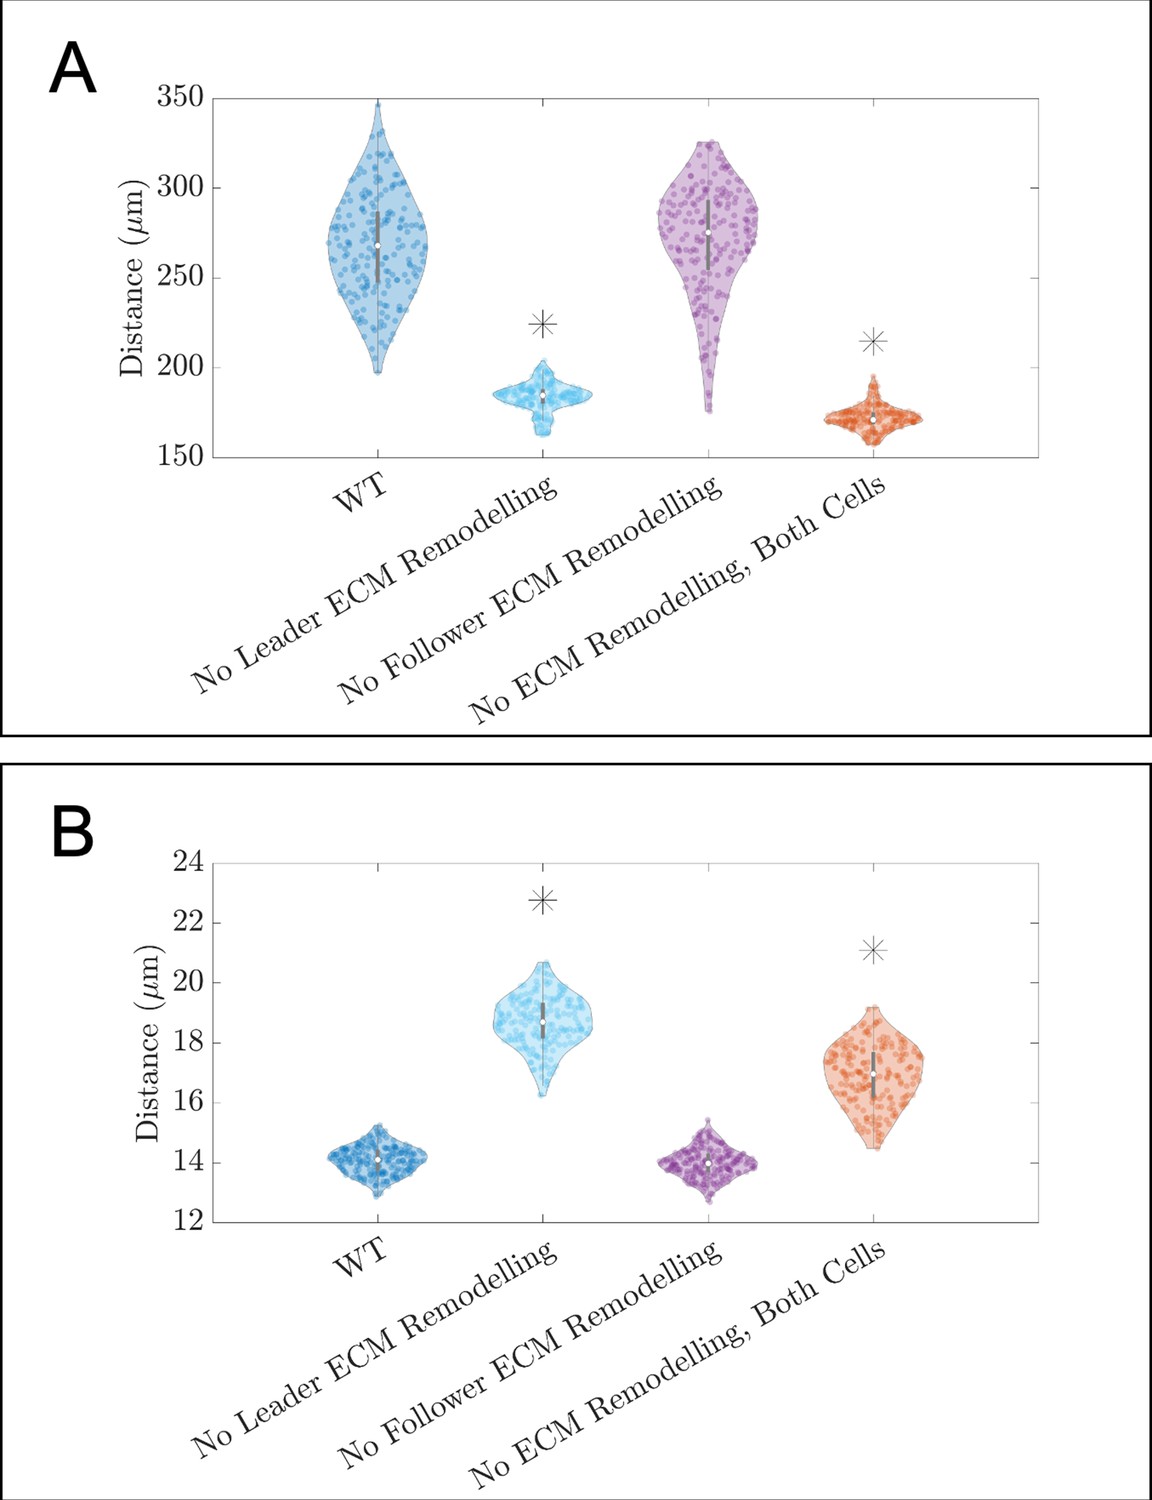
Violin plots showing how (A) the maximum range of neural crest cells (NCCs) in the vertical direction and (B) average nearest neighbor distance change for the in silico experiments in which fibronectin secretion and fiber assembly (extracellular matrix [ECM] remodeling) are altered in either secretory ‘leader’ cells or non-secretory ‘follower’ (see Figure 3B of the main text).
Asterisks indicate whether distributions are significantly different (p<0.01) from that of the baseline (WT) parameter regime using a Mann-Whitney U-test. Two-hundred agent-based model (ABM) realizations are used to generate each violin plot.
Figure 3—figure supplement 3
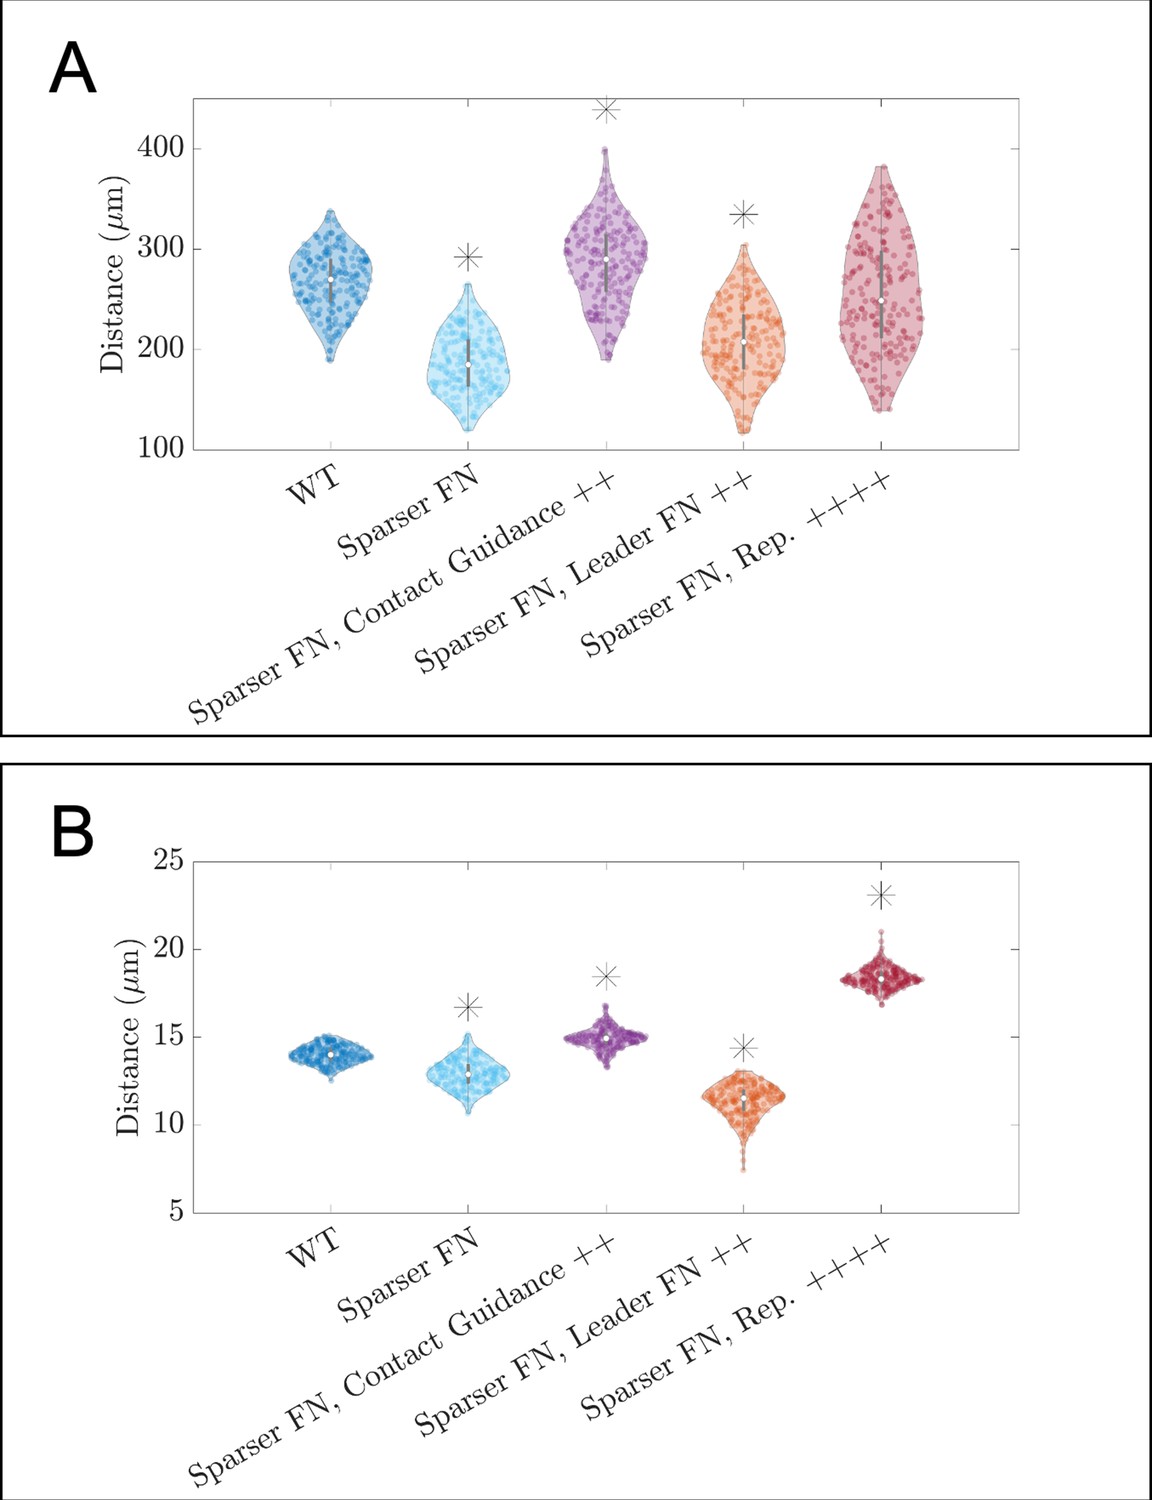
Violin plots showing how (A) the maximum range of neural crest cells (NCCs) in the vertical direction and (B) average nearest neighbor distance change for the in silico experiments in which cells invade a sparser (60 µm) fibronectin (FN) lattice (see Figure 3C of the main text).
Overexpression of FN secretion (leader FN ++) decrease the average time that it takes a secretory ‘leader’ cell to secrete FN from 30 to 10 min. Contact guidance and cell-cell repulsion upregulation correspond to setting and , respectively. Asterisks indicate whether distributions are significantly different (p<0.01) from that of the baseline (WT) parameter regime using a Mann-Whitney U-test. Two-hundred agent-based model (ABM) realizations are used to generate each violin plot.
Figure 3—figure supplement 4
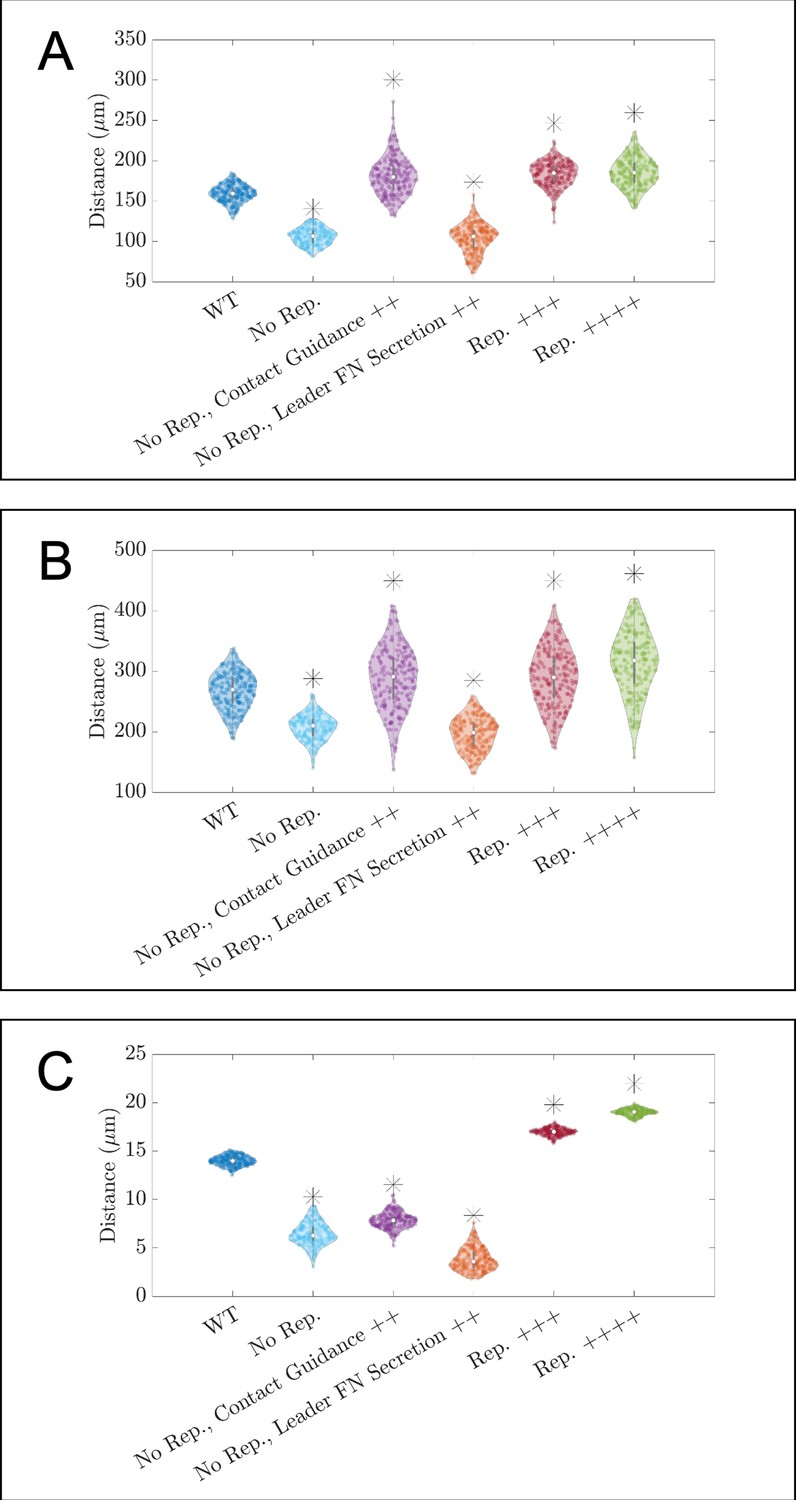
Violin plots showing how (A) the maximum distance neural crest cells (NCCs) travel in the horizontal direction, (B) the maximum range of NCCs in the vertical direction, and (C) average nearest neighbor distance change for in silico experiments in which parameters related to cell-cell repulsion, , are altered.
Leader FN secretion++ denotes experiments that decrease the average time for FN secretion in leader cells to 10 min. Contact guidance++ denotes experiments in which . No Rep. denotes experiments for which , Rep.+++ to experiments in which , and Rep.++++ to cases in which . Asterisks indicate whether distributions are significantly different (p<0.01) from that of the baseline (WT) parameter regime using a Mann-Whitney U-test. Two-hundred agent-based model (ABM) realizations are used to generate each violin plot.
Figure 4 with 1 supplement

Guiding forces reduce lateral spread of a neural crest cell (NCC) stream but can result in stream breakage.
Violin plots for (A) the range of NCCs along the vertical axis, (B) the horizontal distance traveled by NCCs, and (C) the average minimum distance from secretory to non-secretory cells in experiments when the guiding force strength, , changes (guiding force +/++/+++: / / ) in both cell types or only leader secretory cells (LO). Asterisks indicate significantly different (p<0.01) distributions compared to the baseline (WT, ) parameter regime according to a Mann-Whitney U-test. Snapshots in (D) present the results of an agent-based model (ABM) realization over 12 hr when the guiding force () affects only secretory cells. Two-hundred ABM realizations are used to generate each violin plot.
Figure 4—video 1
An example agent-based model (ABM) simulation corresponding to Figure 4D of the main text.
For this realization, leader cells (black) experience an additional guiding force that steers them in the direction of the target corridor (i.e. the horizontal axis). Trailing cells (red) eventually become separated from the leaders. Blue squares correspond to fibronectin puncta. Arrows denote cell velocities and fiber orientations.
Figure 5
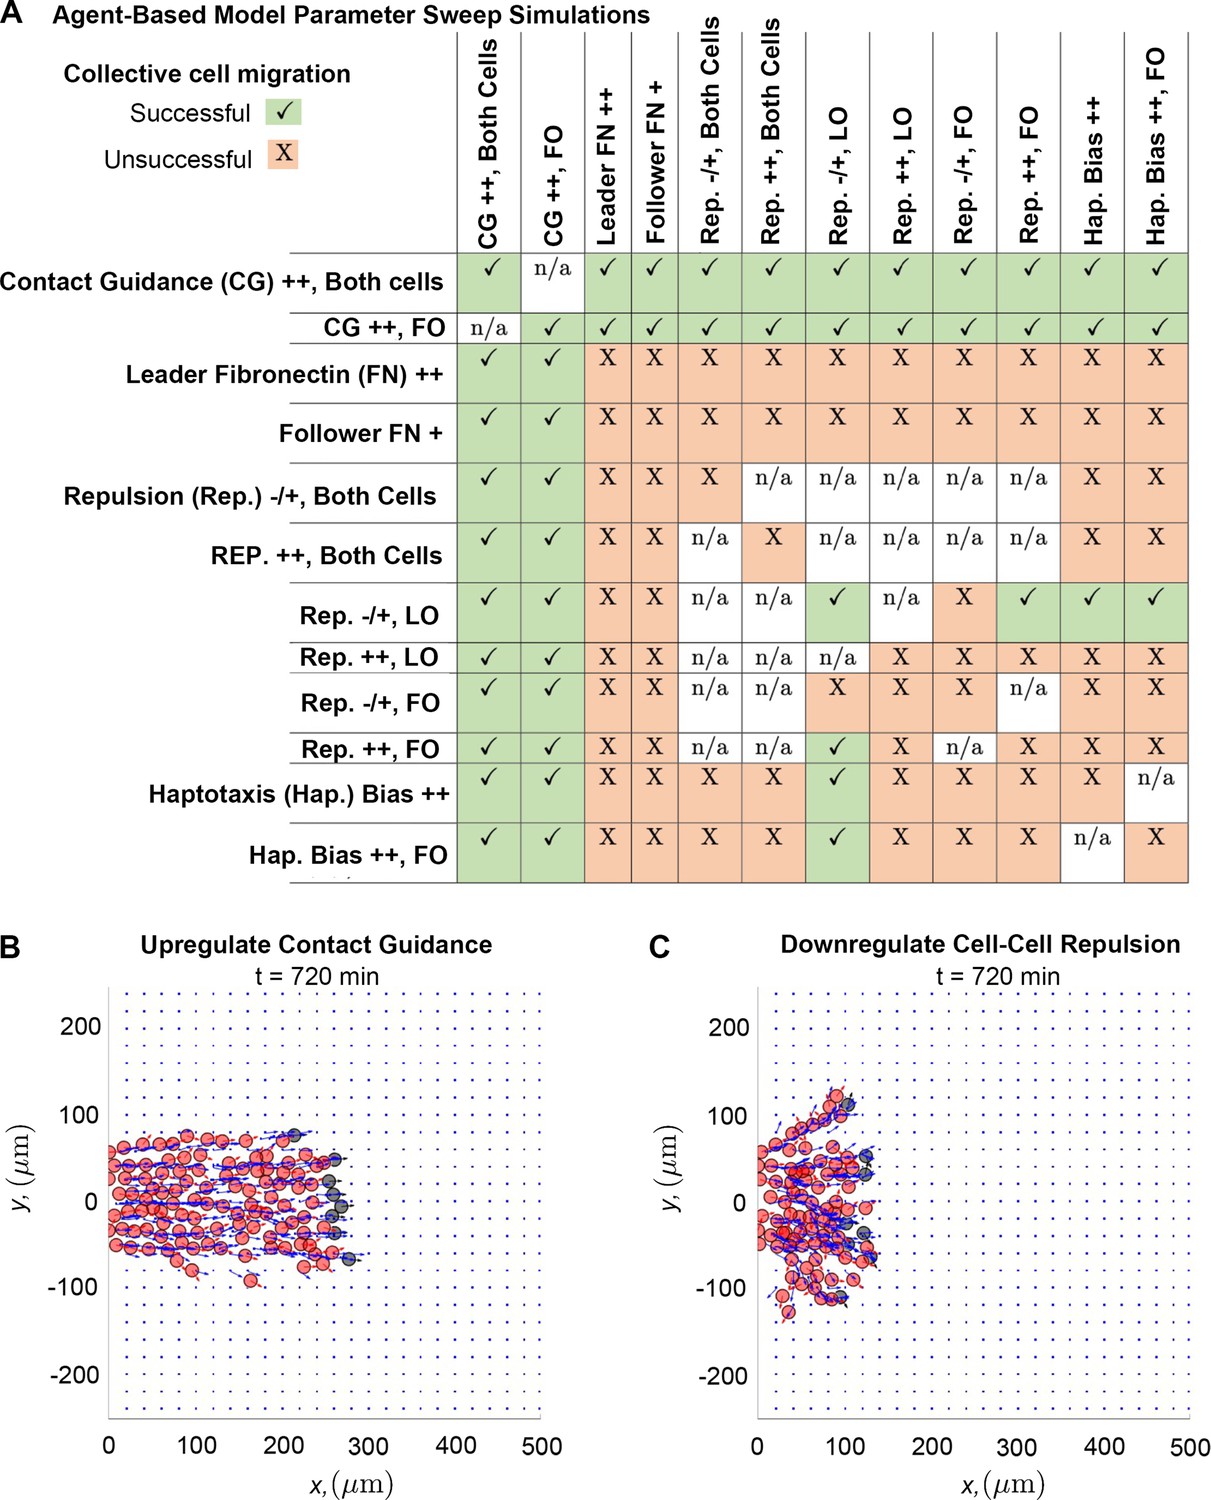
Upregulating contact guidance and/or downregulating secretory cell-cell repulsion prevents stream breakage.
A summary (A) of experiments that either successfully (checkmarks) or unsuccessfully (X) prevent secretory and non-secretory cells from separating more than two cell diameters (30 µm) in at least 100 of 200 agent-based model (ABM) realizations (n/a means that the parameter combination is impossible to implement). Individual simulations suggest that cells can migrate as a single discrete stream, as when both cell types upregulate contact guidance (B), or as multiple single-cell chains as in the case where secretory cells downregulate cell-cell repulsion (C). Abbreviations in (A): CG ++, Both cells (both cell types upregulate contact guidance, ); CG ++, FO (only non-secretory cells upregulate contact guidance, ); leader FN ++ (leader secretory cells secrete FN puncta more often, min); follower FN + (trailing cells are enabled to secrete FN at a rate min); Rep. –/+, both cells (both cell types downregulate cell-cell repulsion, ); Rep. ++, both cells (both cell types upregulate cell-cell repulsion, ); Rep. –/+, LO (only leader secretory cells downregulate cell-cell repulsion, ); Rep. ++, LO (only leader secretory cells upregulate cell-cell repulsion, ); Rep. –/+, FO (only follower non-secretory cells downregulate cell-cell repulsion, ); Rep. ++, FO (only follower non-secretory cells upregulate cell-cell repulsion, ); Hap. Bias ++ (both cell types sample less noisy haptotaxis cues from the von Mises distribution, ); Hap. Bias ++, FO (only follower non-secretory cells sample less noisy haptotaxis cues from the von Mises distribution, ).
Tables
Table 1
Parameter values corresponding to the baseline parameter regime listed in the main text.
| Parameter | Value (units) | Meaning | Reference |
|---|---|---|---|
| 27.5 (μm) | Filopodial radius of cells (measured from the cell center of mass) | Colombi et al., 2020; McLennan and Kulesa, 2010 | |
| 7.5 (μm) | Cell body radius | Szabó et al., 2019; McLennan et al., 2020 | |
| 120 (μm) | Length of neural tube section from which cells emerge | Szabó et al., 2019; McLennan et al., 2012 | |
| 30 (min) | Average time for cells to secrete FN | Rozario et al., 2009; Davidson et al., 2008 | |
| 30 (min) | Average time it takes for cells to adjust the orientation of FN fibers | Rozario et al., 2009; Davidson et al., 2008 | |
| 0.8 (μm/min) | Maximum cell speed when cells sense FN | Ridenour et al., 2014 | |
| 0.05 (μm/min) | Maximum cell speed when cells do not sense FN | Selected to be an order of magnitude smaller than | |
| 0.1 (min) | Time step | Selected based on preliminary ABM simulations | |
| 300 (a.u.) | Height of Gaussian function used to parameterize the von Mises distribution for the haptotaxis force | Selected based on preliminary ABM simulations | |
| 100 (a.u.) | Height of Gaussian function used to parameterize the von Mises distribution for the cell-cell repulsion force | Selected based on preliminary ABM simulations | |
| 20 (μm) | Spacing between FN puncta of the initial lattice | Selected to ensure cells sense at least one FN puntum at all times | |
| 0.5 (a.u.) | Fraction by which the cell-ECM force is weighted in the direction of the haptotaxis force | Selected based on global sensitivity analysis results | |
| 0.5 (a.u.) | Cell-cell repulsion force strength | Selected based on global sensitivity analysis results |
Table 2
Parameter values and ranges used to generate the extended Fourier amplitude sensitivity testing (eFAST) results.
| Parameter | Range of values considered in eFAST | Units |
|---|---|---|
| [30, 75] | μm | |
| [0.25, 1] | Arbitrary units | |
| [0, 5] | Arbitrary units |
Additional files
Download links
A two-part list of links to download the article, or parts of the article, in various formats.
Downloads (link to download the article as PDF)
Open citations (links to open the citations from this article in various online reference manager services)
Cite this article (links to download the citations from this article in formats compatible with various reference manager tools)
Dynamic fibronectin assembly and remodeling by leader neural crest cells prevents jamming in collective cell migration
eLife 12:e83792.
https://doi.org/10.7554/eLife.83792


