Internal neural states influence the short-term effect of monocular deprivation in human adults
- State Key Laboratory of Ophthalmology, Optometry and Visual Science, Wenzhou Medical University, China
- National Engineering Research Center of Ophthalmology and Optometry, Wenzhou Medical University, China
- State Key Laboratory of Brain and Cognitive Science, Institute of Biophysics, Chinese Academy of Sciences, China
- University of Chinese Academy of Sciences, China
- Department of Ophthalmology and Visual Sciences, McGill University, Canada
- Institute of Artificial Intelligence, Hefei Comprehensive National Science Center, China
Figures
Figure 1

The immediate effects of open vs. close of the patched eye (PE).
(a) The amplitude spectrum averaged across subjects between 2 and 30 Hz for four conditions (two eyes open: red dashed line; two eyes closed: black dashed lines; PE open: red solid line; PE closed: black solid line). Shaded area indicates one standard error of the mean (SEM) across 20 subjects. (b) The normalized amplitude at the alpha peak frequency. Each dot represents one subject. Error bars represent one SEM across 20 subjects. (c) The average amplitude of steady-state visually evoked potential (SSVEP) and peak alpha. Each dot represents each observer. Error bars represent one SEM across 20 subjects. (d) The contrast sensitivity of the unpatched eye (UPE). Each dot represents one observer. Error bars represent one SEM across 18 subjects. The black star indicates the significance of the two-tailed paired samples t-test with Holm-Bonferroni correction, *: p<0.05; ***: p<0.001.
-
Figure 1—source data 1
Related to Figure 1a.
- https://cdn.elifesciences.org/articles/83815/elife-83815-fig1-data1-v2.xlsx
-
Figure 1—source data 2
Related to Figure 1b.
- https://cdn.elifesciences.org/articles/83815/elife-83815-fig1-data2-v2.xlsx
-
Figure 1—source data 3
Related to Figure 1c.
- https://cdn.elifesciences.org/articles/83815/elife-83815-fig1-data3-v2.xlsx
-
Figure 1—source data 4
Related to Figure 1d.
- https://cdn.elifesciences.org/articles/83815/elife-83815-fig1-data4-v2.xlsx
Figure 2
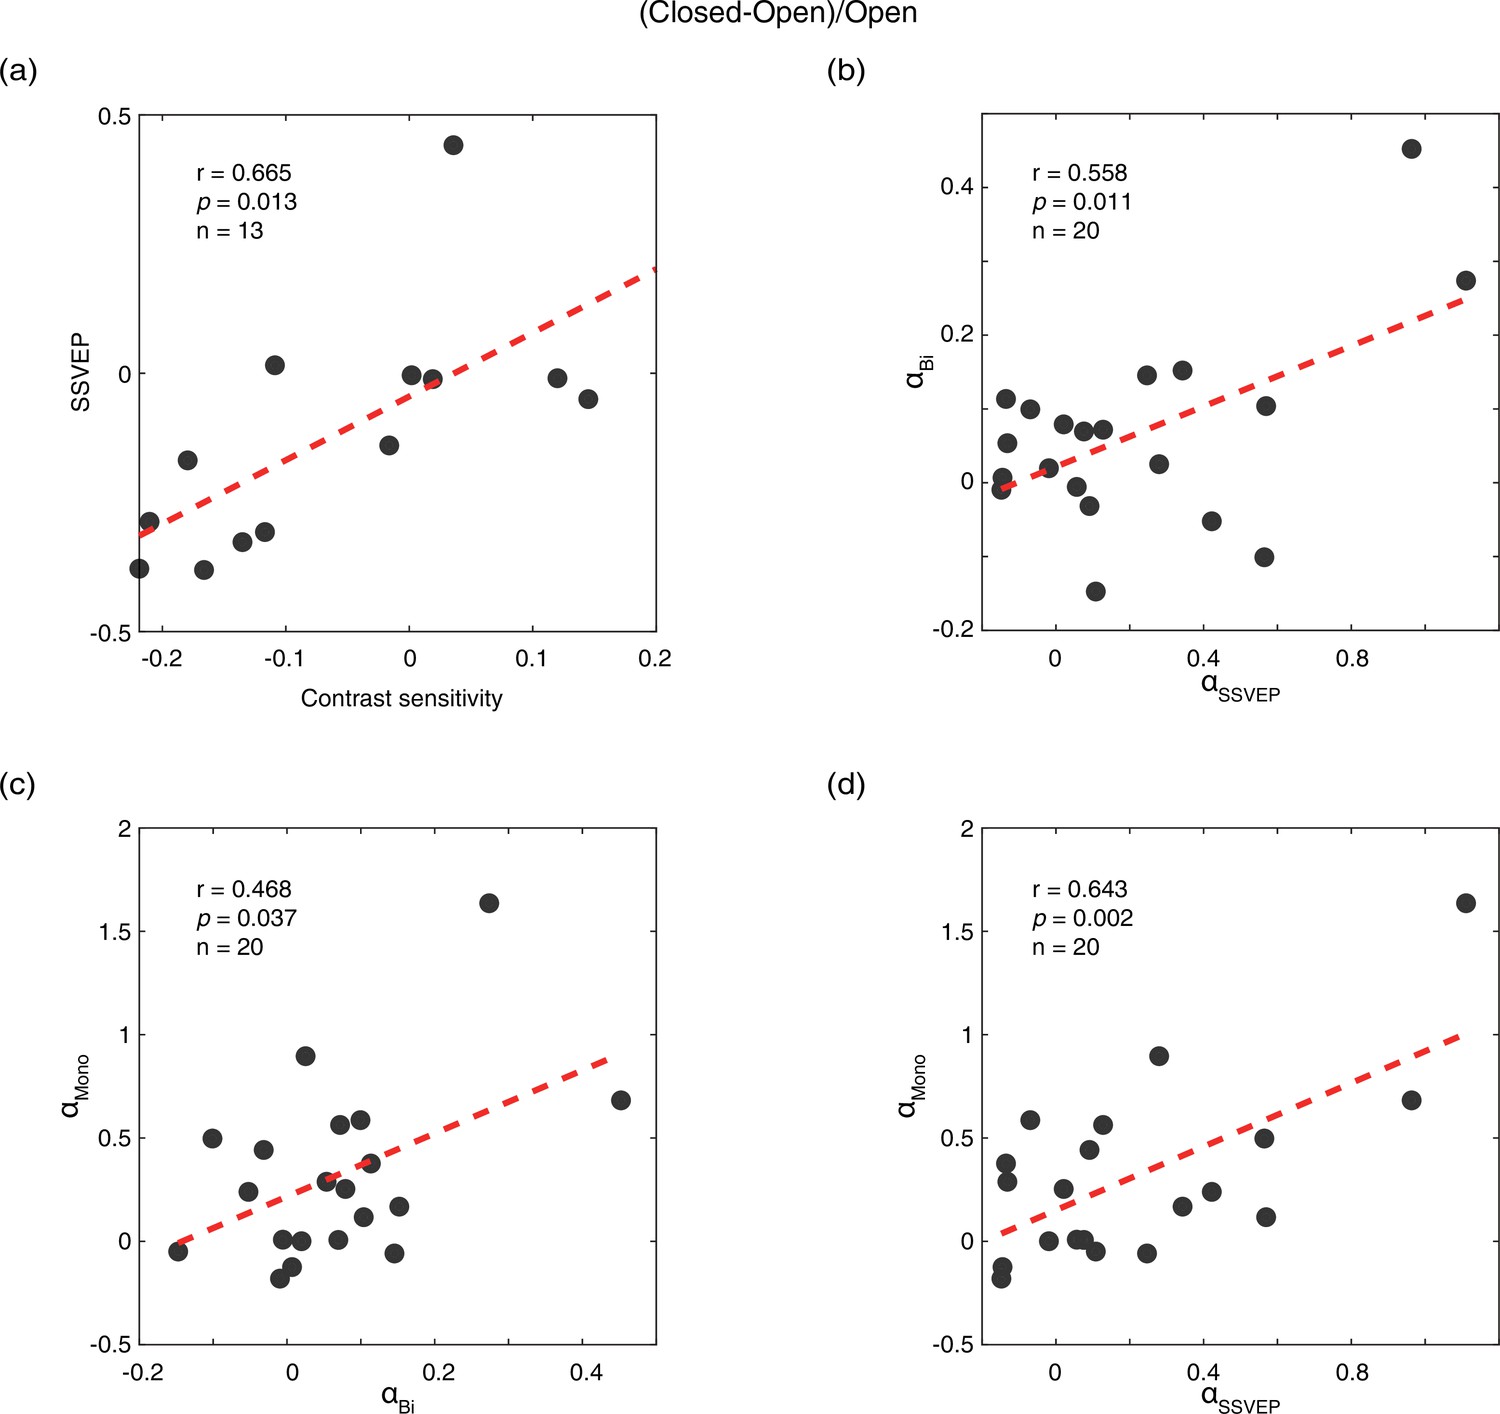
Correlations of the effects of eye open vs. eye close between different measurements.
(a) Correlation between contrast sensitivity and SSVEP amplitude. (b) Correlation between peak alpha amplitude in the SSVEP sessions (αSSVEP) and the resting state when both eyes open/closed (αBi). (c) Correlation between peak alpha amplitude in the resting state when both eyes open/closed (αBi) and the resting state when PE open/closed (αmono). (d) Correlation between peak alpha amplitude in the SSVEP sessions (αSSVEP) and the resting state when PE open/closed (αmono). The difference of the eye-open and eye-closed conditions was calculated as: (closed-open)/open. Each dot represents one observer.
-
Figure 2—source data 1
Related to Figure 2a, b, c and d.
- https://cdn.elifesciences.org/articles/83815/elife-83815-fig2-data1-v2.xlsx
Figure 3

The change in monocular contrast sensitivity as a result of the monocular deprivation.
The change in monocular contrast sensitivity as a result of the monocular deprivation was compared when the eye behind the patch remained open (the eye-open condition: red lines and open triangles) and when the eye behind the patch was kept closed (the eye-closed condition: black lines and filled triangles) for the PE (solid line with regular triangle) and UPE (dashed line with inverted triangle). The contrast sensitivity change in decibels (dB) was calculated as: 20 × log10(contrast sensitivity at post-measure session/contrast sensitivity at baseline). Error bars indicate one SEM across 12 subjects.
-
Figure 3—source data 1
Related to Figure 3.
- https://cdn.elifesciences.org/articles/83815/elife-83815-fig3-data1-v2.xlsx
Figure 4
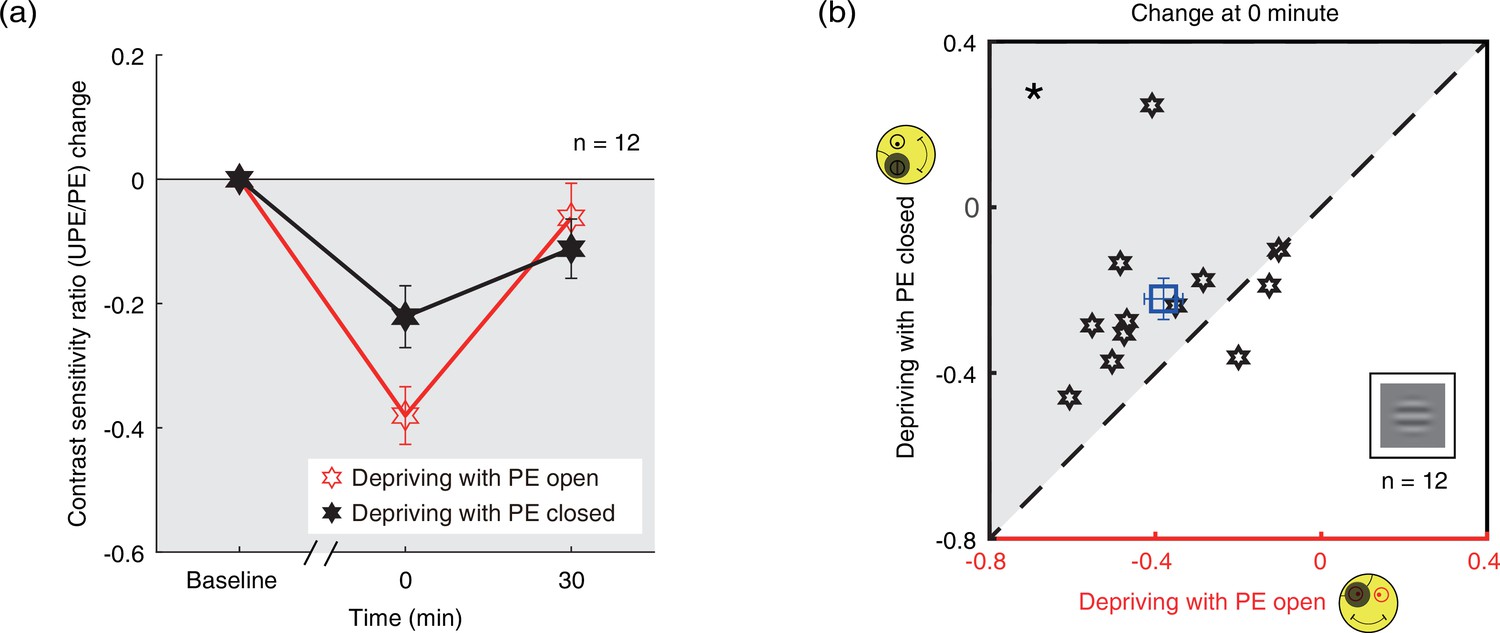
The change in contrast sensitivity ratio as a result of the monocular deprivation.
(a) The change in contrast sensitivity ratio as a result of the monocular deprivation was compared when the eye behind the patch remained open (the eye-open condition: red lines and open hexagons) and when the eye behind the patch was kept closed (the eye-closed condition: black lines and filled hexagons). The contrast sensitivity ratio was calculated as: contrast sensitivity of UPE/contrast sensitivity of PE. The contrast sensitivity ratio change was calculated as: contrast sensitivity ratio at post-measure session − contrast sensitivity ratio at baseline. Error bars indicate one SEM across 12 subjects. (b) The average change of the post-measure session at 0’ was compared for each subject for the two patching conditions. The open square symbol represents the averaged results. The dash line is the equality line. The gray area indicates where the eye-open patching produced more patching effect than the eye-closed patching. Error bars represent one SEM across 12 subjects. The black star indicates the significance of the two-tailed paired samples t-test, *: p<0.05.
-
Figure 4—source data 1
Related to Figure 4a and b.
- https://cdn.elifesciences.org/articles/83815/elife-83815-fig4-data1-v2.xlsx
Figure 5

The change in ocular dominance as a result of the monocular deprivation in binocular combination.
(a) The change in ocular dominance as a result of the monocular deprivation using phase combination task was compared for monocular patching where the eye behind the patch remained open (the eye-open condition – red lines and open squares) and when the eye behind the patch was closed (the eye-closed condition – black lines and filled squares). The perceived phase change was calculated as: perceived phase at post-measure session − perceived phase at baseline. Error bars indicate one SEM across 14 subjects. (b) The average change (degrees) of four post-measure sessions (0’, 3’, 6’, 9’) using the binocular phase combination task was compared for each subject for the two patching conditions. The open square symbol represents the averaged results. The dash line is the equality line. The gray area indicates where the eye-open patching produced more cumulated shift of ocular dominance than that of the eye-closed patching. Error bars represent one SEM across 14 subjects. The black star indicates the significance of the two-tailed paired samples t-test, **: p<0.001.
-
Figure 5—source data 1
Related to Figure 5a and b.
- https://cdn.elifesciences.org/articles/83815/elife-83815-fig5-data1-v2.xlsx
Figure 6
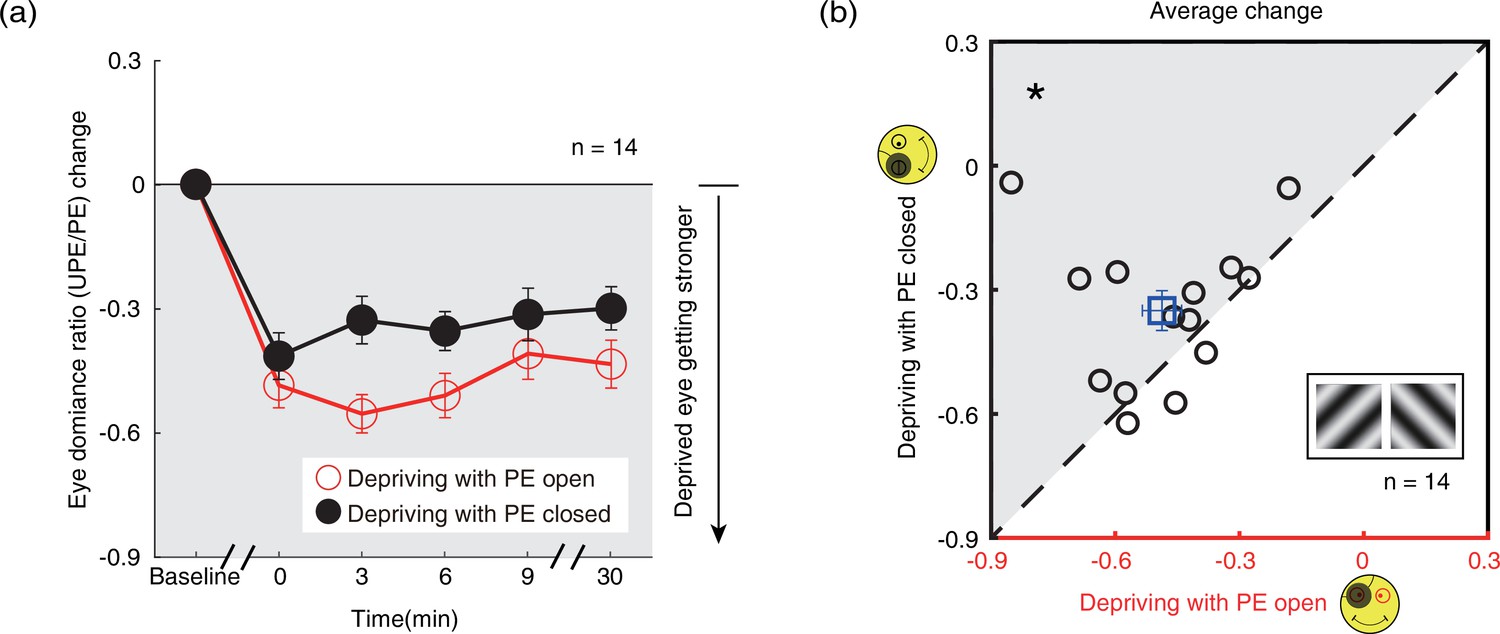
The change in ocular dominance as a result of the monocular deprivation in binocular rivalry.
(a) The change in ocular dominance as a result of the monocular deprivation using binocular rivalry task was compared when the eye behind the patch remained open (the eye-open condition: red lines and open circles) and when the eye behind the patch was kept closed (the eye-closed condition: black lines and filled circles). The eye dominance ratio was calculated as: dominant duration of UPE/dominant duration of PE. The eye dominance ratio change was calculated as: eye dominance ratio at post-measure session − eye dominance ratio at baseline. Error bars indicate one SEM across 14 subjects. (b) The average change of four post-measure sessions (0’, 3’, 6’, 9’) using the binocular rivalry task was compared for each subject for the two patching conditions. The open square symbol represents the averaged results. The dash line is the equality line. The gray area indicates where the eye-open patching produced more cumulated shift of ocular dominance than the eye-closed patching. Error bars represent one SEM across 14 subjects. The black star indicates the significance of the Wilcoxon signed-rank test, *: p<0.05.
-
Figure 6—source data 1
Related to Figure 6a and b.
- https://cdn.elifesciences.org/articles/83815/elife-83815-fig6-data1-v2.xlsx
Figure 7 with 1 supplement
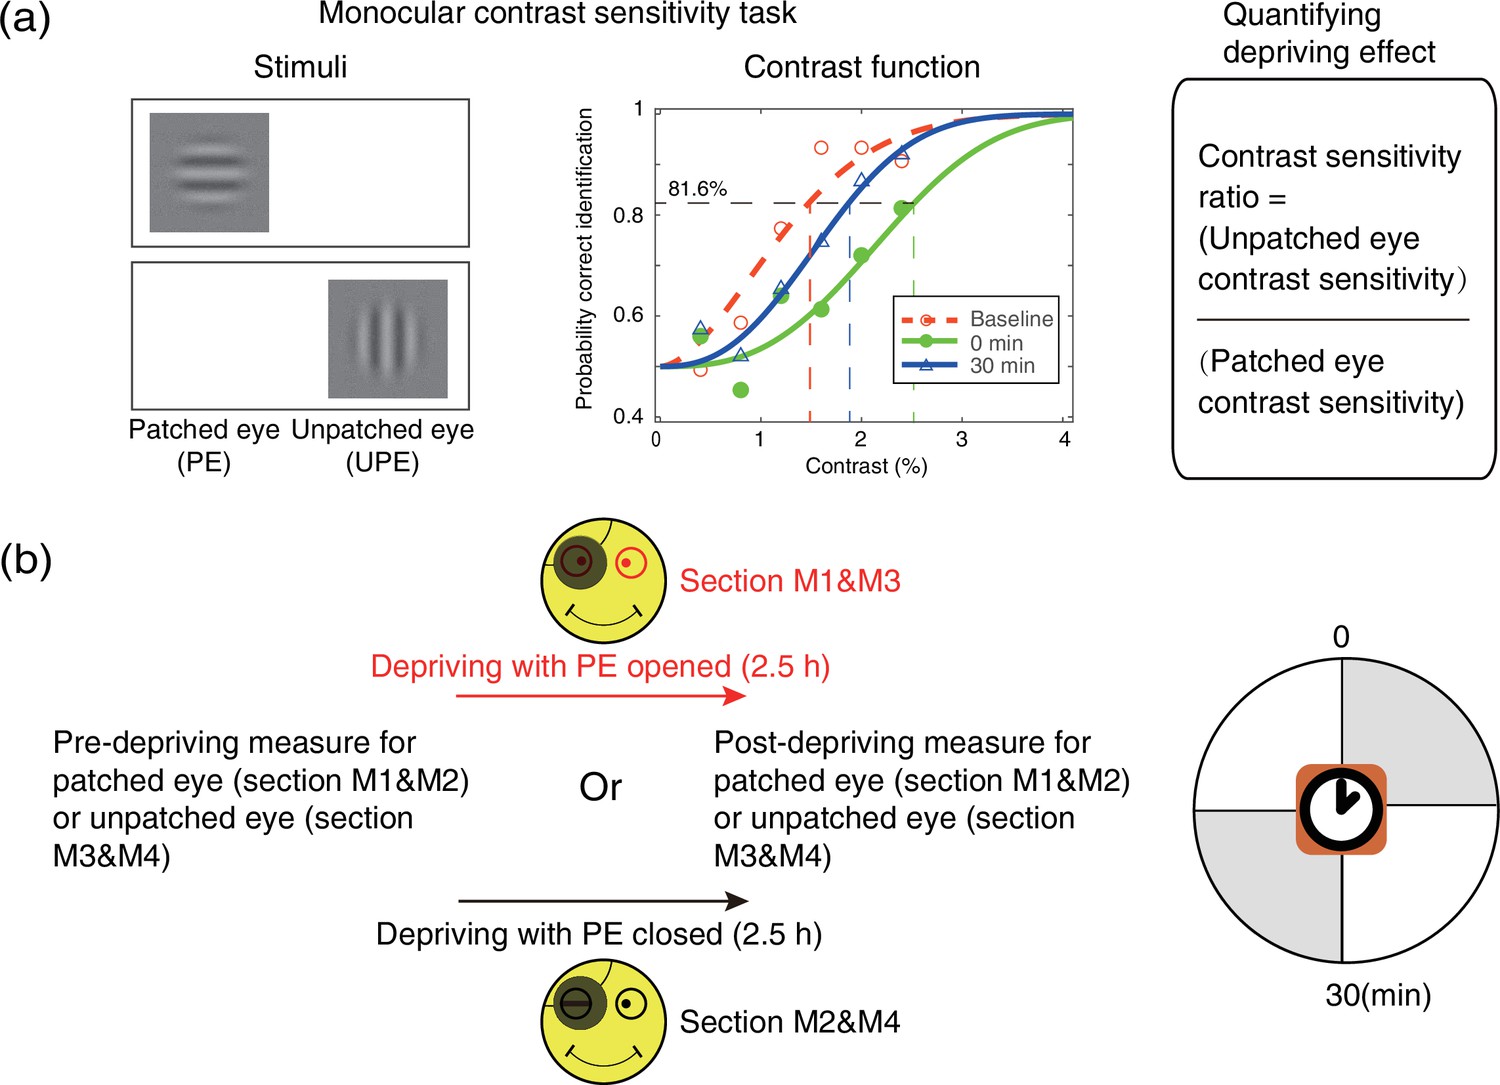
Experimental design and procedure of psychophysical monocular test.
(a) The monocular contrast sensitivity task. The stimulus was a vertical or horizontal sinewave grating, which was presented to the patched eye or unpatched eye with the unmeasured eye occluded. Observers’ contrast response functions were measured with constant stimuli method. Quick functions with maximum likelihood estimation were used to fit the contrast response function and derive the contrast thresholds. Contrast sensitivity was defined as the inverse of contrast threshold. Patching effect was quantified by the change of interocular contrast sensitivity ratio. (b) Monocular contrast sensitivity was measured before and after the 2.5 hr patching stage for patched eye or unpatched eye, started at multiple time points (0 and 30 min) after eye-open patching or eye-closed patching removal. (The black patch used for monocular deprivation is illustrated in Figure 7—figure supplement 1.)
Figure 7—figure supplement 1
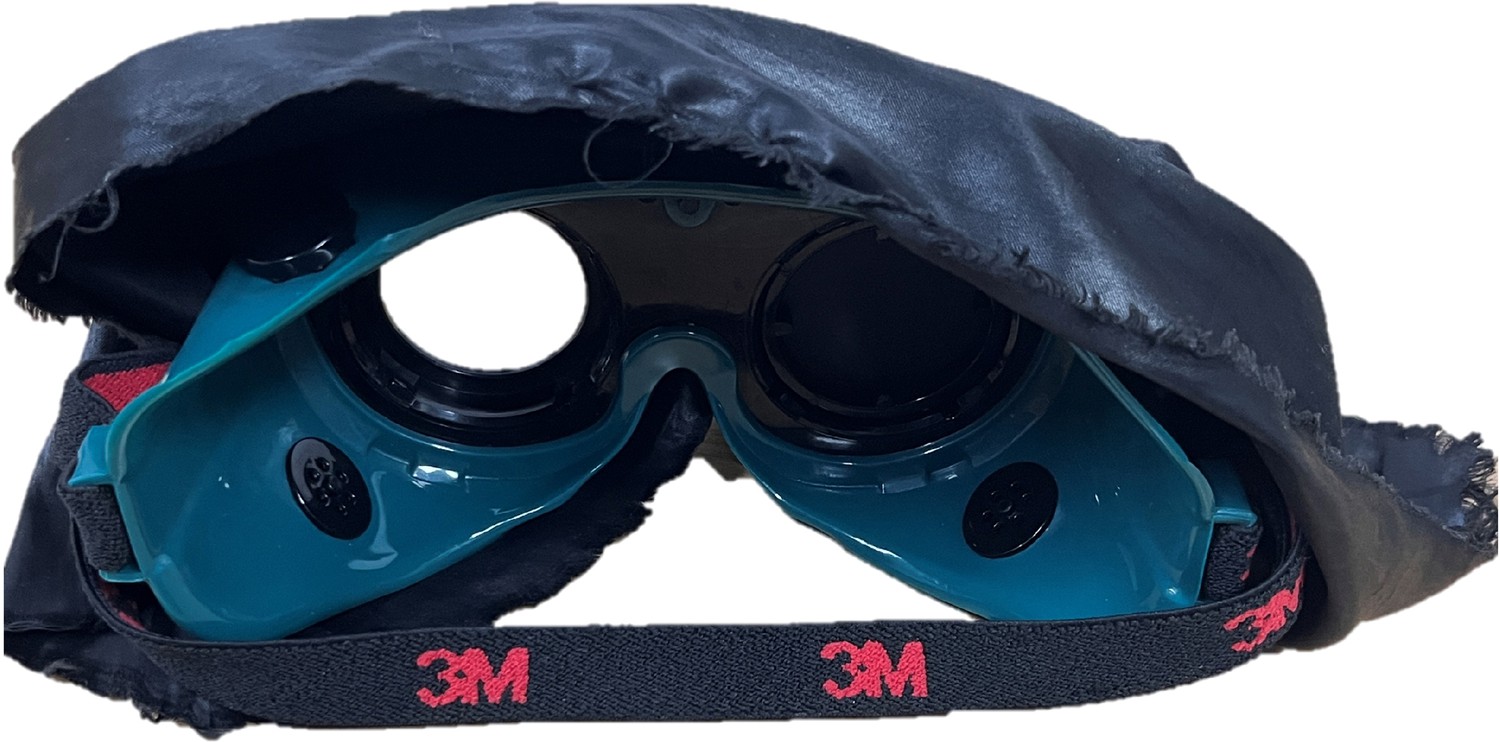
The patch used to cover one eye.
The black patch was specially designed by welding glasses which was also blocked the edge of the glasses with a shade cloth to ensure that no light would scatter around the patch into the patched eye (PE).
Figure 8
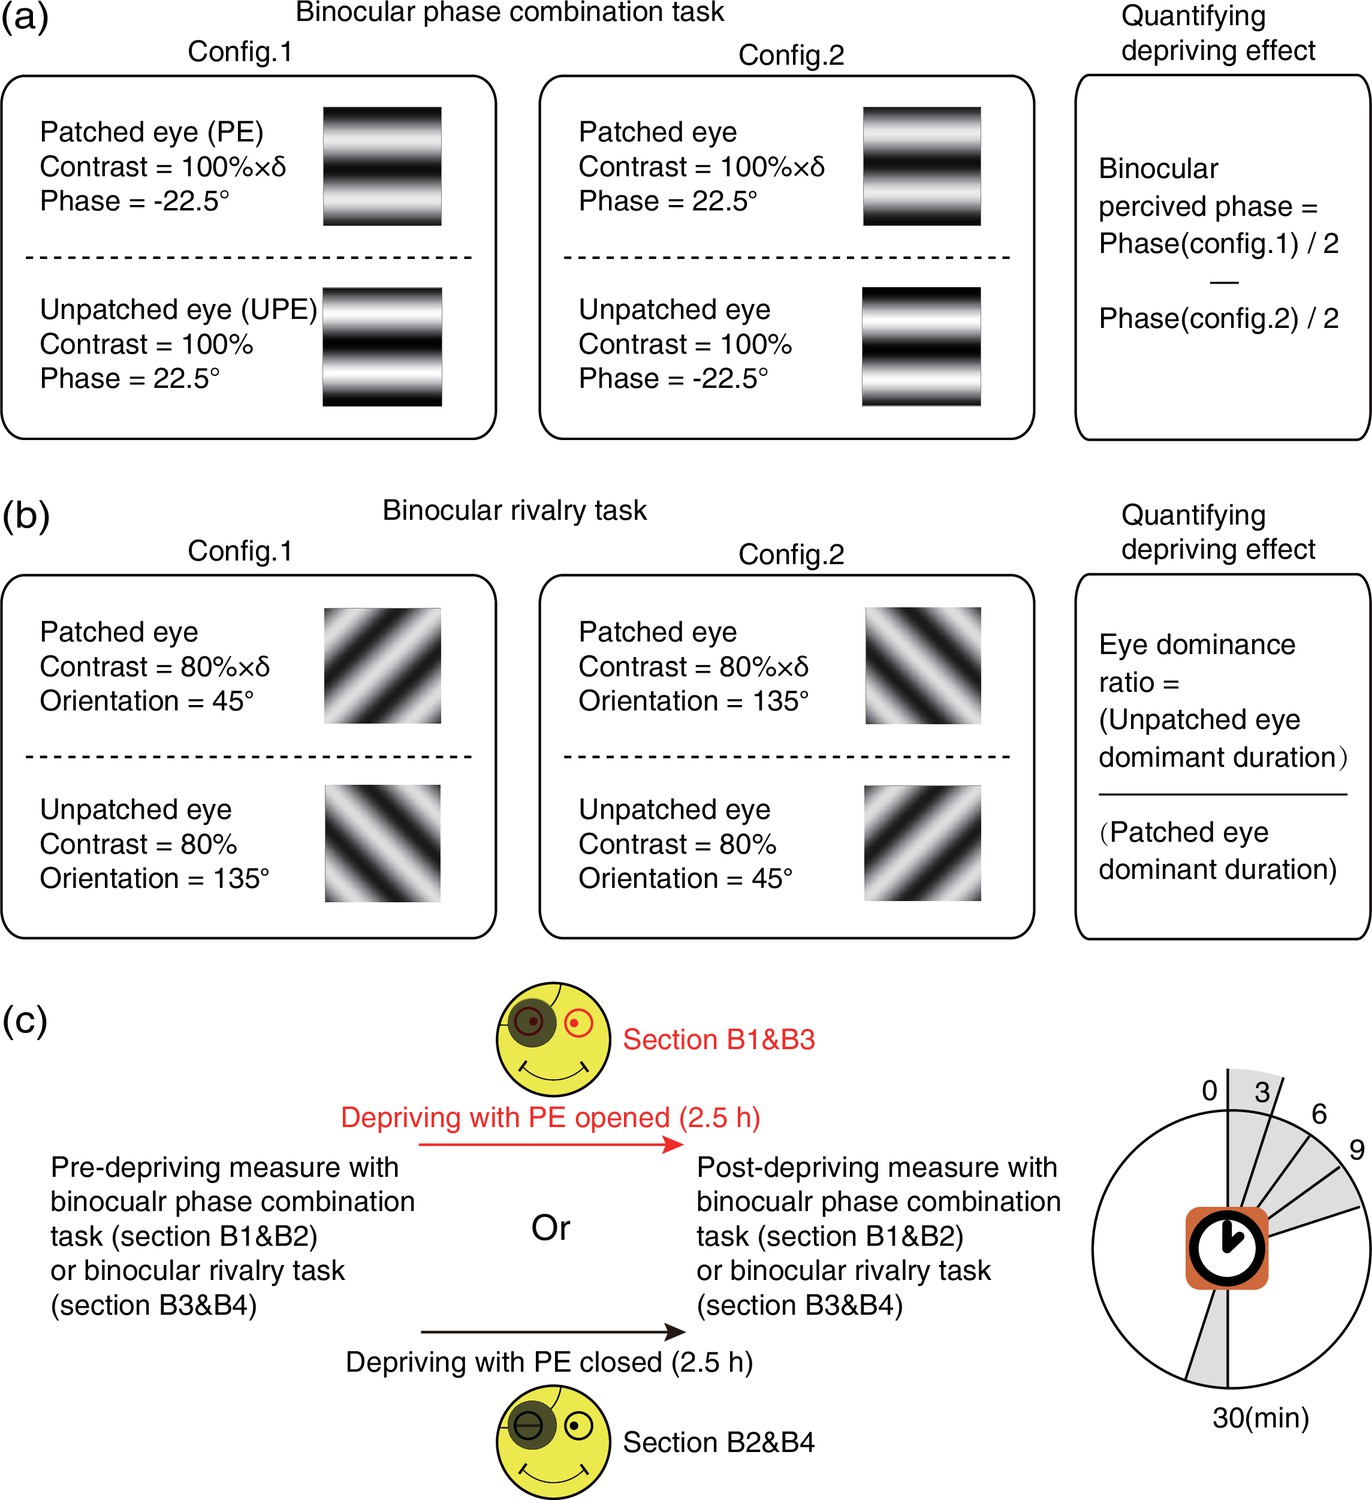
Experimental design and procedure of psychophysical binocular test.
(a) The binocular phase combination task. The stimuli were two horizontal sinewave gratings with equal and opposite phase-shift of 22.5° relative to the horizontal center of the screen, which were dichoptically presented to the two eyes. Patching effect on sensory eye dominance was quantified by the change of binocularly perceived phase. (b) The binocular rivalry task. The stimuli were two orthogonal sinewave gratings, which were dichoptically presented to the two eyes. Patching effect on sensory eye dominance was quantified by the change of eye dominance ratio. (c) Sensory eye dominance was measured before and after the 2.5 hr patching stage by phase combination task or rivalry task, started at multiple time points (0–30 min) after eye-open patching or eye-closed patching removal. (The black patch used for monocular deprivation is illustrated in Figure 7—figure supplement 1.)
Additional files
Download links
A two-part list of links to download the article, or parts of the article, in various formats.
Downloads (link to download the article as PDF)
Open citations (links to open the citations from this article in various online reference manager services)
Cite this article (links to download the citations from this article in formats compatible with various reference manager tools)
Internal neural states influence the short-term effect of monocular deprivation in human adults
eLife 12:e83815.
https://doi.org/10.7554/eLife.83815


