Atf3 defines a population of pulmonary endothelial cells essential for lung regeneration
- Department of Medicine, United States
- Department of Cell and Developmental Biology, United States
- Penn-Children’s Hospital of Philadelphia Lung Biology Institute, University of Pennsylvania, United States
- Penn Cardiovascular Institute, University of Pennsylvania, United States
Figures
Figure 1 with 3 supplements
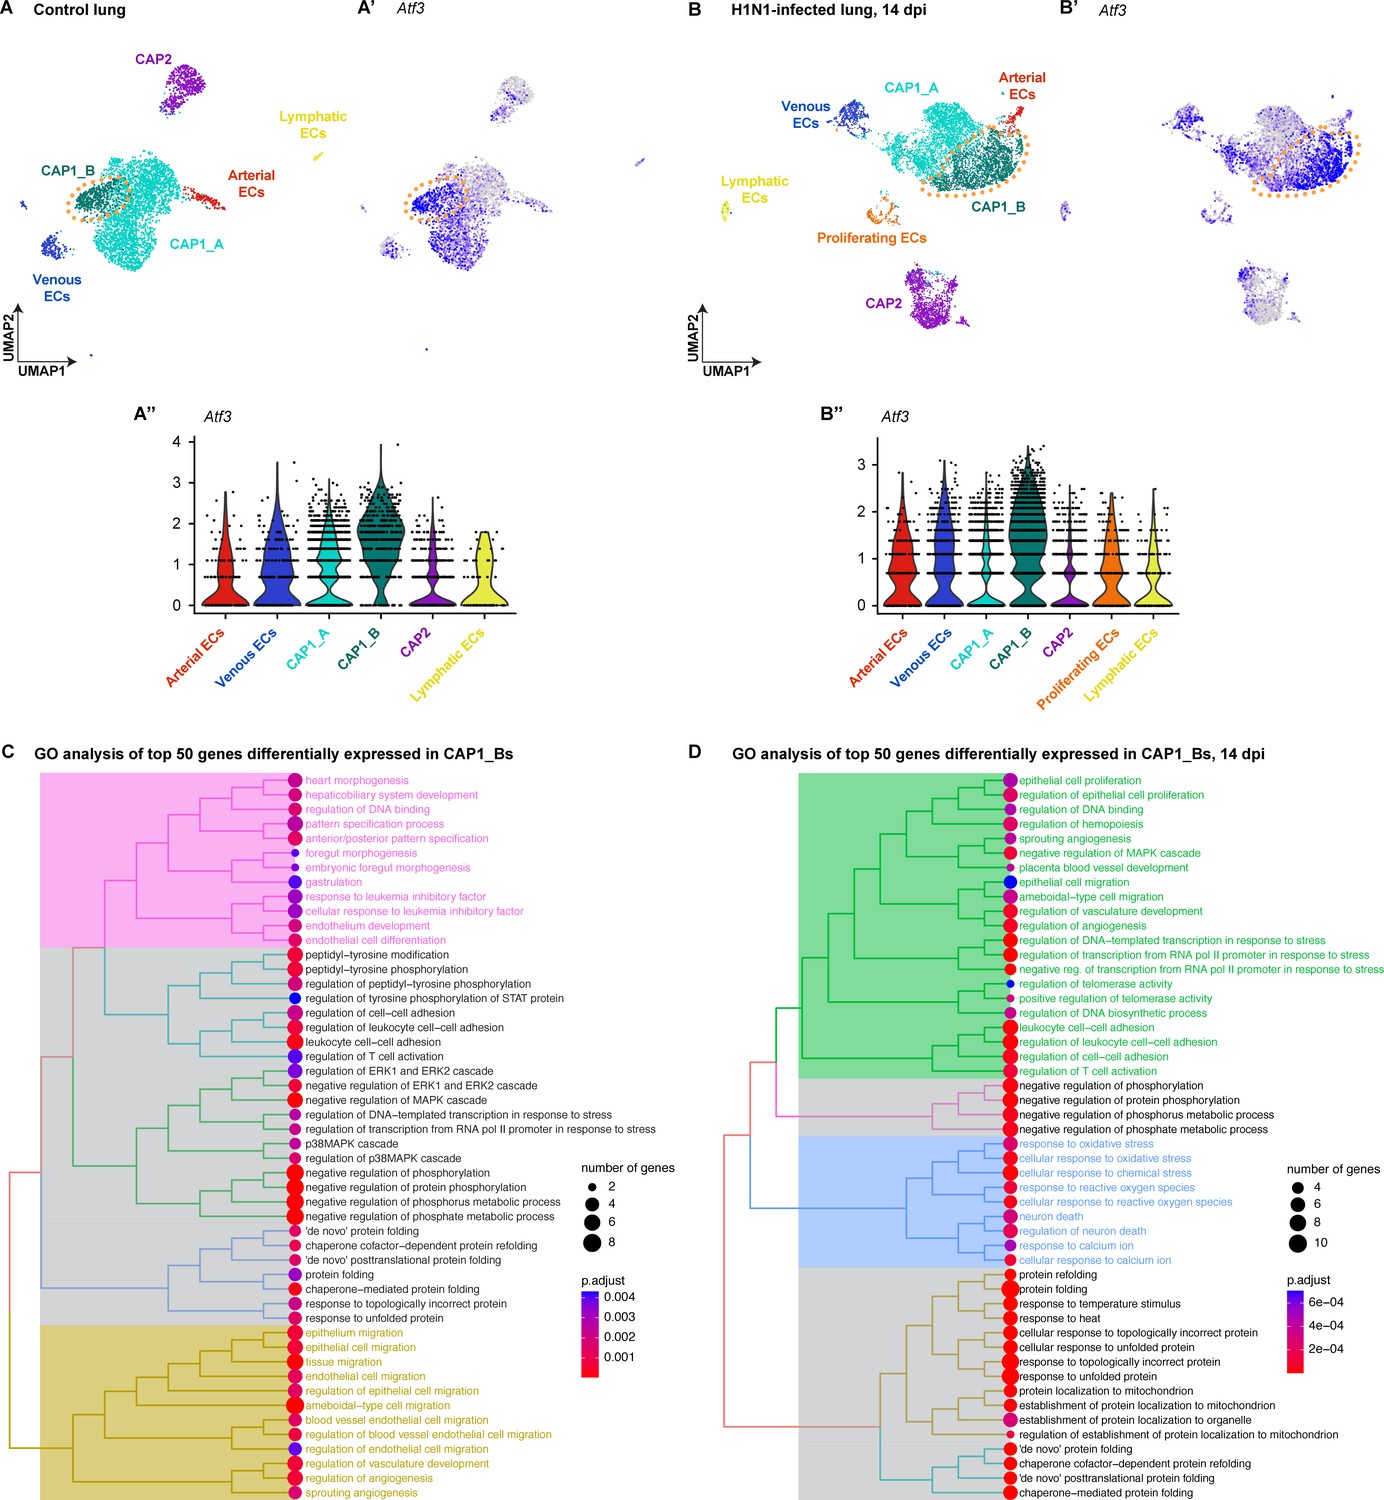
Expression of Atf3 defines a subset of pulmonary capillary endothelial cells.
(A) The Uniform Manifold Projection (UMAP) of endothelial cell subtypes from single-cell RNA sequencing (scRNA-seq) of whole mouse lung at homeostasis (n=1). (A’, A'') Atf3 transcript expression in endothelial cell clusters at homeostasis. Purple represents the high expression of Atf3, while gray represents low or no expression. Orange dotted line outlines the CAP1_B subcluster defined by the high expression of Atf3. (B) UMAP projection of endothelial cell subtypes from scRNA-seq of whole mouse lung at 14 days post-H1N1 influenza infection (dpi) (n=2). (B’, B’’) Atf3 transcript expression in endothelial cell clusters at 14 dpi. Purple represents the high expression of Atf3, while gray represents low or no expression. The number of cells in the CAP1_B cluster is increased at 14 dpi compared to the control lung. Orange dotted line outlines the CAP1_B subcluster defined by the high expression of Atf3. (C) Tree plot of the top fifty differentially expressed genes in CAP1_Bs at homeostasis. CAP1_Bs are defined by the expression of genes involved in endothelial development and differentiation, protein phosphorylation, cell-cell adhesion, protein folding, MAPK signaling, endothelial cell migration, and angiogenesis. (D) Tree plot of the top fifty differentially expressed genes in CAP1_Bs at 14 days post influenza infection. CAP1_Bs are defined by some of the same gene ontology (GO) terms during regeneration as they are at homeostasis, including cell-cell adhesion, protein phosphorylation, and protein folding. However, CAP1_Bs after H1N1 are also defined by the expression of genes involved in angiogenesis, vascular development, and cellular response to stress. This reveals a putative role for Atf3-expressing CAP1_Bs in the regenerative response of the endothelium to influenza infection.
Figure 1—figure supplement 1
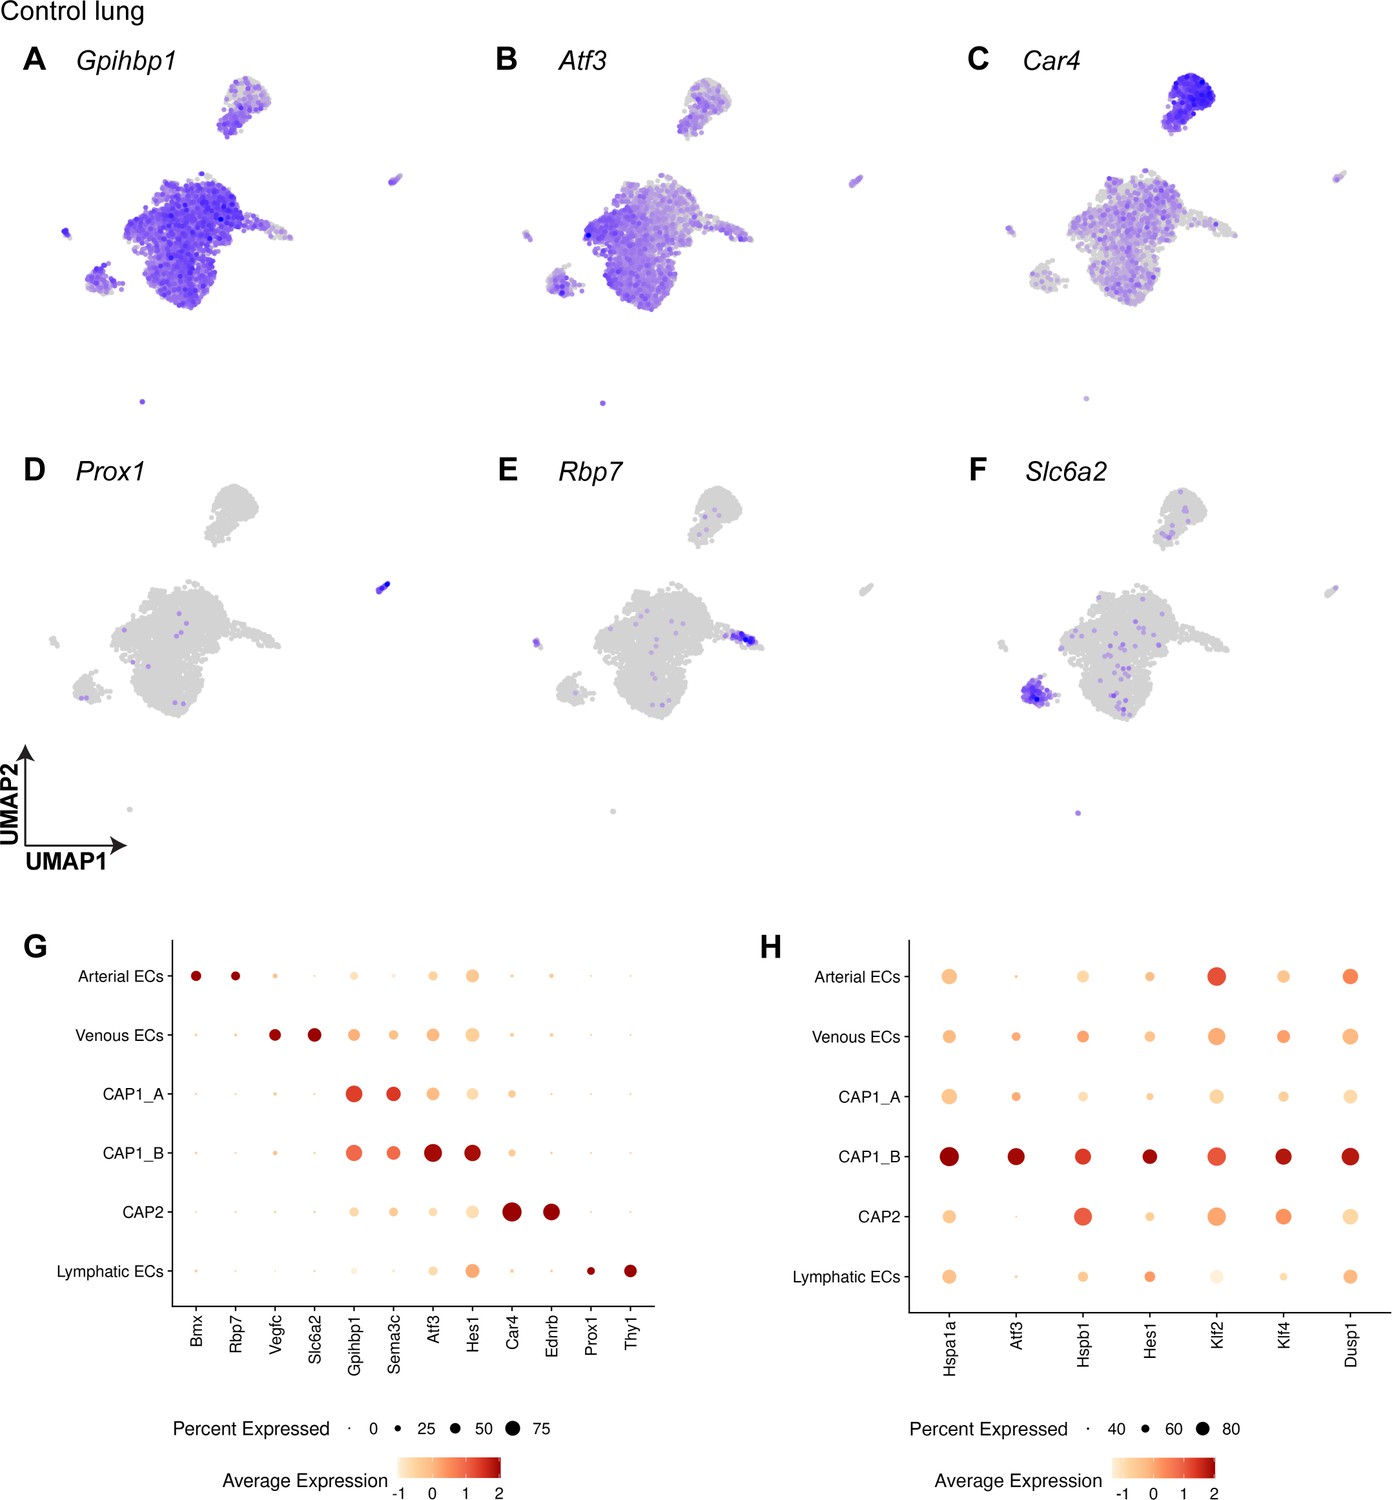
Pulmonary endothelial cell (EC) subclusters at homeostasis are defined by their differentially expressed genes.
(A) Both CAP1_As and CAP1_Bs express general pulmonary capillary EC marker Gpihbp1. (B) The CAP1_B cluster is defined by the expression of transcription factor Atf3. (C) CAP2s express the known marker gene Car4. (D) Lymphatic ECs are defined by the expression of Prox1. (E) Arterial ECs express Rbp7. (F) Venous ECs express Slc6a2. (G) Dot plot shows the average expression and percent of cells expressing the transcripts that define each cell cluster. Atf3 is highly expressed in the CAP1_B subcluster. (H) Dot plot showing genes highly differentially expressed in the CAP1_B subcluster and their expression in other EC types.
Figure 1—figure supplement 2
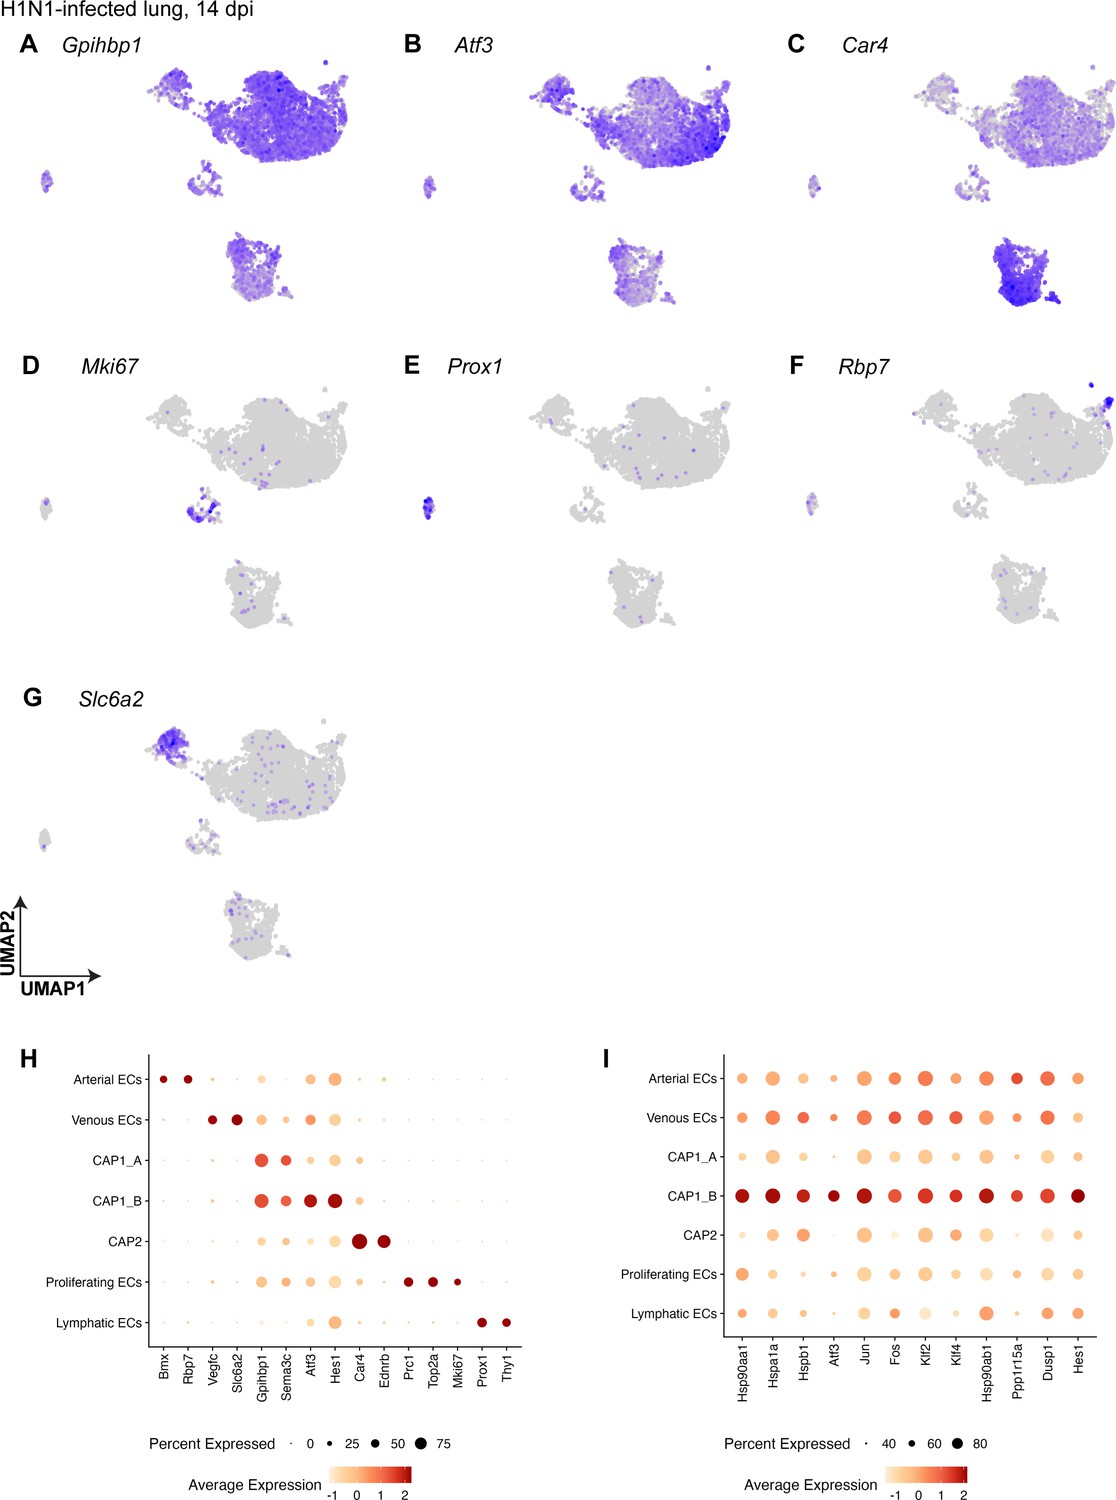
Pulmonary endothelial cell (EC) subclusters at 14 days post-H1N1 are defined by their differentially expressed genes.
(A) CAP1s express marker gene Gpihbp1 across both A and B subclusters. (B) CAP1_Bs are additionally defined by the expression of the transcription factor Atf3. (C) CAP2s are defined by the expression of Car4. (D) Proliferating ECs express cell cycle marker gene Mki67. (E) Lymphatic ECs express the known marker gene Prox1. (F) Arterial ECs are defined by the expression of Rbp7. (G) Venous ECs are defined by the expression of Slc6a2. (H) Dot plot shows the average expression and percent of cells expressing the transcripts that define each cell cluster. Atf3 is highly expressed in the CAP1_B subcluster. (I) Dot plot showing genes highly differentially expressed in the CAP1_B subcluster and their expression in other EC types after H1N1.
Figure 1—figure supplement 3
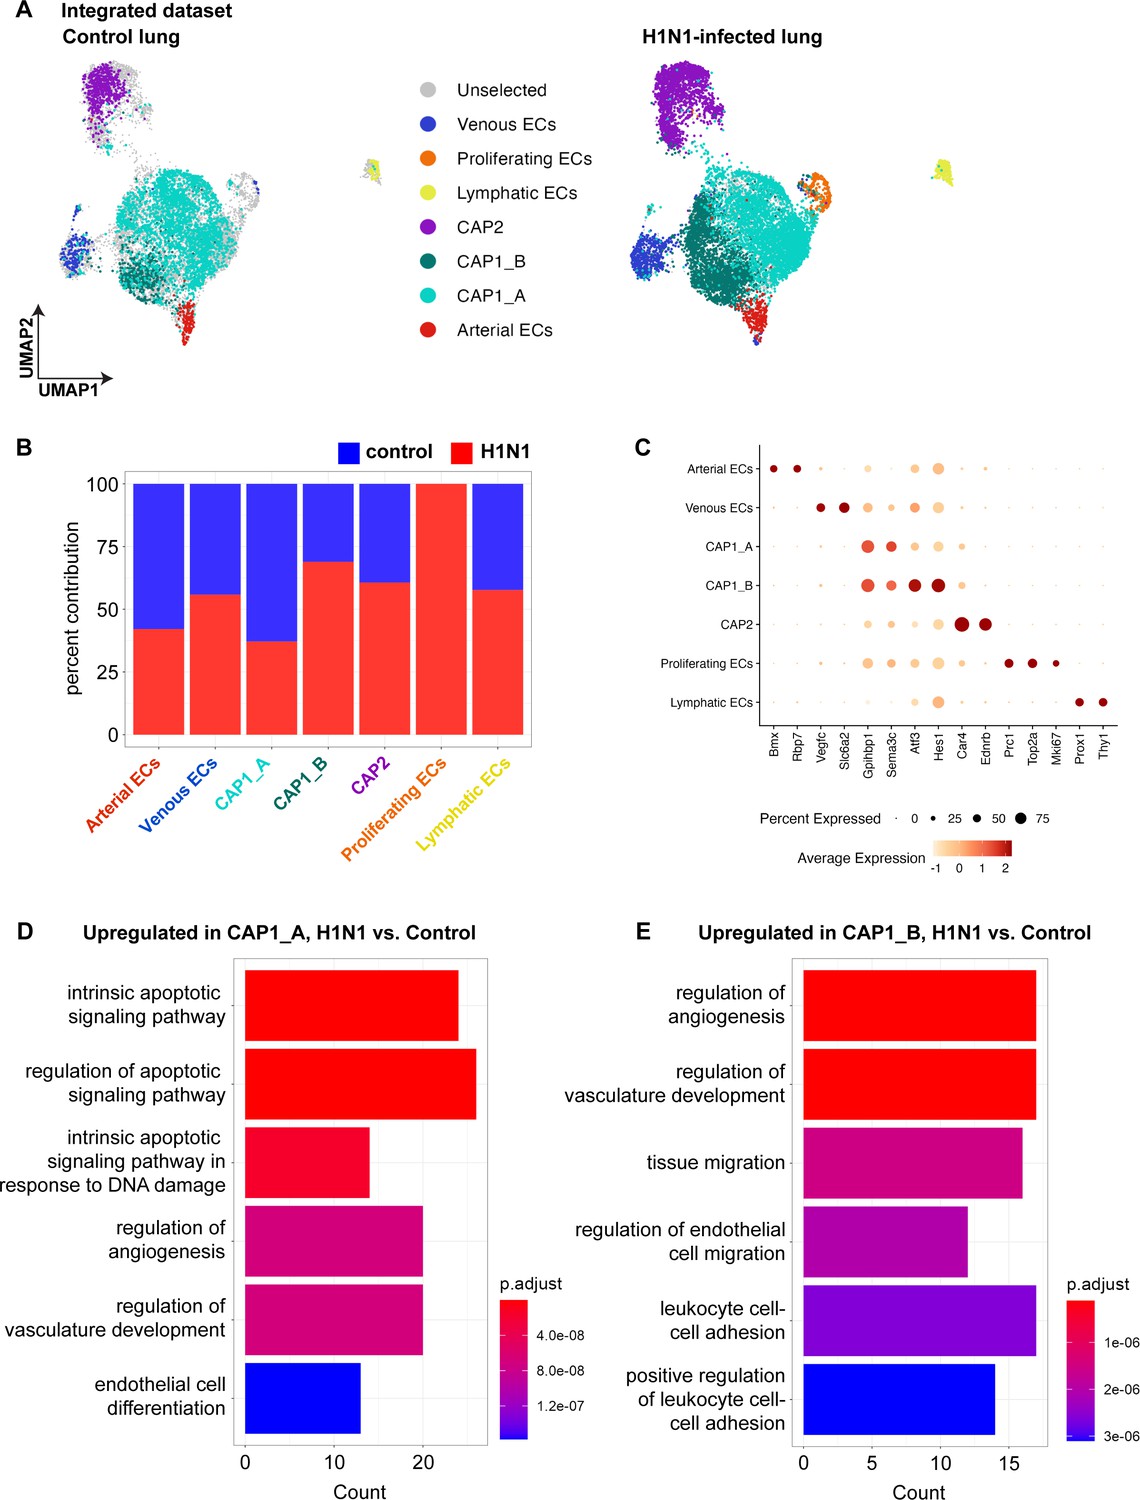
Integration of control and influenza single-cell RNA sequencing (scRNA-seq) data.
(A) The Uniform Manifold Projection (UMAP) dimension reduction plots from the integration of control and influenza scRNA-seq data, with colored dots representing cellular contributions to each cluster from control (left) and H1N1 (right) datasets. (B) Bar plot demonstrates the percent contribution of each individual dataset to the total number of cells in each cluster in the integrated dataset. Atf3-expressing CAP1_B ECs have a greater percentage contribution from the H1N1 dataset, and proliferating endothelial cells (ECs) are only found in the H1N1 dataset, with no contribution from the control dataset. (C) Dot plot shows the average expression and percent of cells expressing the transcripts that define each endothelial subcluster in the integrated dataset. (D) Gene ontology (GO) analysis of differentially expressed genes in the CAP1_A subcluster in control vs. H1N1 conditions reveals that genes related to apoptotic signaling and regulation of angiogenesis, vasculature development, and endothelial cell differentiation are upregulated in CAP1_A ECs after H1N1. (E) GO analysis of differentially expressed genes in the CAP1_B subcluster in control vs. H1N1 conditions reveals that genes related to the regulation of angiogenesis, vascular development, endothelial cell migration, and leukocyte adhesion are upregulated in CAP1_B ECs after H1N1.
Figure 2 with 3 supplements
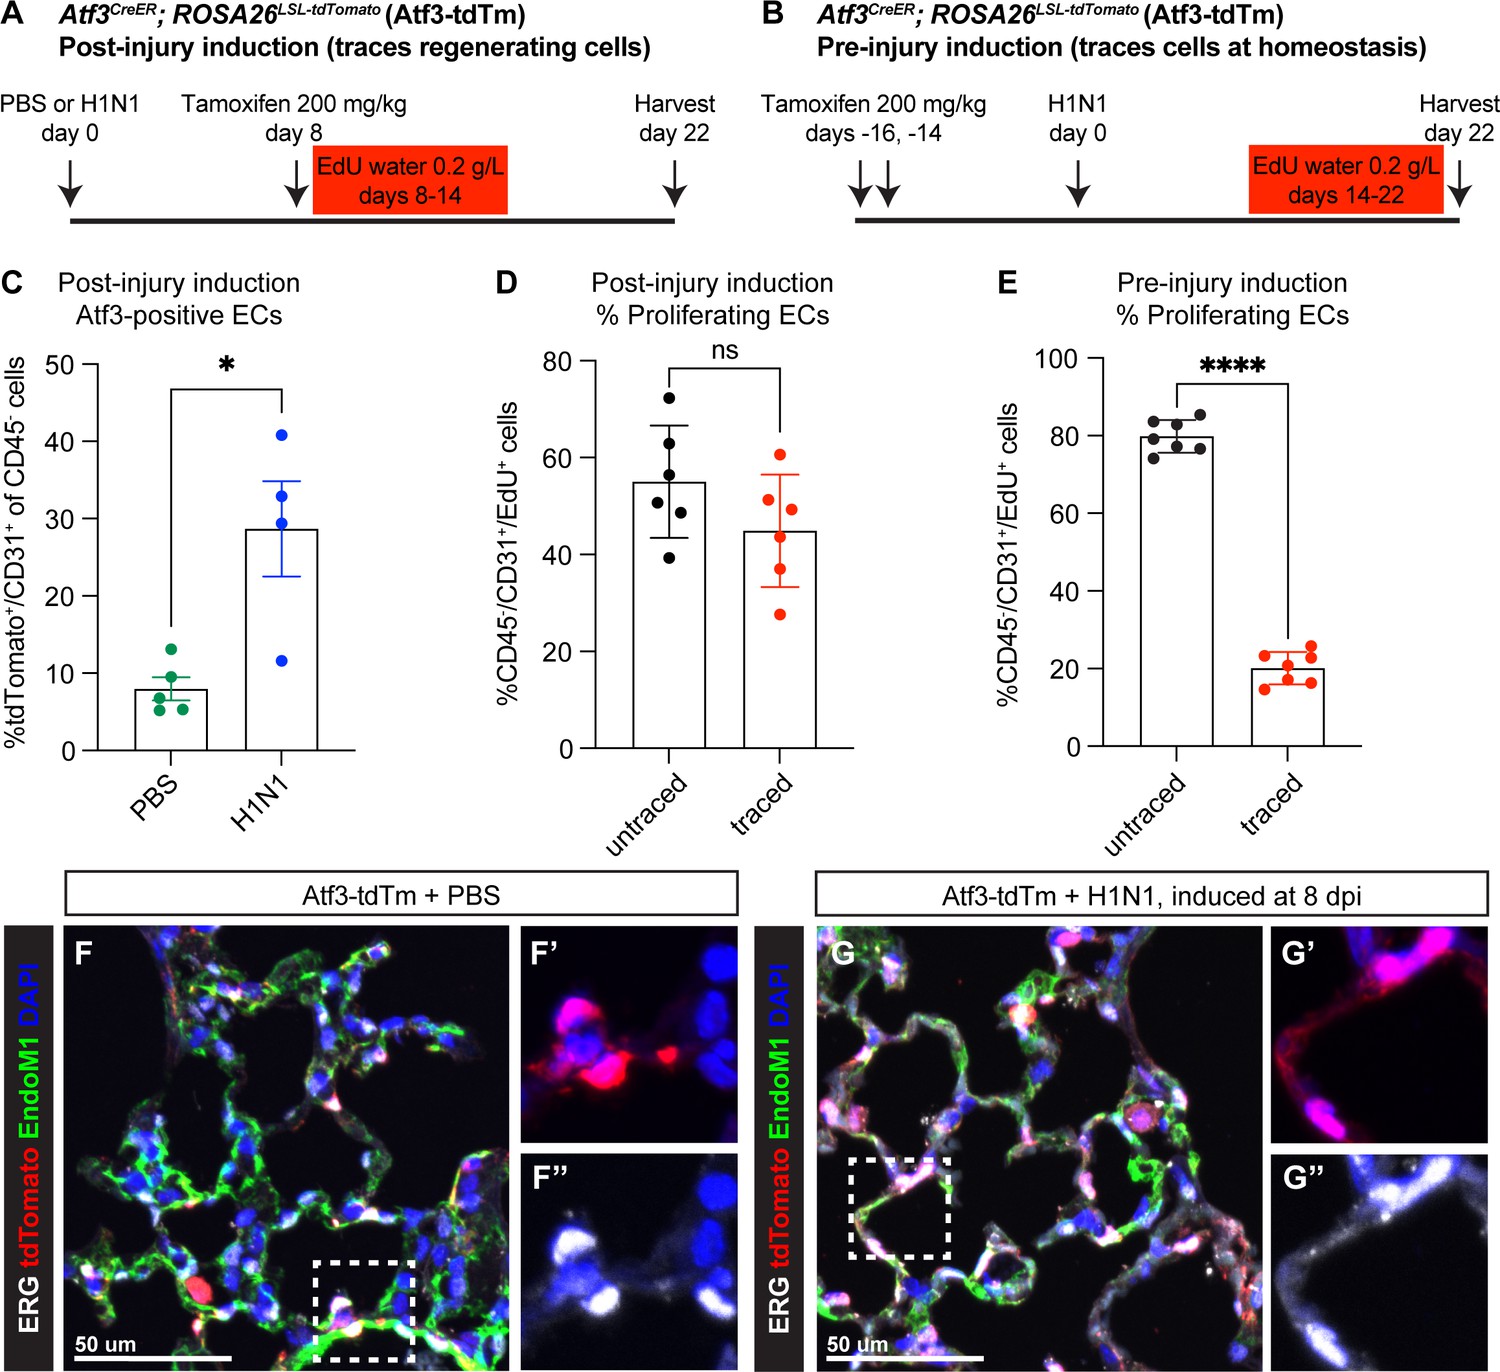
Atf3-expressing CAP1_Bs increase in the mouse lung after H1N1 injury and contribute to endothelial regeneration.
(A) Schematic of the experimental setup to investigate Atf3-expressing cells during regeneration after H1N1. Atf3CreERT2; ROSA26LSL-tdTomato (Atf3-tdTm) adult mice (5–13 weeks old) received 200 mg/kg tamoxifen by oral gavage 8 days after H1N1 influenza injury (8 dpi) and were treated with EdU ad libitum in their drinking water from 8 to 14 dpi. Mice were harvested at 22 dpi for flow cytometry and immunofluorescence (IF) analysis. (B) Schematic of the experimental setup to investigate cells that express Atf3 at homeostasis. Atf3-tdTm adult mice (8–13 weeks old) received 200 mg/kg tamoxifen by oral gavage at 16 and 14 days prior to H1N1 infection. Following H1N1 administration, mice were treated with EdU ad libitum in their drinking water from 14 to 22 dpi and harvested at 22 dpi. (C) A large increase in Atf3-positive ECs (CD31+/tdTomato+ cells) is observed in Atf3-tdTm mice infected with H1N1 (n=4) compared to control mice (n=5). Error bars represent standard error of the mean (SEM). *p=0.0317 by Mann-Whitney rank-sum test. (D) Percentage of proliferating ECs (CD45−/CD31+/EdU+ cells) between 8–14 dpi represented by Atf3-positive (traced) and Atf3-negative (untraced) cells when Cre activity is induced during regeneration (n=6 animals). This demonstrates that Atf3-positive ECs are not the sole source of proliferating ECs during regeneration. Error bars represent standard deviation (SD). ns, p=0.1604 by unpaired t-test. (E) Percentage of proliferating ECs (CD45−/CD31+/EdU+) derived from ECs that were Atf3-negative at homeostasis (untraced) versus Atf3-positive at homeostasis (traced) (n=6 animals). While traced cells clearly contribute to endothelial proliferation after H1N1, untraced cells make up approximately 80% of the proliferating endothelial cells (ECs) between days 14–22. Error bars represent standard deviation (SD). ****p<0.0001, unpaired t-test. (F) IF for tdTomato, the nuclear endothelial marker ERG, and the cytoplasmic endothelial marker Endomucin-1 in uninjured Atf3-tdTm mice show that Atf3-positive ECs can be found in both large vessels and in the alveolar space at homeostasis (inset marked by white box). Scale bar, 50 μm. (G) IF for tdTomato, ERG, and Endomucin-1 in H1N1-infected Atf3-tdTm mice at 22 dpi demonstrates an increase in Atf3-positive ECs in the alveolar space after influenza (inset marked by white box). Scale bar, 50 μm.
Figure 2—figure supplement 1
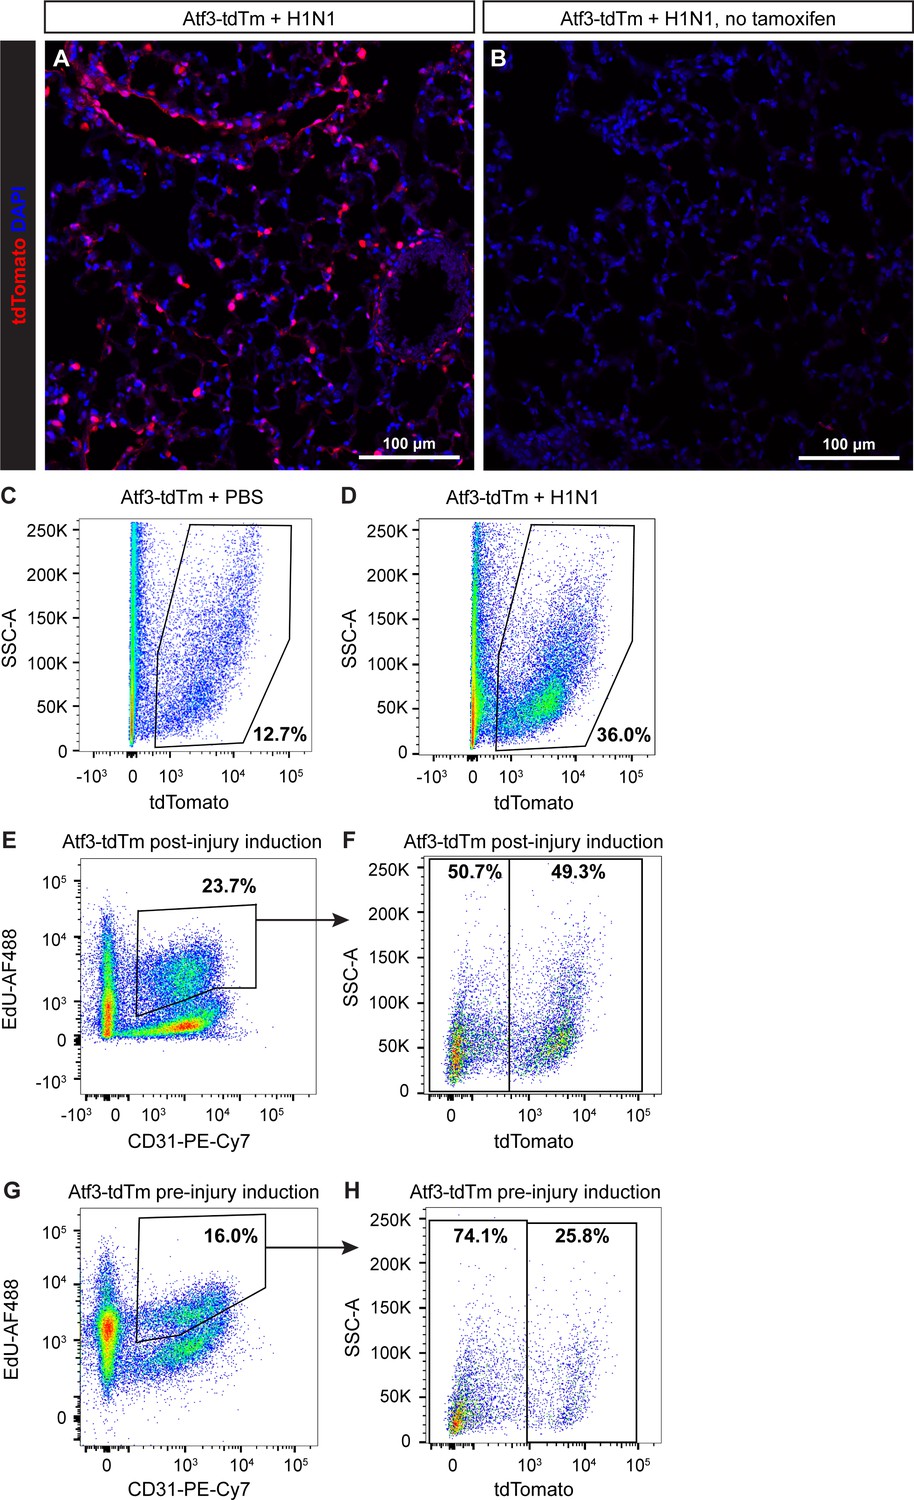
Atf3CreERT2 activity is not induced by H1N1 injury.
(A) Atf3CreERT2; ROSA26LSL-tdTomato (Atf3-tdTm) adult mice treated with tamoxifen 8 days after H1N1 influenza injury show robust tdTomato expression at 22 days post-injury (dpi). (B) Atf3-tdTm adult mice not treated with tamoxifen do not demonstrate appreciable tdTomato expression after H1N1 influenza injury, indicating that injury does not induce Cre recombination in this context. Representative flow cytometry plots from (C) control and (D) H1N1-infected Atf3-tdTm animals given tamoxifen at 8 dpi demonstrate the increase in %tdTomato+ (Atf3-expressing) cells after H1N1. (E), (F) Representative flow cytometry plot from an Atf3-tdTm animal given tamoxifen at 8 dpi shows the percentage of CD31+/EdU+ proliferating endothelial cells that are traced (tdTomato+, Atf3+) and untraced (tdTomato−, Atf3−). (G), (H) Representative flow cytometry plot from an Atf3-tdTm animal given tamoxifen prior to injury shows the percentage of CD31+/EdU+ proliferating endothelial cells that are traced (tdTomato+, Atf3+) and untraced (tdTomato−, Atf3−). Scale bars, 100 μm.
Figure 2—figure supplement 2
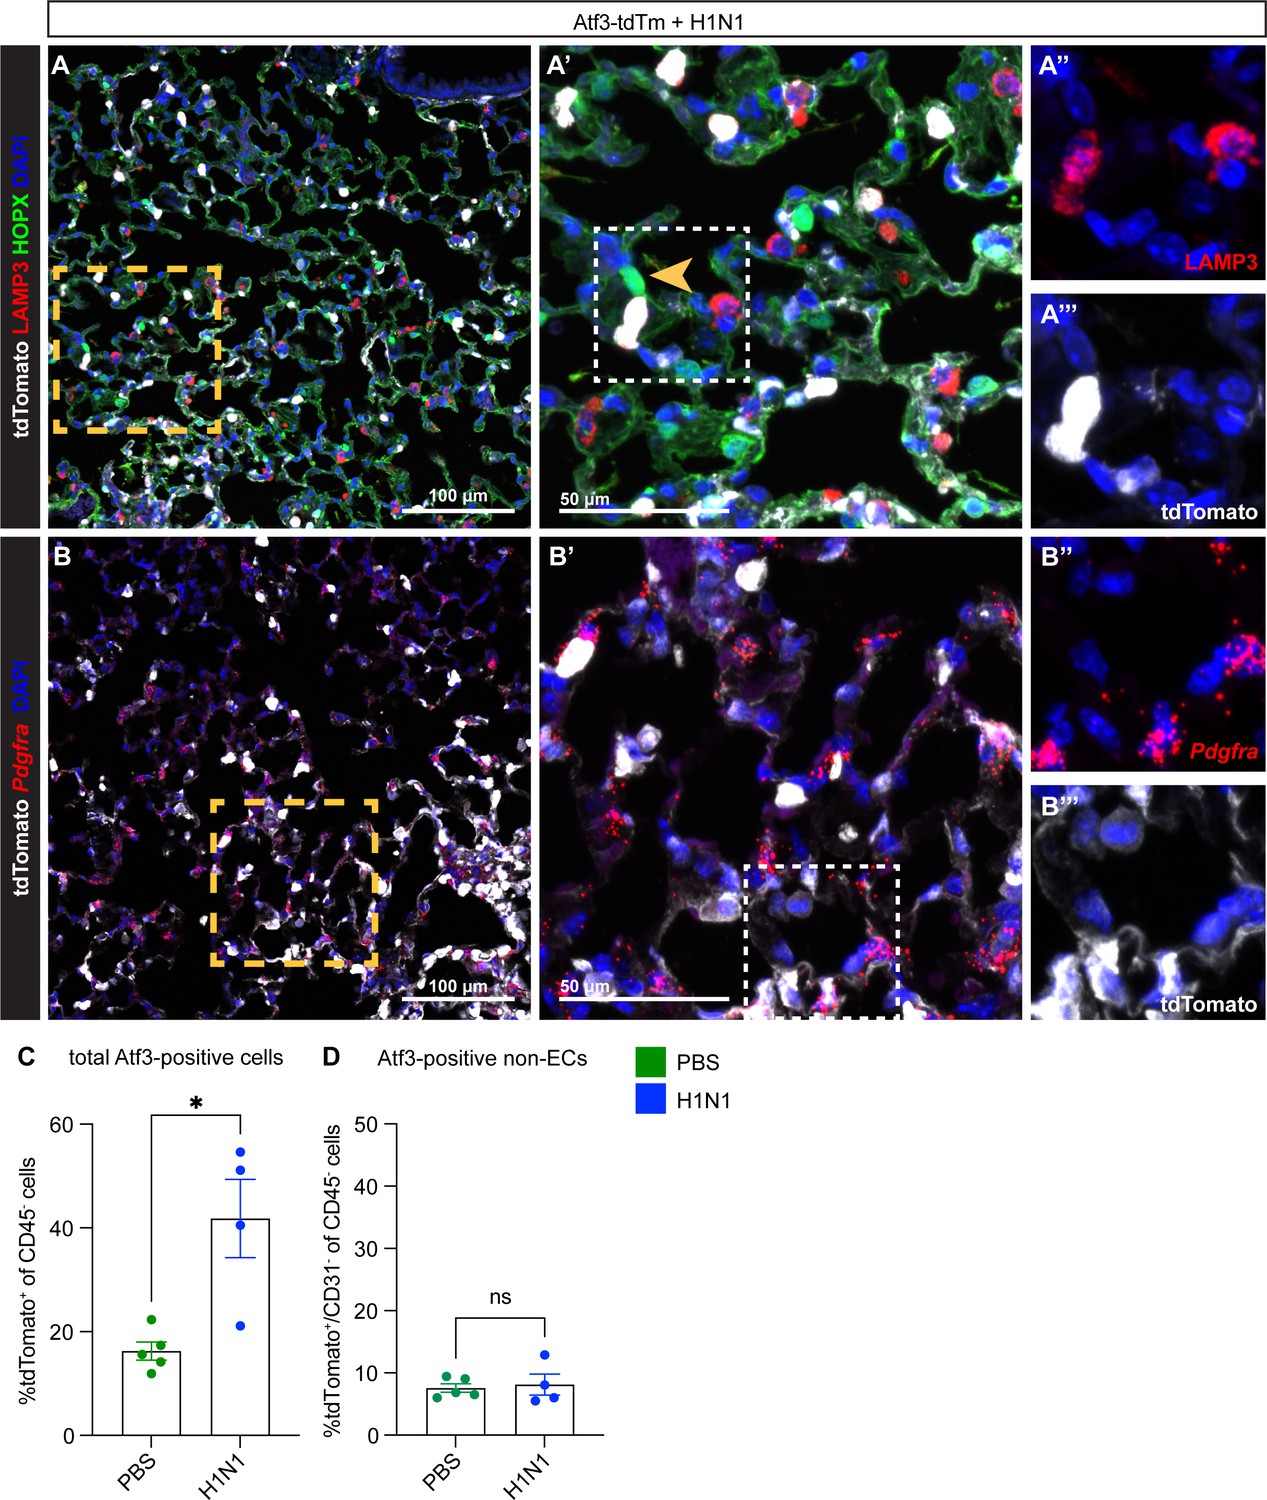
Atf3 is expressed at low levels in other alveolar cell types, but these cells do not increase in number after H1N1.
(A) Immunostaining for the AT2 cell marker DC-LAMP (LAMP3), red, and the alveolar epithelial type 1 (AT1) cell marker HOPX, green, in Atf3CreERT2; ROSA26LSL-tdTomato adult mice treated with tamoxifen at 8 dpi and harvested at 22 dpi. Atf3 is seen in some, but not most, AT2 cells after H1N1 injury to the lung. Atf3 expression in AT1 cells (yellow arrow, (A’)) is extremely rare. (A’) shows the area within the yellow box in (A); (A’’) and (A’’’) show the area within the white box in (A’). (B) RNAscope in situ for the mesenchymal marker Pdgfra in Atf3CreERT2; ROSA26LSL-tdTomato adult mice treated with tamoxifen at 8 dpi and harvested at 22 dpi. Atf3 can be found in rare Pdgfra-expressing cells after H1N1 injury. (B’) shows the area within the yellow box in (B); (B’’) and (B’’’) show the area within the white box in (B’). (C) The total percentage of Atf3-positive non-immune cells (CD45−/tdTomato+ cells) is increased in H1N1-injured animals (n=4) compared to PBS-treated animals (n=5). Error bars represent standard error of the mean (SEM). *p=0.0317 by Mann-Whitney rank-sum test. (D) However, although there is a small percentage of Atf3-positive non-ECs (CD31−/tdTomato+ cells) present in the lung at homeostasis, there is no increase in the percentage of these cells present after H1N1 injury. Error bars represent standard error of the mean (SEM). ns, p=0.7512 by unpaired t-test. Scale bars in (A), (B), 100 μm; scale bars in (A’), (B’), 50 μm.
Figure 2—figure supplement 3
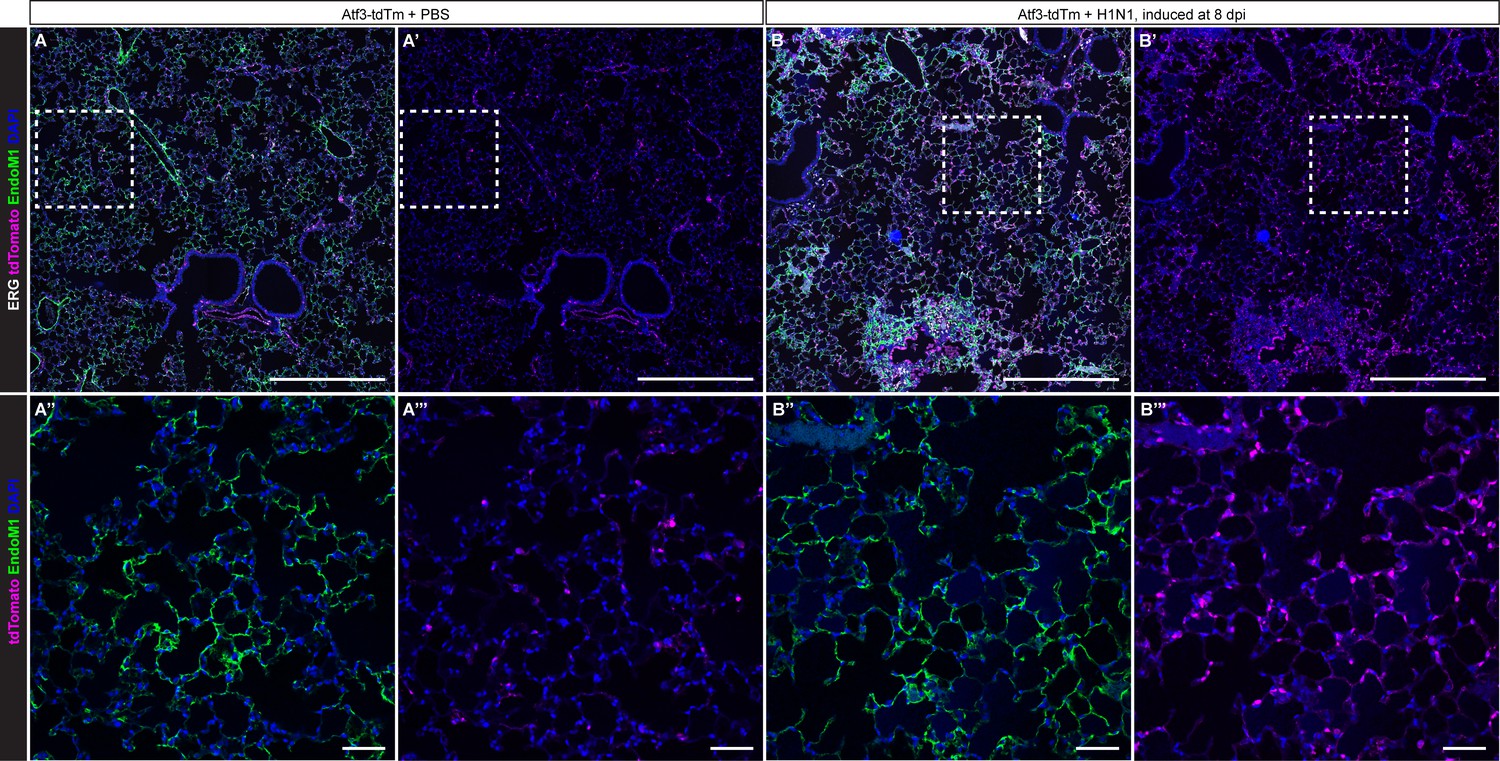
Atf3-expressing endothelial cells increase in the alveolar space following H1N1 infection.
(A) A tile scan of immunofluorescence (IF) for the nuclear endothelial marker ERG, cytoplasmic endothelial marker Endomucin-1, and tdTomato in Atf3-tdTm animals at homeostasis show that Atf3-positive endothelial cells (ECs) can be found in both large vessels and in the alveolar space in the absence of lung injury. (A’) At homeostasis, tdTomato+ cells are sparse and distributed throughout the distal lung. (A’’) Endomucin-1 shows total endothelial cells and (A’’’) tdTomato shows Atf3-expressing cells in the area outlined by the white box in A, A’. (B) In Atf3-tdTm mice given tamoxifen at 8 dpi, a tile scan of IF for the nuclear endothelial marker ERG, cytoplasmic endothelial marker Endomucin-1, and tdTomato demonstrates an increase in tdTm+ endothelial cells throughout the alveolar space. (B’) After H1N1, tdTomato+ cells are increased in the alveolar space. (B’’) Endomucin-1 shows total endothelial cells and (B’’’) tdTomato shows Atf3-expressing cells inside the white box in B, B’. Scale bars in (A), (A’), (B), (B’), 500 μm. Scale bars in (A’’), (A’’’), (B’’), (B’’’), 50 μm.
Figure 3 with 4 supplements

Endothelial loss of Atf3 causes defects in alveolar regeneration.
(A) Schematic of the experimental setup. Cdh5-CreERT2; ROSA26LSL-tdTomato (Atf3EC-WT) and Cdh5-CreERT2; ROSA26LSL-tdTomato; Atf3lox/lox (Atf3EC-KO) adult mice (5–15 weeks old) received 200 mg/kg tamoxifen by oral gavage 2 weeks before H1N1 influenza injury or PBS administration (control). Mice received EdU in their drinking water at 0.2 g/L from days 7–14 and were harvested at 14 dpi or received EdU in their drinking water at 0.2 g/L from days 14–21 and were harvested at 21 dpi. (B) Representative image of immunofluorescence (IF) for alveolar epithelial type 1 (AT1) cell marker podoplanin (PDPN), used to visualize alveolar structure across the tissue, in an Atf3EC-WT mouse at 14 dpi. (C) Representative image of IF for PDPN in an Atf3EC-KO mouse at 14 dpi, demonstrating an increase in alveolar area compared to the WT mouse. (D) Mice that have lost endothelial Atf3 expression (n=10) have significantly increased alveolar area at 14 dpi compared to Atf3EC-WT mice (n=7). Error bars represent standard deviation (SD). ***p=0.0001 by Mann-Whitney rank-sum test. (E) Representative image of IF for PDPN to define alveolar space in an Atf3EC-WT mouse at 21 dpi. (F) Representative image of IF for PDPN to define alveolar space in an Atf3EC-KO mouse at 21 dpi, demonstrating an increase in alveolar area compared to the WT mouse. (G) Mice with endothelial Atf3 knockout (n=5) have significantly increased alveolar area at 21 dpi compared to WT mice (n=4). Error bars represent standard deviation (SD). *p=0.0159 by Mann-Whitney rank-sum test. Scale bars, 50 μm.
Figure 3—figure supplement 1
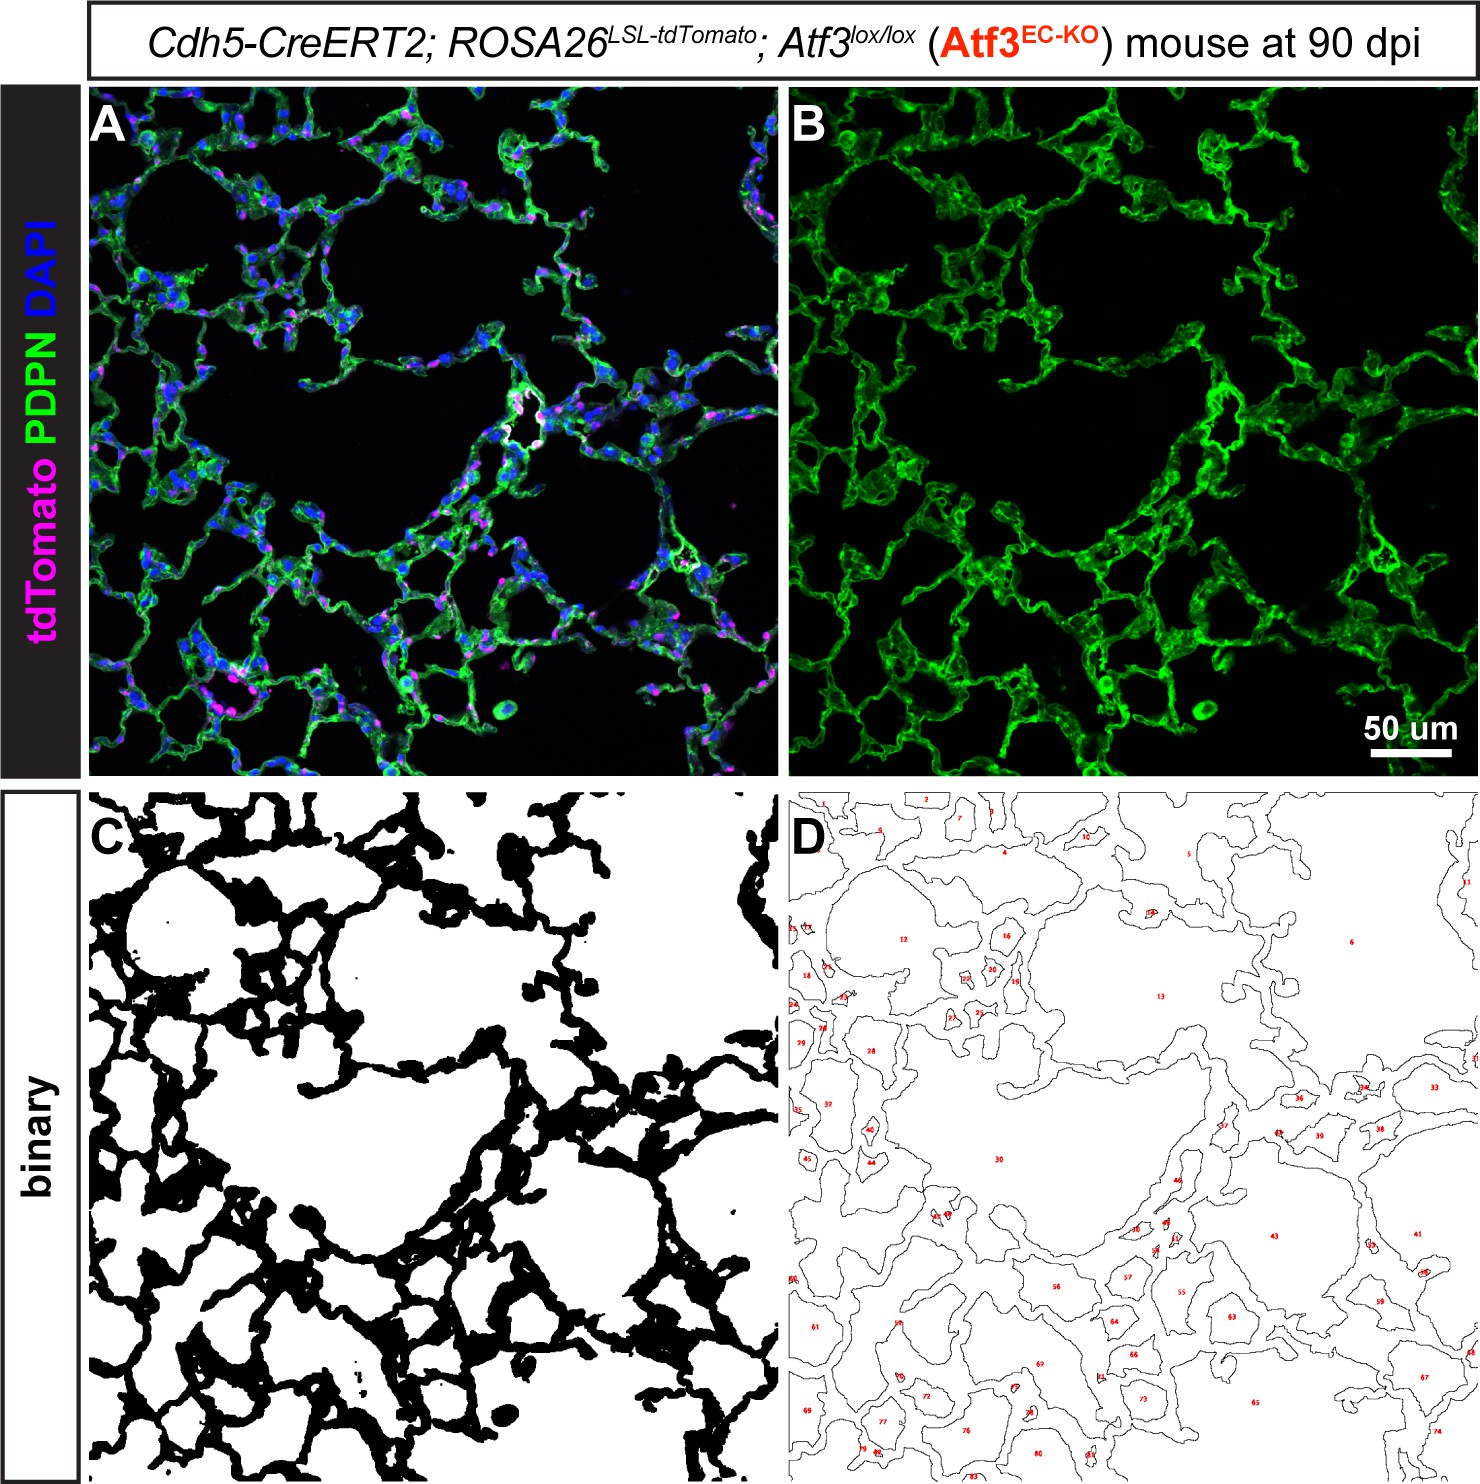
Quantification of the alveolar area using immunohistochemistry for podoplanin (PDPN).
(A) Example 20 X image taken from a lung tissue section from a Cdh5-CreERT2; ROSA26LSL-tdTomato; Atf3lox/lox (Atf3EC-KO) mouse at 90 days post influenza (dpi). Immunofluorescence (IF) was performed for the alveolar epithelial type 1 (AT1) cell marker PDPN, green; tdTomato+ endothelial cells, magenta; and DAPI+ nuclei, blue. (B) The AT1 cell marker PDPN was used to visualize alveolar structure across the tissue. The separated channel was used as an outline of individual alveoli. (C) Each image threshold was assessed manually and binarized using FIJI. The binarized images were subjected to 1–2 rounds of dilation and erosion. (D) Individual alveolar areas were calculated using the ‘Analyze Particles’ function in FIJI. Alveolar areas for 10–15 20 X fields were combined to calculate the mean alveolar area for one animal. Scale bar, 50 μm.
Figure 3—figure supplement 2
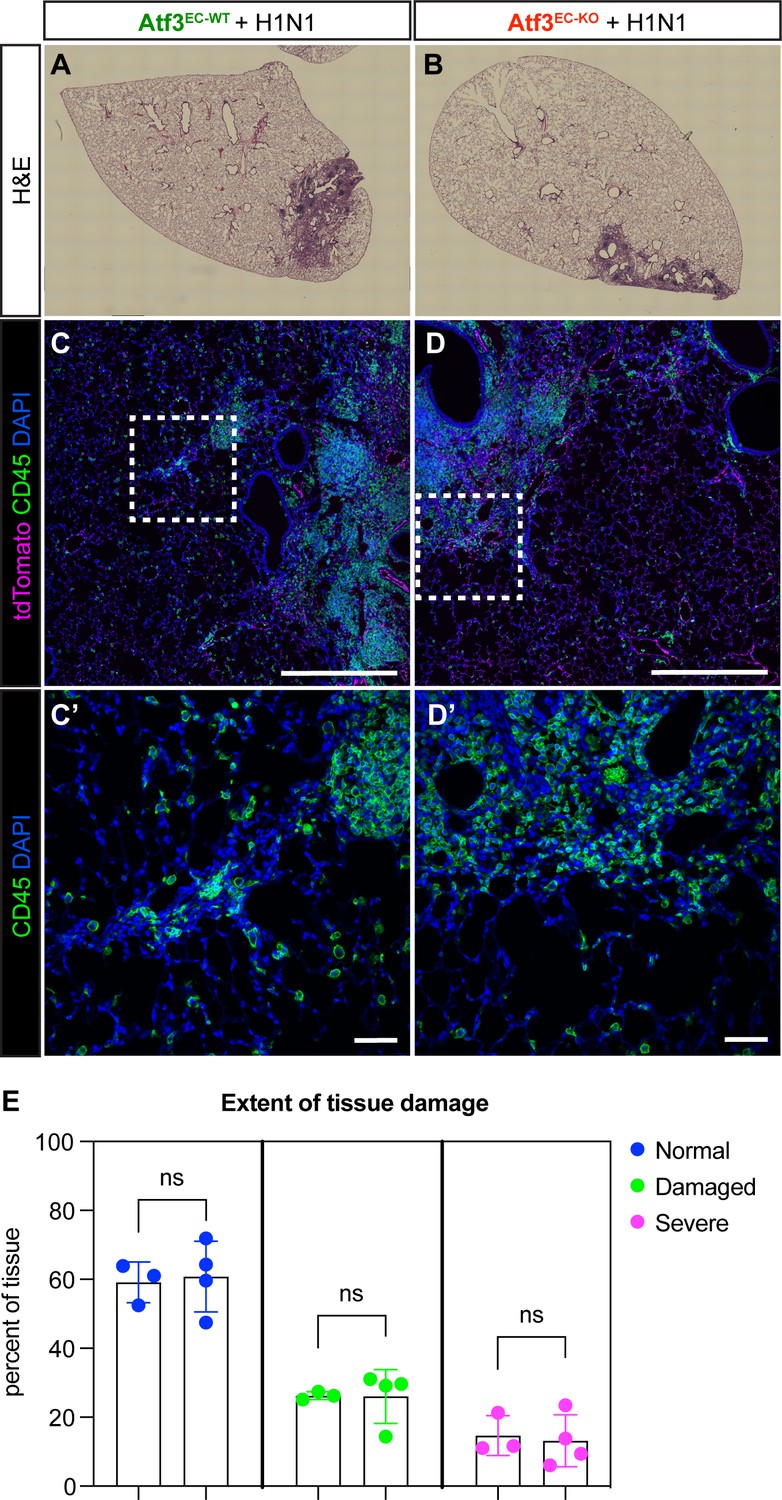
Atf3EC-WT and Atf3EC-KO animals have similar levels of tissue damage after influenza infection.
(A) Representative images of Atf3EC-WT and (B) Atf3EC-KO lung tissue at 21 days post influenza stained with hematoxylin and eosin (H&E) demonstrate areas of tissue damage caused by H1N1 infection in both genotypes. (C, C’) Immunofluorescence (IF) for tdTomato (endothelial cells) and CD45 (immune cells) shows inflammation in both Atf3EC-WT and (D, D’) Atf3EC-KO lung tissue. (E) Quantification of tissue damage using a k-means clustering algorithm Liberti et al., 2021 demonstrated a similar percentage of severe, damaged, and normal tissue structure in Atf3EC-WT and Atf3EC-KO lung tissue at 21 dpi. n=3 Atf3EC-WT and n=4 Atf3EC-KO animals analyzed. Error bars represent standard deviation (SD). ns, normal: p=0.809 by unpaired t-test. ns, damaged: p=0.400 by Mann-Whitney rank-sum test (F test found that variances were significantly different, so a t-test was not used). ns, severe: p=0.788 by unpaired t-test. Scale bars in (C), (D), 500 μm. Scale bars in (C’), (D’), 50 μm.
Figure 3—figure supplement 3
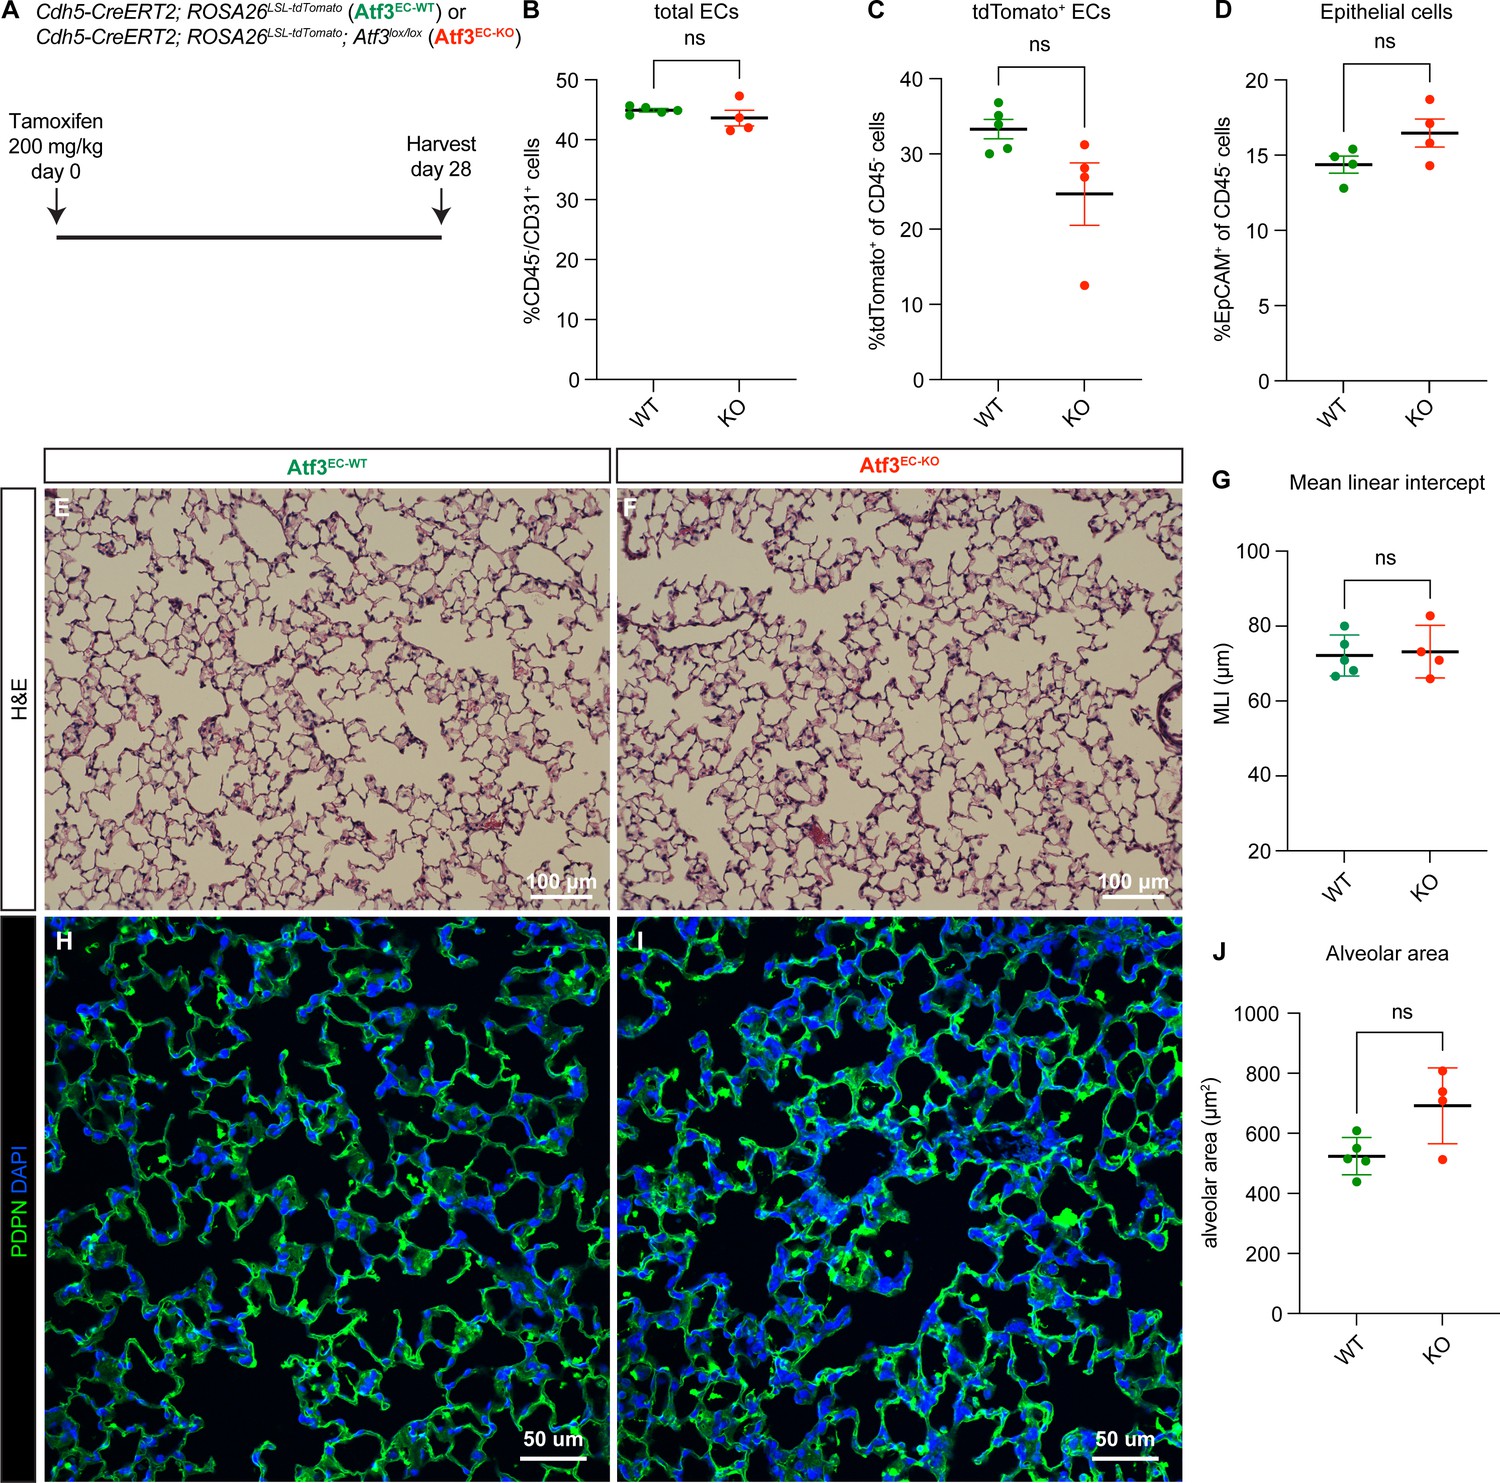
Endothelial loss of Atf3 at homeostasis does not cause defects in lung tissue structure or cell loss after 28 days.
(A) Schematic of the experimental setup. Cdh5-CreERT2; ROSA26LSL-tdTomato mice (Atf3EC-WT) and Cdh5-CreERT2; ROSA26LSL-tdTomato; Atf3lox/lox (Atf3EC-KO) mice were given tamoxifen at 200 mg/kg by oral gavage and harvested after 28 days. (B) There was no statistically significant difference between Atf3EC-WT and Atf3EC-KO mice in total endothelial cells (ECs) (CD45−/CD31+ cells). Error bars represent standard error of the mean (SEM). ns, p=0.2857 by Mann-Whitney rank-sum test. (C) There was no difference in tdTomato-positive ECs (CD45−/tdTomato+ cells) between Atf3EC-WT (n=5) and Atf3EC-KO (n=4) mice. Error bars represent standard error of the mean (SEM). ns, p=0.0635 by Mann-Whitney rank-sum test. (D) There was no difference in the percentage of epithelial cells (CD45−/EpCAM+ cells) between Atf3EC-WT and Atf3EC-KO mice. Error bars represent standard error of the mean (SEM). ns, p=0.2 by Mann-Whitney rank-sum test. (E) Representative lung tissue section from an Atf3EC-WT mouse, stained with hematoxylin and eosin. (F) Representative lung tissue section from an Atf3EC-KO mouse, stained with hematoxylin and eosin. (G) The mean linear intercept in Atf3EC-WT and Atf3EC-KO mice at 28 days post-tamoxifen was indistinguishable. Error bars represent standard deviation (SD). ns, p>0.9999 by Mann-Whitney rank-sum test. (H) Representative lung tissue section from an Atf3EC-WT mouse with IF for podoplanin (PDPN). (I) Representative lung tissue section from an Atf3EC-KO mouse with IF for PDPN. (J) There was no significant difference in alveolar area between Atf3EC-WT and Atf3EC-KO mice at 28 days post tamoxifen. Error bars represent standard deviation (SD). ns, p=0.1111 by Mann-Whitney rank-sum test. Scale bars in (E), (F), 100 μm. Scale bars in (H), (I), 50 μm.
Figure 3—figure supplement 4
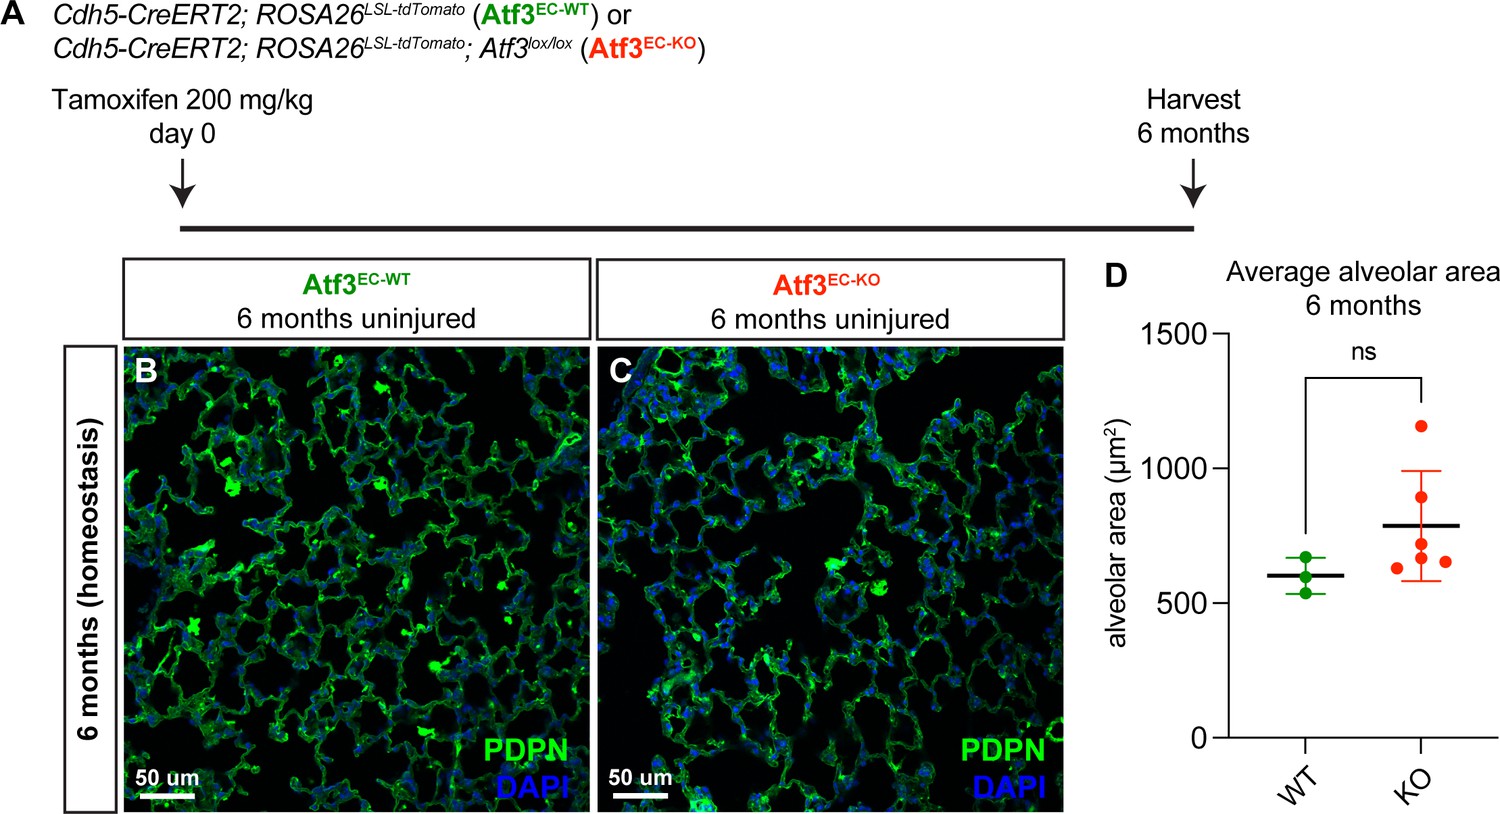
Loss of endothelial Atf3 at homeostasis does not cause tissue structure defects after 6 months.
(A) Schematic of the experimental setup. Cdh5-CreERT2; ROSA26LSL-tdTomato mice (Atf3EC-WT) and Cdh5-CreERT2; ROSA26LSL-tdTomato; Atf3lox/lox (Atf3EC-KO) mice were given 200 mg/kg tamoxifen by oral gavage and harvested after 6 months. (B) Representative image from lung tissue section of an Atf3EC-WT mouse. The AT1 cell marker podoplanin (PDPN) was used to visualize alveolar structure across the tissue. (C) Representative lung tissue section from an Atf3EC-KO mouse with immunofluorescence (IF) for PDPN. (D) Average alveolar area was not significantly different between Atf3EC-WT (n=3) and Atf3EC-KO (n=6) mice at 6 months post-tamoxifen. Error bars represent standard deviation (SD). ns, p=0.1667 by Mann-Whitney rank-sum test. Scale bars, 50 μm.
Figure 4 with 1 supplement

Transcriptional changes due to loss of Atf3 after acute influenza injury.
(A) Schematic of the experimental setup. Cdh5-CreERT2; ROSA26LSL-tdTomato (Atf3EC-WT, n=4) and Cdh5-CreERT2; ROSA26LSL-tdTomato; Atf3lox/lox (Atf3EC-KO, n=3) adult mice received 200 mg/kg tamoxifen by oral gavage 2 weeks before H1N1 influenza injury. At 14 dpi, endothelial cells (ECs) were isolated from WT and KO mice using FACS for tdTomato-positive cells. (B) Principal components analysis demonstrates that the expression of Atf3 defines a majority of the total variance in the dataset. (C) Loss of Atf3 expression in ECs results in more downregulated genes than upregulated genes. Downregulated genes include transcription factors, cytoskeletal genes, and members of the Fgf, Wnt, and Notch signaling pathways. Upregulated genes include members of the Tnf family of cytokines, the Wnt inhibitor Wif1, and Tgfb2. (D) Volcano plot highlighting significantly upregulated and downregulated genes in Atf3EC-KO compared to Atf3EC-WT animals.
Figure 4—figure supplement 1
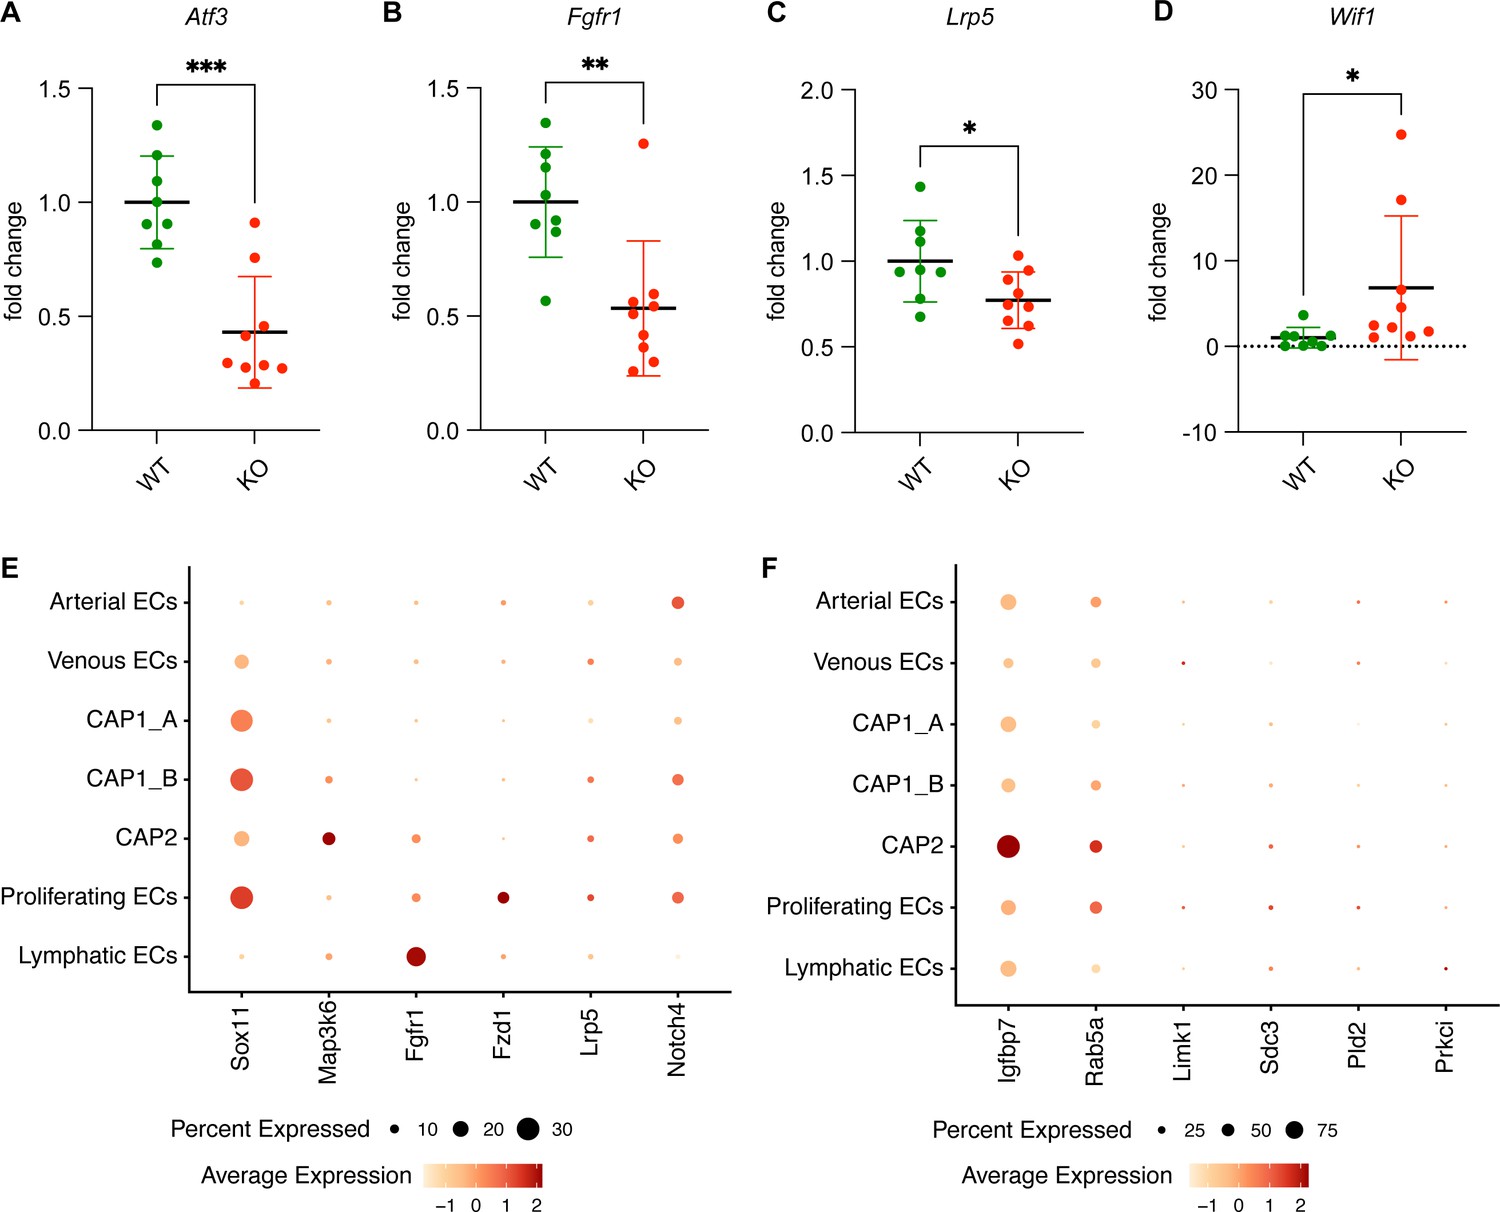
qRT-PCR for expression of Atf3 and downstream genes in Atf3EC-WT and Atf3EC-KO animals.
(A) qRT-PCR for Atf3 demonstrates lower expression in Atf3EC-KO (n=9) compared to Atf3EC-WT (n=8) mouse lung endothelial cells. Genes shown to be downregulated by RNA sequencing also show lower expression by qRT-PCR, including (B) Fgfr1 and (C) Lrp5. (D) Wif1, or Wnt inhibitory factor 1, is upregulated in Atf3EC-KO compared to Atf3EC-WT mouse lung endothelial cells by qRT-PCR. Error bars in (A-D) represent standard deviation (SD). (E, F) To place the RNA sequencing results into the context of endothelial heterogeneity, the expression of several genes shown to be downregulated in Atf3EC-KO mouse lung endothelial cells by RNA sequencing was examined in the H1N1 mouse lung scRNA-seq dataset. Multiple genes, including Lrp5 and Notch4, are more highly expressed in CAP1_B ECs than in CAP1_A ECs. However, because of the relatively low sequencing depth of scRNA-seq compared to bulk RNA-seq, many of the transcripts examined were only present in a small percentage of endothelial cells in the single-cell RNA sequencing (scRNA-seq) dataset.
Figure 5 with 3 supplements

Endothelial loss of Atf3 causes alveolar endothelial cell loss corresponding to regions of altered alveolar architecture.
(A) Immunofluorescence (IF) for tdTomato (magenta) and DAPI (blue) at 14 days post-H1N1 shows an expected distribution of tdTomato+ ECs throughout the alveolar space in Atf3EC-WT animals. (A’) Higher magnification image of the area within the white box in (A) shows IF for the endothelial marker ERG (white). (A’’) Higher magnification image of the area within the white box in (A) shows IF for tdTomato (magenta). (B) Atf3EC-KO mice at 14 dpi demonstrate heterogeneous loss of tdTomato+ endothelial cells (ECs). Regions with increased alveolar area correlate with regions devoid of tdTomato+ cells (yellow dotted lines). (B’) Higher magnification image of the area within the white box in (B) shows IF for the endothelial marker ERG (white). Yellow arrows indicate the few remaining ERG+ ECs. (B’’) Higher magnification image of the area within the white box in (B) showing IF for tdtomato (magenta). Yellow arrows indicate the few remaining tdTomato+ ECs. (C) At 14 days post-H1N1, Atf3EC-KO mice (n=5) show a significant decrease in tdTomato-expressing cells, indicating a loss of ECs, compared to PBS-treated (n=3) or H1N1-treated (n=6) Atf3EC-WT mice. Error bars represent standard deviation (SD). *p=0.0447 using Dunn’s multiple comparisons test following a Kruskal-Wallis test (p=0.0008). Scale bars, 50 μm.
Figure 5—figure supplement 1
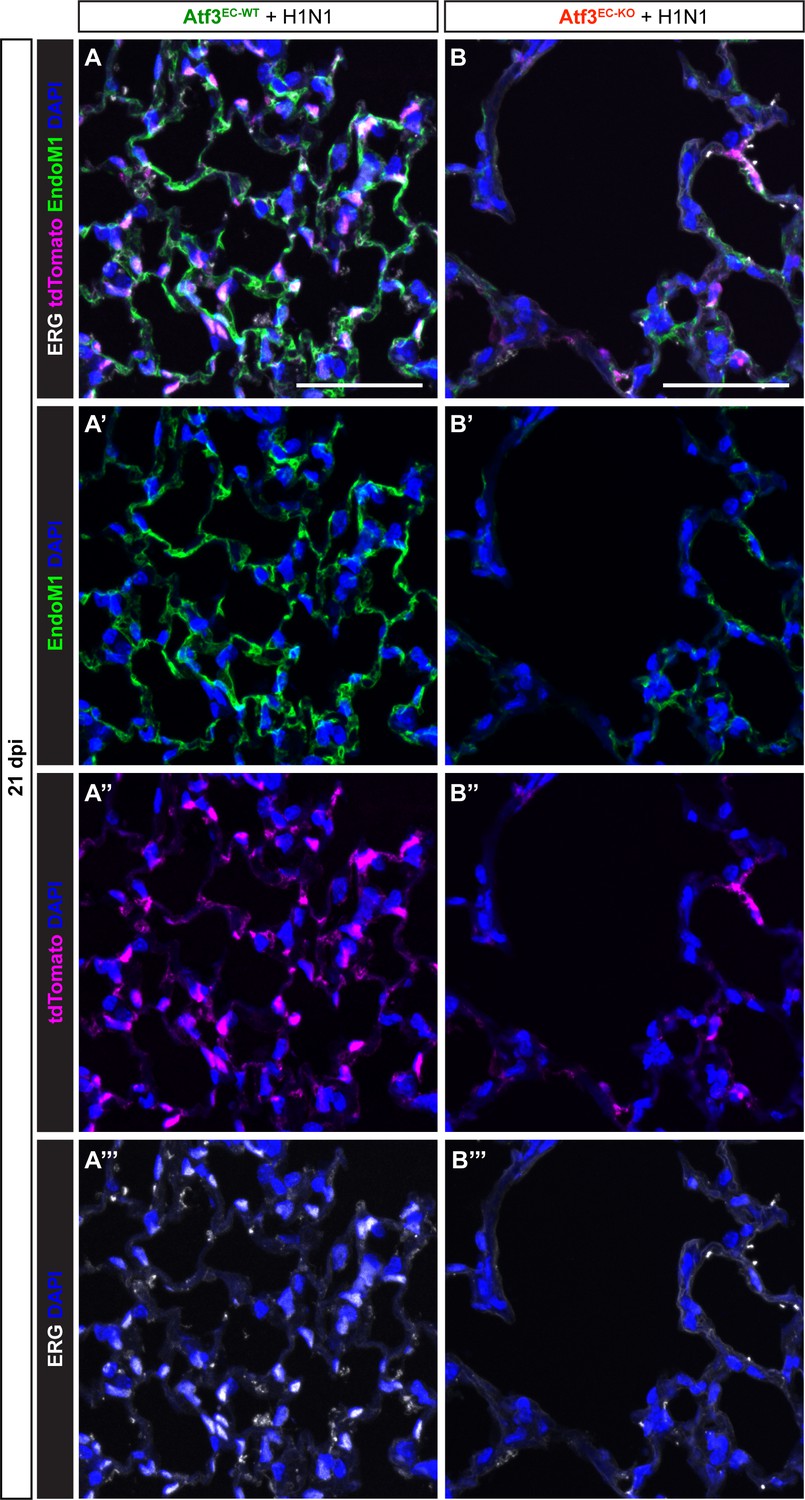
Endothelial cell loss in regions of altered alveolar architecture persists at 21 days post-H1N1.
(A) Representative image of lung tissue from an Atf3EC-WT mouse at 21 dpi with immunofluorescence (IF) for (A’) cytoplasmic endothelial marker Endomucin-1 (EndoM1, green), (A’’) tdTomato (magenta), and (A’’’) nuclear endothelial cell marker ERG (white). (B) Representative image of lung tissue from an Atf3EC-KO mouse at 21 dpi with IF for (B’) cytoplasmic endothelial marker Endomucin-1 (EndoM1, green), (B’’) tdTomato (magenta), and (B’’’) nuclear endothelial cell marker ERG (white) demonstrate loss of endothelial cells corresponding to a region of the increased alveolar area. Scale bars, 50 μm.
Figure 5—figure supplement 2
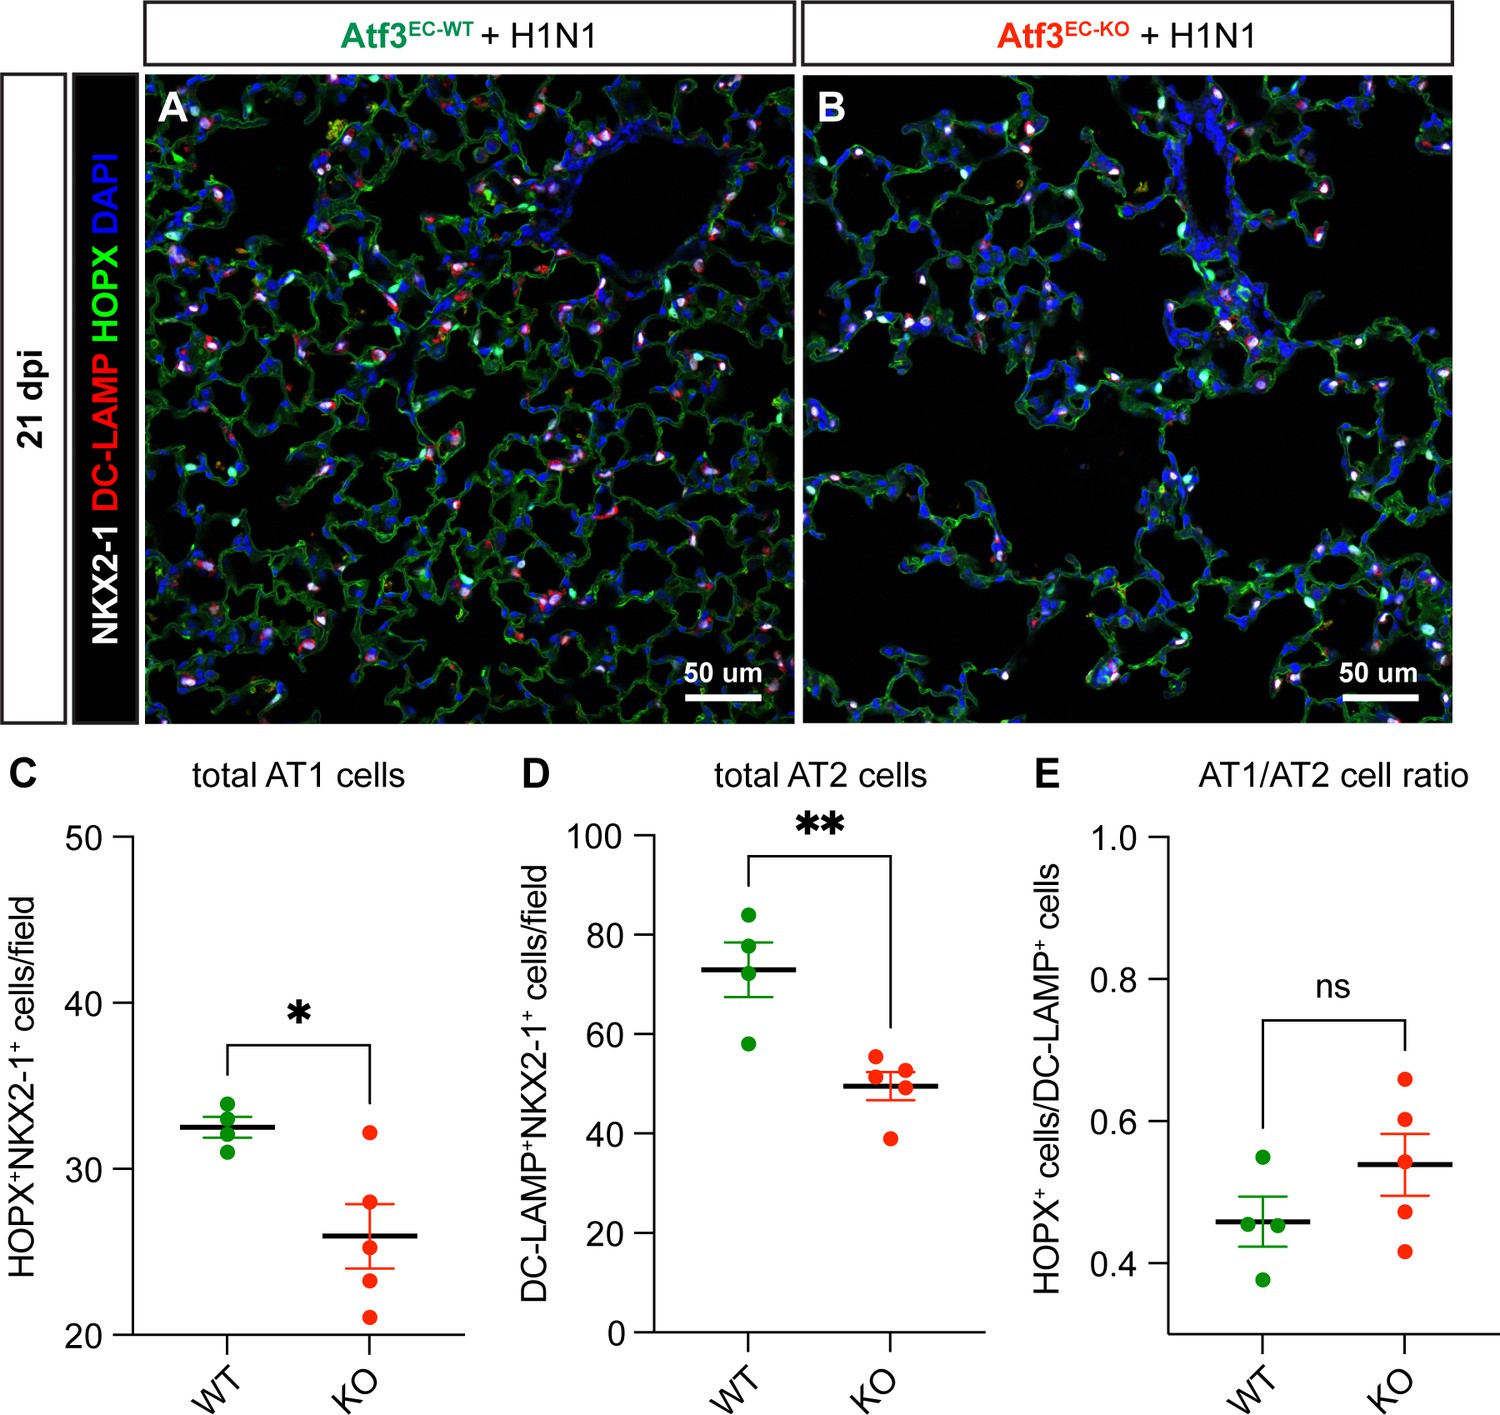
Endothelial loss of Atf3 leads to loss of alveolar epithelial type 1 (AT1) and AT2 cells but not alteration in AT2-AT1 differentiation.
(A) Representative image from lung tissue section of an Atf3EC-WT mouse at 21 dpi. Immunofluorescence (IF) analysis was performed for the pan-epithelial marker NKX2-1 (white), the AT2 cell marker DC-LAMP (red), the AT1 cell marker HOPX (green), and the nuclear marker DAPI (blue). (B) Representative image from lung tissue section of an Atf3EC-KO mouse with IF as in (A). (C) The total number of AT1 cells, calculated as HOPX+NKX2-1+ cells per 20 x field, is significantly decreased in Atf3EC-KO animals (n=5) compared to Atf3EC-WT animals (n=4). *p=0.023 by unpaired t-test. (D) The total number of AT2 cells, calculated as DC-LAMP+NKX2-1+ cells per 20 x field, is significantly decreased in Atf3EC-KO animals. **p=0.0051 by unpaired t-test. (E) However, the AT1/AT2 cell ratio is not significantly different in Atf3EC-KO compared to Atf3EC-WT animals. ns, p=0.2130 by unpaired t-test. Error bars in (C-E) represent standard error of the mean (SEM). Scale bars, 50 μm.
Figure 5—figure supplement 3
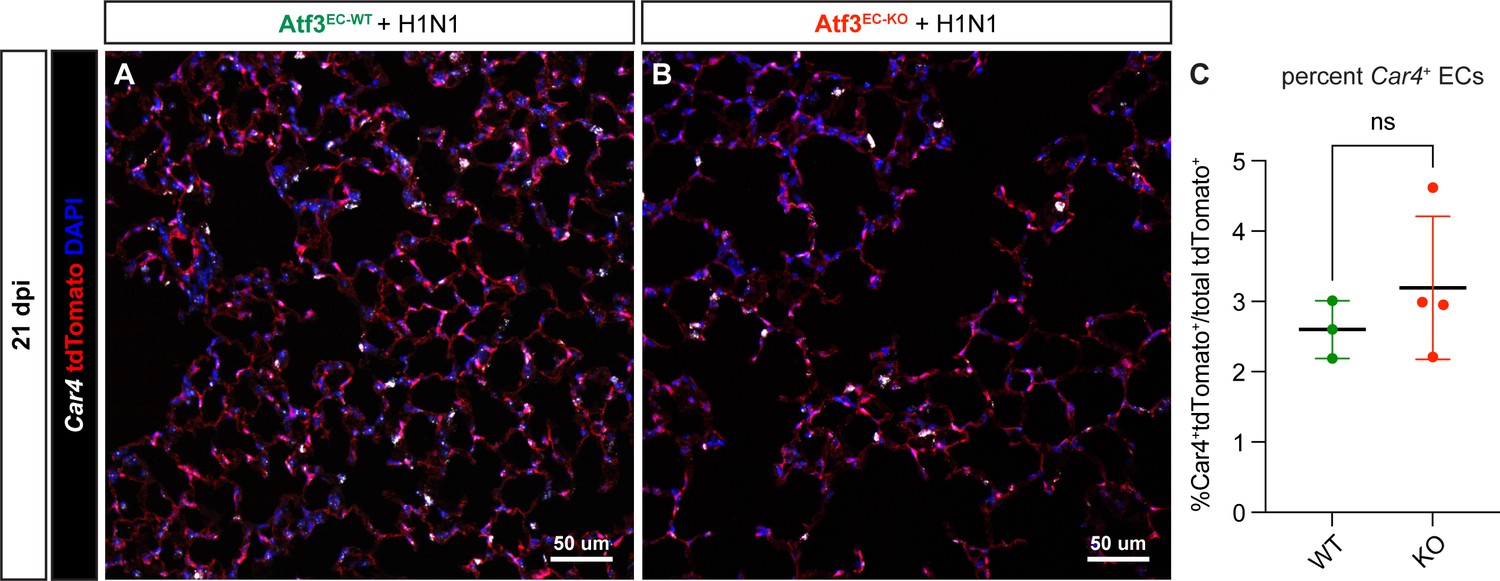
Endothelial loss of Atf3 does not impair CAP1-CAP2 differentiation.
(A) Representative image from lung tissue section of an Atf3EC-WT mouse at 21 dpi. RNAscope was performed for the CAP2 marker Car4 (white), and IF analysis was performed for tdTomato (red) and the nuclear marker DAPI (blue). (B) Representative image from lung tissue section of an Atf3EC-KO mouse with RNAscope and immunofluorescence (IF) as in (A). (C) Quantification of the percentage of CAP2s (Car4+tdTomato+ double-positive cells) as a function of total (tdTomato+) endothelial cells (ECs) shows that loss of Atf3 in ECs in Atf3EC-KO animals (n=4) does not diminish the percentage of CAP2s compared to Atf3EC-WT animals (n=3). Error bars represent standard deviation (SD). ns, p=0.6286 by Mann-Whitney rank-sum test. Scale bars, 50 μm.
Figure 6

Atf3 loss in endothelial cells (ECs) impairs the regenerative response to H1N1.
(A) Compared to Atf3EC-WT mice (n=4), Atf3EC-KO mice (n=4) have significantly decreased EC proliferation (%CD31+/EdU+ of CD45- cells) between 7–14 dpi. Error bars represent standard deviation (SD). *p=0.0377 by unpaired t-test. (B) Compared to Atf3EC-WT mice (n=4), Atf3EC-KO mice (n=5) have significantly decreased EC proliferation (%CD31+/EdU+ of CD45- cells) between 14–21 dpi, the time period during which EC proliferation peaks after H1N1. Error bars represent standard error of the mean (SEM). *p=0.0177 by unpaired t-test. (C) Compared to Atf3EC-WT mice (n=4), Atf3EC-KO mice (n=5) demonstrate significantly increased EC apoptosis as measured by cleaved caspase-3+/tdTomato+ endothelial cells as a fraction of all tdTomato+ ECs. Error bars represent standard error of the mean (SEM). **p=0.0045 by unpaired t-test. (D) Relatively few cleaved caspase-3+/tdTomato+ apoptotic ECs (yellow arrow) are visible in lung tissue of Atf3EC-WT mice at 14 dpi. (E) In contrast, many of the tdTomato+ ECs in Atf3EC-KO mice are cleaved caspase-3+ (yellow arrows). Scale bars in (D), (E), 50 μm.
Figure 7
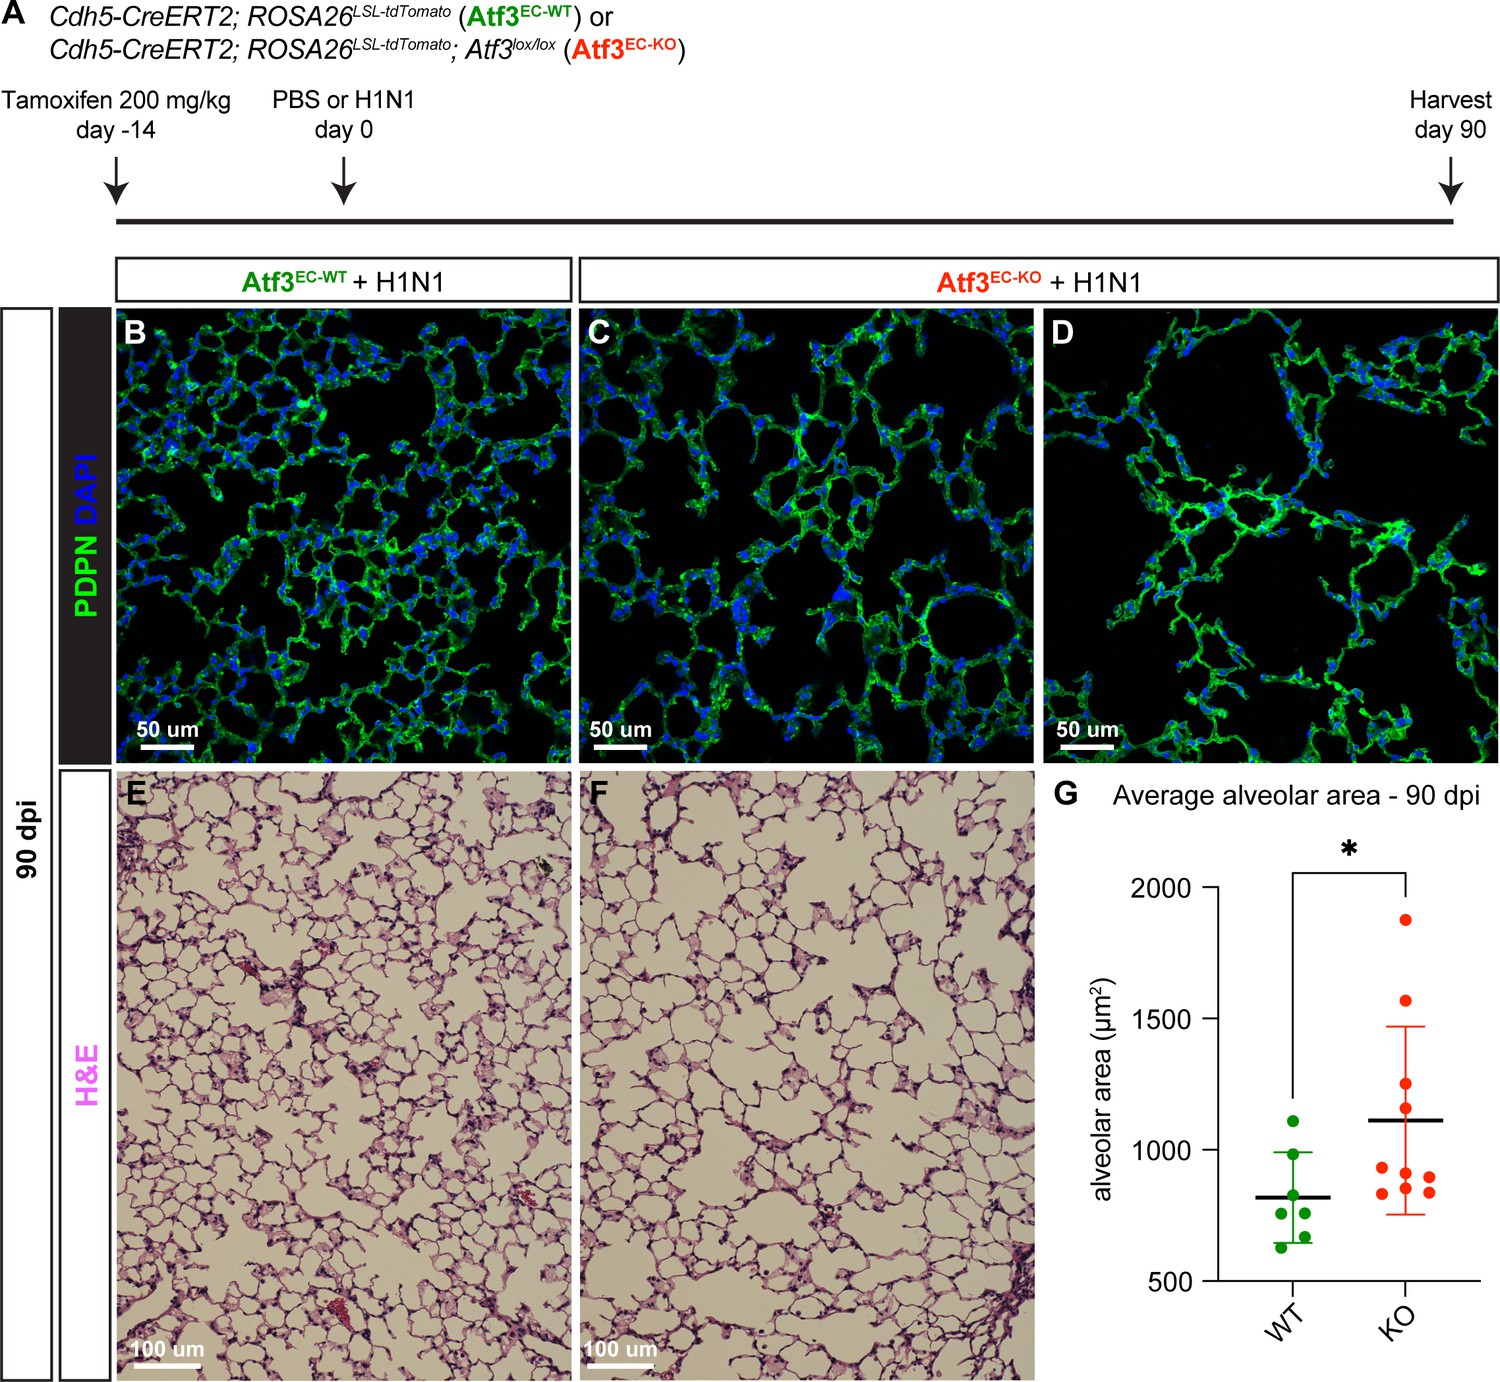
Loss of Atf3 in endothelial cells (ECs) impairs long-term alveolar tissue regeneration.
(A) Schematic of the experimental setup. Cdh5-CreERT2; ROSA26LSL-tdTomato (Atf3EC-WT) and Cdh5-CreERT2; ROSA26LSL-tdTomato; Atf3lox/lox (Atf3EC-KO) adult mice received 200 mg/kg tamoxifen by oral gavage 2 weeks before H1N1 influenza injury. At 90 dpi, lung tissue from WT and KO mice was collected for immunofluorescence (IF) analysis. (B) Representative image of an Atf3EC-WT mouse lung at 90 days post-H1N1 infection. The AT1 cell marker podoplanin (PDPN) was used to visualize alveolar structure across the tissue. (C) Representative image of an Atf3EC-KO mouse lung at 90 dpi demonstrates that loss of alveolar structure persists through regeneration. (D) Although the lung tissue of several Atf3EC-KO animals appeared as in (C), several had more extreme defects, with almost total loss of normal alveolar structure. (E) Representative lung tissue section of an Atf3EC-WT mouse at 90 days post-H1N1 infection, stained with hematoxylin and eosin. (F) Representative image of an Atf3EC-KO mouse lung at 90 dpi, stained with hematoxylin and eosin. (G) Mice with endothelial Atf3 knockout (n=10) have significantly increased alveolar area at 90 dpi compared to WT mice (n=7). *p=0.025 by Mann-Whitney rank-sum test. Scale bars in (B), (C), (D), 50 μm. Scale bars in (E), (F), 100 μm.
Tables
Key resources table
| Reagent type (species) or resource | Designation | Source or reference | Identifiers | Additional information |
|---|---|---|---|---|
| Strain, strain background (Mus musculus, male and female) | Atf3tm1.1(cre/ERT2)Msra (Atf3CreERT2) | Matt Ramer | MGI: 6360893 | PMID:26610346 |
| Strain, strain background (Mus musculus, male and female) | C57BL/6-Tg(Cdh5-cre/ERT2)1Rha (Cdh5CreERT2) | Taconic | 13073, MGI: 3848982 | PMID:19144989 |
| Strain, strain background (Mus musculus, male and female) | Gt(ROSA)26Sortm14(CAG-tdTomato)Hze (ROSA26LSL-tdTomato) | Jackson Laboratory | 007914, MGI: 3809524 | PMID:20023653 |
| Strain, strain background (Mus musculus, male and female) | Atf3tm1.1Hai (Atf3lox) | Tsonwin Hai | MGI: 5547956 | PMID:23921126 |
| Antibody | tdTomato (goat polyclonal) | Origene | AB8181-200 | 1:50 |
| Antibody | RFP (DsRed) (rabbit polyclonal) | Rockland | 600-401-379, RRID:AB_2209751 | 1:50 |
| Antibody | ERG (mouse monoclonal) | Abcam | ab214341 | 1:100 |
| Antibody | ERG (rabbit monoclonal) | Abcam | ab92513 RRID:AB_2630401 | 1:100 |
| Antibody | Endomucin-1 (goat polyclonal) | R&D Systems | AF4666 RRID:AB_2100035 | 1:500 |
| Antibody | LAMP3 (rat monoclonal) | Novus Biologicals | DDX0191P-100 RRID:AB_2827532 | 1:100 |
| Antibody | HOPX (mouse monoclonal) | Santa Cruz Biotechnology | sc-398703 RRID:AB_2687966 | 1:100 |
| Antibody | NKX2-1 (TTF1) (rabbit monoclonal) | Abcam | ab76013 RRID:AB_1310784 | 1:50 |
| Antibody | PDPN (mouse monoclonal) | Abcam | ab10288 RRID:AB_297027 | 1:100 |
| Antibody | CD45-PerCP-Cy5.5 (rat monoclonal) | Thermo Fisher | 45-0451-82 RRID:AB_1107002 | 1:200 |
| Antibody | CD31-PE-Cy7 (rat monoclonal) | Thermo Fisher | 25-0311-82 RRID:AB_2716949 | 1:100 |
| Chemical compound, drug | PR8-GP33 H1N1 influenza | Dr. E. John Wherry | PMID:23516357 | |
| Chemical compound, drug | Tamoxifen | Sigma-Aldrich | T5648 | |
| Commercial assay or kit | Click-iT Plus EdU Alexa Fluor 488 Flow Cytometry Assay Kit | Thermo Fisher | C10632 | |
| Commercial assay or kit | RNAscope Fluorescent Multiplex Reagent Kit v2 | ACD | 323100 | |
| Commercial assay or kit | PureLink RNA Micro Kit | Thermo Fisher | 12183–016 | |
| Commercial assay or kit | Bioanalyzer High Sensitivity RNA Pico Kit | Agilent | 5067–1513 | |
| Commercial assay or kit | NEBNext Single Cell/Low Input RNA Library Prep Kit for Illumina | New England Biolabs | E6420 | |
| Commercial assay or kit | Bioanalyzer High Sensitivity DNA Kit | Agilent | 5067–4626 | |
| Other | RNAscope probe mm-Car4-C3 | ACD | 468421-C3 | Probe to detect Car4 RNA; see Figure 5—figure supplement 3 and Materials and methods: RNAscope analysis |
| Other | RNAscope probe mm-Pdgfra-C2 | ACD | 480661-C2 | Probe to detect Pdgfra RNA; see Figure 2—figure supplement 2 and Materials and methods: RNAscope analysis |
Additional files
Download links
A two-part list of links to download the article, or parts of the article, in various formats.
Downloads (link to download the article as PDF)
Open citations (links to open the citations from this article in various online reference manager services)
Cite this article (links to download the citations from this article in formats compatible with various reference manager tools)
Atf3 defines a population of pulmonary endothelial cells essential for lung regeneration
eLife 12:e83835.
https://doi.org/10.7554/eLife.83835


