High-grade serous ovarian carcinoma organoids as models of chromosomal instability
- Cancer Research UK Cambridge Institute, University of Cambridge, Li Ka Shing Centre, United Kingdom
- The MRC Weatherall Institute of Molecular Medicine, United Kingdom
- Centro Nacional de Investigaciones Oncológicas, C/Melchor Fernández Almagro, Spain
Figures
Figure 1 with 7 supplements
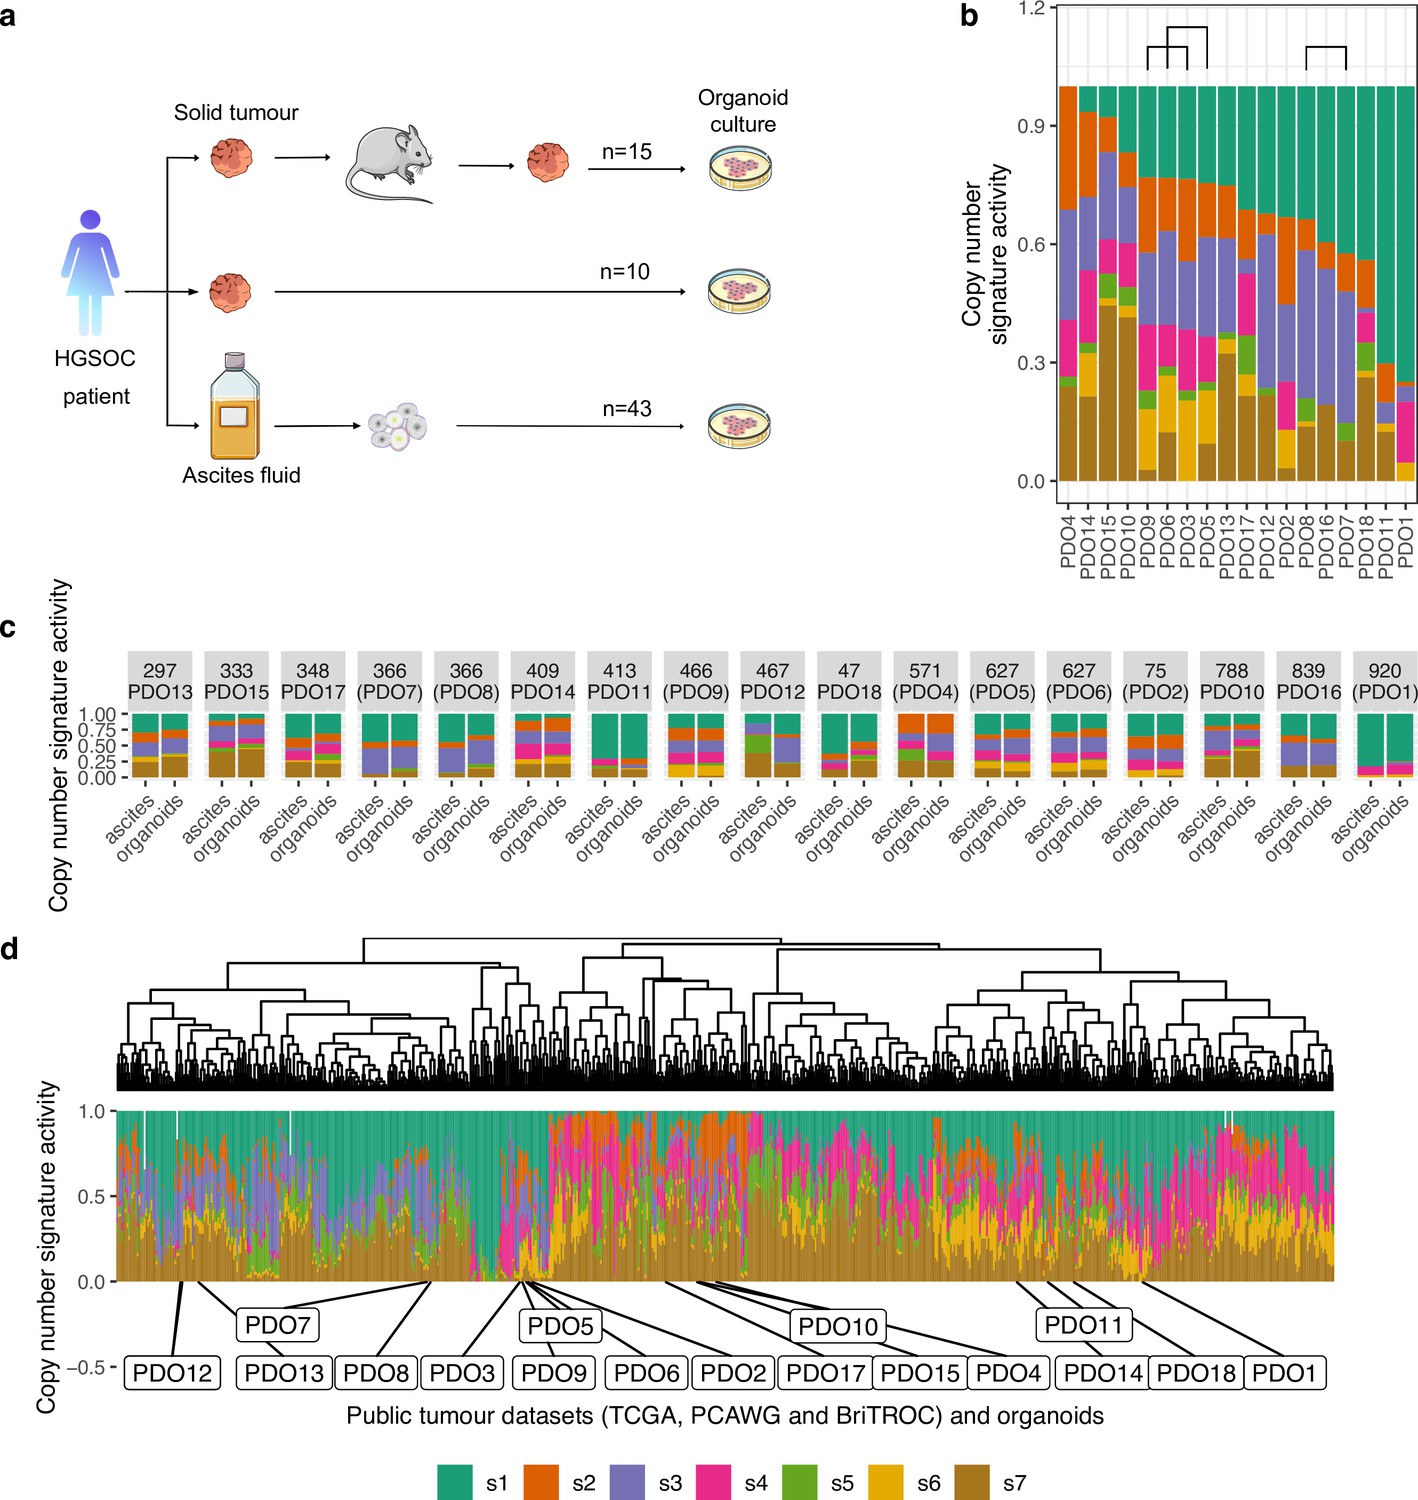
Chromosomal instability features of patient-derived organoids (PDOs).
(a) Schematic of the sample collection workflow used in this study. (b) Stacked bar plots show copy number signature activities ranked by signature s1 (PDO16, PDO17, and PDO18 were not continuous models). Brackets indicate PDOs derived from the same individual. (c) Stacked bar plots show copy number signature activities for organoids and the matched ascites sample from which they were derived. (d) Unsupervised hierarchical clustering of copy number signature for PDO and 692 high-grade serous ovarian carcinoma (HGSOC) cases using Aitchison’s distance with complete linkage function. Stacked barplots in the lower panel show copy number signature activities.
Figure 1—figure supplement 1
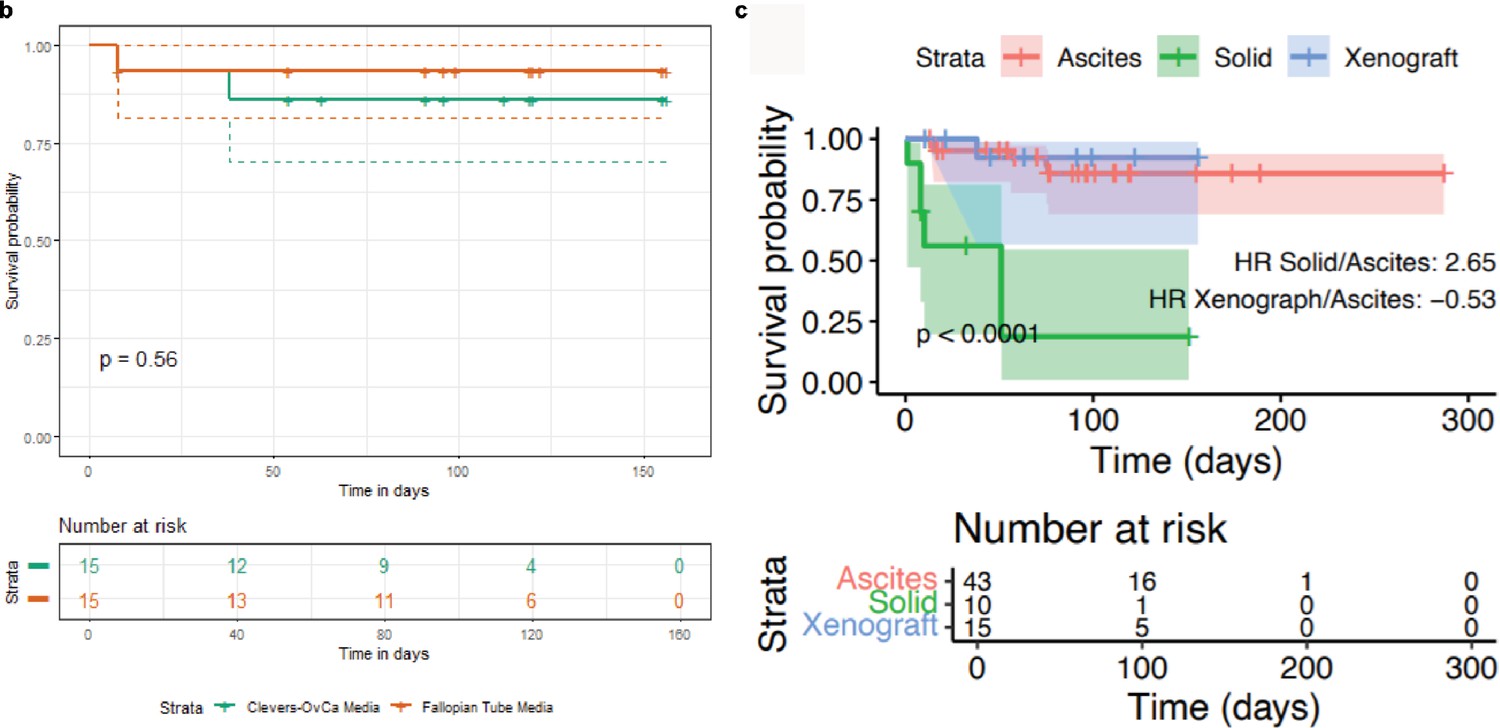
Organoid survival analysis.
(a) Survival analysis based on the type of media used to grow organoids. Two media were tested: a formulation used in the Clevers lab for growing ovarian cancer tissues and a formulation used to grow fallopian tube tissue in the Meyers’s lab. p-value was derived from the log-rank test. (b) Kaplan-Meier survival curves showing the association between the type of tissue sample used for organoid derivation and survival of cultures. Survival probability is displayed as a function of time in days. Shading indicates the 95% confidence interval for each group. Hazard ratio and p-value were obtained from a log-rank test. Crosses correspond to censored observations.
Figure 1—figure supplement 2
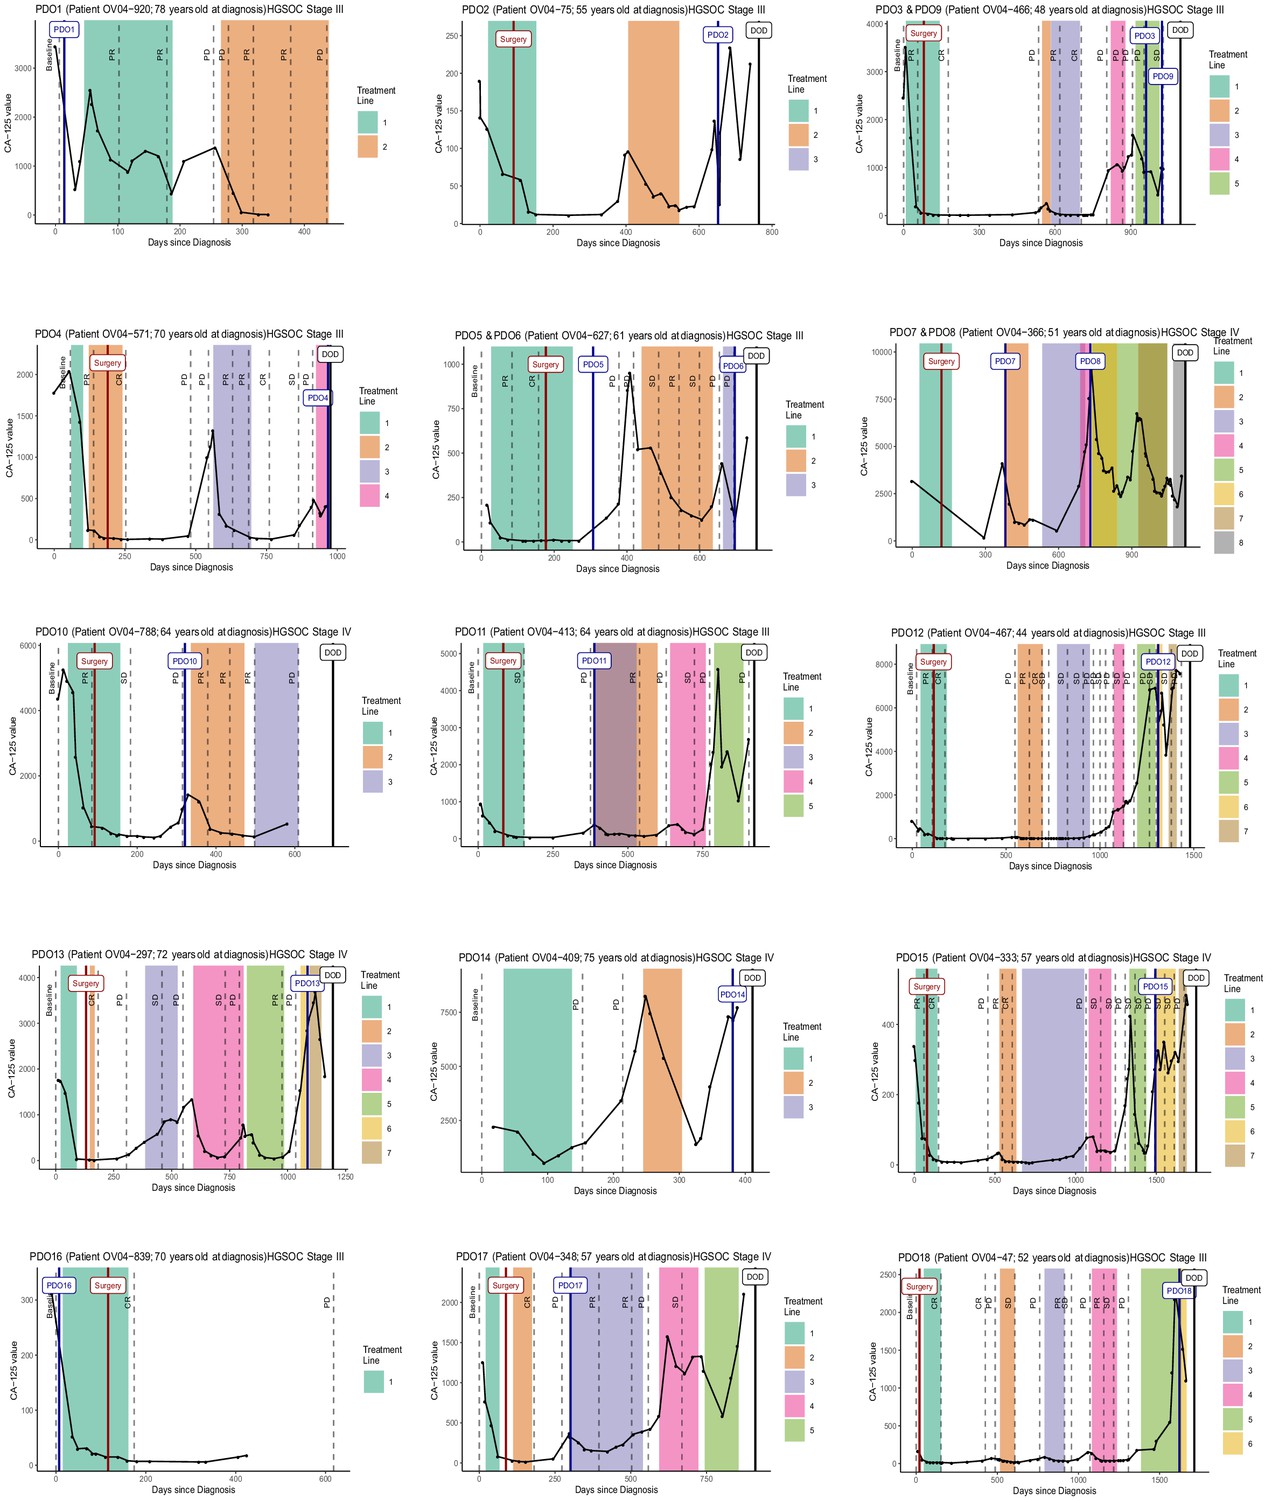
Clinical data.
Patient timeline summarising clinical data: CA125 levels, chemotherapy regimens, and computerized tomography (CT) scans. CT scan outcomes are represented as follows: Baseline as the first scan before treatment, PR as partial response, CR as complete response, SD as stable disease, and PD as progressive disease. Treatment lines are represented in different colors (information on the specific treatment regimens is available in Supplementary file 1) and the patient date of death is shown as DOD. Date of ascites collection for organoid derivation is shown with the name of the organoid.
Figure 1—figure supplement 3
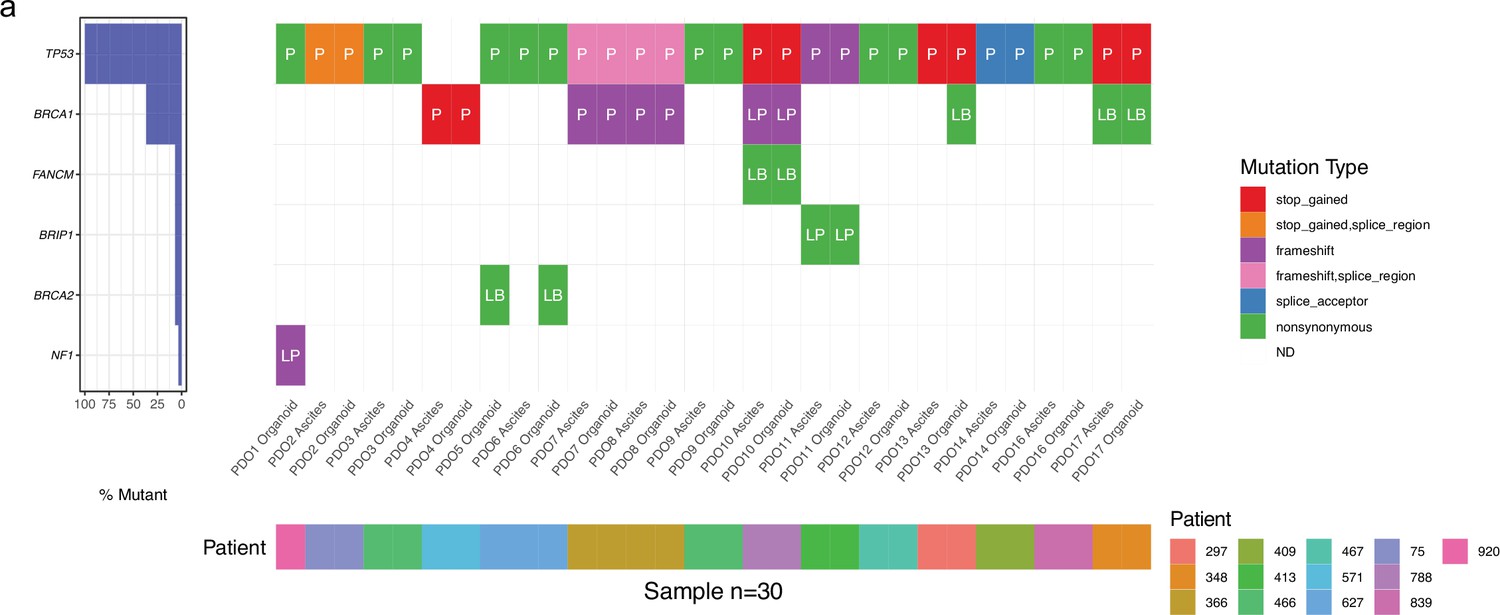
Mutation analysis of patient-derived organoid (PDO) and patient samples.
(a) Plot showing the percentage of mutations found within each gene across all samples (b) Oncoplot showing mutation status on a specific gene panel. P represents pathogenic mutation, LP - likely-pathogenic, and LB - likely-benign.
Figure 1—figure supplement 4
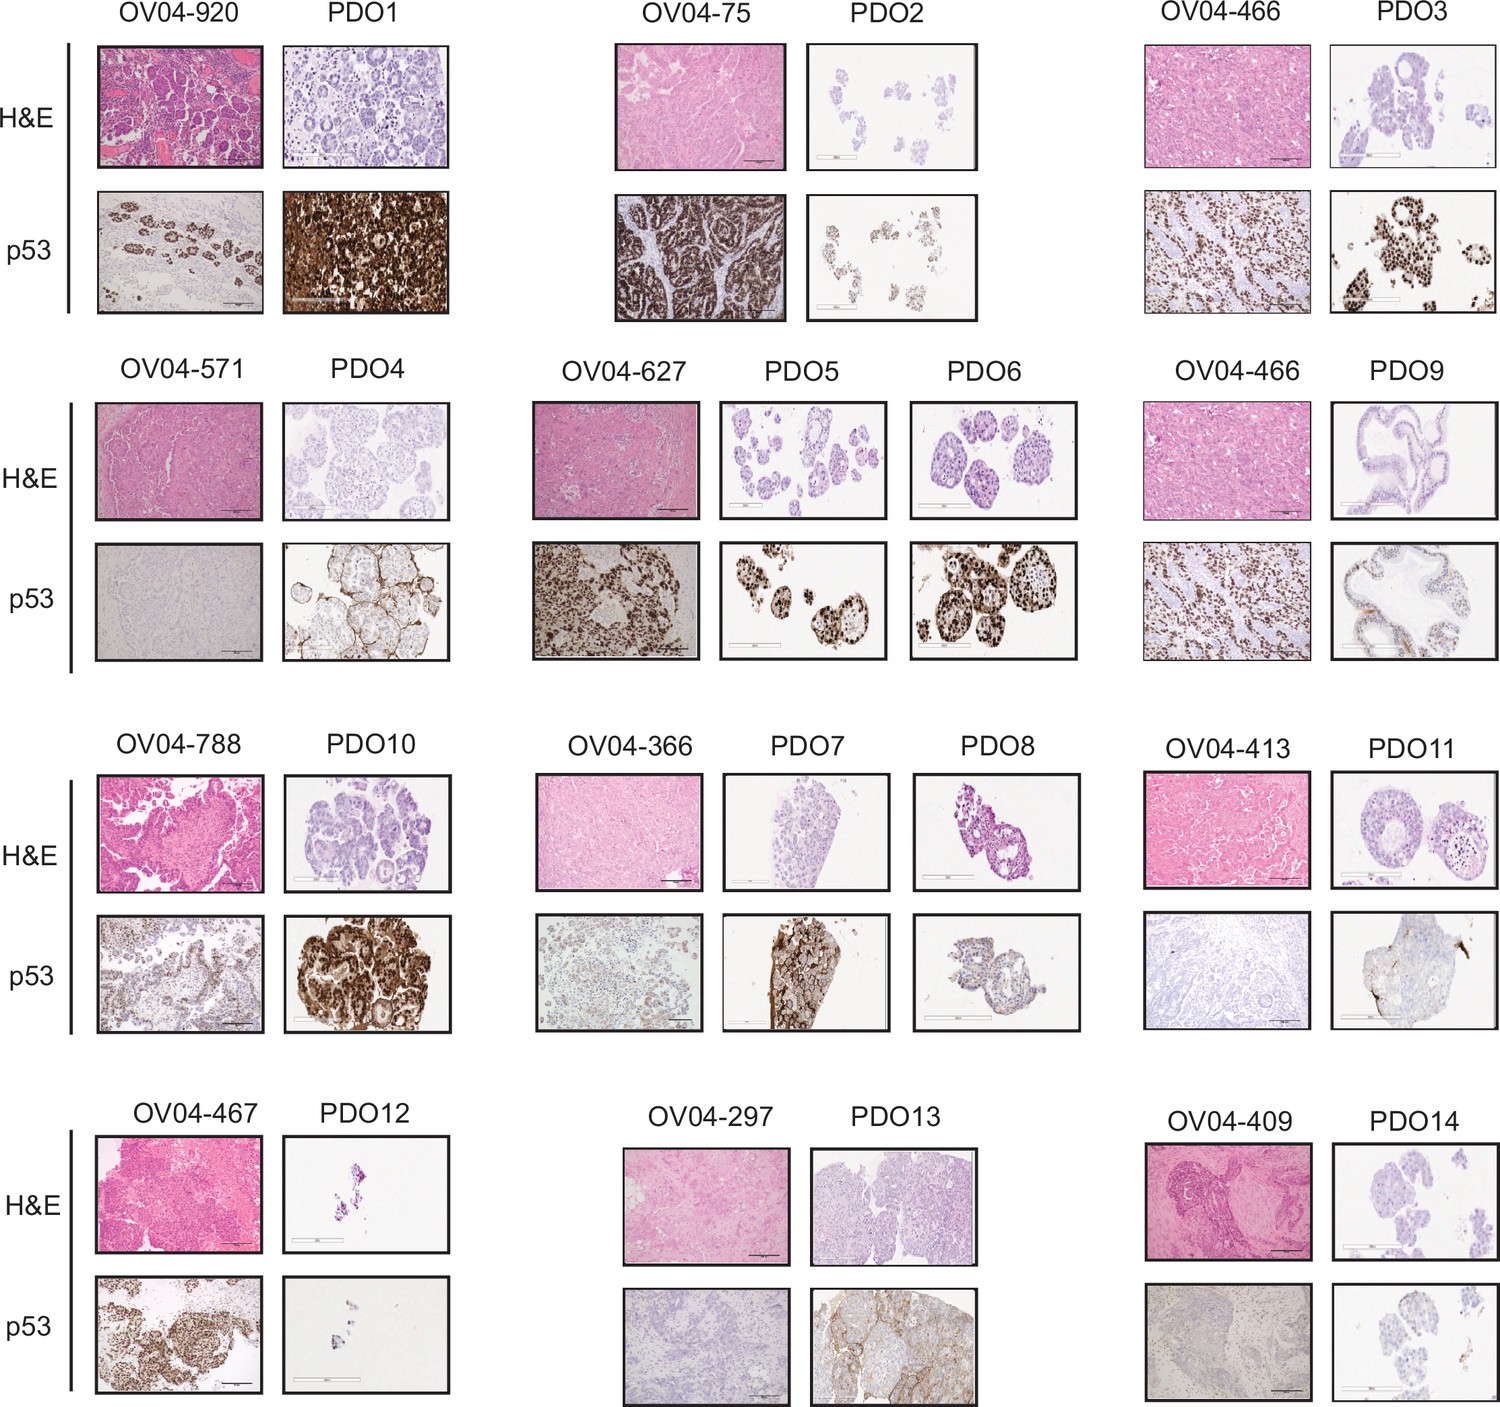
Tissue and patient-derived organoids (PDOs) morphological structures and p53 status.
Tissue and PDO sections were both Hematoxylin and Eosin and p53 stained. High grade serous ovarian carcinoma tissues contain specific structures that PDOs mimicked (e.g. PDO1 showing glandular and micropapillary growth patterns). The mutant p53 prevalence observed in high-grade serous ovarian carcinoma (HGSOC) patients was reflected in the organoids with only one model displaying wild-type p53 expression patterns, some with no expression and most of them with intense nuclear staining. Microscope lens with 20x magnification was used for both tissues and organoids. Scale bars = 200 µm.
Figure 1—figure supplement 5
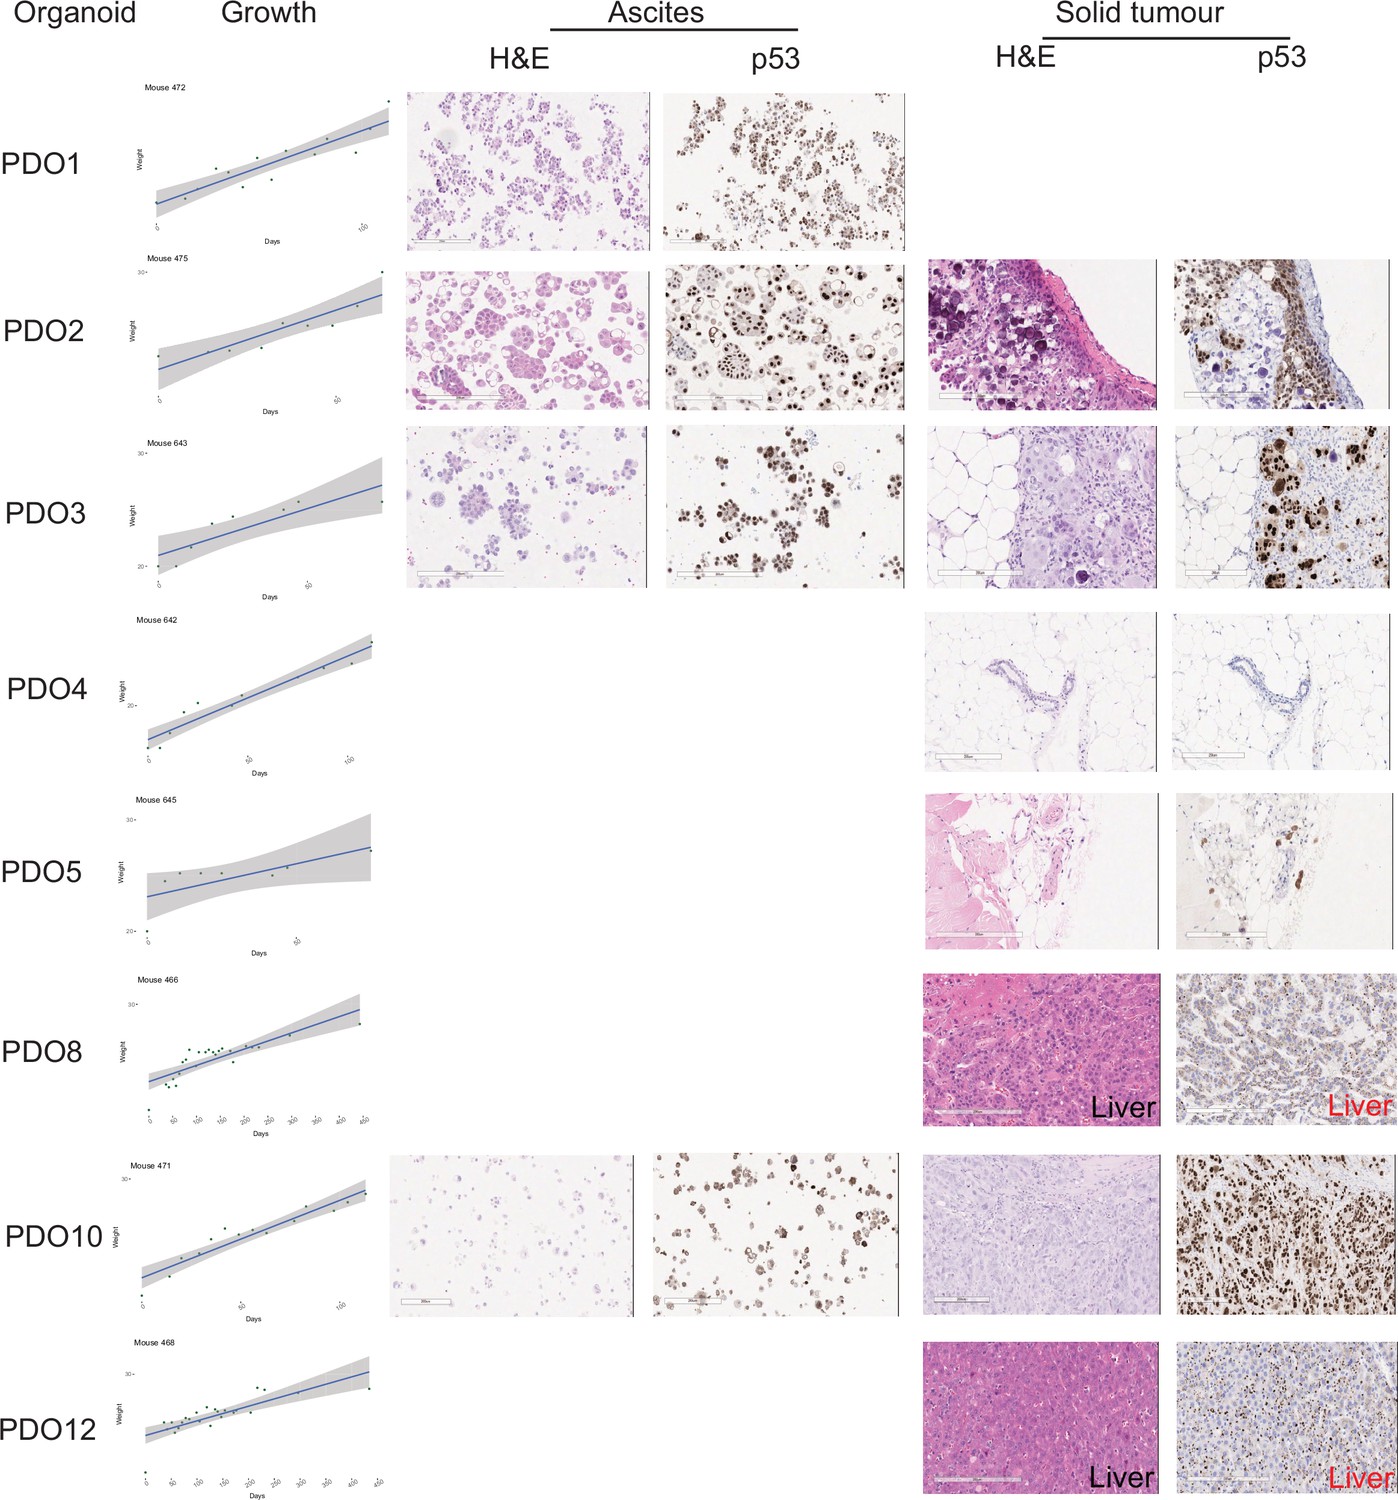
Orthotopic implantation of patient-derived organoid (PDO).
PDOs were implanted peritoneally into immunodeficient mice and disease progression was monitored by weighing the mice. Some mice developed ascites while others had disease in the liver or peritoneum. Haematoxylin and Eosin (H&E) and p53 immunostained sections are shown for each tissue collected. Scale bars = 200 µm.
Figure 1—figure supplement 6
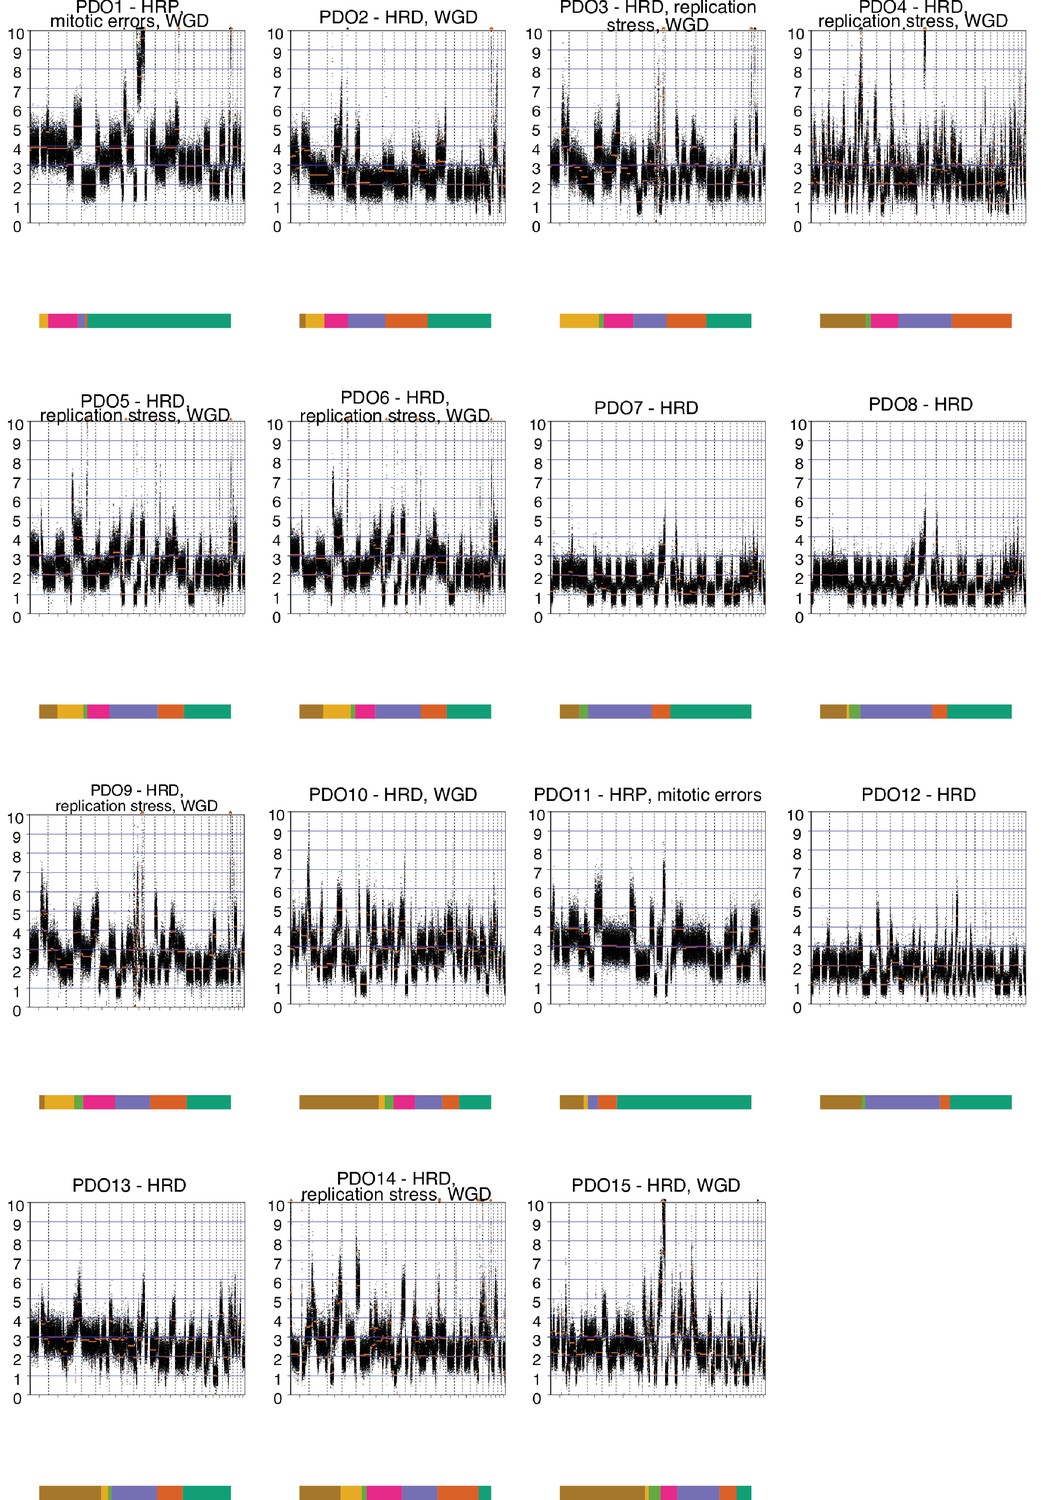
Patient-derived organoids' (PDOs) genome-wide absolute copy number alteration analysis.
Absolute copy number profiles at 30 kb bin size are presented for all the PDOs (PDO16, PDO17, and PDO18 were not continuous models).
Figure 1—figure supplement 7
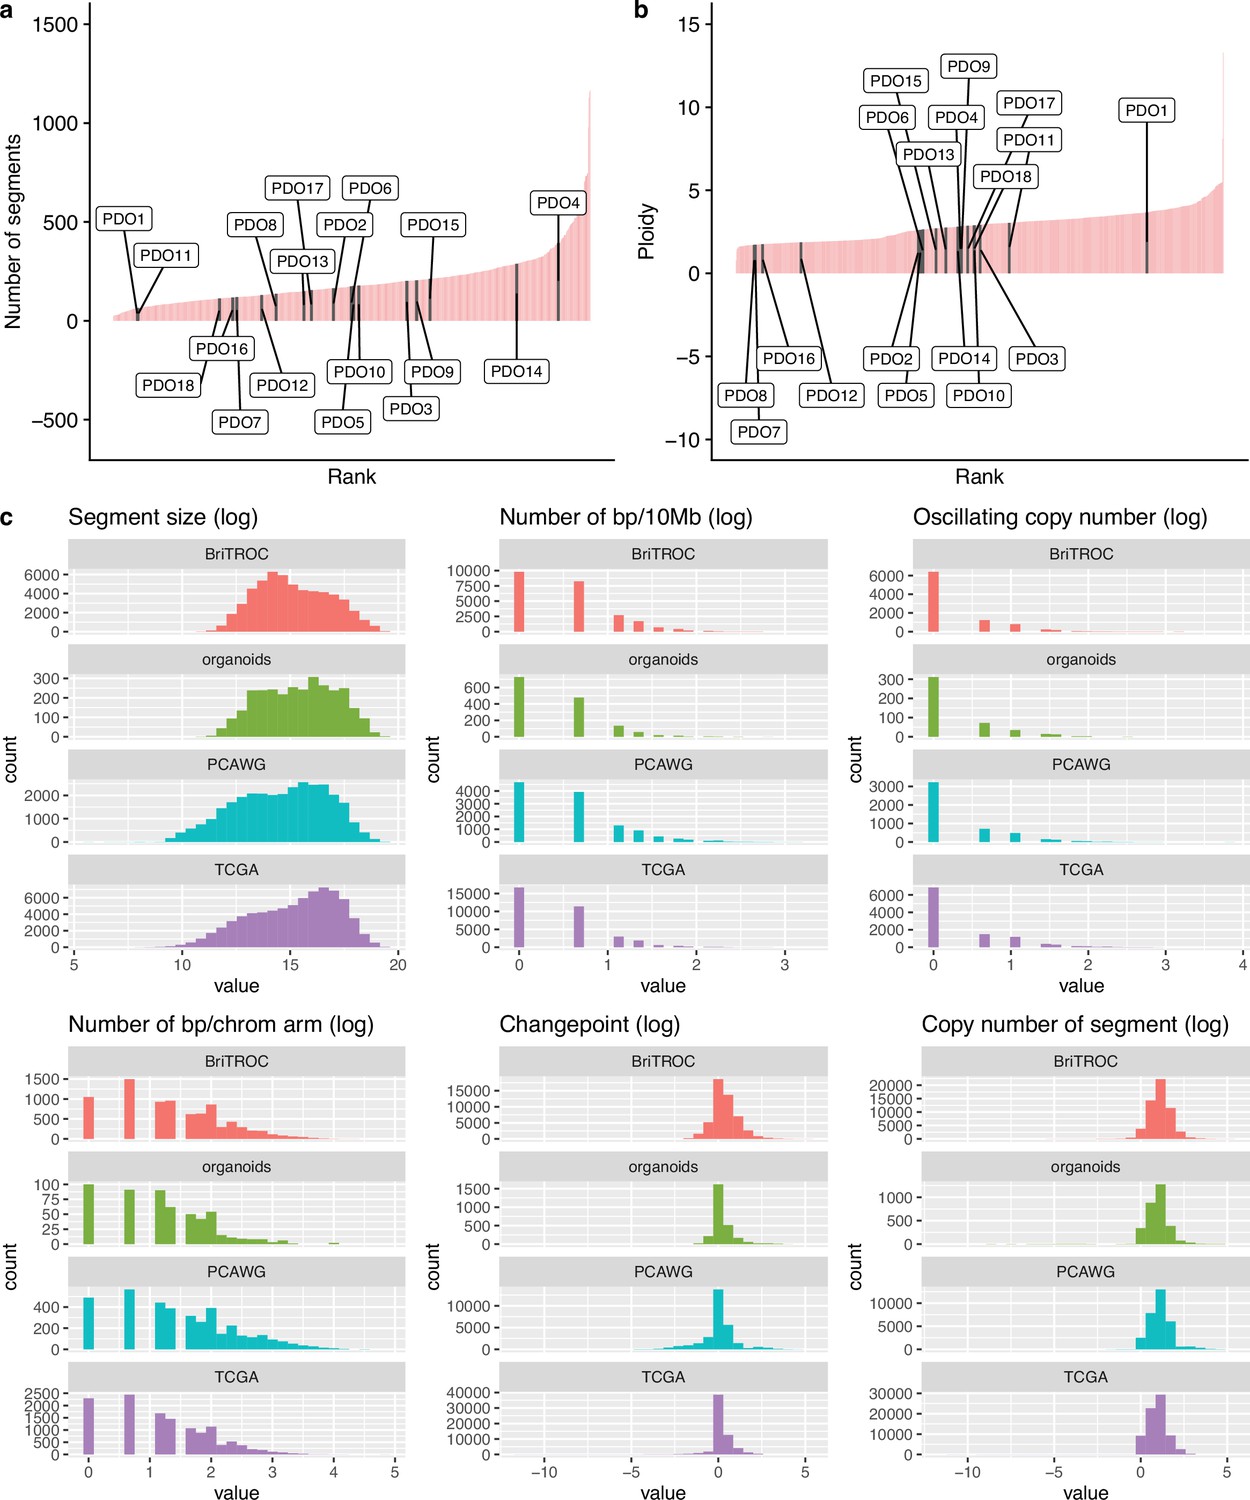
Copy number features of PDO and samples from public data sets.
Comparison of genomic features between patient-derived organoid (PDO) and high-grade serous ovarian carcinoma (HGSOC) cases in public data sets (a and b) Ordered barplots show the distribution of the number of copy number segments and ploidy for organoids (labeled black bars) and 692 HGSOC tumors from the publicly available datasets of TCGA, PCAWG, and BriTROC-1 (pink bars) (c) Tumor datasets used for comparison to PDOs (green bars) included TCGA (purple), BriTROC (orange) and PCAWG (blue). All genomic features are presented in a log scale. Welch Two Sample t-test p-value on log-transformed data: number of breakpoints per 10 MB (p=0.61), segment size (p=0.45), oscillating copy number (p=0.72), number of breakpoints per chromosome arm (p=0.60), number of changepoints (p=0.85), and copy number of the segments (p=0.73).
Figure 2 with 1 supplement
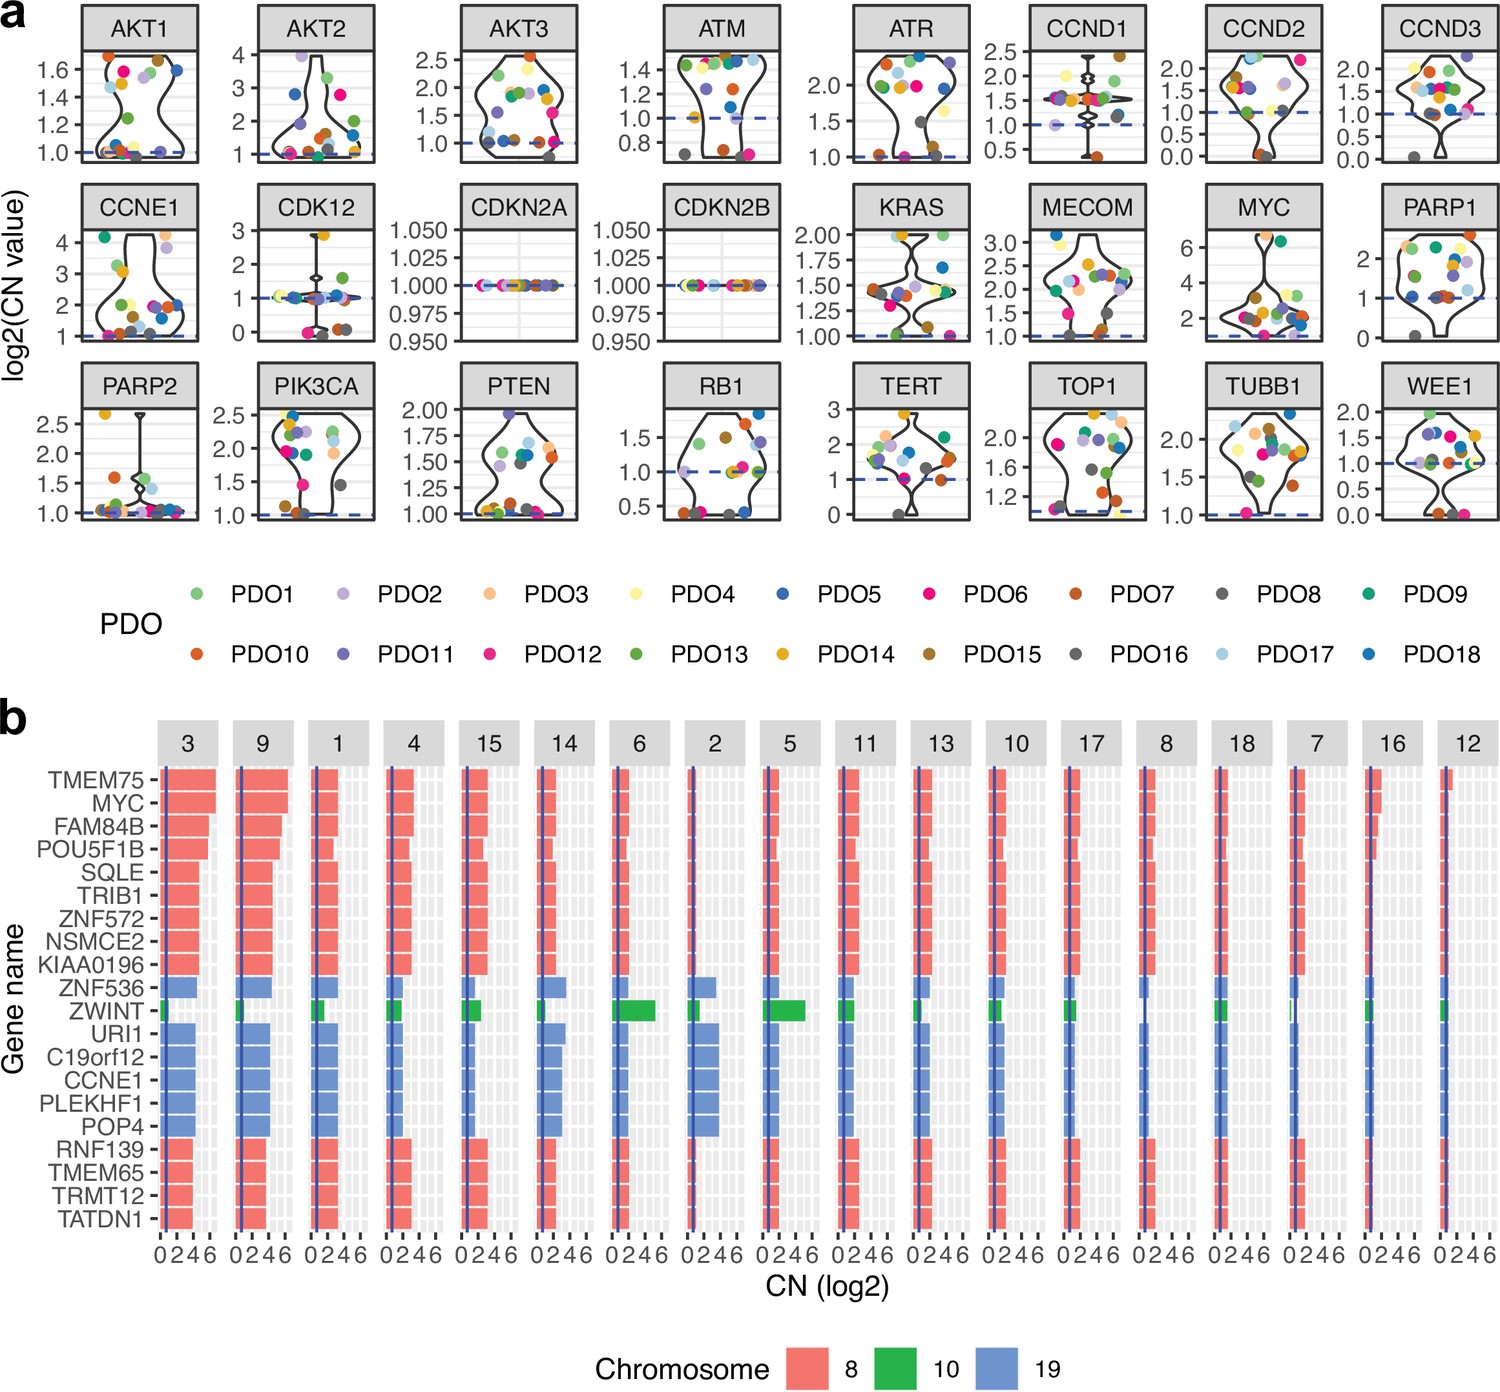
Absolute gene copy number in patient-derived organoids (PDOs).
(a) Absolute gene copy number for a set of important high-grade serous ovarian cancer genes. (b) Absolute gene copy number for the most amplified genes when averaged across all patient-derived organoids.
Figure 2—figure supplement 1
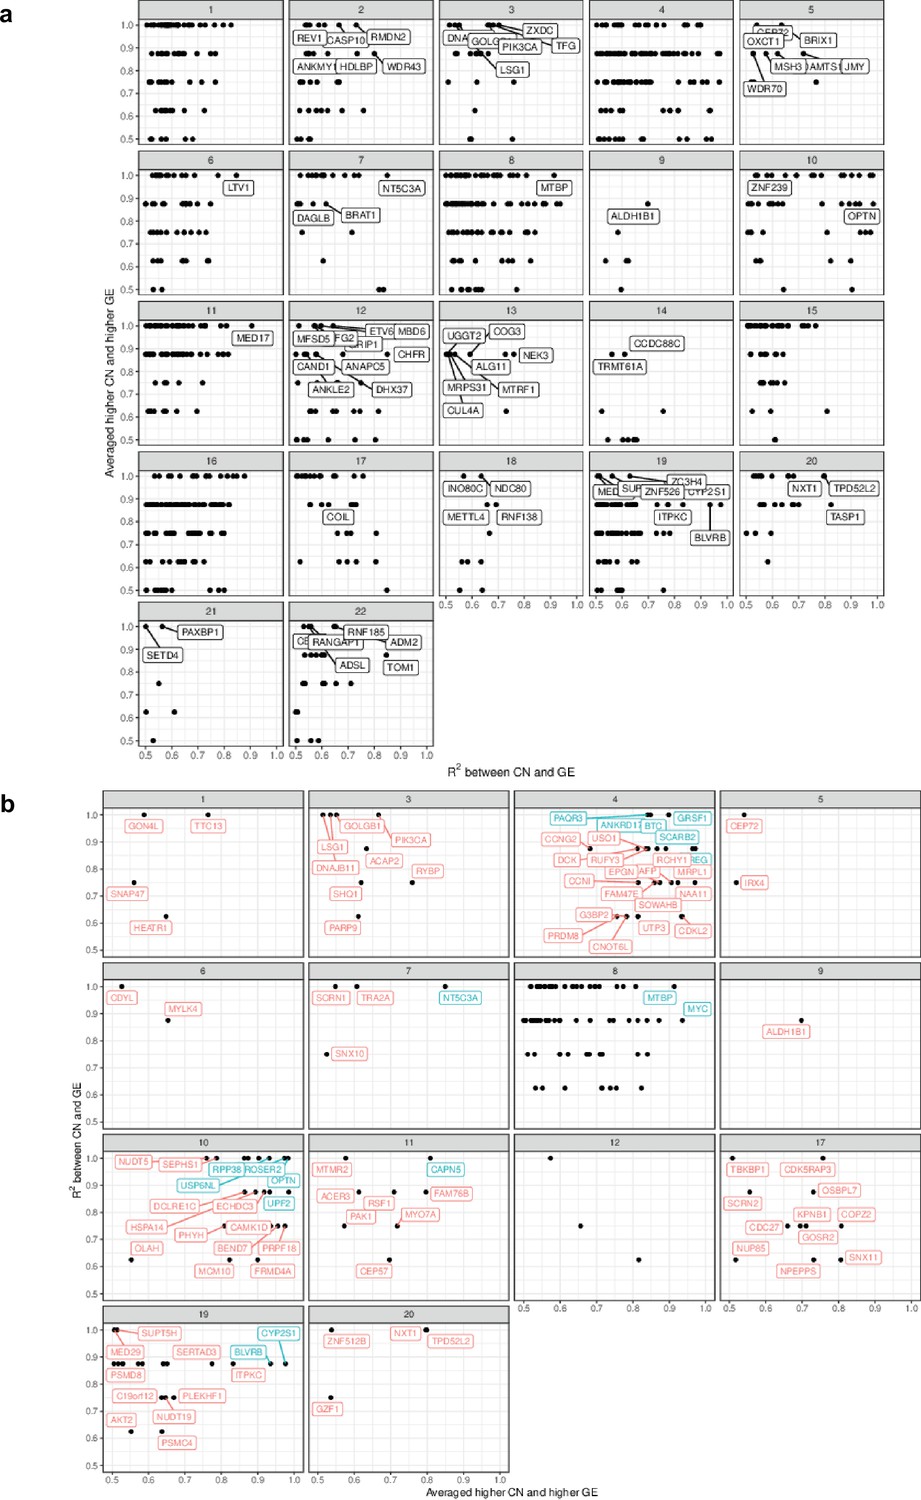
Whole genome correlation between absolute gene copy number and expression.
(a) Scatterplot assessing the agreement between copy number and gene expression in genes of high copy number variability across different chromosomes. For each gene, we computed the average expression of the three organoids with the lowest copy number value where the metric is the fraction of remaining organoids that have higher gene expression value than this average. The second metric we computed is the R2 value. In both cases, higher values indicate greater agreement between copy number and gene expression between organoids across different chromosomes. (b) Genes with the highest values for both metrics have been labeled in red across different chromosomes and the top 20 are labeled in blue. Chromosomes 14, 15, 16, 18, and 21 had no highly variable regions. Chromosomes 2 and 13 contained highly variable regions with low correlation.
Figure 3

Transcriptomic analysis of high-grade serous ovarian carcinoma (HGSOC) organoids.
(a) Scatterplots show correlation for the average counts, in transcripts per million (TPM) for each gene in the TCGA and the patient-derived organoid cohorts. Consensus TME genes represent non-tumor genes expressed in the tumor microenvironment (Jiménez-Sánchez et al., 2019). The dashed line corresponds to the identity line. (b) Principal component analysis based on DESeq2 counts for 11 organoids. (c) Scatterplot and contour plot of the Pearson correlation coefficient for copy number and gene expression, and average absolute copy number for each gene. MYC and ZWINT are shown as highly correlated genes. (d) Scatterplot of two metrics for assessing the agreement between copy number and gene expression. For each gene, we computed the average expression of the three organoids with the lowest copy number value. The metric is the fraction of remaining organoids that have higher gene expression value than this average, and takes values between 0/8 and 8/8, with higher values indicating greater agreement between copy number and gene expression across organoids. This is shown in the x-axis. On the y-axis we display the R2 value for the correlation between copy number state and gene expression. We have labeled genes of interest. The blue curve indicates the median R2 values in each group of the metric along the x-axis, and boxplots indicate the interquartile range. (e) DNA damage response KEGG pathway analysis from RNA-Seq on 11 PDOs. PDO10, and PDO15 show high enrichment scores for homologous recombination compared to other PDOs. Mismatch and base excision repair pathways also show high scores in these models. PDO8, which has the lowest HR score, contains a loss of function mutation in BRCA1.
Figure 4 with 1 supplement
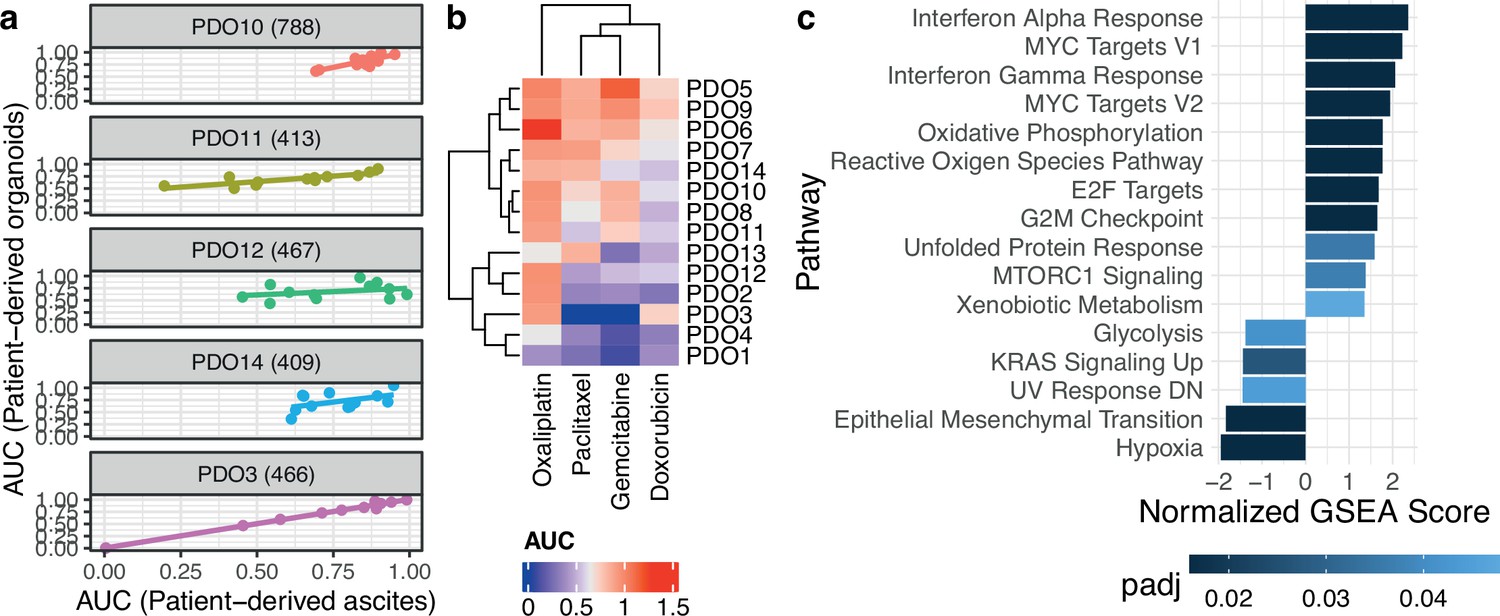
Patient-derived organoids are clinically relevant models.
(a) Correlation of drug response between uncultured patient cells and the patient-derived organoids (PDOs) derived from them using 12 compounds (PDO14: cor. 0.49, p-value 0.1; PDO11: cor. 0.82, p-value 0.001; PDO3: cor. 0.995, p-value 2.3e-11; PDO10: cor. 0.81, p-value 0.001; PDO12: cor.0.32, p-value 0.31). (b) Organoid drug responses to standard-of-care chemotherapies. The observed dose-response relationships were not always compatible with the Hill dose-response model assuming a sigmoidal decrease so that five-parameter logistic model fits were preferred, explaining area under the curve (AUC) estimates greater than one. Sensitive PDOs are labeled with a blue dot and resistant PDOs with a red one. (c) Significant pathways based on adjusted p-value (padj) after performing Gene Set Enrichment Analysis (GSEA) with rank based on significance level between the two PDO groups sensitive and resistant.
Figure 4—figure supplement 1
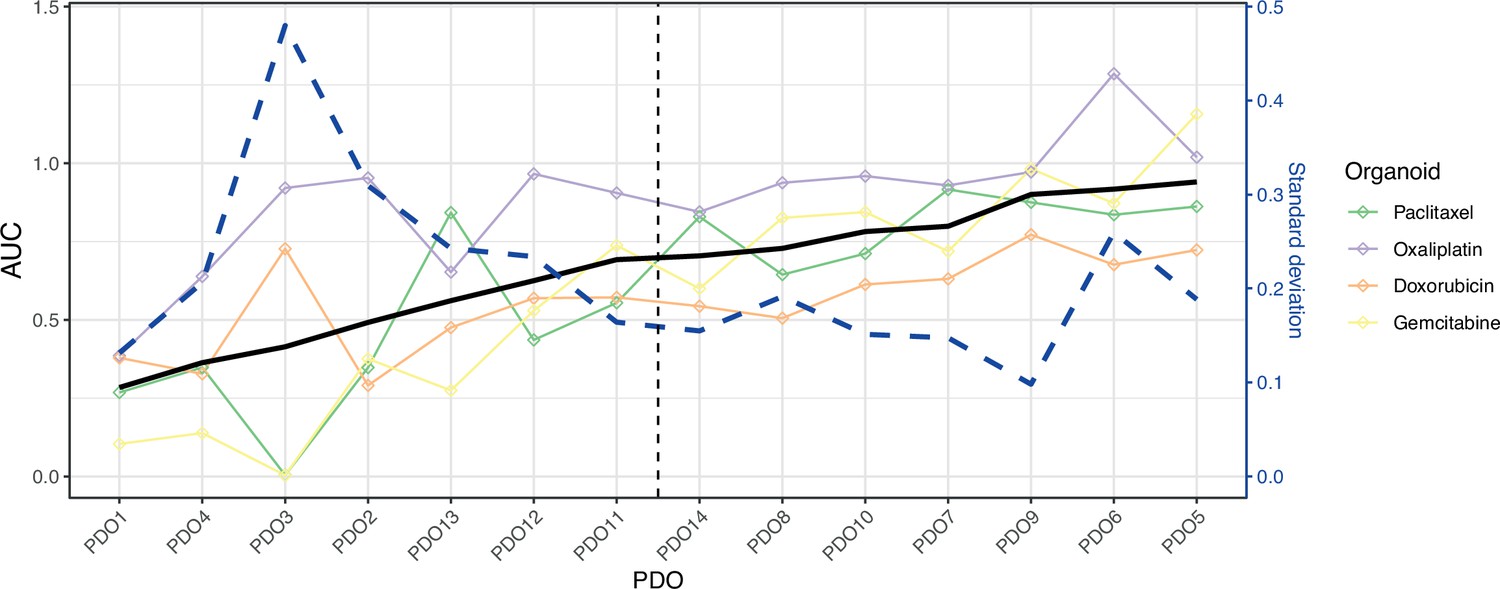
Patient-derived organoids (PDOs) can be classified into two groups according to their drug sensitivity.
Plot shows area under the curve (AUC) (y-axis) of each drug (lines and points) for each sample (x-axis) ordered in increasing mean AUC values. Black line reports the mean AUC and the vertical dotted line suggests a split by mean AUC. The blue dashed line indicates the standard deviation of AUC. We grouped the samples into resistant and sensitive based on the mean AUC for our differential gene expression analysis.
Figure 5 with 3 supplements
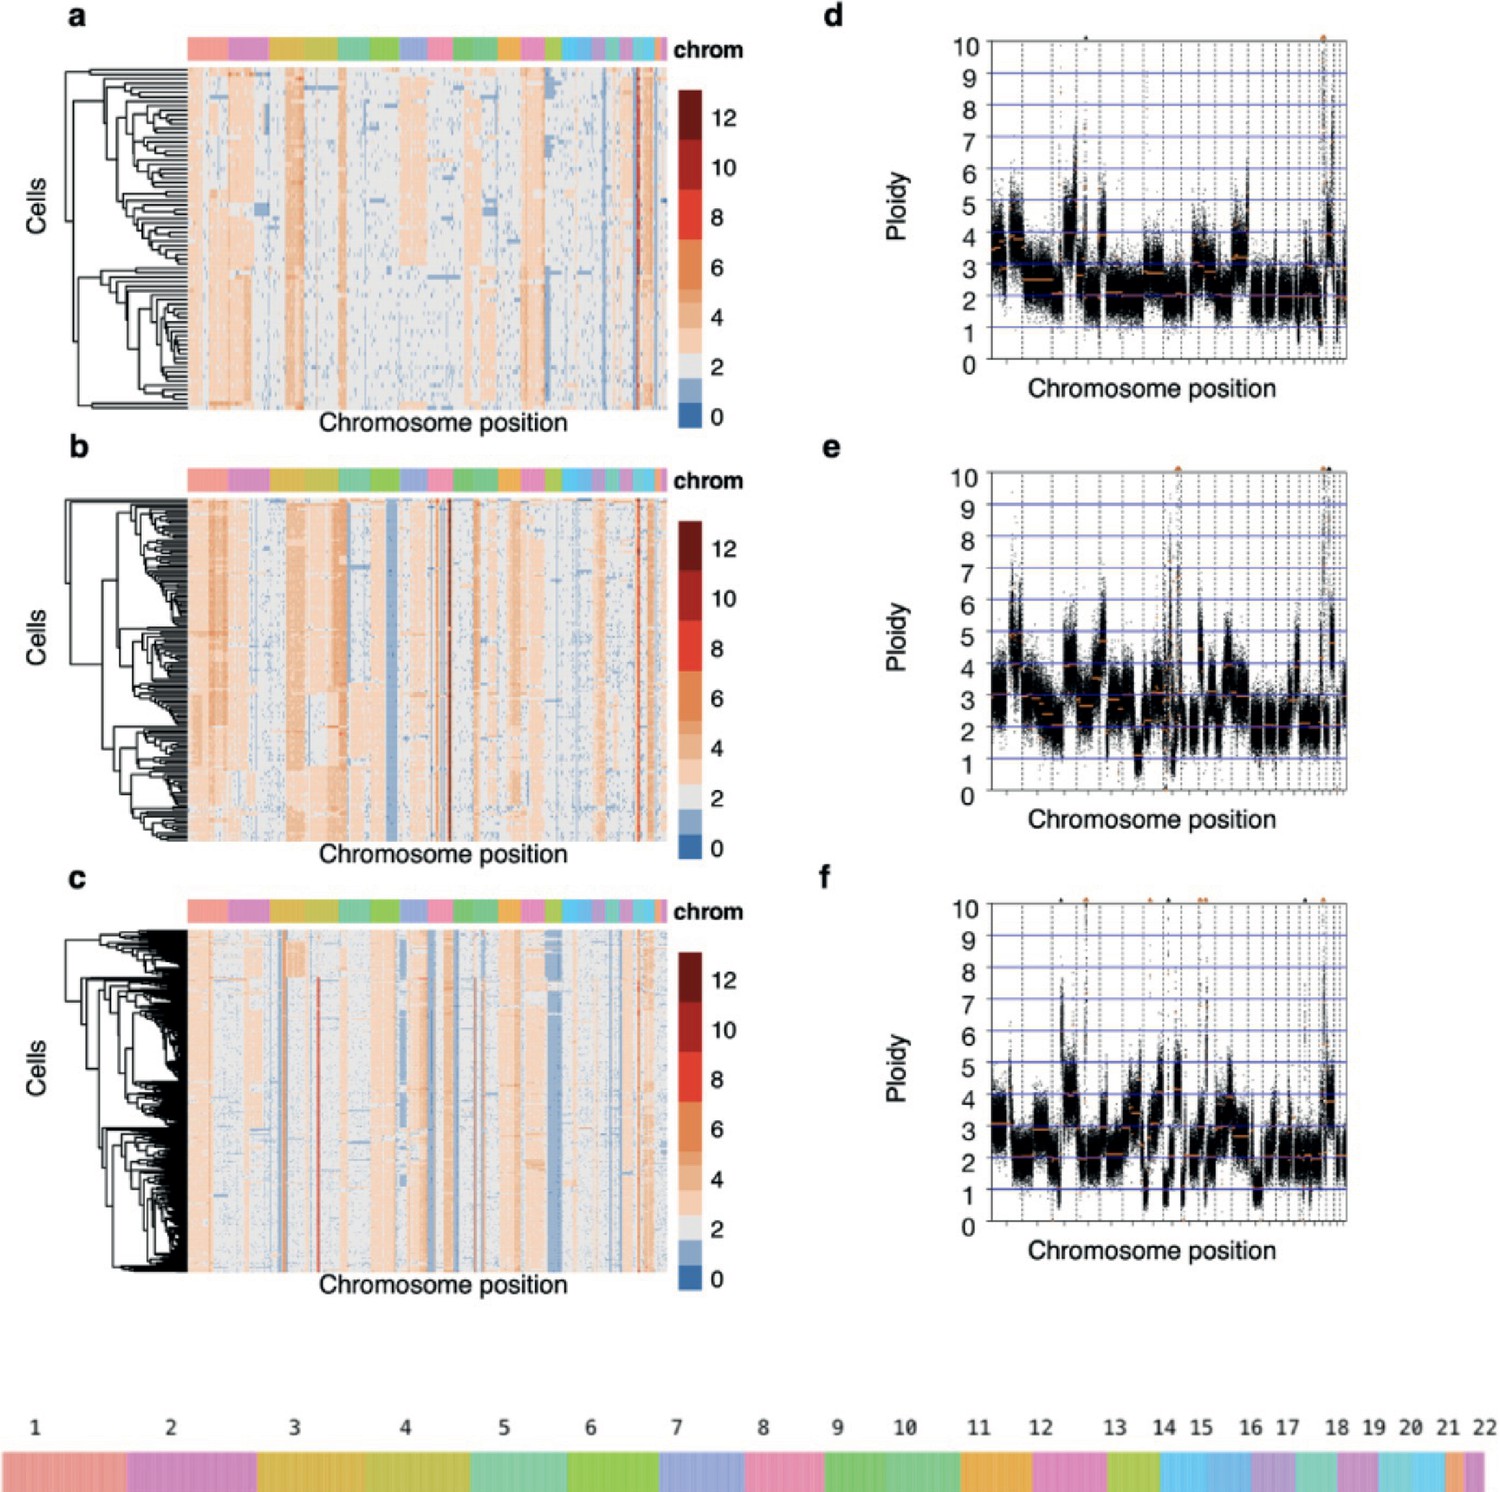
Genomic heterogeneity in three high-grade serous carcinoma patient-derived organoids (PDOs).
(a–c) Single-cell DNA (scDNA) copy number where cells have been clustered using hierarchical clustering on Euclidean distance. Each row within the scDNA plots represents a cell across the different chromosomes in the x-axis and the copy number state (20 kb bins) is indicated in colors. Loss of heterozygosity and amplification events are common in all three patient-derived organoids. (d-f) Bulk absolute copy number profiles.
Figure 5—figure supplement 1
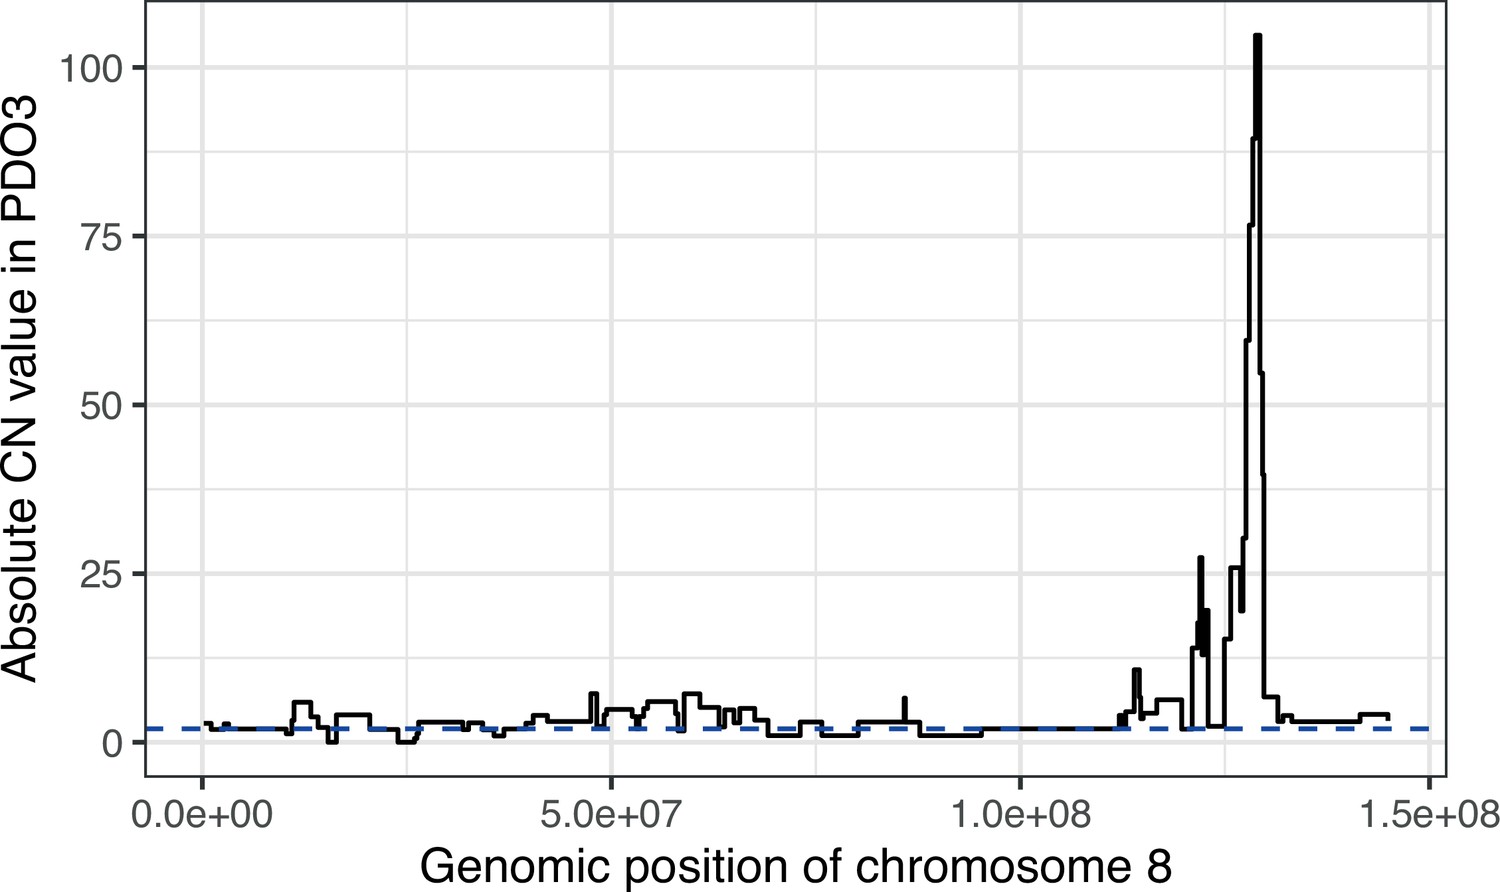
Chromothripsis in chromosome 8 of PDO3.
Step plot of the absolute copy number from sWGS for PDO3, along chromosome 8. The extreme values towards the end of the chromosome indicate a chromothriptic event. Diploid state is represented by the blue dotted line.
Figure 5—figure supplement 2
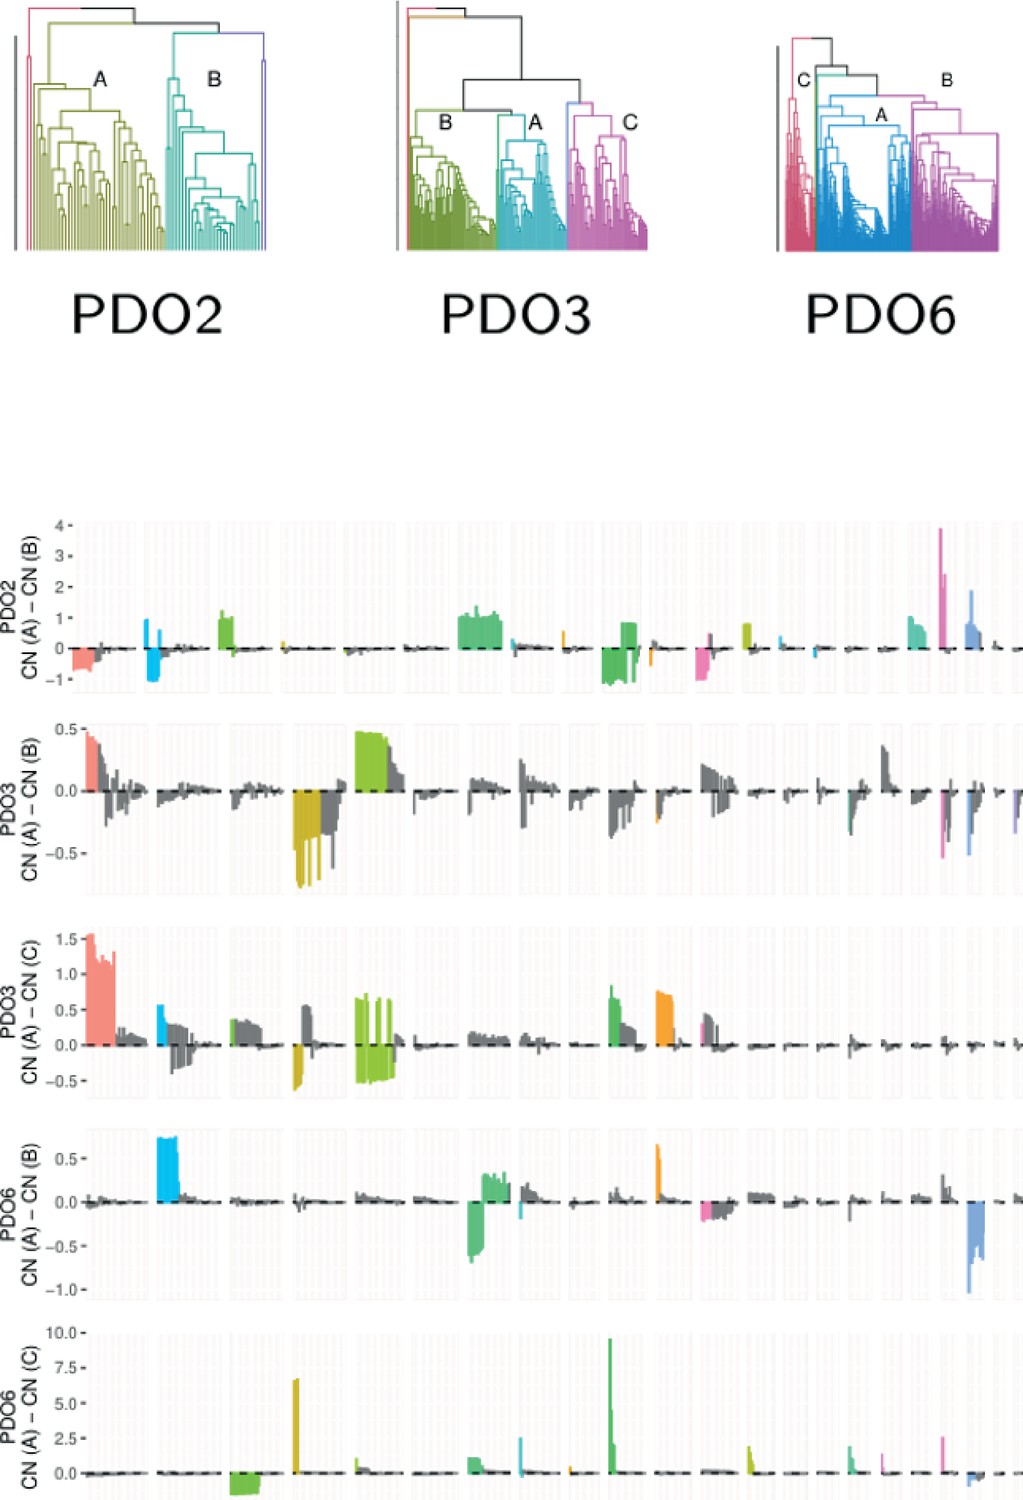
Major clades of cells in three organoids determined by copy number alterations from single-cell DNA-Seq.
PDO2 contains two major clades of 42 and 30 cells. These clades are characterized by changes in chromosome 7 (triplicated in the first clade and diploid in the second, in accordance with the copy number of roughly 2.75 from bulk sequencing) and chromosome 10 (showing the opposite trend). Few subclonal losses are observed, except for those in chromosome 13 p. In PDO3, the two clades are comprised of 48 and 92 cells, with the second clade containing two subclades of 40 and 52 cells. The largest differences are in chromosomes 1, 4 and 5, 10, and 11. There is an loss of heterozygosity (LOH) region at the start of chromosome 5 in the second clade, in all other chromosomes there are further copy number gains in regions where the first clade already shows amplifications. The two subclades contain differences in chromosomes 1, 4, and 5. PDO6 contains two clades of 49 and 303 cells (the second clade is split into subclades of 158 and 145 cells). The differences in the first split are in chromosomes 3, 4, 6, and 10, in which the extent of amplifications varies, and in chromosome 13, which presents large regions of single copy loss in the second clade. The greatest difference between the subclades is a large triplication of chromosome 2 in the first subclade.
Figure 5—figure supplement 3
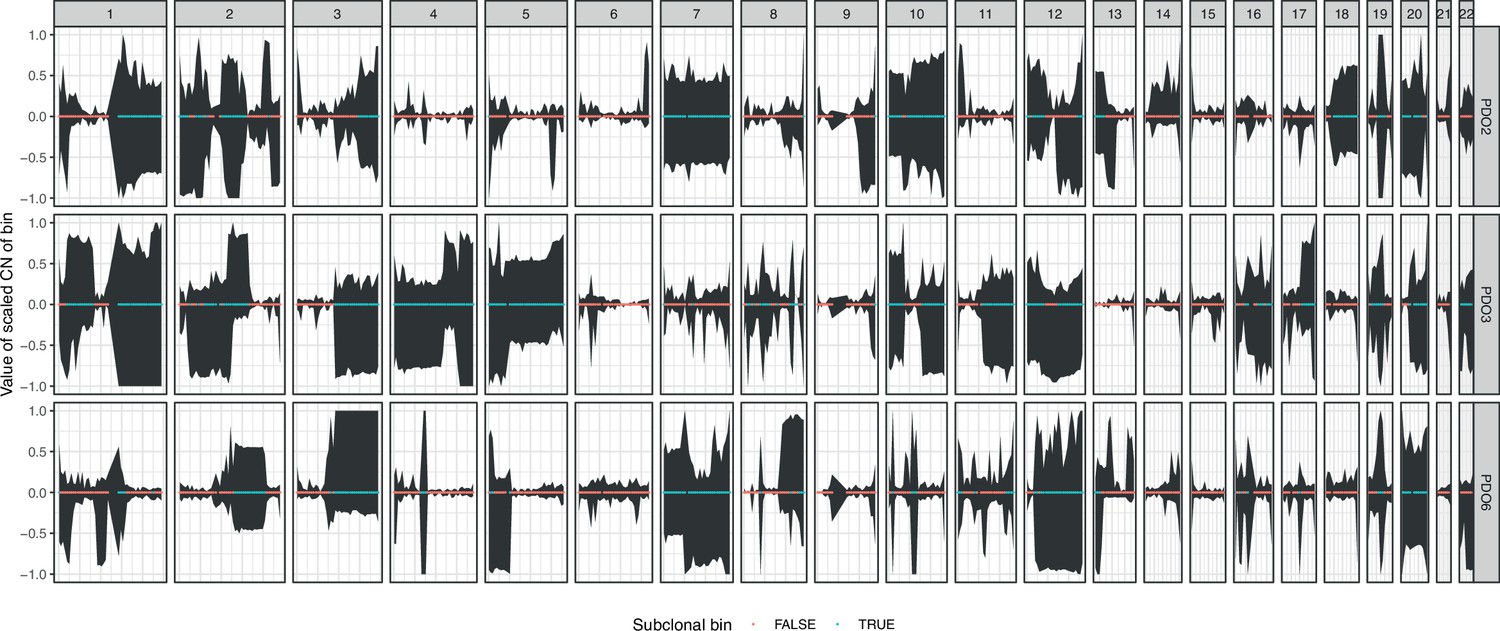
95% confidence intervals of the centered copy number, along the genome, across single-cells from organoids.
The color of the dots indicates whether the CN value is shared between cells, and, therefore, clonal (in red), or whether there is subclonal heterogeneity in the bin (in blue) according to a Chi-squared test of the variance in copy number among cells and correcting for ploidy.
Author response image 1
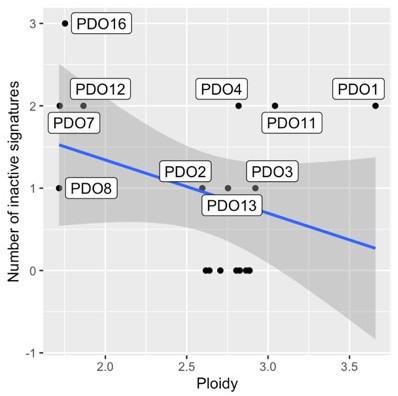
Correlation between ploidy and the number of inactive signatures in PDOs.
Author response image 2
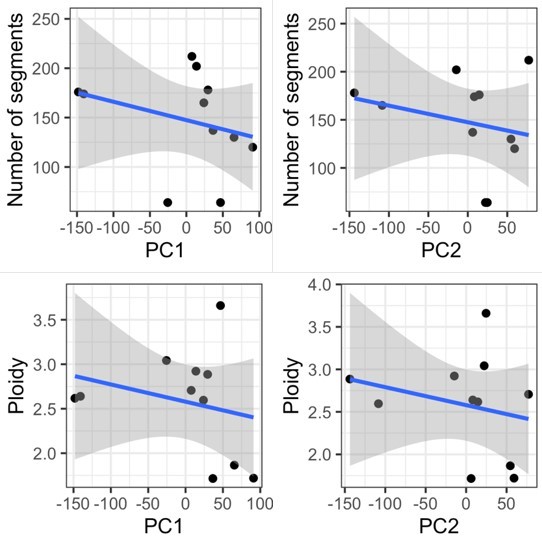
Correlation of number of segments and ploidy with PC1 and PC2 values.
Author response image 3
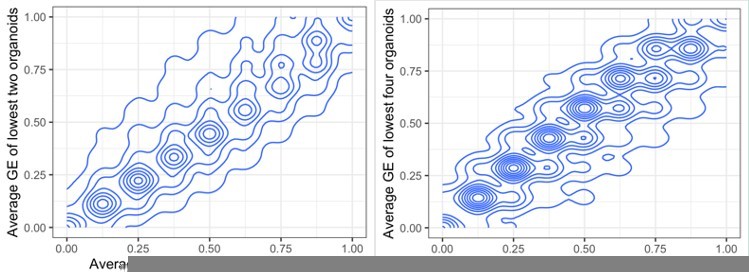
Comparing average gene expression values when summarising the lowest two or three organoids (left) and three or four (right).
Additional files
-
Supplementary file 1
Summary of patient chemotherapy treatment.
- https://cdn.elifesciences.org/articles/83867/elife-83867-supp1-v1.csv
-
Supplementary file 2
Mutation analysis of patient and PDO samples.
- https://cdn.elifesciences.org/articles/83867/elife-83867-supp2-v1.xlsx
-
Supplementary file 3
Patient germline BRCA mutation status.
- https://cdn.elifesciences.org/articles/83867/elife-83867-supp3-v1.xlsx
-
MDAR checklist
- https://cdn.elifesciences.org/articles/83867/elife-83867-mdarchecklist1-v1.docx
Download links
A two-part list of links to download the article, or parts of the article, in various formats.
Downloads (link to download the article as PDF)
Open citations (links to open the citations from this article in various online reference manager services)
Cite this article (links to download the citations from this article in formats compatible with various reference manager tools)
High-grade serous ovarian carcinoma organoids as models of chromosomal instability
eLife 12:e83867.
https://doi.org/10.7554/eLife.83867


