Poor air quality is associated with impaired visual cognition in the first two years of life: A longitudinal investigation
- School of Psychology, University of East Anglia, United Kingdom
- Department of Psychology, Durham University, United Kingdom
- Community Empowerment Lab, India
- Department of Pediatrics, Brown University, United States
Figures
Figure 1
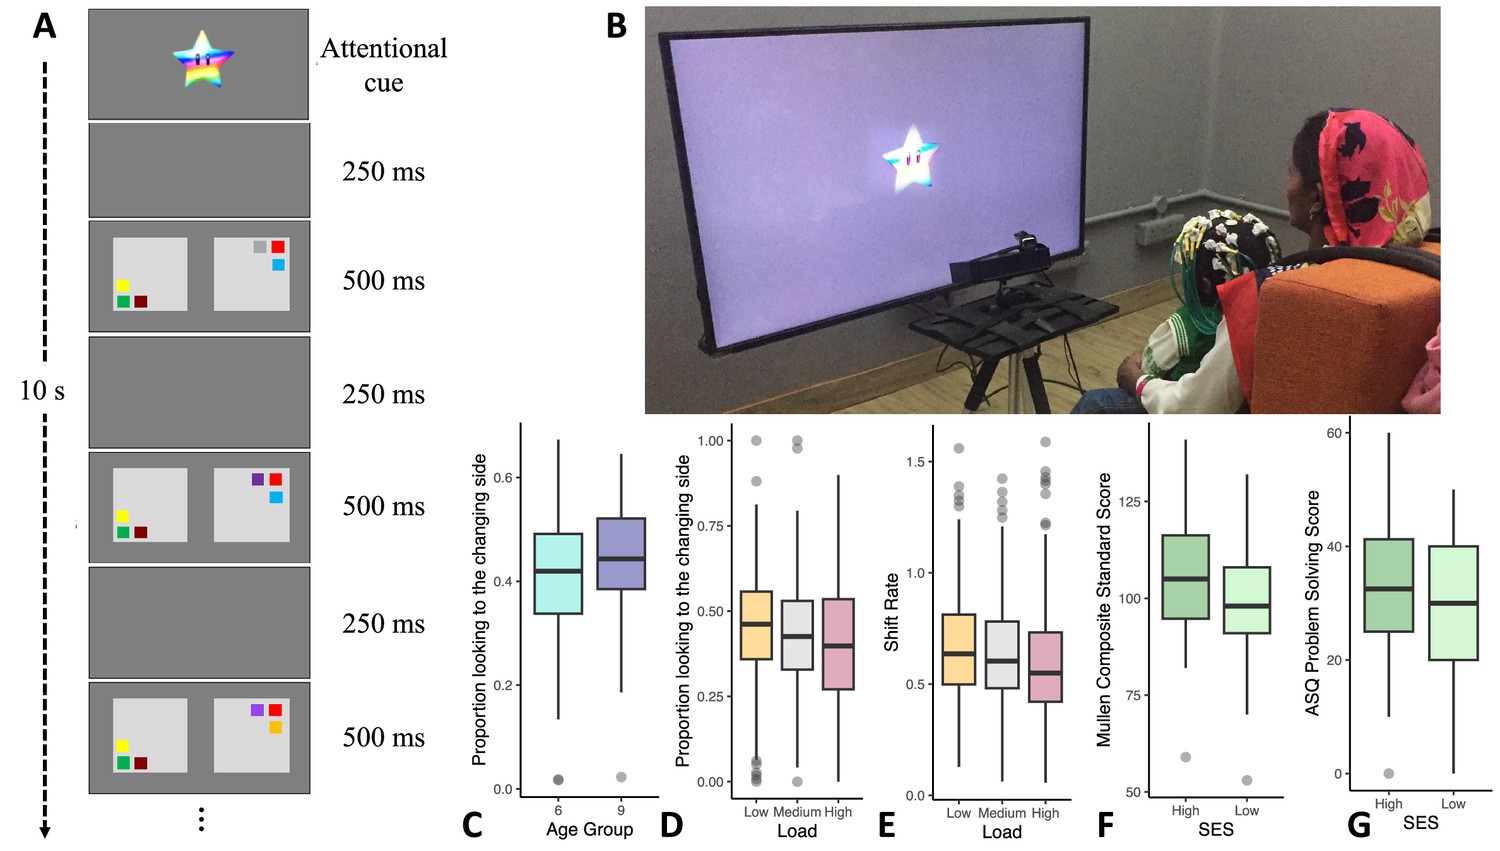
Variations in infants’ cognitive performance.
(A) A schematic of the visual cognition task. (B) An infant performing the task. (C) The 6-month-old cohort (N = 107) had lower ‘first-look no-change’ change preference scores relative to the 9-month-old cohort (N = 106). (D) Infants showed higher change preference scores in the low memory load condition (N = 210) relative to the medium (N = 208) and high loads (N = 209). (E) Infants had faster visual processing speed (higher shift rates) in the low load condition (N = 206) relative to the medium (N = 206) and high loads (N = 205). (F) Standardized composite scores from the Mullen Scales of Early Learning (MSEL) in year 1 were higher for high SES infants (N = 97) than for low SES infants (N = 112). (G) Problem-solving scores from the Ages and Stages Questionnaire (ASQ) in year 2 were higher for high SES infants (N = 84) than for low SES infants (N = 96). Note that for F and G, a continuous SES score based on the Kuppuswamy Scale (see Mohd Saleem, 2020) was used in analysis, but this was median-split for ease of visualization. Line in boxplots shows the median, lower and upper hinges show the first and third quartiles, lower and upper whiskers extend to the smallest and largest point no more than 1.5 * the interquartile range from the closest hinge respectively, and data beyond teh whiskers are outlying and are plotted individually.
Figure 2
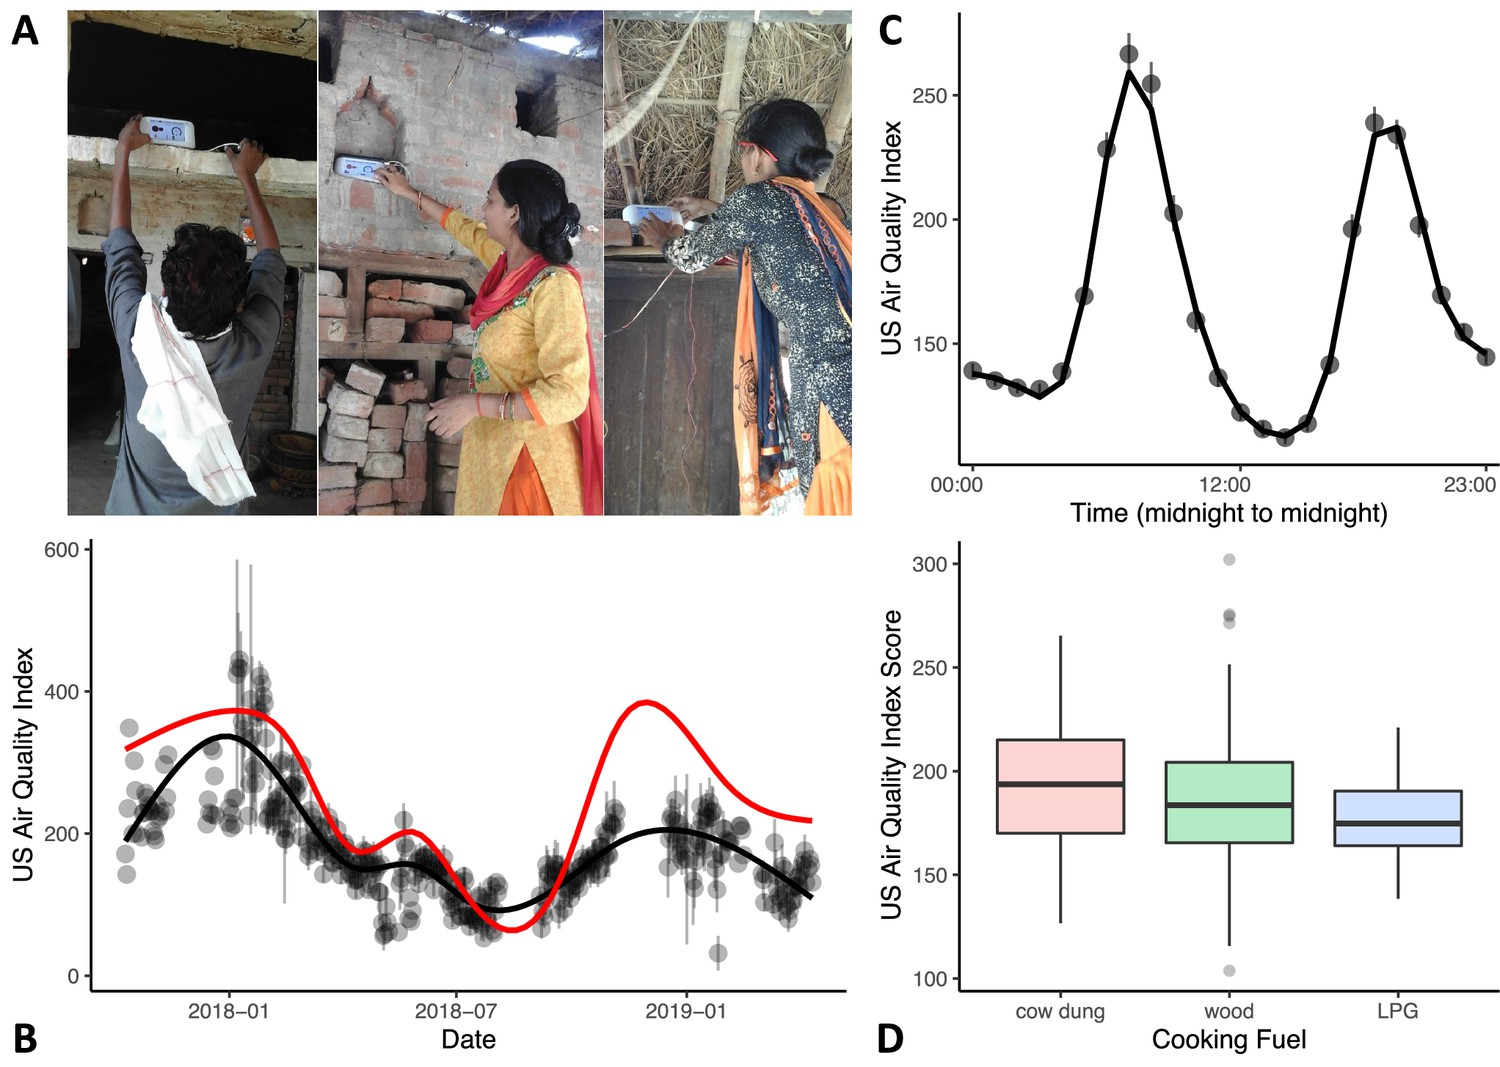
Variations in in-home air quality (PM2.5) by year, by day, and by type of cooking fuel.
(A) Three examples of in-home sensor placement for households of varying SES levels. (B) Variations in in-home air quality over years in the study (participants contributing data = 215). Black dots show mean air quality index over each 3-day assessment period with standard errors indicating variability over households collected on the same day. Black line shows our model fit through these data. Red line shows best-fitting curve from outdoor air quality observations recorded in Lucknow, India. (C) Daily variations in in-home air quality with peaks at meal preparation times (participants contributing data = 215). Points indicate raw data (with standard errors), the line indicates our model fit. (D) Plots showing poorer in-home air quality for households that used cow dung for cooking fuel (N = 25) relative to wood (N = 152) and liquified petroleum gas (LPG; N = 38). Boxplot details are same as in Figure 1.
Figure 3
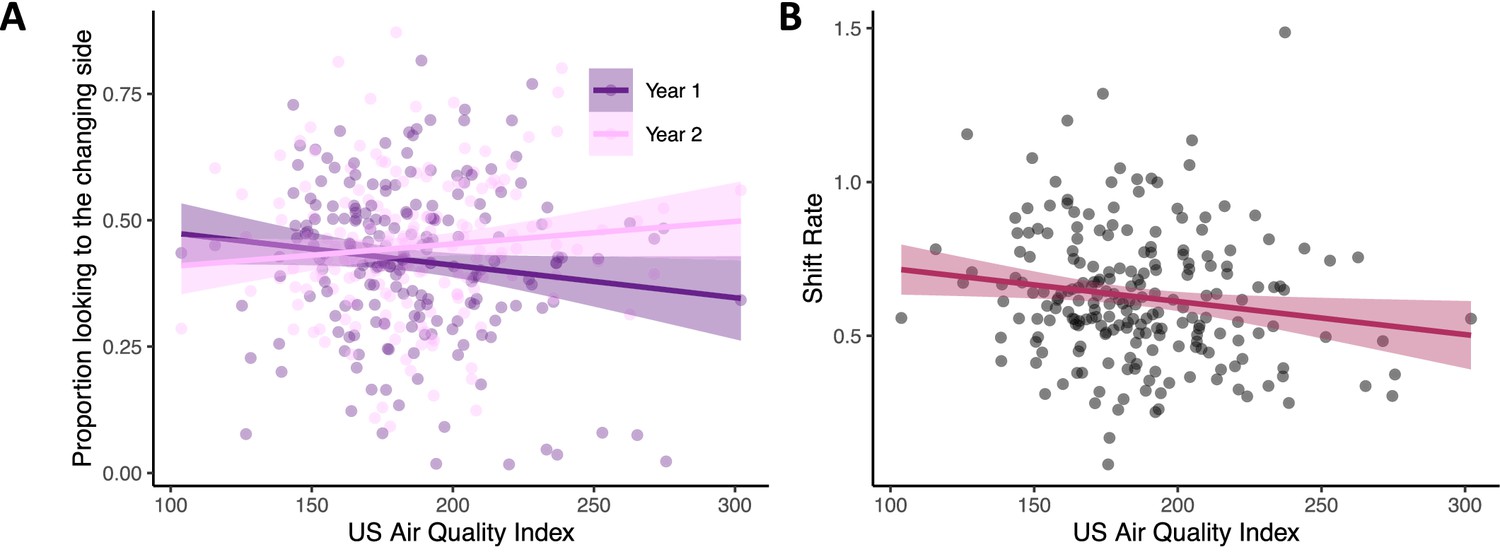
Poor air quality is associated with impaired visual cognition in infancy.
(A) Infants from households with better air quality (lower AQI scores) had higher visual working memory scores in year 1 (see dark purple line; N = 199) relative to effects in year 2 (pink line; N = 179). (B) Infants from households with better air quality (lower AQI scores) also had faster visual processing speeds (higher shift rates; N = 213). Dots in both panels show raw data, line indicates linear trend with the ribbon indicating the 95% confidence interval.
Tables
Table 1
Proportional distribution of key demographic indices for families classified as high versus low SES based on a median split of family SES measured using the modified Kuppuswamy scale.
| Electricity? | Income* | Cooking Fuel | High SES | Low SES |
|---|---|---|---|---|
| No | Low | Cow dung | 0.02 | 0.06 |
| Wood | 0.02 | 0.25 | ||
| LPG | 0.01 | 0.01 | ||
| Medium | Cow dung | 0.01 | 0.02 | |
| Wood | 0.04 | 0.19 | ||
| LPG | 0.00 | 0.00 | ||
| High | Cow dung | 0.00 | 0.00 | |
| Wood | 0.03 | 0.08 | ||
| LPG | 0.01 | 0.00 | ||
| Yes | Low | Cow dung | 0.04 | 0.01 |
| Wood | 0.08 | 0.10 | ||
| LPG | 0.04 | 0.01 | ||
| Medium | Cow dung | 0.03 | 0.02 | |
| Wood | 0.17 | 0.17 | ||
| LPG | 0.02 | 0.00 | ||
| High | Cow dung | 0.02 | 0.01 | |
| Wood | 0.22 | 0.06 | ||
| LPG | 0.26 | 0.02 |
-
*
Incomes ranged from ₹8000 to ₹480,000 with tertile divisions at ₹45,000 and ₹72,720.
Table 2
Baseline model for the change preference scores.
Model parameters for linear mixed effect model assessing the impact of year, load, SES score based on the Kuppuswamy scale, age cohort, and visual dynamics in LookingWindow1 on the ‘first-look no-change’ change preference scores (baseline change preference model).
| Variable | Estimate | Std. Error | DF | t value | Pr(>|t|) |
|---|---|---|---|---|---|
| (Intercept) | 0.488 | 0.054 | 534.793 | 9.062 | <0.001 |
| Year | –0.044 | 0.107 | 742.433 | –0.411 | 0.681 |
| Load1 | 0.029 | 0.009 | 857.116 | 3.130 | 0.002 |
| Load2 | –0.001 | 0.009 | 854.106 | –0.114 | 0.909 |
| SES | –0.006 | 0.013 | 527.033 | –0.417 | 0.677 |
| LookingWindow1 | –0.067 | 0.065 | 548.916 | –1.038 | 0.300 |
| Age | 0.027 | 0.014 | 183.400 | 1.913 | 0.057 |
| Year:SES | 0.036 | 0.027 | 715.570 | 1.350 | 0.177 |
| Year:LookingWindow1 | 0.075 | 0.129 | 731.071 | 0.582 | 0.561 |
| SES:LookingWindow1 | 0.006 | 0.016 | 532.948 | 0.381 | 0.704 |
| Year:SES:LookingWindow1 | –0.054 | 0.033 | 710.951 | –1.665 | 0.096 |
Table 3
Model parameters for linear mixed effect model assessing the impact of year, load, SES and age cohort on the shift rate (baseline visual processing speed model).
| Variable | Estimate | Std. Error | DF | t value | Pr(>|t|) |
|---|---|---|---|---|---|
| (Intercept) | 0.631 | 0.014 | 196.30 | 45.260 | <0.001 |
| Year | 0.016 | 0.017 | 893.40 | 0.963 | 0.336 |
| Load1 | 0.040 | 0.011 | 812.80 | 3.485 | <0.001 |
| Load2 | 0.001 | 0.011 | 811.70 | 0.071 | 0.943 |
| SES | 0.002 | 0.003 | 207.00 | 0.545 | 0.587 |
| Age | 0.012 | 0.028 | 195.80 | 0.429 | 0.668 |
| Year:SES | –0.007 | 0.004 | 928.20 | –1.553 | 0.121 |
Table 4
Model parameters for linear models describing effects of age cohort and SES on standardized cognitive scores (baseline standardized cognitive models).
Measures included are MSEL composite T-score and ASQ problem solving score.
| Measure | Variable | Estimate | Std. Error | t value | Pr(>|t|) |
|---|---|---|---|---|---|
| Mullen Composite | (Intercept) | 101.299 | 0.960 | 105.562 | <0.001 |
| Age | –0.345 | 1.920 | –0.180 | 0.857 | |
| SES | 0.769 | 0.232 | 3.308 | 0.001 | |
| ASQ Problem Solving | (Intercept) | 30.581 | 0.955 | 32.032 | <0.001 |
| Age | –5.549 | 1.909 | –2.907 | 0.004 | |
| SES | 0.923 | 0.231 | 3.998 | <0.001 |
Table 5
Model parameters for linear models assessing the baseline variability of SES, cooking fuel, and age cohort on the air quality reading (baseline air quality models).
| Model | Variable | Estimate | Std. Error | t value | Pr(>|t|) |
|---|---|---|---|---|---|
| Cooking Fuel | (Intercept) | 1.461 | 2.767 | 0.528 | 0.598 |
| Cooking Fuel1 | 10.866 | 4.517 | 2.405 | 0.017 | |
| Cooking Fuel2 | –1.519 | 3.119 | –0.487 | 0.627 | |
| Age | –0.548 | 4.213 | –0.13 | 0.897 | |
| SES | (Intercept) | –0.004 | 2.099 | –0.002 | 0.999 |
| SES | –1.152 | 0.511 | –2.255 | 0.025 | |
| Age | –1.714 | 4.198 | –0.408 | 0.683 |
Table 6
Model parameters for linear mixed-effect model assessing the impact of air quality (AQI) on the baseline change preference score model which included Year, Load, SES, Age Cohort, and LookingWindow1 as predictors (see Table 2).
| Variable | Estimate | Std. Error | DF | t value | Pr(>|t|) |
|---|---|---|---|---|---|
| (Intercept) | 0.494 | 0.054 | 535.80 | 9.186 | <0.001 |
| Year | –0.044 | 0.107 | 741.90 | –0.411 | 0.681 |
| Load1 | 0.029 | 0.009 | 858.10 | 3.135 | 0.002 |
| Load2 | –0.001 | 0.009 | 855.20 | –0.124 | 0.901 |
| SES | –0.009 | 0.014 | 524.70 | –0.663 | 0.508 |
| LookingWindow1 | –0.075 | 0.065 | 549.90 | –1.155 | 0.249 |
| Age | 0.026 | 0.014 | 184.70 | 1.810 | 0.072 |
| AQI | 0.000 | 0.000 | 181.80 | –0.654 | 0.514 |
| Year:SES | 0.040 | 0.027 | 720.10 | 1.471 | 0.142 |
| Year:LookingWindow1 | 0.075 | 0.128 | 730.70 | 0.585 | 0.559 |
| SES:LookingWindow1 | 0.010 | 0.016 | 530.80 | 0.607 | 0.544 |
| Year:AQI | 0.001 | 0.000 | 965.10 | 2.431 | 0.015 |
| Year:SES:LookingWindow1 | –0.057 | 0.033 | 714.90 | –1.750 | 0.080 |
Table 7
Model parameters for linear mixed-effect model assessing the impact of air quality (AQI) on the baseline visual processing speed (shift rate) model which included Year, Load, SES, and Age Cohort as predictors (see Table 3).
| Variable | Estimate | Std. Error | DF | t value | Pr(>|t|) |
|---|---|---|---|---|---|
| (Intercept) | 0.631 | 0.014 | 195.40 | 45.655 | <0.001 |
| Year | 0.016 | 0.017 | 894.50 | 0.977 | 0.329 |
| Load1 | 0.040 | 0.011 | 813.20 | 3.501 | <0.001 |
| Load2 | 0.001 | 0.011 | 812.10 | 0.045 | 0.964 |
| SES | 0.001 | 0.003 | 205.10 | 0.225 | 0.823 |
| Age | 0.009 | 0.028 | 195.30 | 0.318 | 0.750 |
| AQI | –0.001 | 0.000 | 192.10 | –2.166 | 0.032 |
| Year:SES | –0.006 | 0.004 | 928.60 | –1.493 | 0.136 |
Table 8
Model parameters for linear model assessing the impact of air quality (AQI) on the baseline Mullen model (Composite T-Score) which included Age Cohort and SES as predictors (see Table 4).
| Variable | Estimate | Std. Error | t value | Pr(>|t|) |
|---|---|---|---|---|
| (Intercept) | 101.301 | 0.961 | 105.398 | <0.001 |
| Age | –0.377 | 1.923 | –0.196 | 0.845 |
| SES | 0.746 | 0.236 | 3.163 | 0.002 |
| AQI | –0.019 | 0.032 | –0.596 | 0.552 |
Table 9
Model parameters for linear models assessing the impact of air quality (AQI) on the baseline ASQ model which included Age Cohort and SES as predictors (see Table 4).
For comparison with prior work, we include analyses of the ASQ Problem Solving score as well as Fine and Gross Motor scores.
| Measure | Variable | Estimate | Std. Error | t value | Pr(>|t|) |
|---|---|---|---|---|---|
| ASQ Problem Solving | (Intercept) | 30.563 | 0.955 | 32.004 | <0.001 |
| Age | –5.617 | 1.910 | –2.941 | 0.004 | |
| SES | 0.890 | 0.233 | 3.817 | <0.001 | |
| AQI | –0.030 | 0.031 | –0.983 | 0.327 | |
| ASQ Fine Motor | (Intercept) | 34.224 | 1.039 | 32.944 | <0.001 |
| Age | –5.655 | 2.078 | –2.721 | 0.007 | |
| SES | 0.815 | 0.254 | 3.214 | 0.002 | |
| AQI | –0.025 | 0.033 | –0.748 | 0.455 | |
| ASQ Gross Motor | (Intercept) | 36.849 | 1.061 | 34.733 | <0.001 |
| Age | –8.221 | 2.122 | –3.874 | <0.001 | |
| SES | 0.571 | 0.259 | 2.206 | 0.029 | |
| AQI | –0.054 | 0.034 | –1.582 | 0.115 |
Table 10
Model parameters from the baseline mixed-effects model assessing the effects of Year, Load, SES, LookingWindow1 and Age cohort on the first look change measure.
| Variable | Estimate | Std. Error | DF | t value | Pr(>|t|) |
|---|---|---|---|---|---|
| (Intercept) | 0.592 | 0.054 | 613.50 | 11.009 | <0.001 |
| Year | –0.030 | 0.013 | 966.10 | –2.353 | 0.019 |
| Load1 | 0.000 | 0.009 | 846.40 | 0.024 | 0.981 |
| Load2 | 0.002 | 0.009 | 847.40 | 0.175 | 0.861 |
| SES | 0.002 | 0.002 | 205.30 | 0.874 | 0.383 |
| LookingWindow1 | 0.057 | 0.065 | 628.30 | 0.882 | 0.378 |
| Age | –0.019 | 0.015 | 188.80 | –1.331 | 0.185 |
Table 11
Model parameters assessing the impact of air quality (AQI) on the baseline mixed-effects model assessing the effects of Year, Load, SES, LookingWindow1 and Age cohort on the first look change measure.
| Variable | Estimate | Std. Error | DF | t value | Pr(>|t|) |
|---|---|---|---|---|---|
| (Intercept) | 0.589 | 0.054 | 612.30 | 10.944 | <0.001 |
| Year | –0.030 | 0.013 | 967.10 | –2.395 | 0.017 |
| Load1 | 0.000 | 0.009 | 847.40 | –0.008 | 0.994 |
| Load2 | 0.002 | 0.009 | 848.30 | 0.182 | 0.855 |
| SES | 0.002 | 0.002 | 205.30 | 1.105 | 0.270 |
| LookingWindow1 | 0.062 | 0.065 | 626.90 | 0.952 | 0.341 |
| Age | –0.018 | 0.014 | 189.50 | –1.275 | 0.204 |
| AQI | 0.000 | 0.000 | 185.80 | 1.263 | 0.208 |
| Year:AQI | –0.001 | 0.000 | 968.20 | –1.402 | 0.161 |
Additional files
-
Supplementary file 1
Correlation table showing pairwise correlations for the key measures from the present study.
AQI = air quality index; SES = SES score from the Kuppuswamy scale; PropC = ‘first-look change’ change preference score; PropNC = ‘first-look no-change’ change preference score; SR = shift rate. First index number indicates load (1=Low, 2=Medium, 3=High) and second index number indicates year (1 or 2). Colors reflect the strength of the correlation (see bar).
- https://cdn.elifesciences.org/articles/83876/elife-83876-supp1-v1.docx
-
Supplementary file 2
Model assessing impact of air quality on change preference scores controlling for shift rate.
Model parameters for linear mixed-effect model assessing the impact of air quality (AQI) on the baseline change preference score model which included Year, Load, SES, Age Cohort, and LookingWindow1 as predictors, controlling for the shift rate (see Table 6).
- https://cdn.elifesciences.org/articles/83876/elife-83876-supp2-v1.docx
-
Supplementary file 3
Model assessing the impact of air quality on shift rate controlling for change preference scores.
Model parameters for linear mixed-effect model assessing the impact of air quality (AQI) on the baseline visual processing speed (shift rate) model which included Year, Load, SES, and Age Cohort as predictors, controlling for the change preference score (see Table 7).
- https://cdn.elifesciences.org/articles/83876/elife-83876-supp3-v1.docx
-
Supplementary file 4
Model parameters from linear model examining the effects of air quality on a change preference model in set size 2 only, across both years.
Parameters include year, SES, Looking window 1 and age cohort.
- https://cdn.elifesciences.org/articles/83876/elife-83876-supp4-v1.docx
-
Supplementary file 5
Full set of assessments carried out in Project INDIA (Infant Neural and Dyadic Interaction Assessment).
- https://cdn.elifesciences.org/articles/83876/elife-83876-supp5-v1.docx
-
MDAR checklist
- https://cdn.elifesciences.org/articles/83876/elife-83876-mdarchecklist1-v1.docx
Download links
A two-part list of links to download the article, or parts of the article, in various formats.
Downloads (link to download the article as PDF)
Open citations (links to open the citations from this article in various online reference manager services)
Cite this article (links to download the citations from this article in formats compatible with various reference manager tools)
Poor air quality is associated with impaired visual cognition in the first two years of life: A longitudinal investigation
eLife 12:e83876.
https://doi.org/10.7554/eLife.83876


