Lipid homeostasis is essential for a maximal ER stress response
- Department of Molecular & Cellular Biology, Howard Hughes Medical Institute, University of California, Berkeley, United States
- Leonard Davis School of Gerontology, University of Southern California, United States
Figures
Figure 1 with 1 supplement
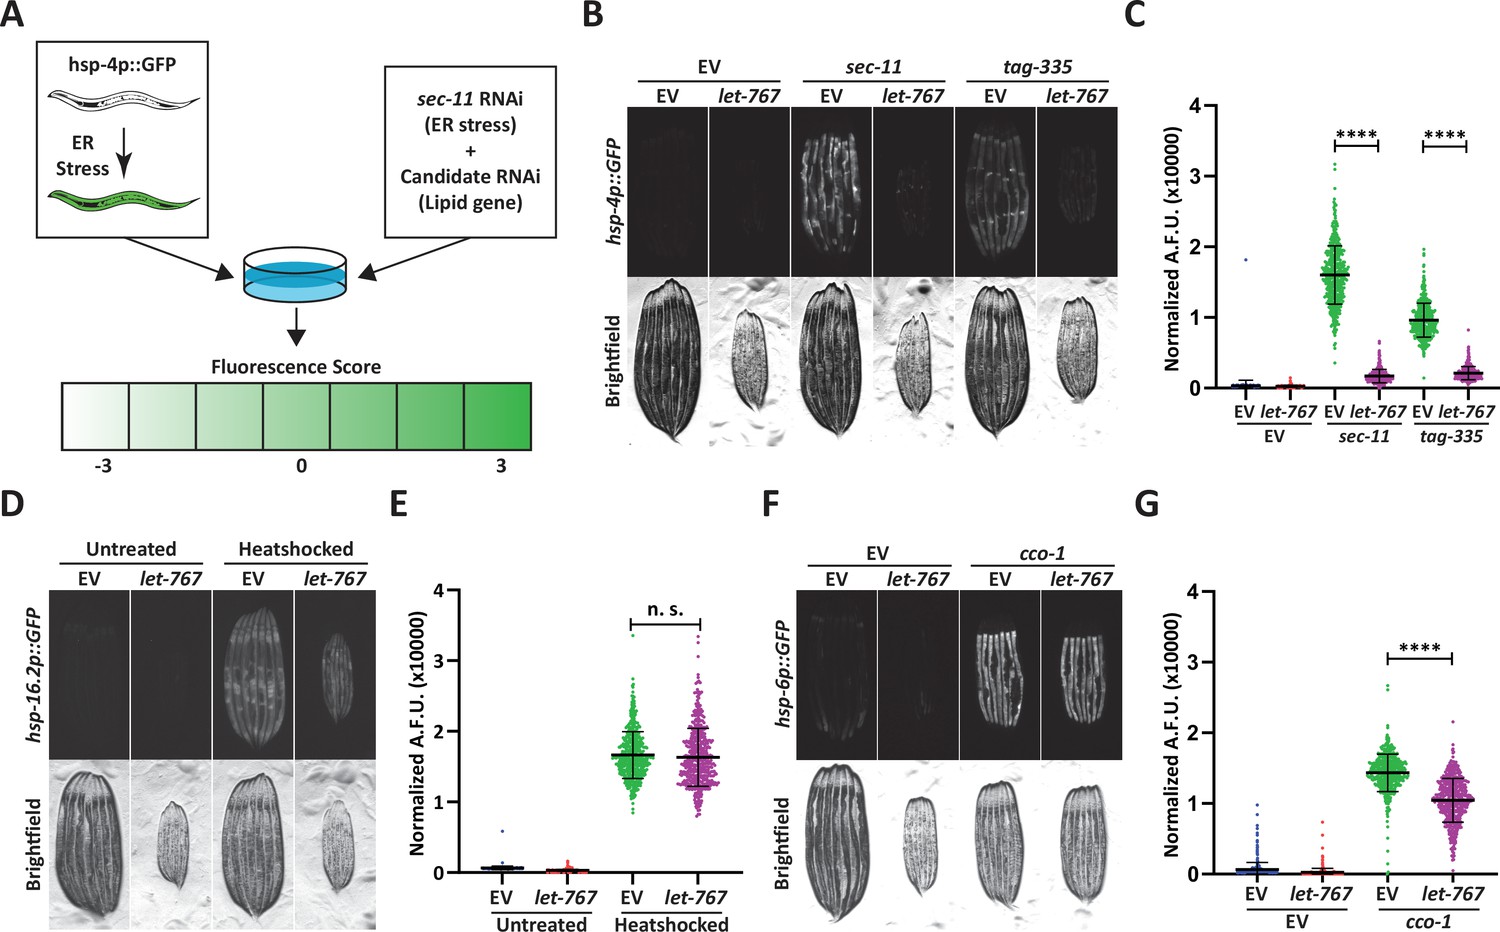
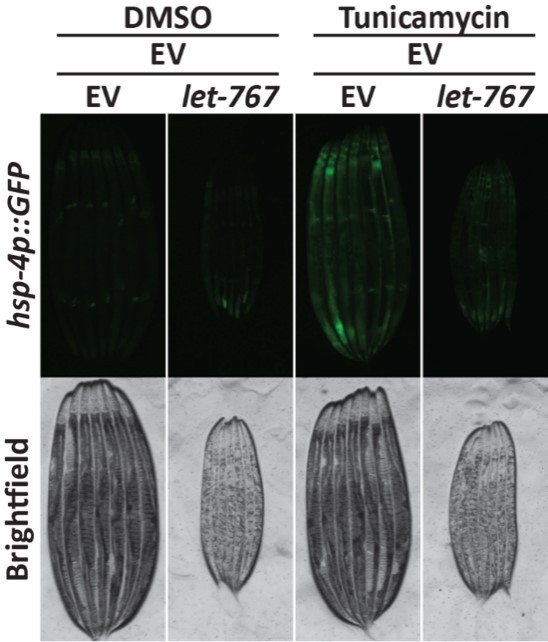
Knockdown of let-767 specifically suppresses the UPRER.
(A) Schematic for screening method used to identify UPRER modulators from candidate genes. Animals expressing hsp-4p::GFP were grown from L1 on candidate RNAi mixed in a 1:1 Ratio with ER stress inducing sec-11 RNAi. Animals were then screened at day 1 of adulthood and scored for changes in fluorescence compared to the sec-11/Empty Vector (EV) control. (B) Fluorescent micrographs of day 1 adult transgenic animals expressing hsp-4p::GFP grown from L1 on EV, sec-11, or tag-335 RNAi combined in a 1:1 ratio with either EV or let-767 RNAi to assay effects on UPRER induction. (C) Quantification of (B) normalized to size using a BioSorter. Lines represent mean and standard deviation. n=500. Mann-Whitney test p-value ****<0.0001. Representative data shown is one of three biological replicates. (D) Fluorescent micrographs of day 1 adult transgenic animals expressing hsp-16.2p::GFP grown from L1 on EV or let-767 RNAi with or without 2 hr 34 °C heat-shock treatment to assay heat shock response. Animals imaged 2 hr after recovery at 20 °C. (E) Quantification of (D) normalized to size using a BioSorter. Lines represent mean and standard deviation. n=400. Mann-Whitney test n.s.=not significant. Representative data shown is 1 of 3 biological replicates. (F) Fluorescent micrographs of day 1 adult transgenic animals expressing hsp-6p::GFP, grown from L1 on EV or cco-1 RNAi combined in a 1:1 ratio with either EV or let-767 RNAi to assay effects on UPRmt induction. (G) Quantification of (F) normalized to size using a BioSorter. Lines represent mean and standard deviation. n=431. Mann-Whitney test p-value ****<0.0001. Representative data shown is one of three biological replicates.
Figure 1—figure supplement 1
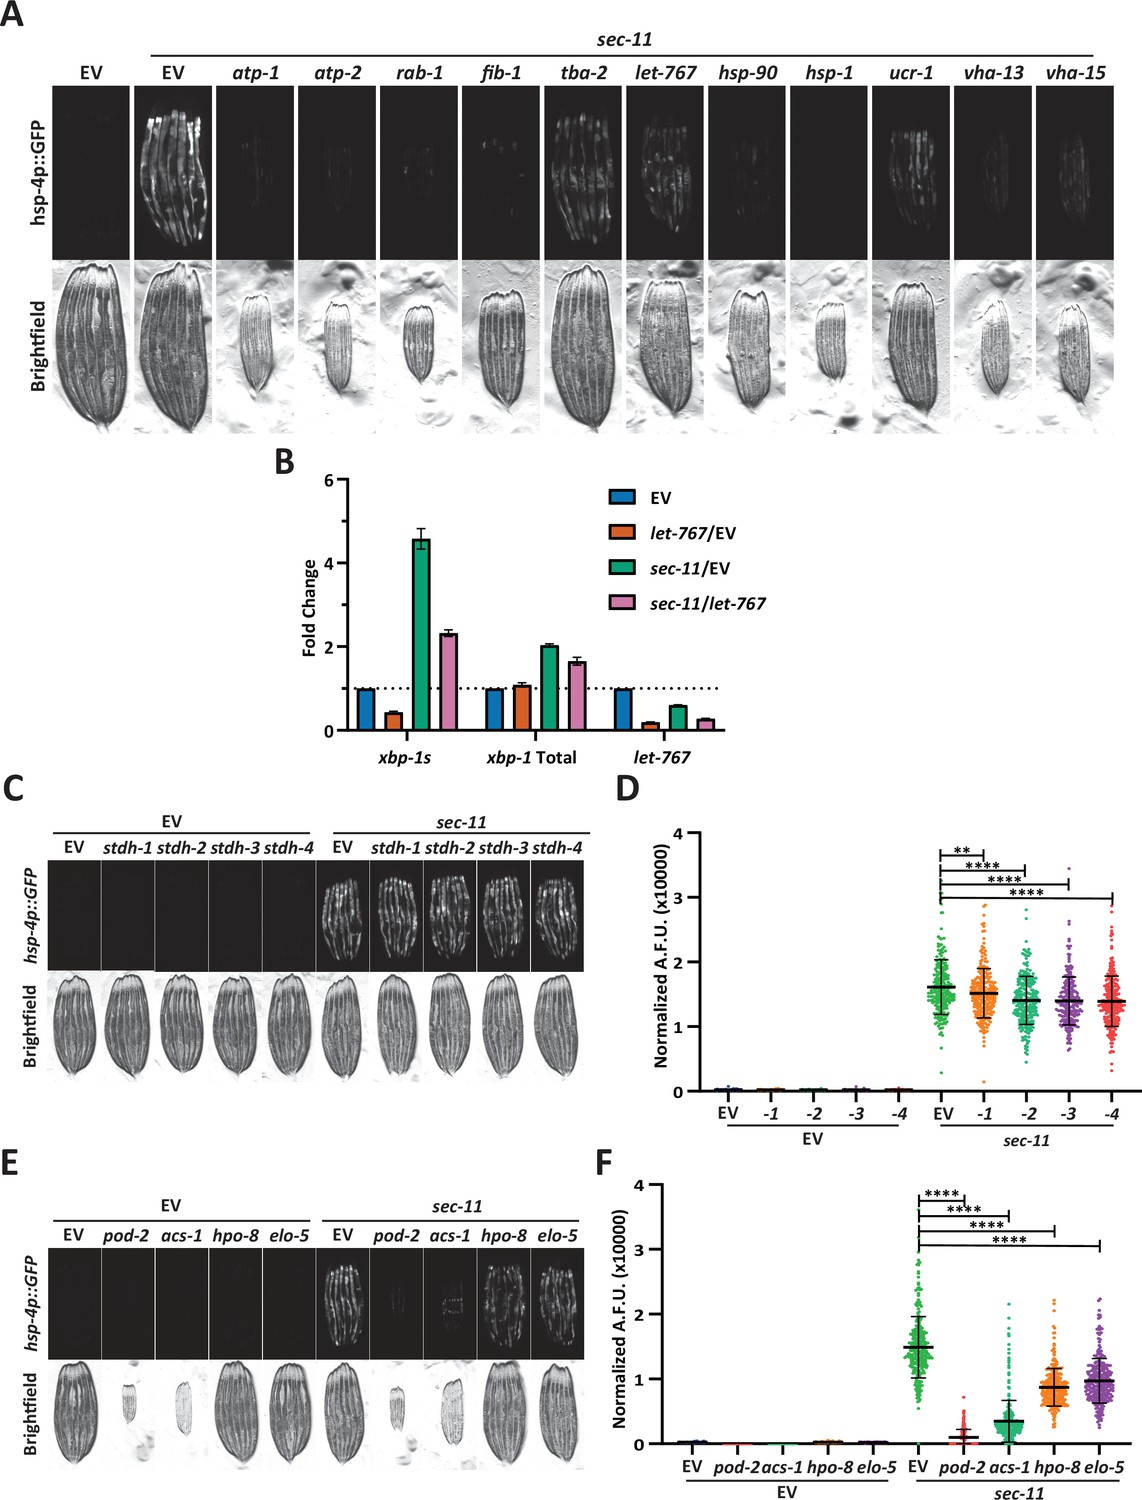
Knockdown of let-767 suppresses the UPRER more severely than other lipid related genes.
(A) Fluorescent micrographs of transgenic animals expressing hsp-4p::GFP grown from L1 on Empty Vector (EV) or sec-11 RNAi combined in a 1:1 ratio with either atp-1, atp-2, rab-1, fib-1, tba-2, let-767, hsp-90, hsp-1, ucr-1, vha-13, or vha-15 RNAi and imaged at day 1 of adulthood to assay effects on UPRER induction. (B) Quantitative RT-PCR transcript levels of xbp-1s, total xbp-1, and let-767 from day 1 adult N2 animals grown from L1 on EV or sec-11 RNAi combined in a 1:1 ratio with either EV or let-767 RNAi. Fold-change compared to EV treated N2 animals. Error bars indicate ± standard deviation across three biological replicates, each averaged from two technical replicates. (C) Fluorescent micrographs of day 1 adult transgenic animals expressing hsp-4p::GFP grown from L1 on EV, stdh-1, stdh-2, stdh-3, or stdh-4 RNAi combined in a 1:1 ratio with either EV or sec-11 RNAi to assay effects on UPRER induction. (D) Quantification of (C) normalized to size using a BioSorter. Lines represent mean and standard deviation. n=245. Mann-Whitney test p-value **<0.05, ****<0.0001. Representative data shown is one of three replicates. (E) Fluorescent micrographs of transgenic animals expressing hsp-4p::GFP grown from L1 on EV, pod-2, acs-1, hpo-8, or elo-5 RNAi combined in a 1:1 ratio with either EV or sec-11 RNAi to assay effects on UPRER induction. (F) Quantification of (E) normalized to size using a BioSorter. Lines represent mean and standard deviation. n=236. Mann-Whitney test p-value ****<0.0001. Representative data shown is one of three biological replicates.
Figure 2 with 1 supplement
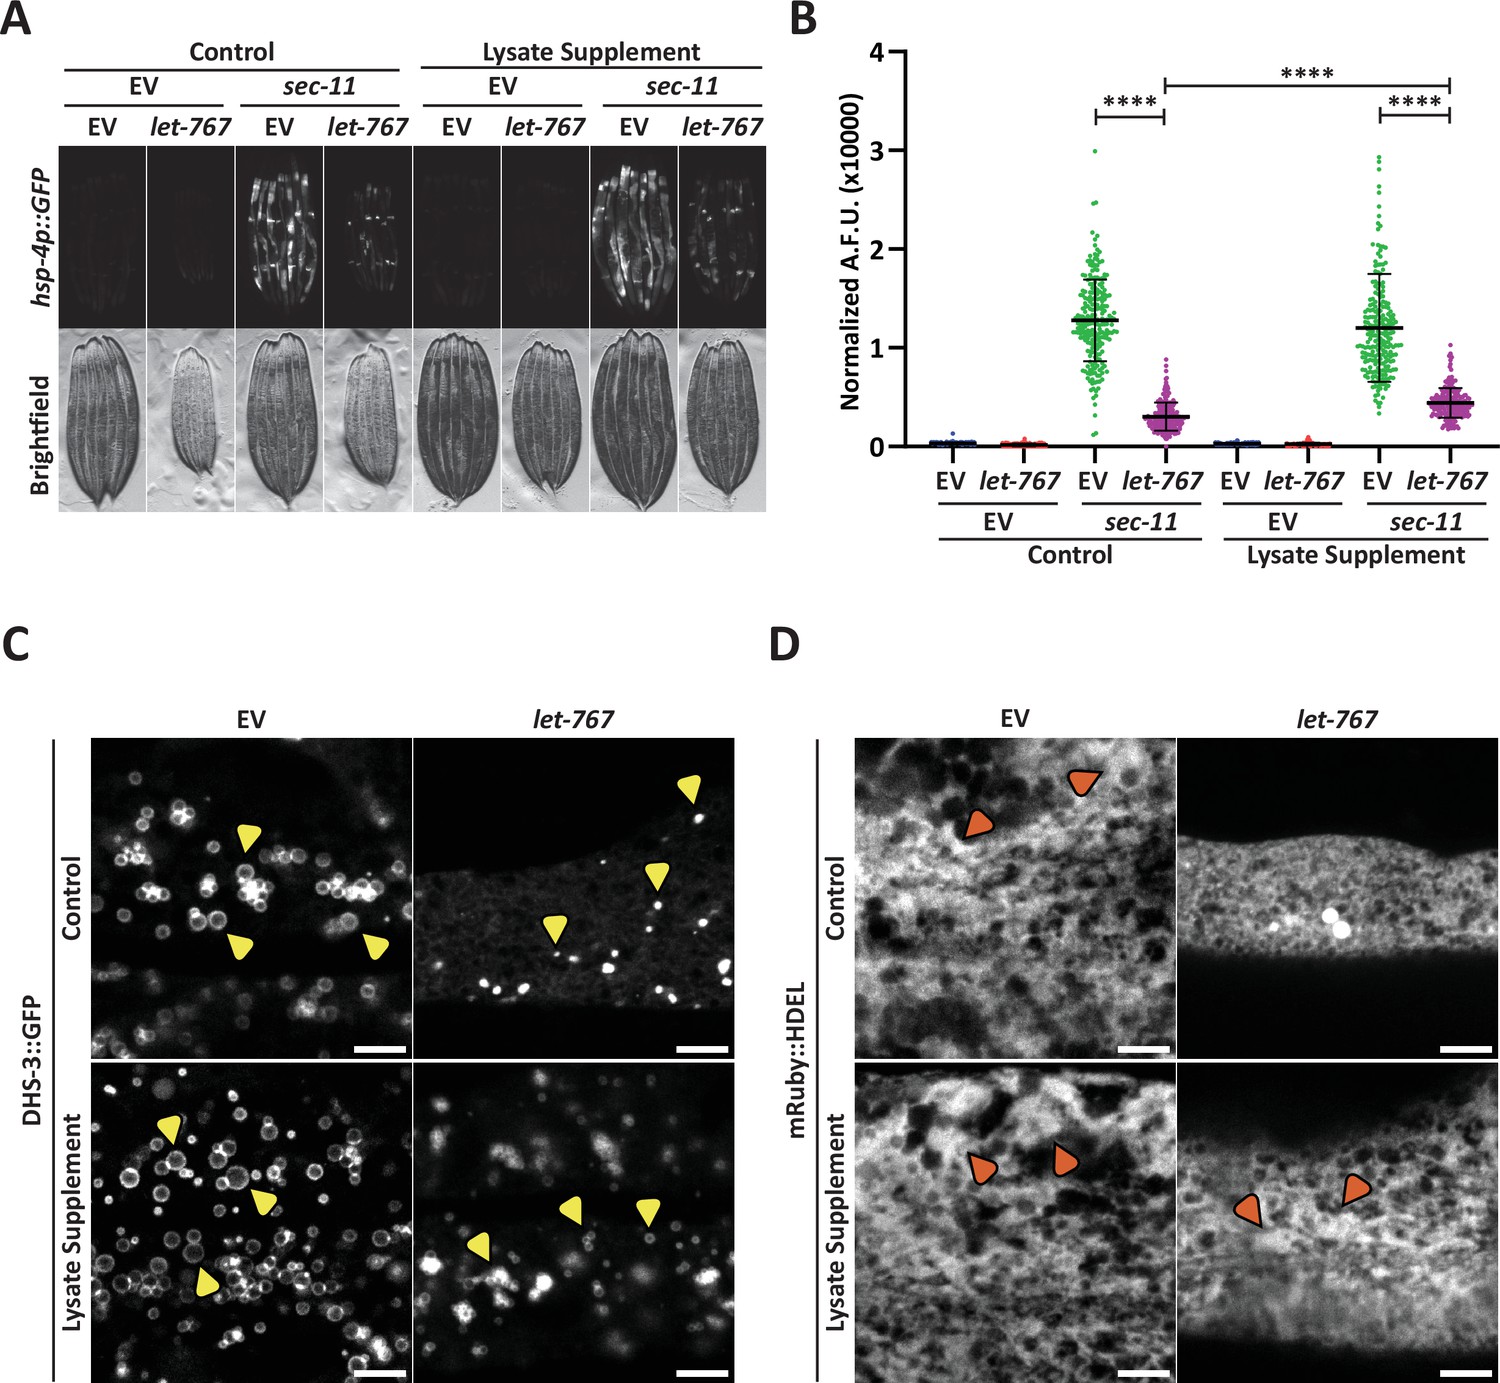
Supplementation of lysate does not restore the UPRER suppressed by let-767 RNAi.
(A) Fluorescent micrographs of transgenic animals expressing hsp-4p::GFP grown on Empty Vector (EV) or let-767 RNAi combined in a 1:1 ratio with either EV or sec-11 RNAi supplemented with vehicle or N2 lysate to assay effects on UPRER induction. (B) Quantification of (A) normalized to size using a BioSorter. Lines represent mean and standard deviation. n=189. Mann-Whitney test p-value ****<0.0001. Representative data shown is one of three biological replicates. (C) Representative fluorescent micrograph projections of day 1 adult transgenic animal expressing LD-localized dhs-3::GFP, grown on EV or let-767 RNAi with or without N2 lysate supplementation to assay LD quality. Yellow arrowheads point to example lipid droplets. Scale bar, 5 μm. (D) Representative fluorescent micrograph projections of day 1 adult transgenic animal expressing ER lumen-localized mRuby::HDEL, grown on EV or let-767 RNAi with or without N2 lysate supplementation to assay ER quality. Orange arrowheads point to wide ER structures. Scale bar, 5 μm. Images for organelle markers individually contrasted for clarity.
Figure 2—figure supplement 1
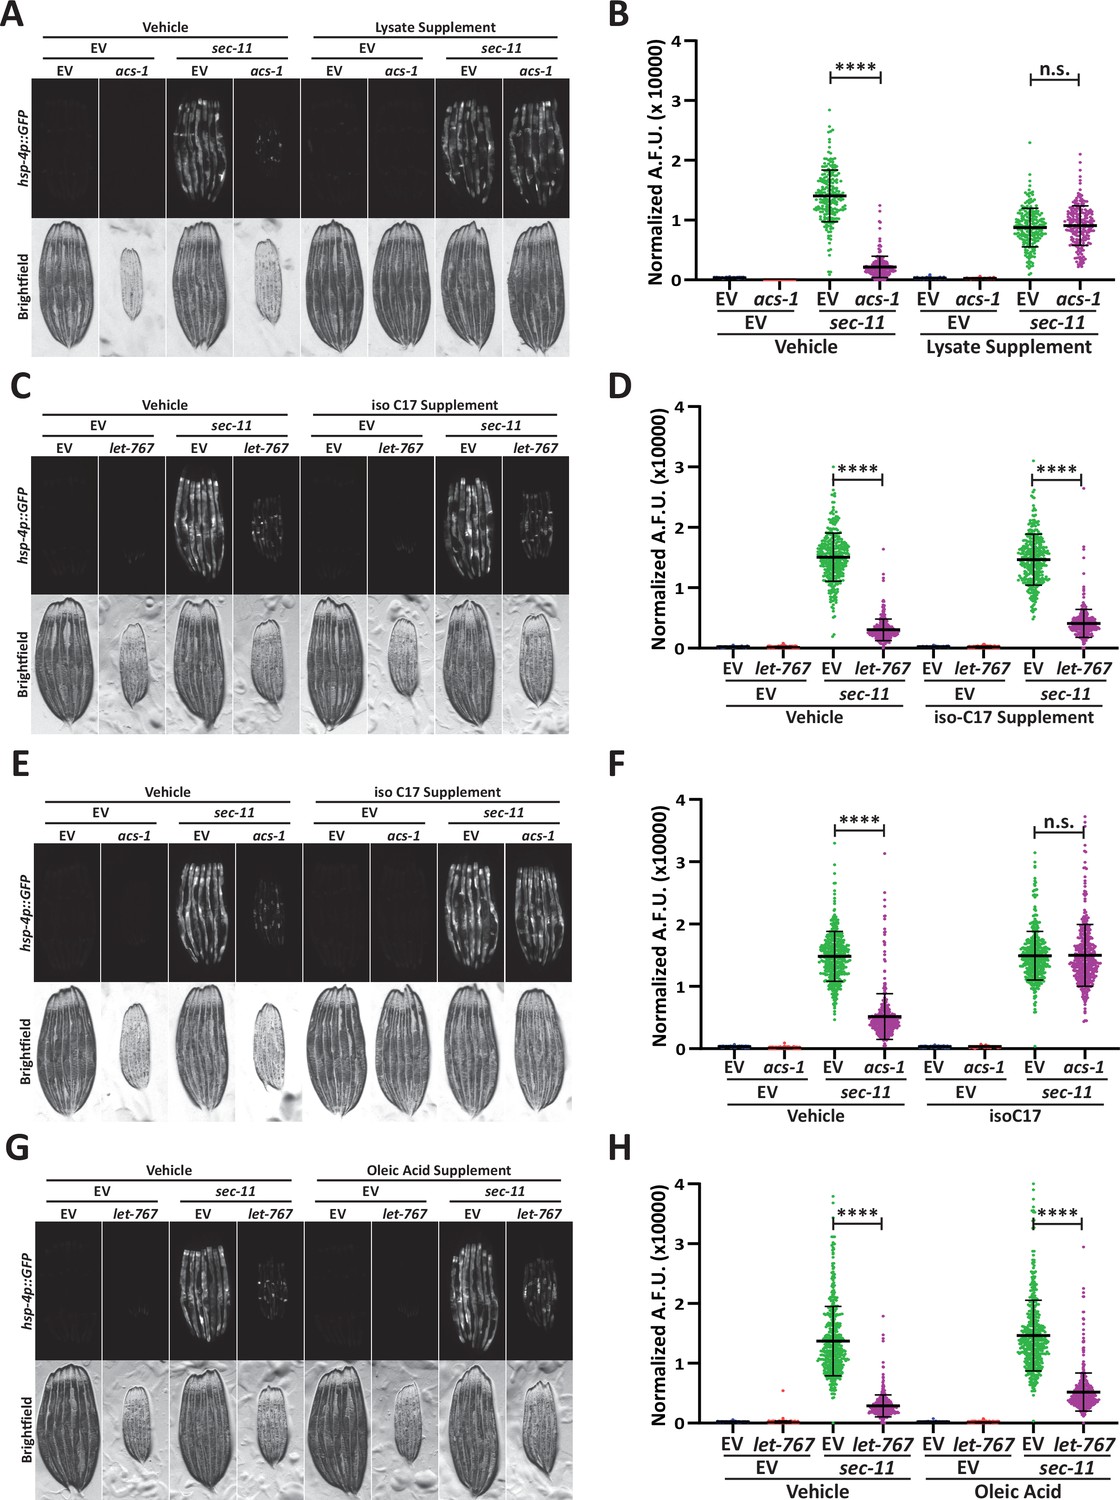
Supplementation of mmBCFA or oleic acid does not restore the UPRER suppressed by let-RNAi.
(A) Fluorescent micrographs of transgenic animals expressing hsp-4p::GFP grown on EV or acs-1 RNAi combined in a 1:1 ratio with either EV or sec-11 RNAi supplemented with vehicle or N2 lysate to assay supplementation efficacy. (B) Quantification of (A) normalized to size using a Biosorter. Lines represent mean and standard deviation. n=211. Mann-Whitney test p-value ****<0.0001. n.s.=non-significant. Representative data shown is one of three biological replicates. (C) Fluorescent micrographs of day 1 adult transgenic animals expressing hsp-4p::GFP grown on Empty Vector (EV) or let-767 RNAi combined in a 1:1 ratio with either EV or sec-11 RNAi grown with vehicle or 0.5 mM isoC17 to assay effects on UPRER induction. (D) Quantification of (C) normalized to size using a BioSorter. Lines represent mean and standard deviation. n=338. Mann-Whitney test p-value ****<0.0001. Representative data shown is one of three biological replicates. (E) Fluorescent micrographs of day 1 adult transgenic animals expressing hsp-4p::GFP grown on EV or acs-1 RNAi combined in a 1:1 ratio with either EV or sec-11 RNAi grown with vehicle or 0.5 mM isoC17 to assay effects on UPRER induction. (F) Quantifation of (E) normalized to size using a BioSorter. Lines represent mean and standard deviation. n=428. Mann-Whitney test p-value ****<0.0001, n.s.=non-significant. Representative data shown is one of three biological replicates. (G) Fluorescent micrographs of day 1 adult transgenic animals expressing hsp-4p::GFP grown on EV or let-767 RNAi combined in a 1:1 ratio with either EV or sec-11 RNAi grown with vehicle or 1 mM oleic acid to assay effects on the UPRER induction. (H) Quantification of (G) normalized to size using a BioSorter. Lines represent mean and standard deviation. n=461. Mann-Whitney test p-value ****<0.0001. Representative data shown is one of three biological replicates.
Figure 3
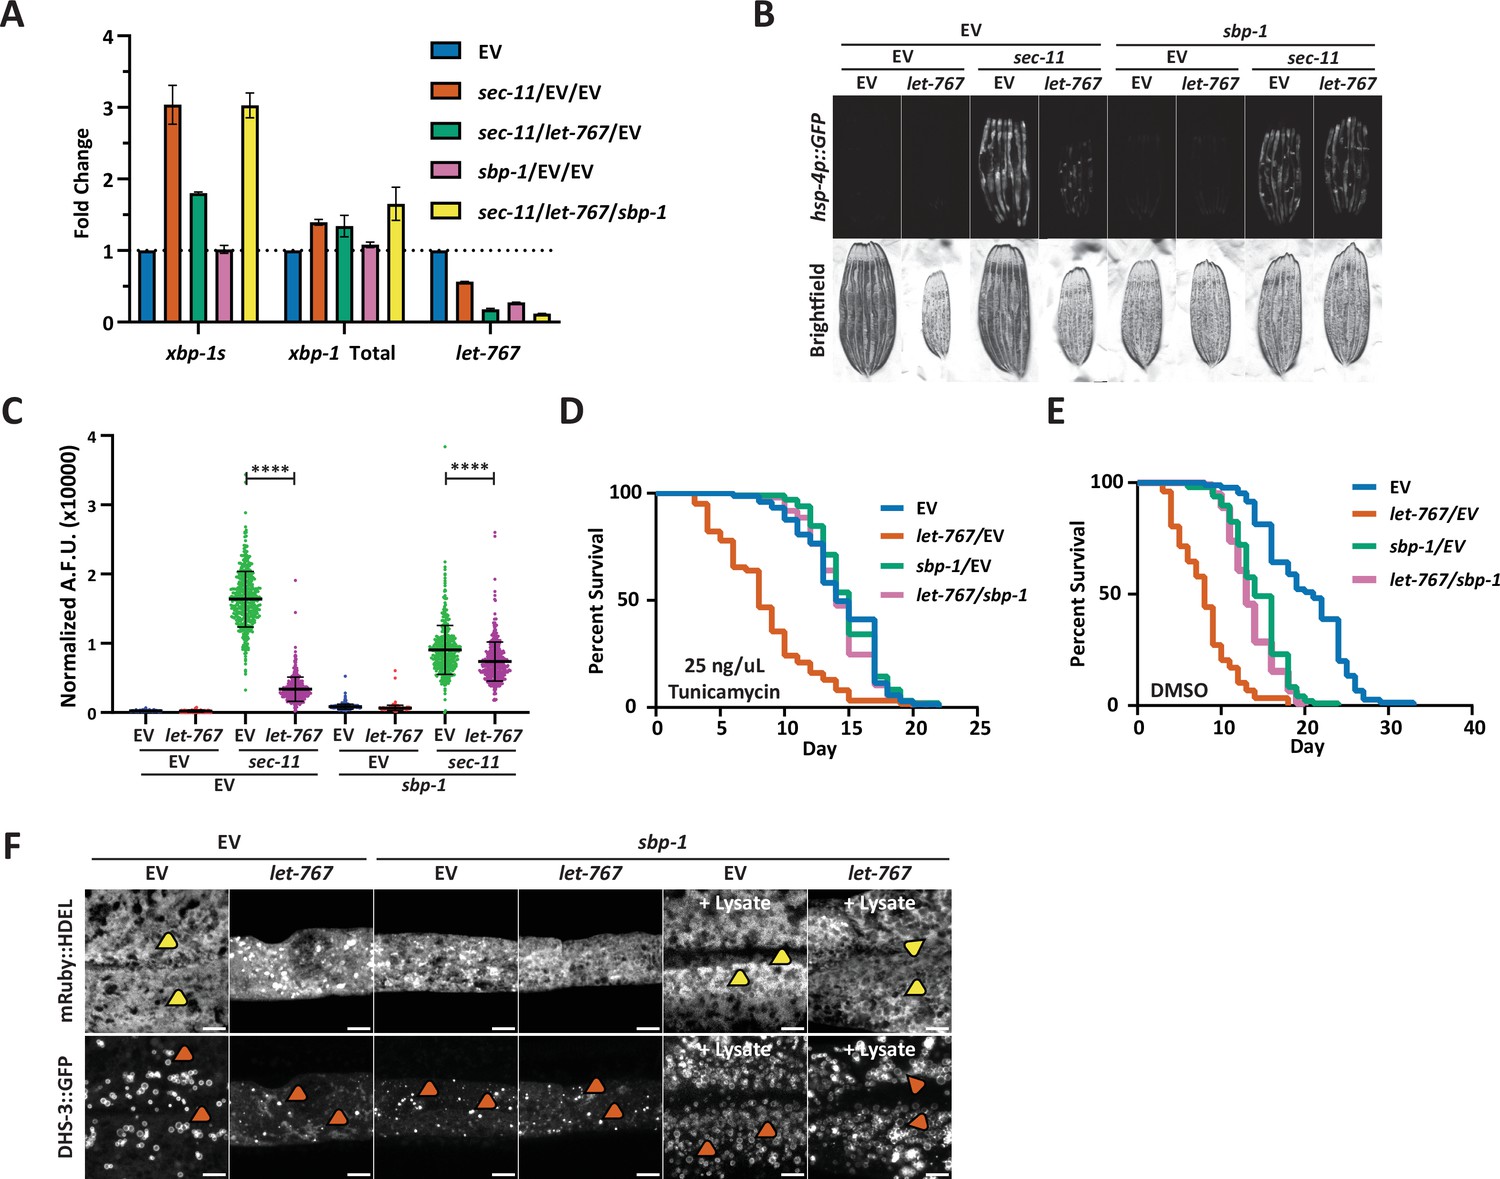
Reduced global lipid synthesis rescues the UPRER suppression caused by let-767 RNAi.
(A) Quantitative RT-PCR transcript levels of xbp-1 total, xbp-1s, and let-767 from day 1 adult N2 animals grown from L1 on EV, sec-11 and EV, let-767 and sec-11 RNAi combined with either EV or sbp-1 RNAi in a 1:1:1 ratio. Fold-change compared to EV treated N2 animals. Lines represent standard deviation across three biological replicates, each averaged from two technical replicates. (B) Fluorescent micrographs of day 1 adult transgenic animals expressing hsp-4p::GFP grown on EV, let-767, sec-11, and/or sbp-1 RNAi mixed in a 1:1:1 ratio to assay effects on the UPRER induction. (C) Quantification of (D) normalized to size using a BioSorter. Lines represent mean and standard deviation. n=426. Mann-Whitney test p-value ****<0.0001. Representative data shown is one of three biological replicates. (D–E) Concurrent survival assays of N2 animals transferred to ER stress conditions of 25 ng/uL Tunicamycin (D) or control DMSO (E) conditions at day 1 of adulthood. Animals continuously grown on EV or let-767 RNAi combined in 1:1 ratio with EV or sbp-1 RNAi from L1 synchronization. (F) Representative fluorescent micrograph projections of day 1 adult transgenic animal expressing ER lumen-localized mRuby::HDEL or LD-localized dhs-3::GFP, grown on EV or let-767 RNAi mixed in 1:1 ratio with sbp-1 RNAi with or without N2 lysate supplementation to assay ER and LD quality. Yellow arrowheads point to wide ER structures. Orange arrowheads point to lipid droplets. Scale bar, 5 μm. Images for organelle markers individually contrasted for clarity.
Figure 4
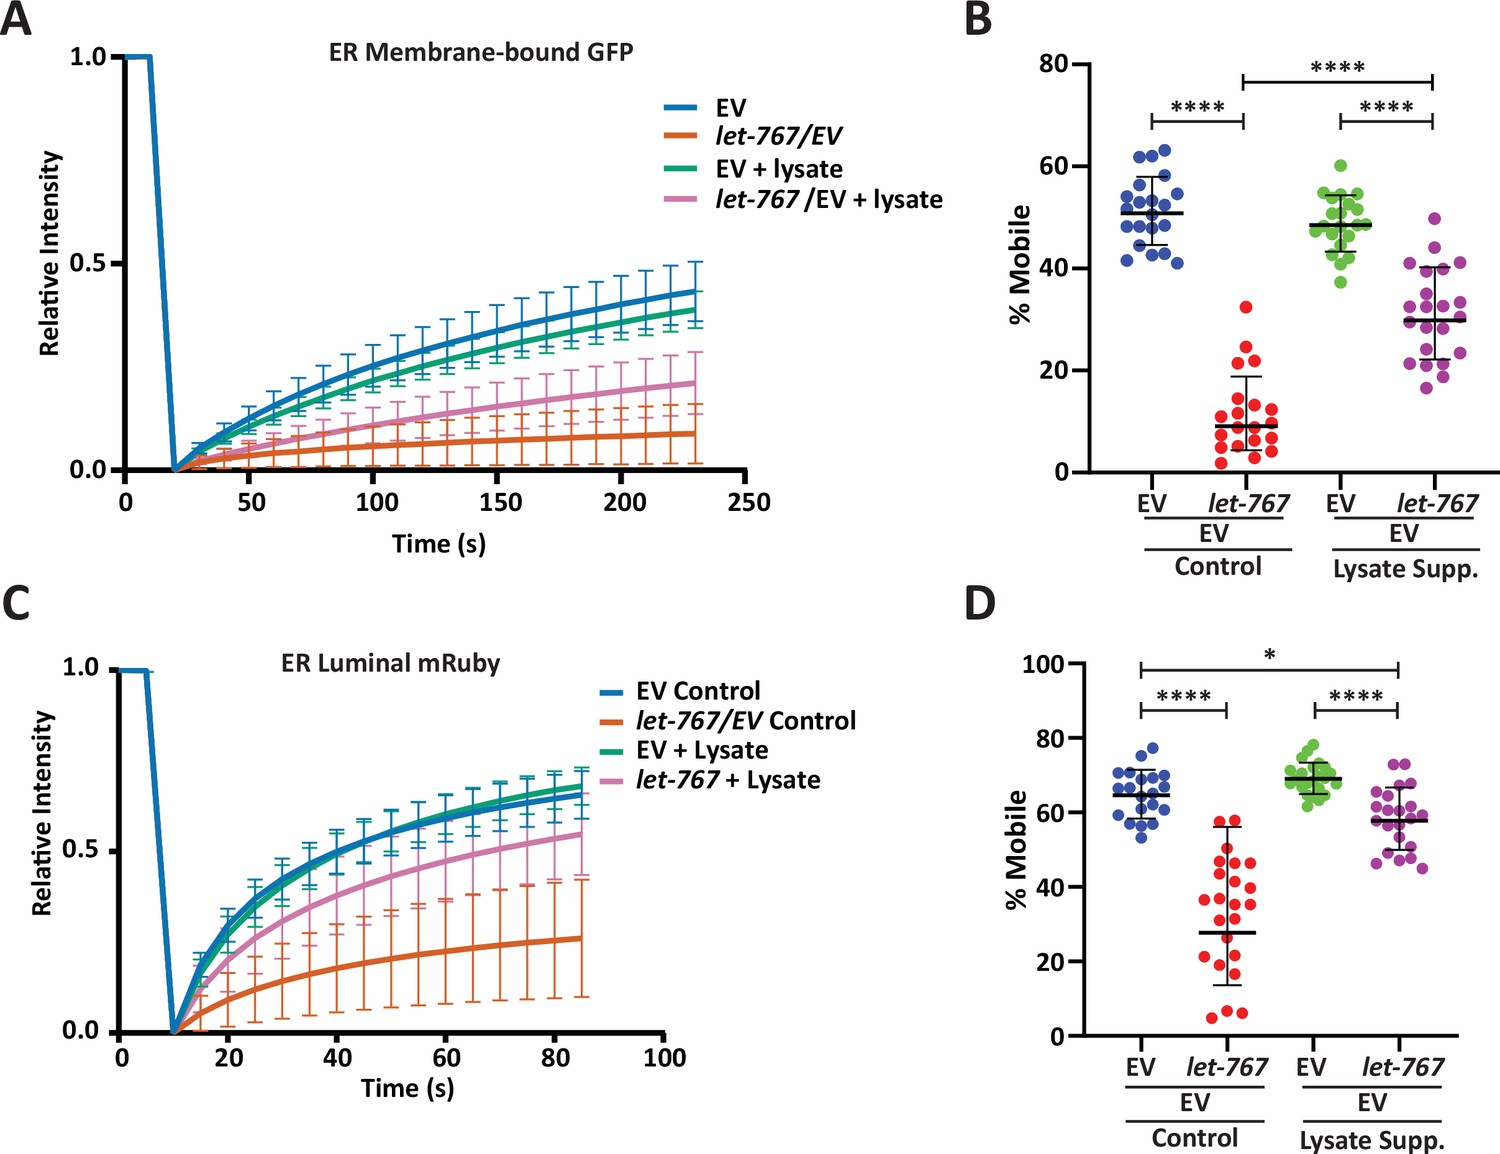
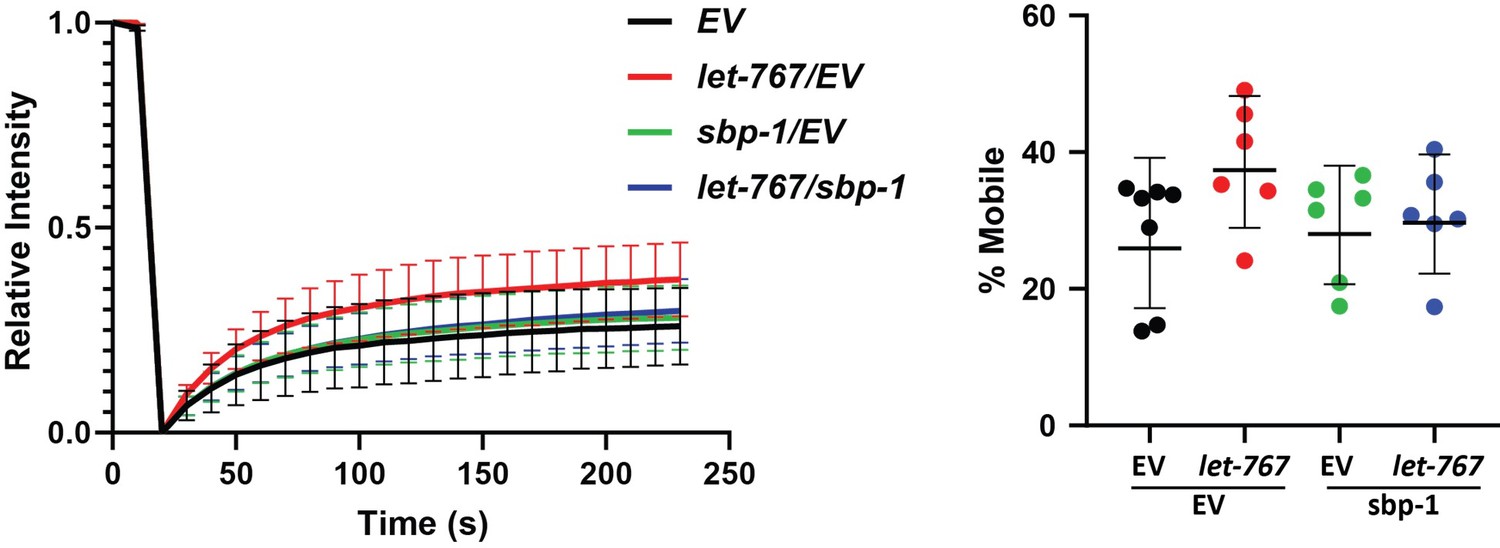
Lysate supplementation rescues luminal ER protein dynamics but not ER membrane protein dynamics.
(A) FRAP curve of intestinal ER-transmembrane protein, SPCS-1::GFP, from day 1 adult animals grown on Empty Vector (EV) or let-767 RNAi mixed with EV in a 1:1 ratio supplemented with vehicle or N2 lysate (geometric mean for n=20 pooled from two biological replicates). Lines represent geometric standard deviation. (B) Calculated percent mobile SPCS-1::GFP of (A). Lines represent geometric mean and geometric standard deviation. Mann-Whitney test p-value ****<0.0001. (C) FRAP curve of intestinal ER-lumen protein, mRuby::HDEL, from day 1 adult animals grown on EV or let-767 RNAi mixed with EV in a 1:1 ration supplemented with vehicle or N2 lysate (geometric mean for n=20 pooled from two biological replicates). Lines represent geometric standard deviation. (D) Calculated percent mobile mRuby::HDEL of (A). Lines represent geometric mean and geometric standard deviation. Mann-Whitney test p-value ****<0.0001 and *<0.05.
Figure 5 with 1 supplement
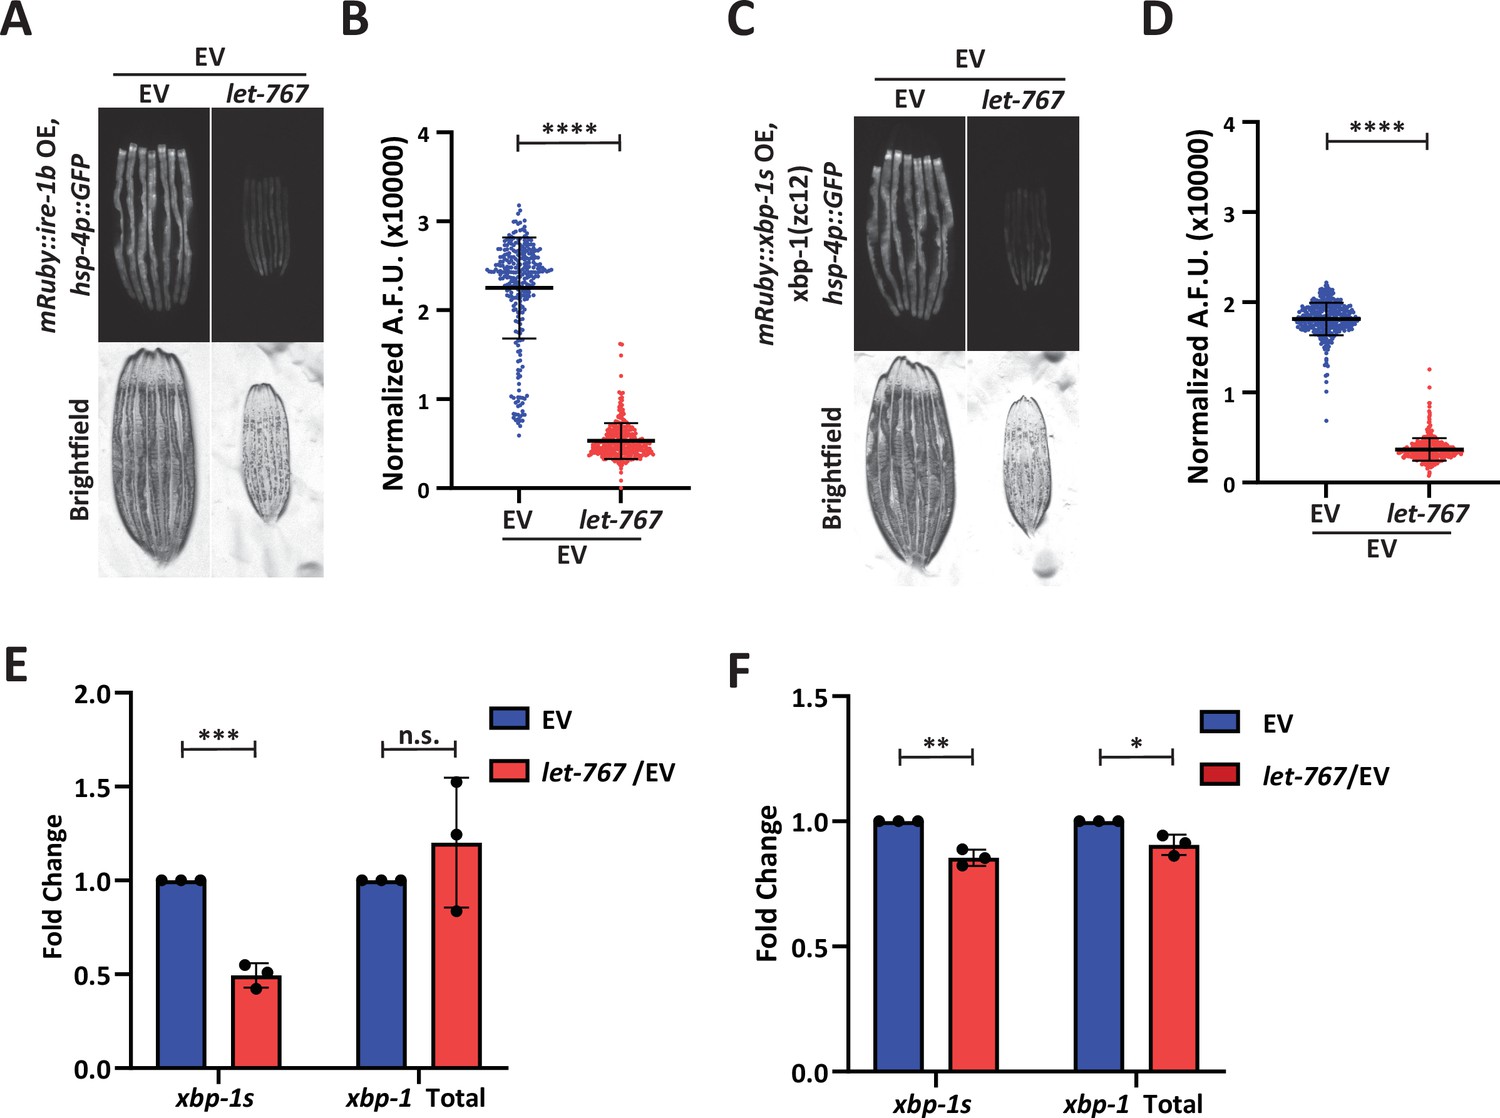
let-767 knockdown impacts UPRER induction independent of xbp-1 splicing.
(A) Fluorescent micrographs of day 1 adult transgenic animals expressing hsp-4p::GFP and intestinal mRuby::ire-1b grown on Empty Vector (EV) or let-767 RNAi mixed with EV in a 1:1 ratio to assay the UPRER induction. (B) Quantification of (A) normalized to size using a BioSorter. Lines represent mean and standard deviation. n=290. Mann-Whitney test P-value ****<0.0001. Representative data shown is 1 of 3 biological replicates. (C) Fluorescent micrographs of day 1 adult xbp-1(zc12) transgenic animals expressing hsp-4p::GFP and intestinal mRuby::xbp-1s grown on EV or let-767 RNAi mixed with EV in a 1:1 ratio to assay the UPRER induction. (D) Quantification of (C) normalized to size using a BioSorter. Lines represent mean and standard deviation. n=398. Mann-Whitney test p-value ****<0.0001. Representative data shown is one of three biological replicates. (E) Quantitative RT-PCR transcript levels of xbp-1s and total xbp-1 from day 1 adult mRuby::ire-1b animals grown from L1 on let-767 RNAi mixed 1:1 with EV. Fold-change compared to EV treated animals.Unpaired t-test p-value ***<0.0005. Error bars indicate ± standard deviation across three biological replicates, each averaged from two technical replicates. (F) Quantitative RT-PCR transcript levels of xbp-1s and total xbp-1 from day 1 adult mRuby::xbp-1s animals grown from L1 on let-767 RNAi mixed 1:1 with EV. Fold-change compared to EV treated animals. Unpaired t-test p-value **<0.005 and *<0.05. Error bars indicate ± standard deviation across three biological replicates, each averaged from two technical replicates. Dots indicate averaged biological replicate values.
Figure 5—figure supplement 1
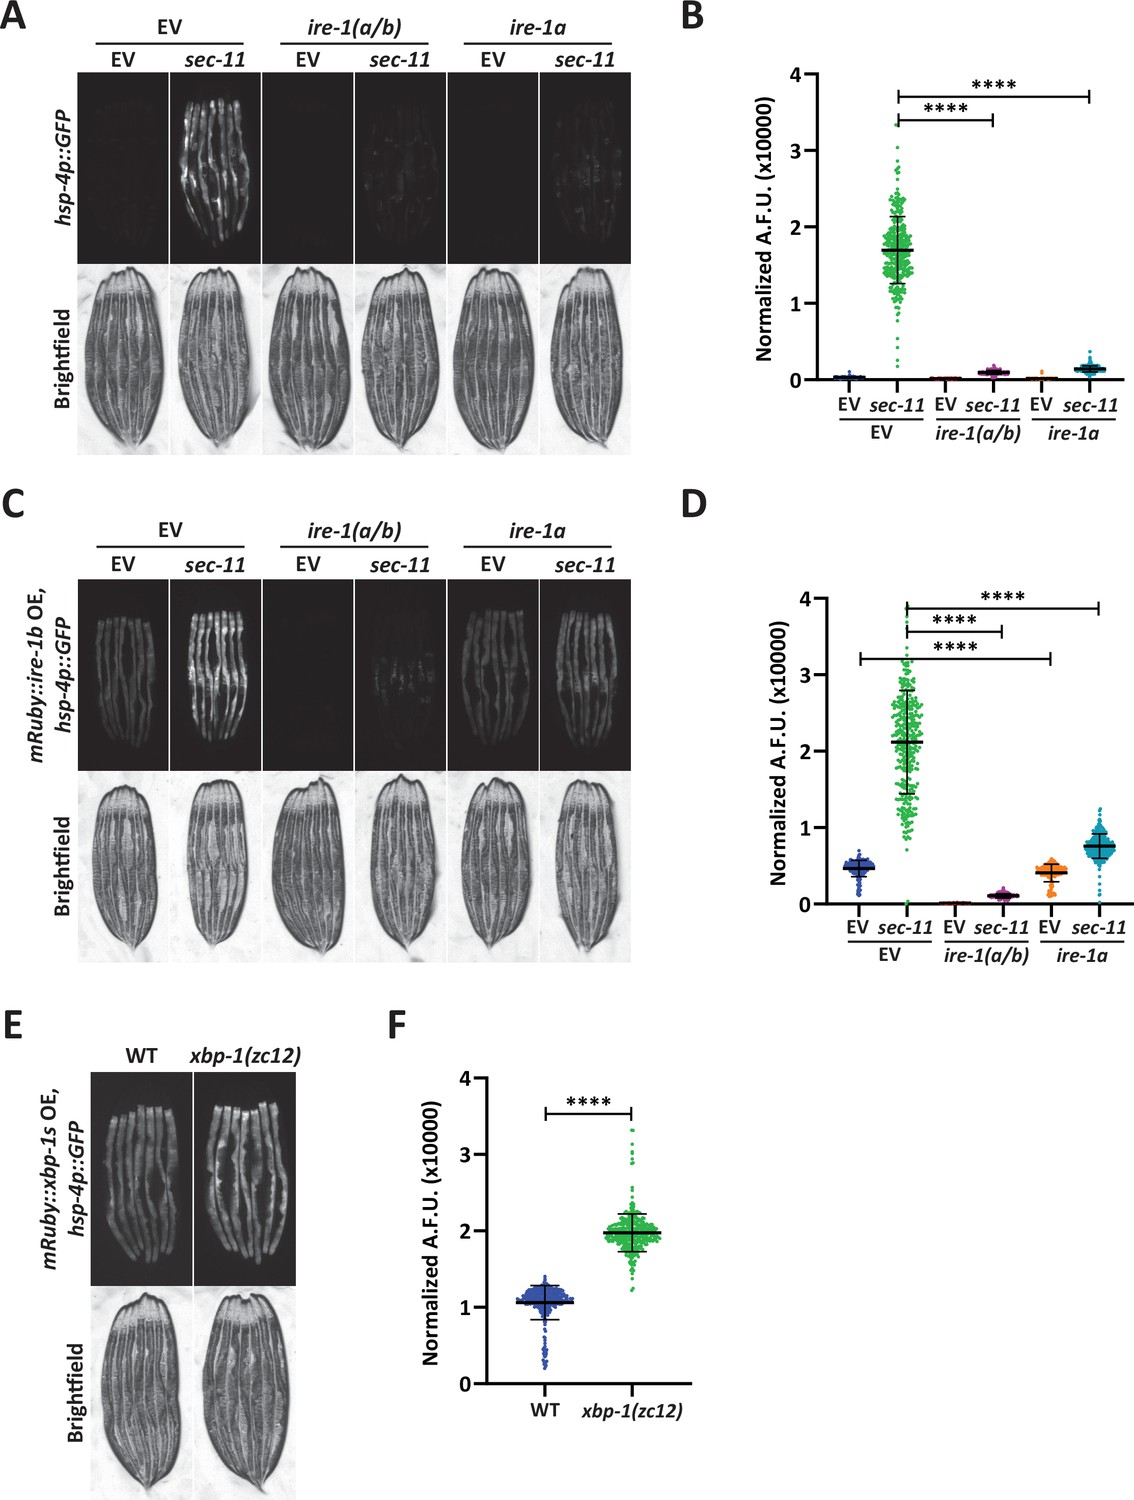
Overexpression of ire-1b or xbp-1s induces the UPRER independently of endogenous ire-1a or xbp-1, respectively.
(A) Fluorescent micrographs of transgenic animals expressing hsp-4p::GFP grown on Empty Vector (EV), ire-1, or ire-1a RNAi combined with either EV or sec-11 RNAi to assay the UPRER induction. (B) Quantification of (A) normalized to size using a BioSorter. Lines represent mean and standard deviation. n=321. Mann-Whitney test p-value ****<0.0001. Representative data shown is one of three replicates. (C) Fluorescent micrographs of day 1 adult transgenic animals expressing hsp-4p::GFP and intestinal mRuby::ire-1b grown on EV, ire-1, or ire-1a RNAi combined with either EV or sec-11 RNAi to assay the UPRER induction. (D) Quantification of (C) normalized to size using a BioSorter. Lines represent mean and standard deviation. n=344. Mann-Whitney test p-value ****<0.0001. Representative data shown is one of three replicates. (E) Fluorescent micrographs of day 1 adult transgenic animals expressing hsp-4p::GFP and intestinal mRuby::xbp-1s in a WT or xbp-1 (zc12) null-mutant background grown on EV to assay the UPRER induction. (F) Quantification of (E) normalized to size using a BioSorter. Lines represent mean and standard deviation. n=367. Mann-Whitney test p-value ****<0.0001. Representative data shown is one of three biological replicates.
Figure 6
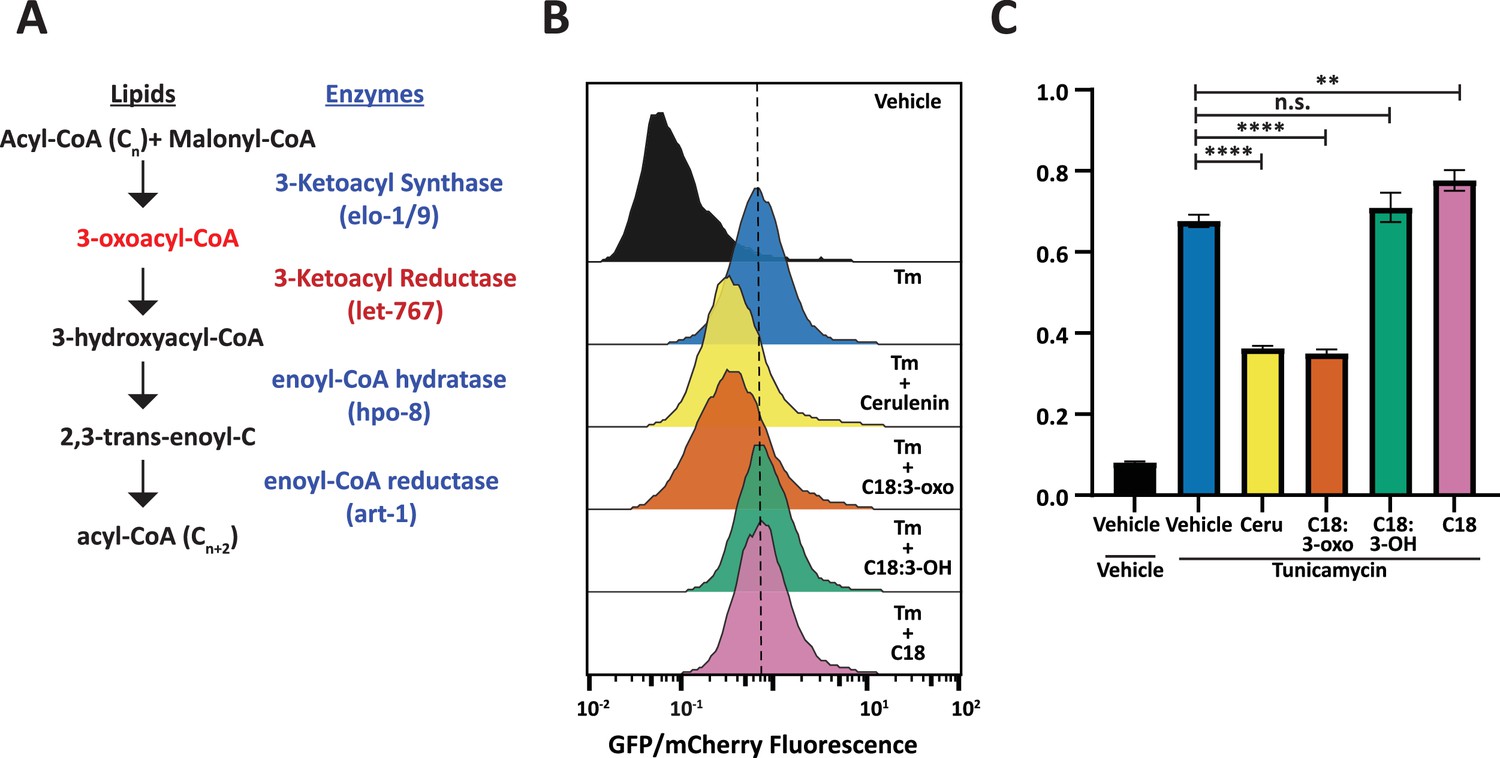
Fatty acid intermediate, 3-oxoacyl, is sufficient to reduce UPRER induction.
(A) Fatty acid elongation pathway displaying intermediate lipid metabolites and annotated C. elegans genes. (B) Flow cytometry measurement histogram of huh7 UPRE reporter fluorescence normalized to EIF2A promoter driving mCherry. Cells were treated for 18 hr with Tunicamycin and vehicle, 50 μM Cerulenin, 50 μM 3-oxostearic acid, 50 μM stearic acid, or 50 μM 3-hydroxystearic acid. Data is representative of three biological replicates. (C) Median bar graph of (B). Unpaired t-test p-value **=0.004 and ****<0.0001. Error bars indicate ± standard deviation across three technical replicates.
Figure 7
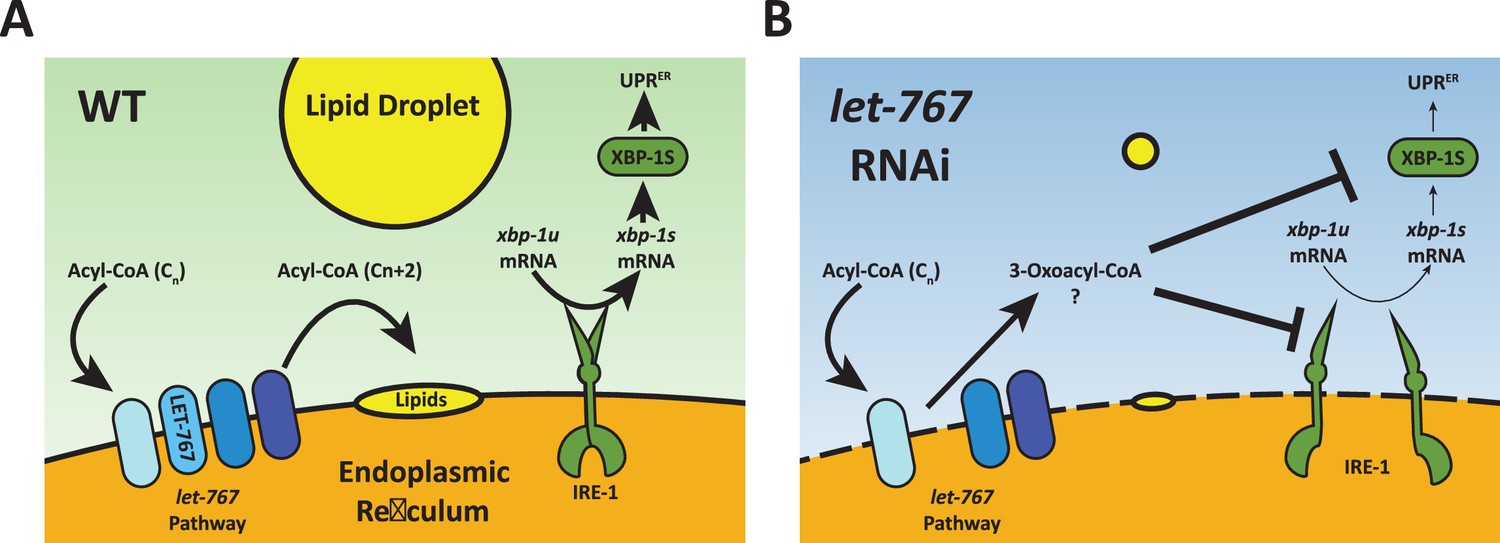
Model for let-767 RNAi blocking UPRER induction.
(A) Under WT condition, acyl-CoA metabolites are elongated by the let-767/HSD17B12 pathway and utilized at the membrane to synthesize other lipids such as neutral lipids stored in lipid droplets. IRE-1 responds to ER stress by splicing xbp-1u to xbp-1s, which is then translated and able to induce expression of the UPRER target genes (B) Knockdown of let-767 results in disequilibrium of let-767/HS17B12 pathway, leading to accumulation of intermediates such as 3-oxoacyl-CoA and reduced lipid production. Intermediate metabolites disrupt membrane quality (dashed line) and negatively affect induction of the UPRER by reducing splicing of xbp-1s (smaller arrows) by IRE-1 and reducing the function of xbp-1s post-splicing (smaller arrows).
Author response image 1

Author response image 2

Author response image 3
Author response image 4
Author response image 5

Author response image 6

Additional files
-
Supplementary file 1
Candidate LD proteins identified by proteome meta-analysis and screen score.
Proteins identified in meta-analysis of published LD isolation proteomes (Zhang et al., 2012; Na et al., 2015; Vrablik et al., 2015). Gene description, screen score (scored ±3 in 0.5 increments in comparison to Empty Vector/sec-11 RNAi control), and approximated developmental stage at time of screen noted. N/A corresponds to genes not screened due to RNAi availability.
- https://cdn.elifesciences.org/articles/83884/elife-83884-supp1-v1.xlsx
-
Supplementary file 2
Statistical analysis of tunicamycin survival assay data.
Median lifespan, death events counted, and statistics for tunicamycin survival assay of worms grown on Empty Vector (EV) or let-767 RNAi combined with EV or sbp-1 RNAi.
- https://cdn.elifesciences.org/articles/83884/elife-83884-supp2-v1.xlsx
-
Supplementary file 3
Untargeted lipidomic analysis of let-767 RNAi treated animals.
Normalized values and fold change of identified lipids from let-767 RNAi treated animals compared to EV controls at day 1 of adulthood. Standard deviation and averages calculated from 6 biological replicates.
- https://cdn.elifesciences.org/articles/83884/elife-83884-supp3-v1.xlsx
-
Transparent reporting form
- https://cdn.elifesciences.org/articles/83884/elife-83884-transrepform1-v1.pdf
-
Source data 1
Unprocessed lipidomic source data of day 1 adult animals.
Unprocessed lipidomic analysis data from animals grown on Empty Vector control or let-767 RNAi and collected at day 1 of adulthood.
- https://cdn.elifesciences.org/articles/83884/elife-83884-data1-v1.xlsx
Download links
A two-part list of links to download the article, or parts of the article, in various formats.
Downloads (link to download the article as PDF)
Open citations (links to open the citations from this article in various online reference manager services)
Cite this article (links to download the citations from this article in formats compatible with various reference manager tools)
Lipid homeostasis is essential for a maximal ER stress response
eLife 12:e83884.
https://doi.org/10.7554/eLife.83884


