Sensory experience controls dendritic structure and behavior by distinct pathways involving degenerins
- Department of Biology, Technion-Israel Institute of Technology, Israel
- ICFO - Institut de Ciencies Fotoniques, The Barcelona Institute of Science and Technology, Spain
- Department of Brain Sciences, Weizmann Institute of Science, Israel
- Department of Molecular Neuroscience, Weizmann Institute of Science, Israel
Figures
Figure 1 with 1 supplement
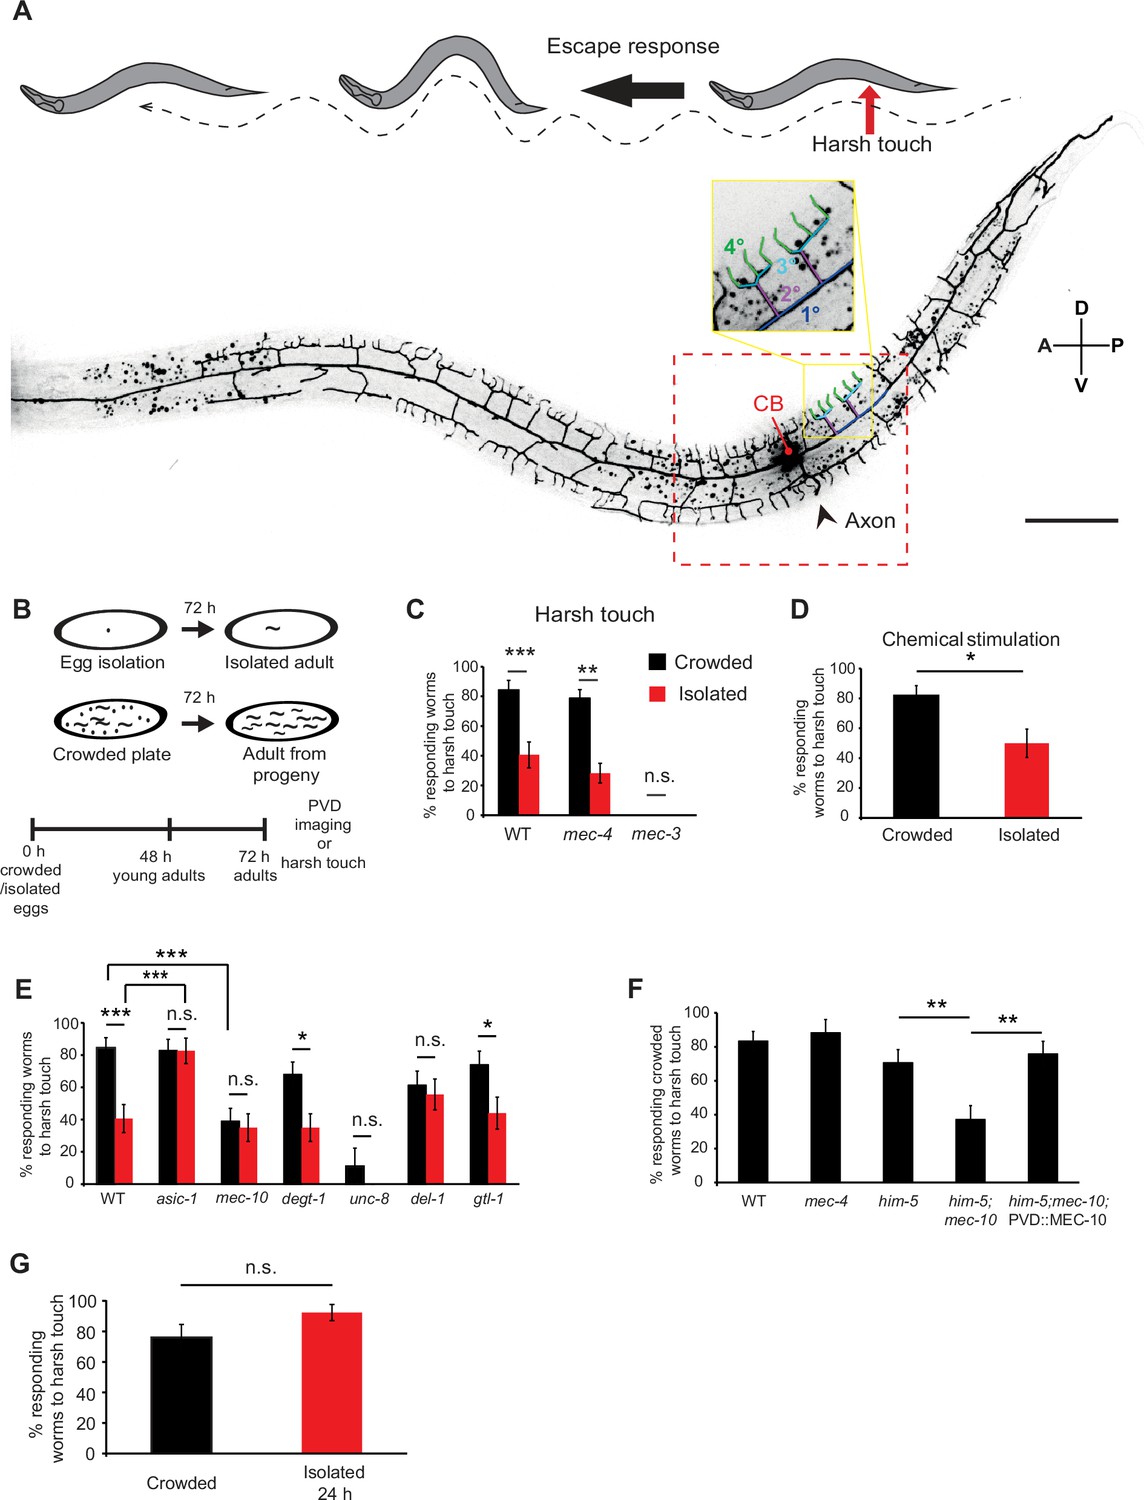
Mechanosensory deprivation during development reduces the behavioral response of the PVD neuron.
(A) The PVD neuron dendritic tree, cell body (CB), and axon. The red arrow corresponds to the contact point with a platinum wire during posterior harsh touch, while the black arrow represents the behavioral escape response of the worm. The red dashed square represents the analyzed region around the CB. One representative candelabrum is colored by branch orders: blue primary (1°), purple secondary (2°), cyan tertiary (3°), and green quaternaries (4°). A – anterior; P – posterior; D – dorsal; V – ventral (scale bar, 50 µm). (B) Schematic of the isolation protocol followed at 72 hr by posterior harsh touch assay or PVD imaging of adult worms. (C) Isolation of embryos reduced the percentage of worms responding to harsh touch at adulthood. Crowded – black bars, Isolated – red bars. Wildtype (WT) N2 worms (Crowded, n = 32; Isolated, n = 32), mec-4 (Crowded, n = 52; Isolated, n = 46), and mec-3 (Crowded, n = 12; Isolated, n = 12). mec-4 animals were assayed as adults after 96 hr to account for their slower rate of growth. (D) Growth in plates with chemical cues from adult hermaphrodites did not alter the reduced response rate of isolated mec-4 animals to harsh touch (Crowded, n = 33; Isolated, n = 28). (E) Harsh touch response in crowded and isolated conditions for mutants of different DEG–ENaCs and the transient receptor potential (TRP) channel gtl-1. WT worms (same set of worms as in (C)). Crowded, n = 32; Isolated, n = 32, asic-1 (Crowded, n = 46; Isolated, n = 30), mec-10 (Crowded, n = 38; Isolated, n = 31), degt-1 (Crowded, n = 37; Isolated, n = 31), unc-8 (Crowded, n = 18; Isolated, n = 15), del-1 (Crowded, n = 31; Isolated, n = 27), and gtl-1 (Crowded, n = 27; Isolated, n = 25). (F) MEC-10 expression in the PVD rescues mec-10 mutants’ crowded-specific reduction in response to harsh touch. All strains contain the ser2Prom3::Kaede PVD marker construct, and were tested in the crowded conditions. WT, n = 42; mec-4, n = 17; him-5, n = 34 (him-5 was used as WT background for several strains after cross); him-5; mec-10, n = 35; him-5; mec-10; ser2Prom3::mec-10, n = 33. (G) Isolation for 24 hr in adulthood did not affect the response to harsh touch. Worms grown under crowded conditions were isolated for 24 hr as young adults and compared against their crowded age-matched counterparts in their response to harsh touch (Crowded, n = 25; Isolated for 24 hr, n = 26). The proportion of responding worms (percentage) ± standard error of proportion is shown. Fisher’s exact test, *p < 0.05, **p < 0.01, ***p < 0.001, n.s., not significant.
-
Figure 1—source data 1
Original data file for Figure 1 graphs on mechanosensory deprivation during development reduces the behavioral response of the PVD neuron.
- https://cdn.elifesciences.org/articles/83973/elife-83973-fig1-data1-v2.xlsx
Figure 1—figure supplement 1
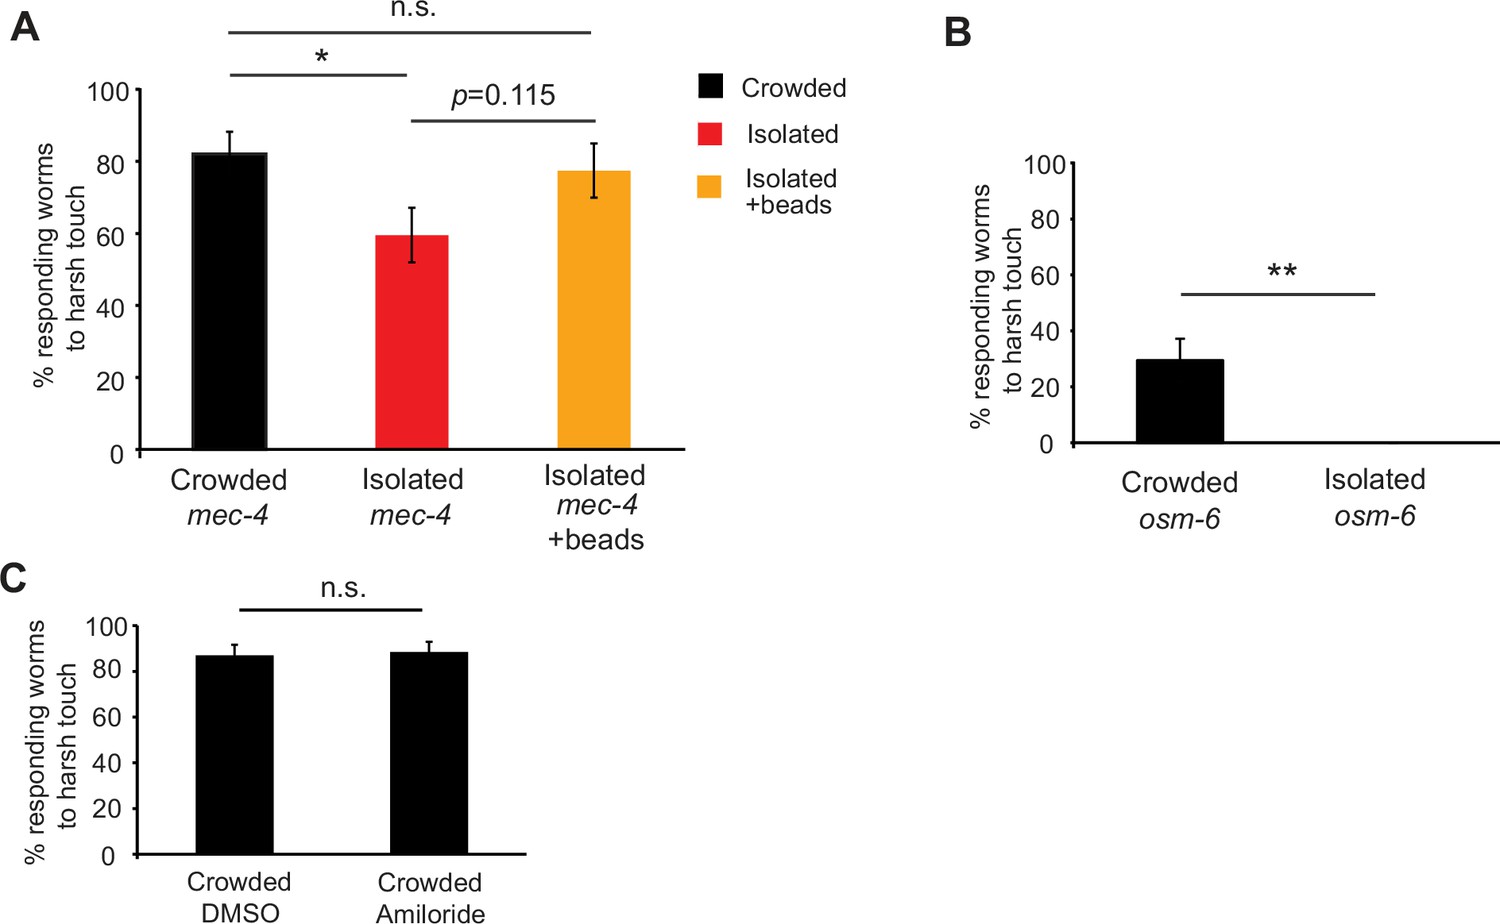
The reduction in response to harsh touch following isolation is PVD dependent and chemosensory independent.
(A) Isolation of gentle-touch-insensitive mec-4 worms with glass beads partially rescues the isolation-induced reduction in harsh touch response. Experiment performed after 96 hr to account for slower growth rate. Crowded, n = 39; Isolated, n = 42; Isolated with beads, n = 31. (B) Isolation of osm-6 mutants, defective in ciliated chemosensory neurons and the PDE nociceptor, resulted in reduced response to harsh touch, when compared to worms from a crowded plate (Crowded, n = 34; Isolated, n = 27). (C) Continuous exposure to amiloride does not affect the wildtype (WT) response to harsh touch in the crowded conditions (Crowded with DMSO, n = 54; Crowded with 3 mM amiloride, n = 52). The proportion of responding worms (percentage) ± the standard error of proportion is shown. Fisher’s exact test, *p < 0.05, **p < 0.01, n.s., not significant.
-
Figure 1—figure supplement 1—source data 1
Original data file for Figure 1—figure supplement 1 on the reduction in response to harsh touch following isolation is PVD dependent and chemosensory independent.
- https://cdn.elifesciences.org/articles/83973/elife-83973-fig1-figsupp1-data1-v2.xlsx
Figure 2 with 4 supplements
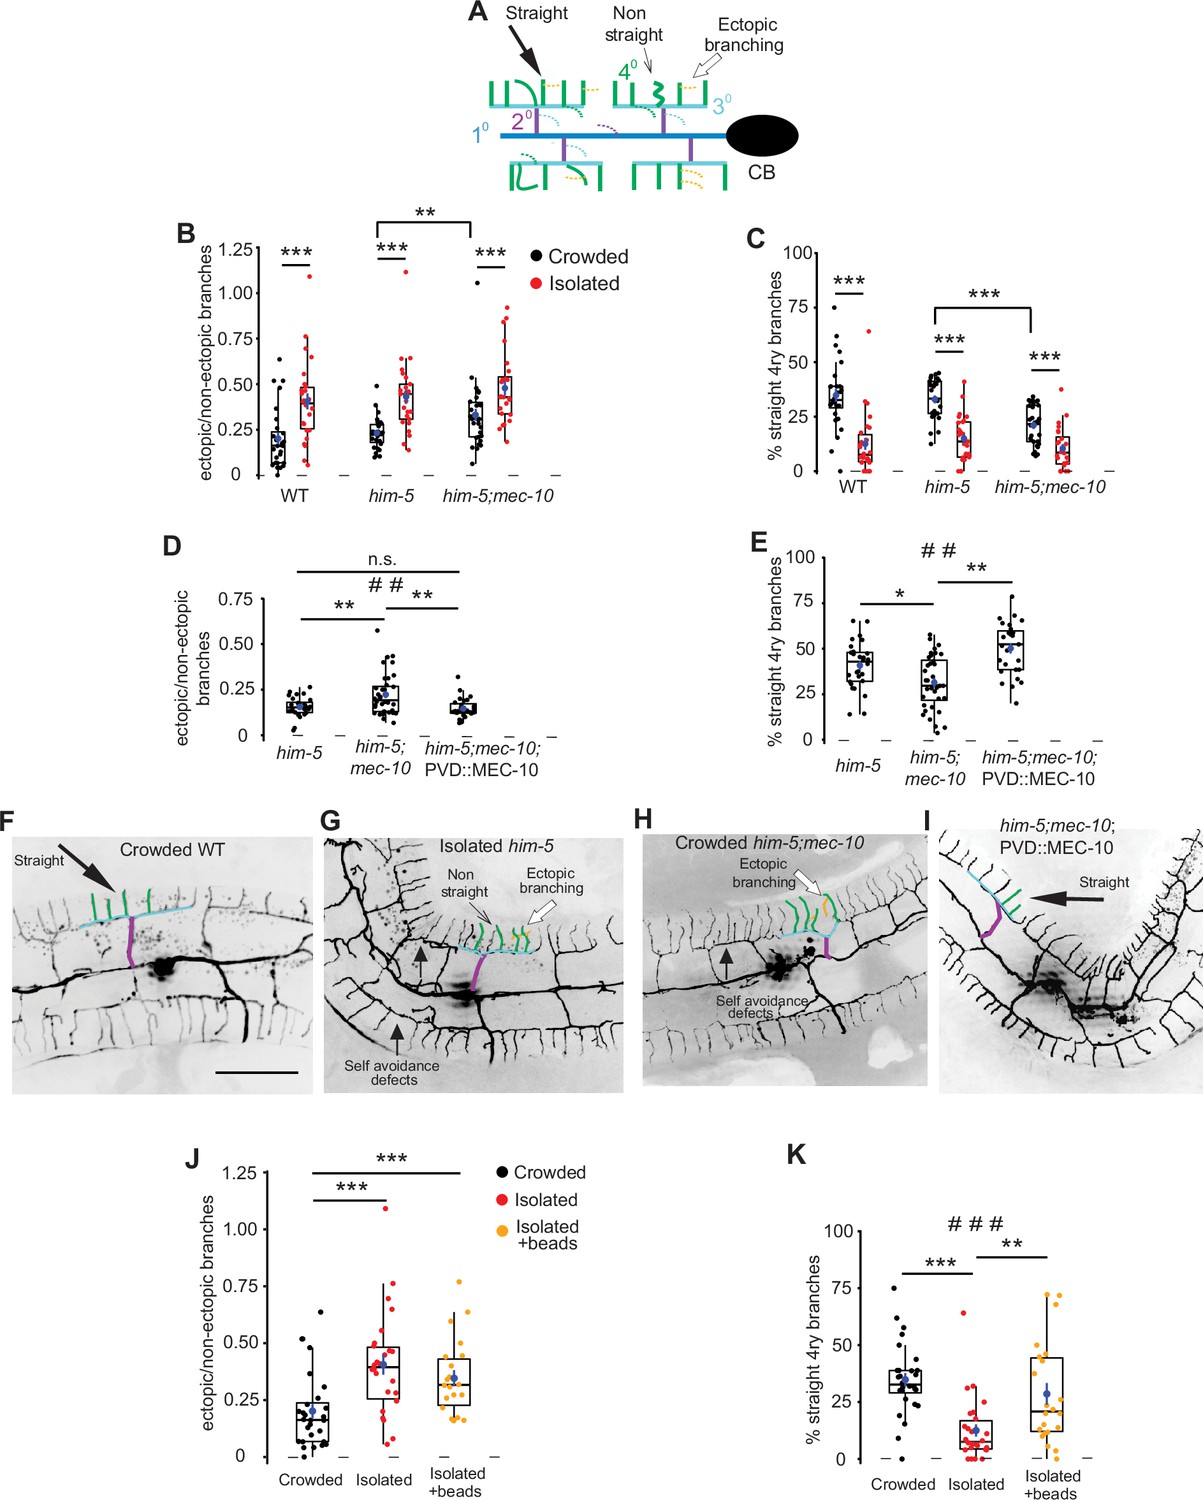
Mechanosensory deprivation and cell autonomous activity of mec-10 affect the architecture of the PVD.
(A) Schematic representation of the PVD dendritic structure, marking the morphological characteristics of interest: ectopic branches and quaternary branching geometry. Dashed lines represent ectopic branching at each order. Colors correspond to Figure 1A. (B–G) Both isolation and mec-10 affect the structure of the PVD: (B) Isolation increases the fraction of ectopic branching, mec-10 mutation increases ectopic branching in the crowded state. (C) Isolation decreases the percentage of straight quaternary branches, mec-10 mutation decreases the percentage of straight quaternary branches in the crowded state. Crowded – black dots, isolated – red dots; wildtype (WT) (Crowded, n = 28; Isolated, n = 26), him-5 (Crowded, n = 27; Isolated, n = 25; him-5 was used as WT background for several strains after cross), him-5; mec-10 (Crowded, n = 30; Isolated, n = 24). (D) Expression of mec-10 in the PVD on the background of him-5; mec-10 in the crowded state reduces ectopic branching and (E) increases the percentage of straight quaternary branches (Crowded him-5, n = 28; Crowded him-5; mec-10, n = 36; Crowded him-5; mec-10; PVD::MEC-10, n = 27). (F–I) Representative PVD images of WT, mec-10, and mec-10; PVD::mec-10 in different growth conditions (scale bar, 50µm). (J) Embryo isolation with glass beads did not affect ectopic branching. (K) Embryo isolation with glass beads increased the percentage of straight quaternary branches (Crowded, n = 28; Isolated, n = 26; Isolated with beads, n = 22). Crowded and isolated WT are the same set of worms as in (B, C). Each dot represents a single worm. The mean ± SEM are shown in blue. Box plot with median and hinges for the first and third quartiles. The whiskers represent an estimated calculation of the 95% confidence interval. Kruskal–Wallis test, ##p < 0.01, ###p < 0.001, Mann–Whitney test with Bonferroni correction α = 0.0167. *p < 0.05, **p < 0.01, ***p < 0.001, n.s., not significant.
-
Figure 2—source data 1
Original data file for Figure 2 graphs on mechanosensory deprivation and cell autonomous activity of mec-10 affects the architecture of the PVD.
- https://cdn.elifesciences.org/articles/83973/elife-83973-fig2-data1-v2.xlsx
Figure 2—figure supplement 1
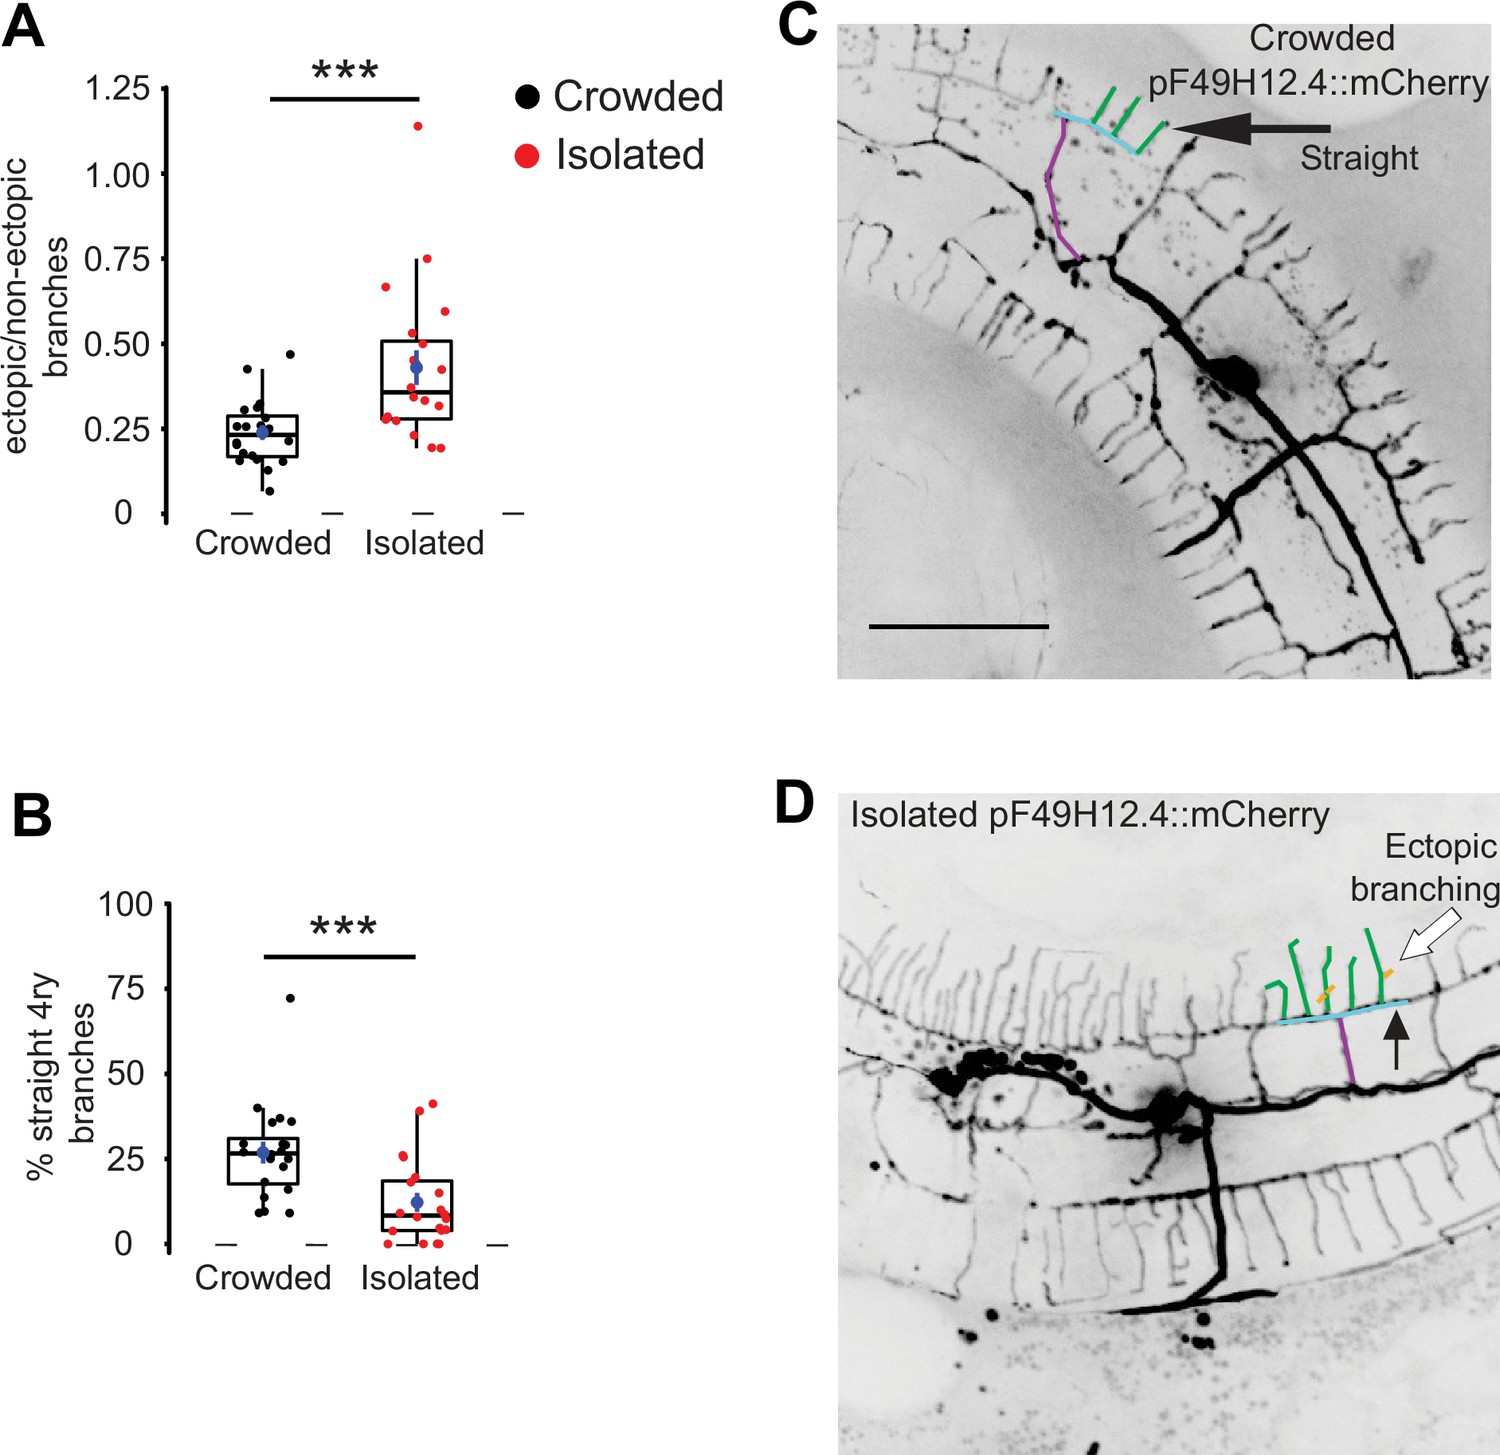
The effect of isolation on the structure of the PVD is independent from the identity of the promoter driving expression of the reporter in the PVD.
Worms expressing the PVD fluorescent marker, dzIs53 [pF49H12.4::mCherry] were isolated as in Figure 1B. (A) Embryo isolation for 72 hr increased total ectopic branching, and (B) reduced the percentage of straight quaternary branches (Crowded, n = 20; Isolated, n = 20). (C, D) Representative PVD images of dzIs53 [pF49H12.4::mCherry] crowded and isolated adults (scale bar, 50 µm). Box plot description as in Figure 2. Mann–Whitney test, ***p < 0.001. One representative candelabrum is colored as in Figure 1A.
-
Figure 2—figure supplement 1—source data 1
Data for Figure 2—figure supplement 1 on the effect of isolation on the structure of the PVD is independent from the promoter driving expression of the reporter in the PVD.
- https://cdn.elifesciences.org/articles/83973/elife-83973-fig2-figsupp1-data1-v2.xlsx
Figure 2—figure supplement 2
The PVD undergoes isolation-dependent structural plasticity in the presence of pheromonal signals in the plate.
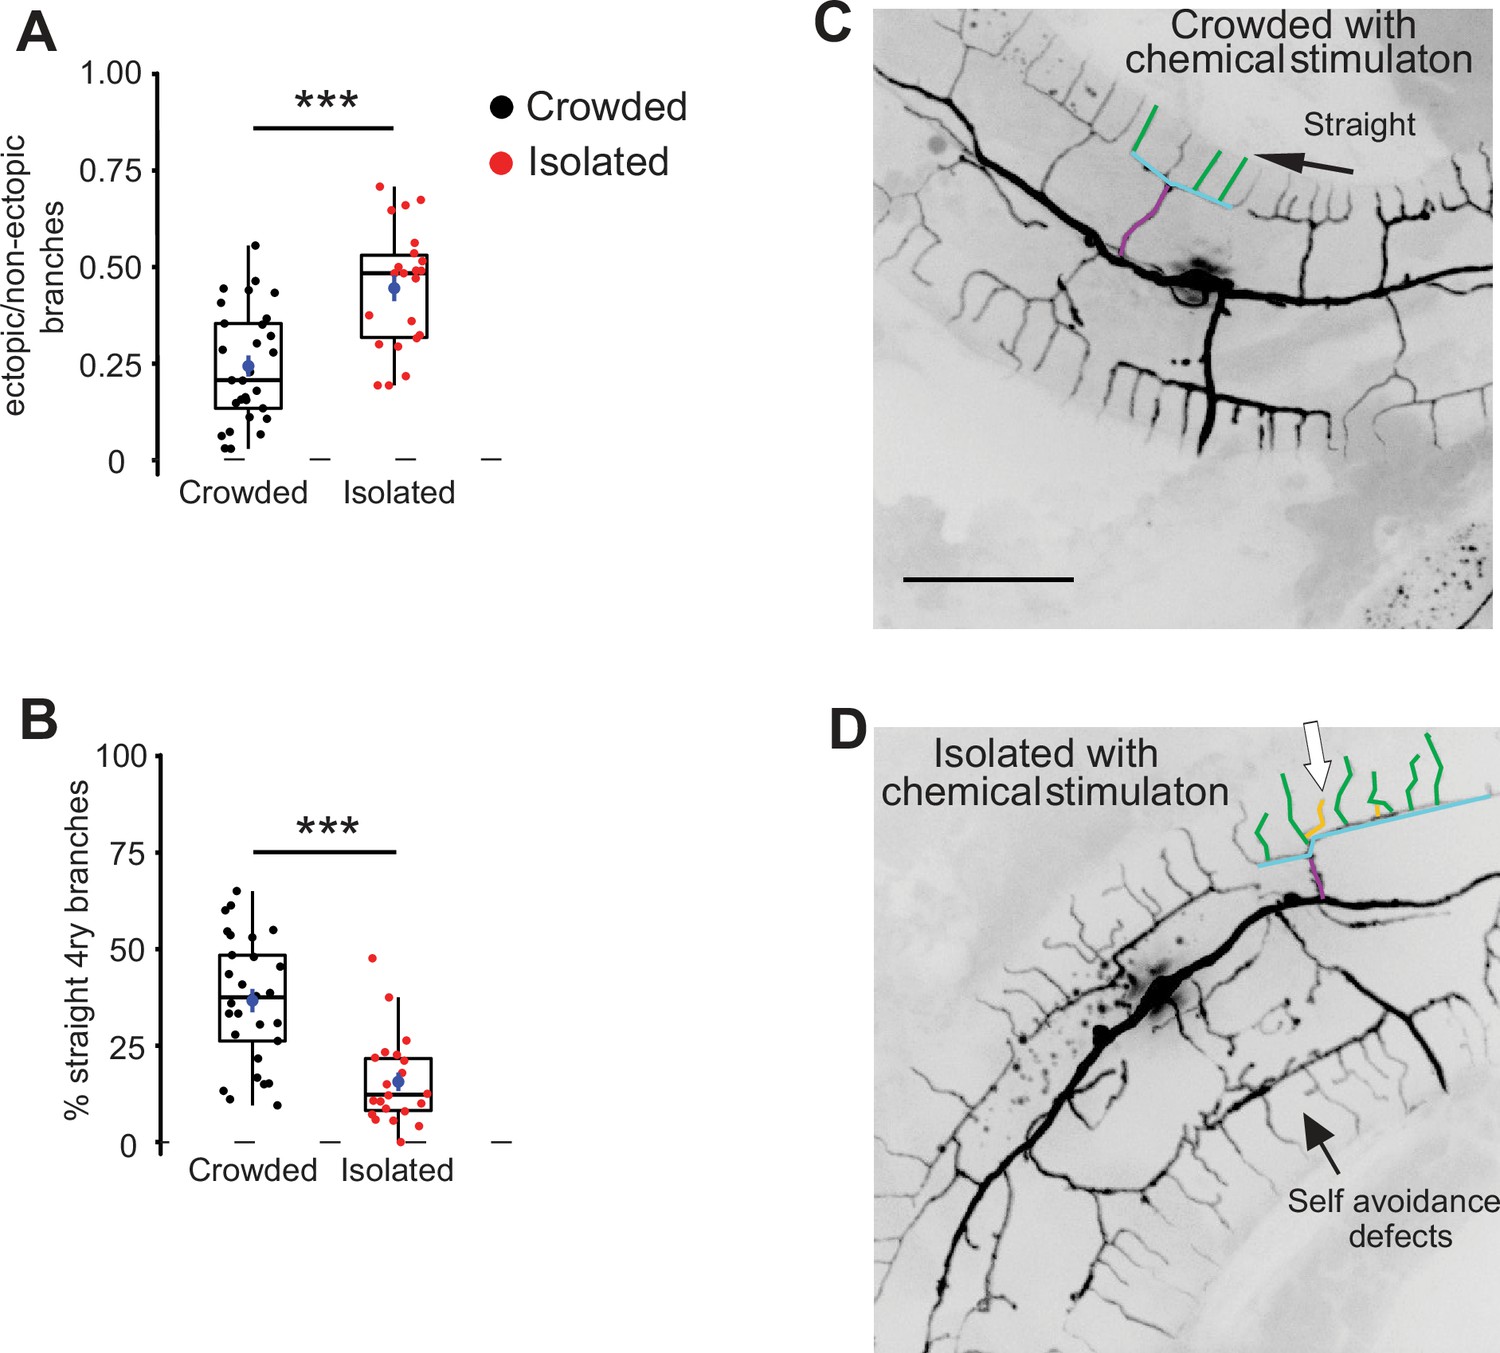
Both crowded and isolated worms were pre-exposed to pheromonal signals, released by glp-4 worms (~40 worms for 96 hr. The glp-4 worms were taken out of the plate and the isolation protocol described in Figure 1B was used). (A) Chemical stimulation of plates with glp-4, followed by egg isolation, increased the fraction of ectopic branching, and (B) decreased straight quaternary branches (Crowded, n = 24; Isolated, n = 20). (C, D) Representative PVD images for crowded and isolated worms with chemical stimulation of the plates. White arrow, ectopic branching (scale bar, 50 µm). Box plot representation as in Figure 2. Mann–Whitney test, ***p < 0.001. One representative candelabrum is colored as in Figure 1A.
-
Figure 2—figure supplement 2—source data 1
Original data for Figure 2—figure supplement 2 on the PVD undergoes isolation-dependent structural plasticity in the presence of pheromonal signals in the plate.
- https://cdn.elifesciences.org/articles/83973/elife-83973-fig2-figsupp2-data1-v2.xlsx
Figure 2—figure supplement 3
The effect of isolation on the structure of PVD is not mediated by the gentle touch mechanosensory neurons.
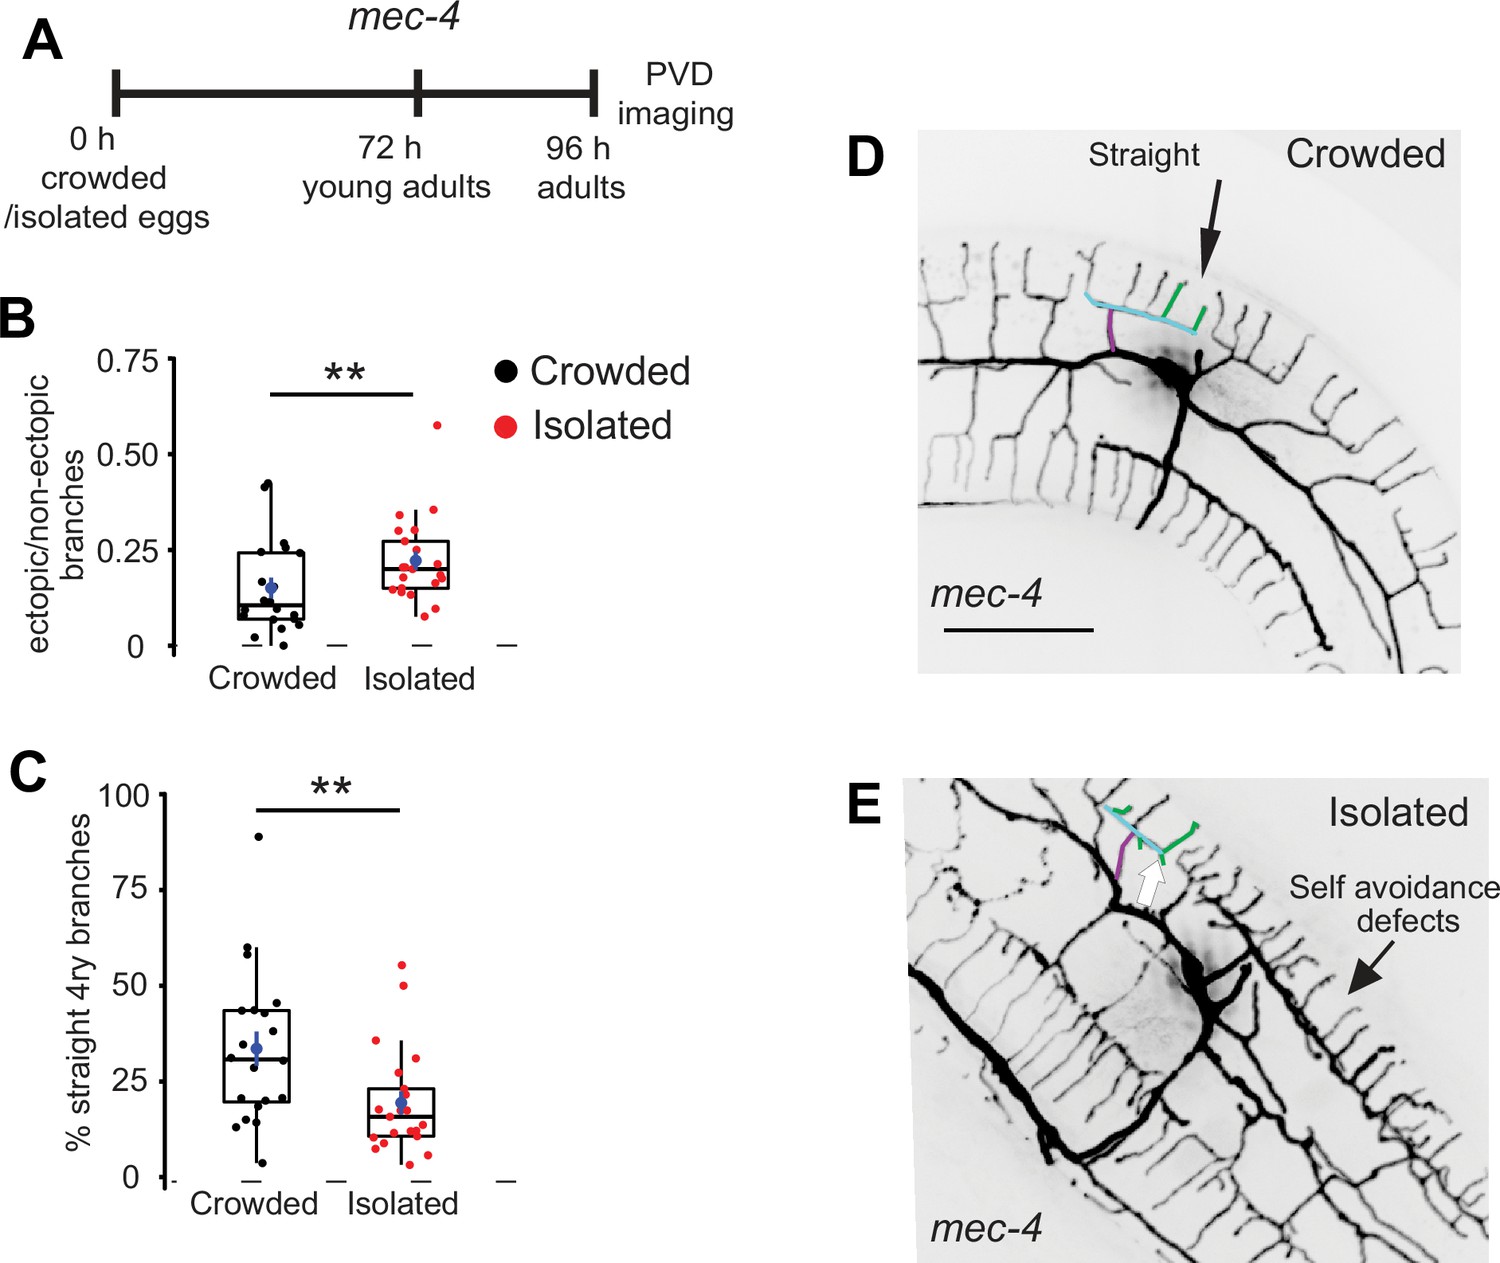
(A) Description of the protocol for the isolation of mec-4 eggs for 96 hr (the experiment was performed for 96 hr since the worms were L4s or very young adults at 72 hr), followed by PVD imaging. (B) Isolation of the gentle touch impaired strain, ser-2Prom3::Kaede; mec-4, increased total ectopic branching, and (C) reduced the percentage of straight quaternary branching (Crowded, n = 20; Isolated, n = 21). (D, E) Representative PVD images derived from crowded worms and isolated eggs. White arrow, ectopic branching (scale bar, 50 µm). Box plot representation as in Figure 2. Mann–Whitney test with Bonferroni correction **p < 0.01. One representative candelabrum is colored as in Figure 1A.
-
Figure 2—figure supplement 3—source data 1
Original data for Figure 2—figure supplement 3 graphs on the effect of isolation on the structure of PVD is not mediated by the gentle touch mechanosensory neurons.
- https://cdn.elifesciences.org/articles/83973/elife-83973-fig2-figsupp3-data1-v2.xlsx
Figure 2—figure supplement 4
Isolation of eggs for 48 hr and adults for 24 hr is sufficient to induce changes in the structure of the PVD.
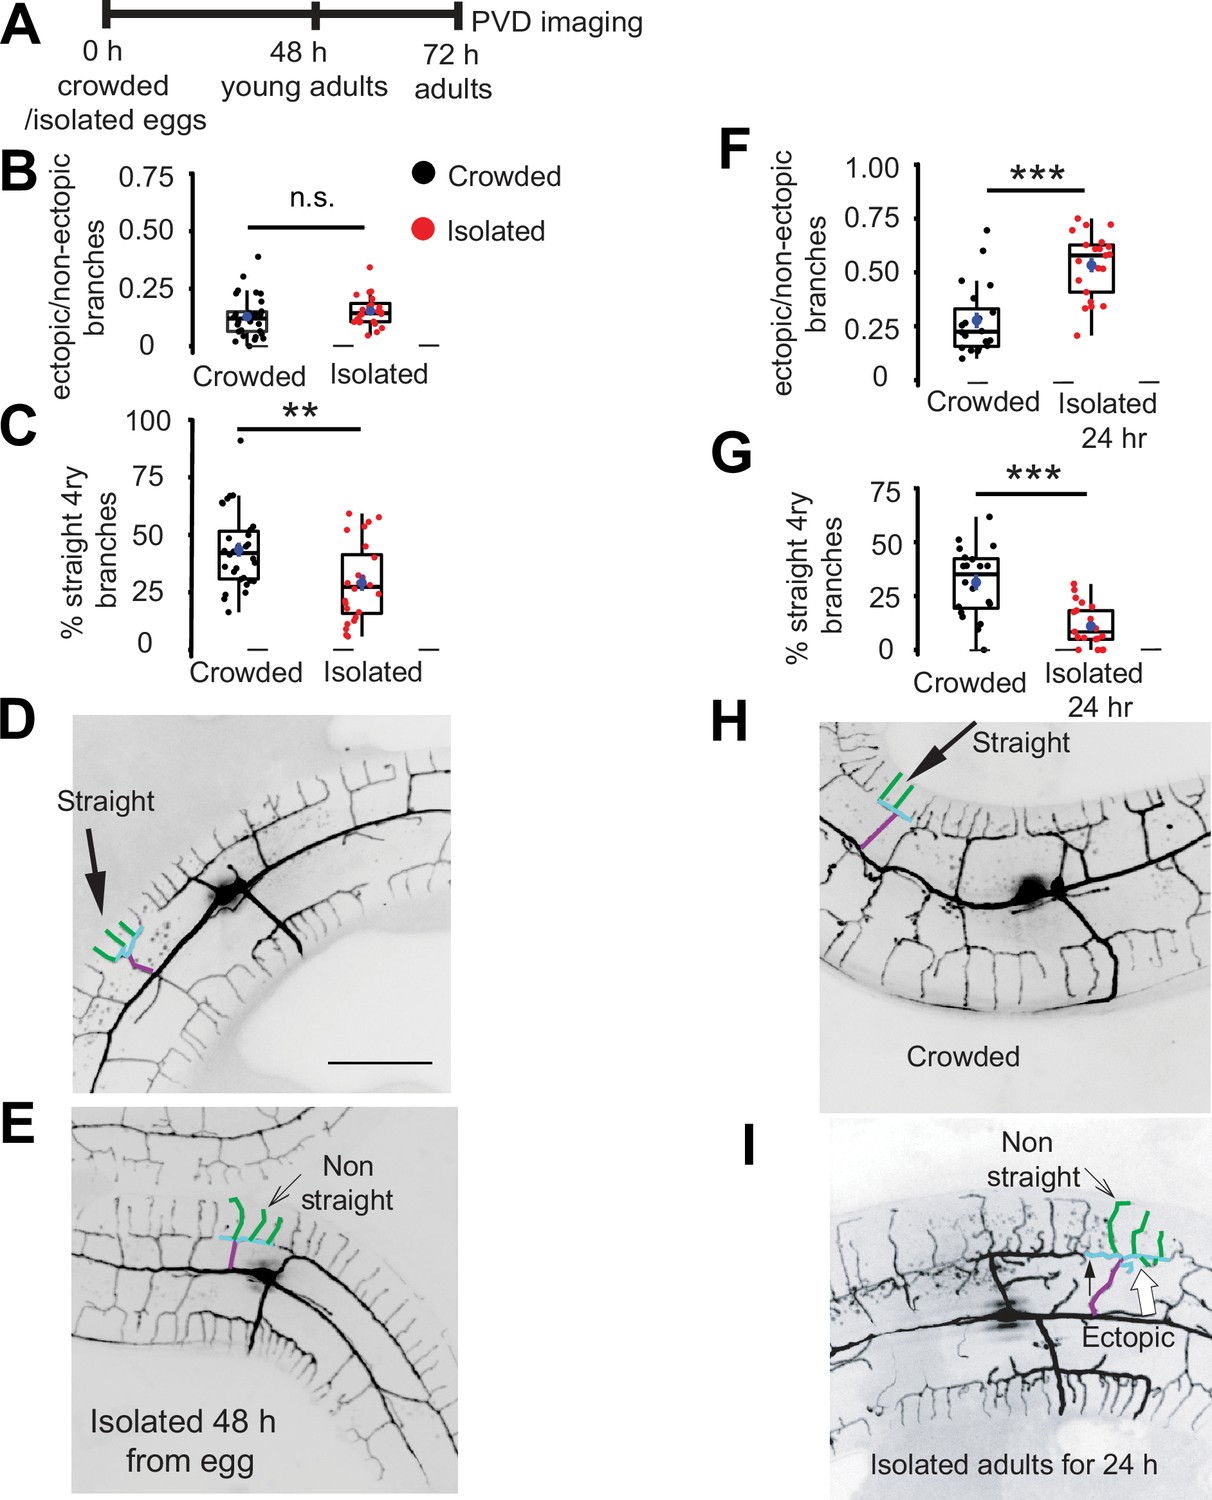
(A) Schematic protocol for the isolation of wildtype (WT) eggs for 48 hr and adults for 24 hr, followed by PVD imaging. (B) Isolation of eggs for 48 hr (resulted in young adult worms) did not affect the number of ectopic branches, and (C) decreased the percentage of straight quaternary branching (Crowded, n = 30; Isolated, n = 24). (D, E) Representative PVD images for crowded worms and isolated eggs (scale bar, 50 µm). (F) Isolation of young adult worms for 24 hr increased the fraction of ectopic branching, and (G) reduced the percentage of straight quaternary branches (Crowded, n = 20; Isolated adults for 24 hr, n = 21). (H, I) Representative pictures from the PVD images for crowded and matched animal isolated as young adult for 24 hr. A small arrow marks a self-avoidance defect. Box plot representation as in Figure 2. Mann–Whitney test, **p < 0.01, ***p < 0.001, n.s., not significant. One representative candelabrum is colored as in Figure 1A.
-
Figure 2—figure supplement 4—source data 1
Original data for Figure 2—figure supplement 4 graphs on isolation of eggs for 48 hr and adults for 24 hr is sufficient to induce changes in the structure of the PVD.
- https://cdn.elifesciences.org/articles/83973/elife-83973-fig2-figsupp4-data1-v2.xlsx
Figure 3 with 2 supplements
Adult isolation for less than 4 hr affects the structure of the PVD.
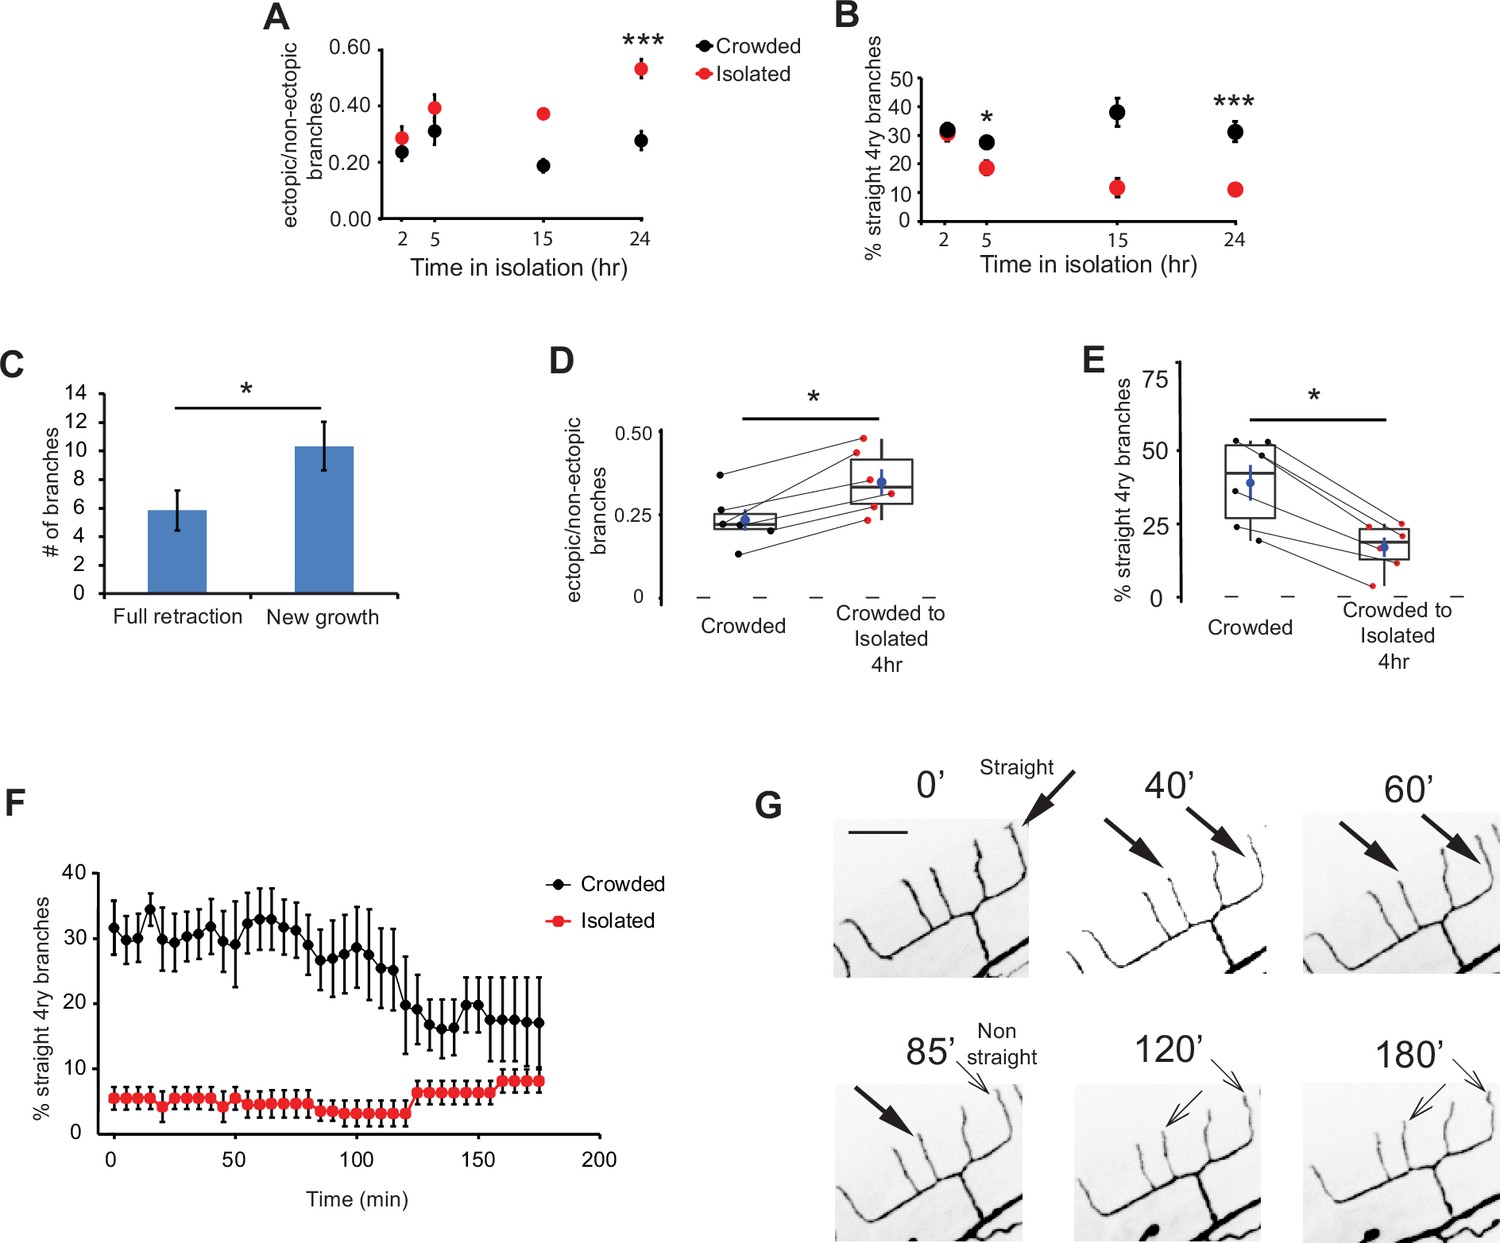
(A) Isolation of crowded worms induces a time-dependent increase in the proportion of ectopic branches, and (B) a decrease in the number of straight quaternary branches (2 hr: Crowded, n = 24, Isolated, n = 22; 5 hr: Crowded, n = 24, Isolated, n = 27; 15 hr: Crowded, n = 3, Isolated, n = 3; 24 hr: Crowded, n = 20, Isolated, n = 21; animals imaged using polystyrene beads for immobilization, see Materials and methods). (C) Isolation for 4 hr induces more growth of new branches than retraction of existing ones. Ectopic branch dynamics were compared for crowded animals against their state after 4 hr isolation. Imaging used 1% tricaine, see Materials and methods. (D) Isolation of crowded worms for 4 hr increases the ratio between ectopic/non-ectopic branches in individual animals and (E) reduces the percentage of straight quaternary branches (n = 6). (F) Crowded, but not isolated worms, show dynamic reduction in the percentage of straight quaternary branches during a 3-hr time lapse movie in 1% tricaine; see Videos 1 and 2 (Crowded, n = 5; Isolated, n = 6). (G) Representative time lapse frames of a crowded worm in 1% tricaine. Thick and thin arrows represent straight and non-straight quaternary branches, respectively (scale bar, 25 µm). For (D, E), the lines connecting two points refer to the same crowded specimen at time 0 and after 4 hr isolation. Box plot representation as in Figure 2. For (A, B) Mann–Whitney test, *p < 0.05, ***p < 0.001. For (C–E), Wilcoxon test (for two related samples), *p < 0.05. The mean ± SEM are shown for panels A–C and F.
-
Figure 3—source data 1
Original data file for Figure 3 graphs on adult isolation for less than 4 hr affects the structure of the PVD.
- https://cdn.elifesciences.org/articles/83973/elife-83973-fig3-data1-v2.xlsx
Figure 3—figure supplement 1

Four hours are sufficient to induce an increase in ectopic branching and a decrease in percentage of straight branches.
Scale bar, 25 µm. Left image is from a young adult grown in crowded conditions. Following confocal imaging this worm was isolated for 4 hr and imaged again (right image). Straight terminal branches (black arrows, left image) became non-straight and there are new ectopic branches (white arrows, right image; see quantitative analyses in Figure 3D, E).
Figure 3—figure supplement 2
Activity-modulating pharmacological agents affect the structure and the dynamics of PVD branch growth and retraction.
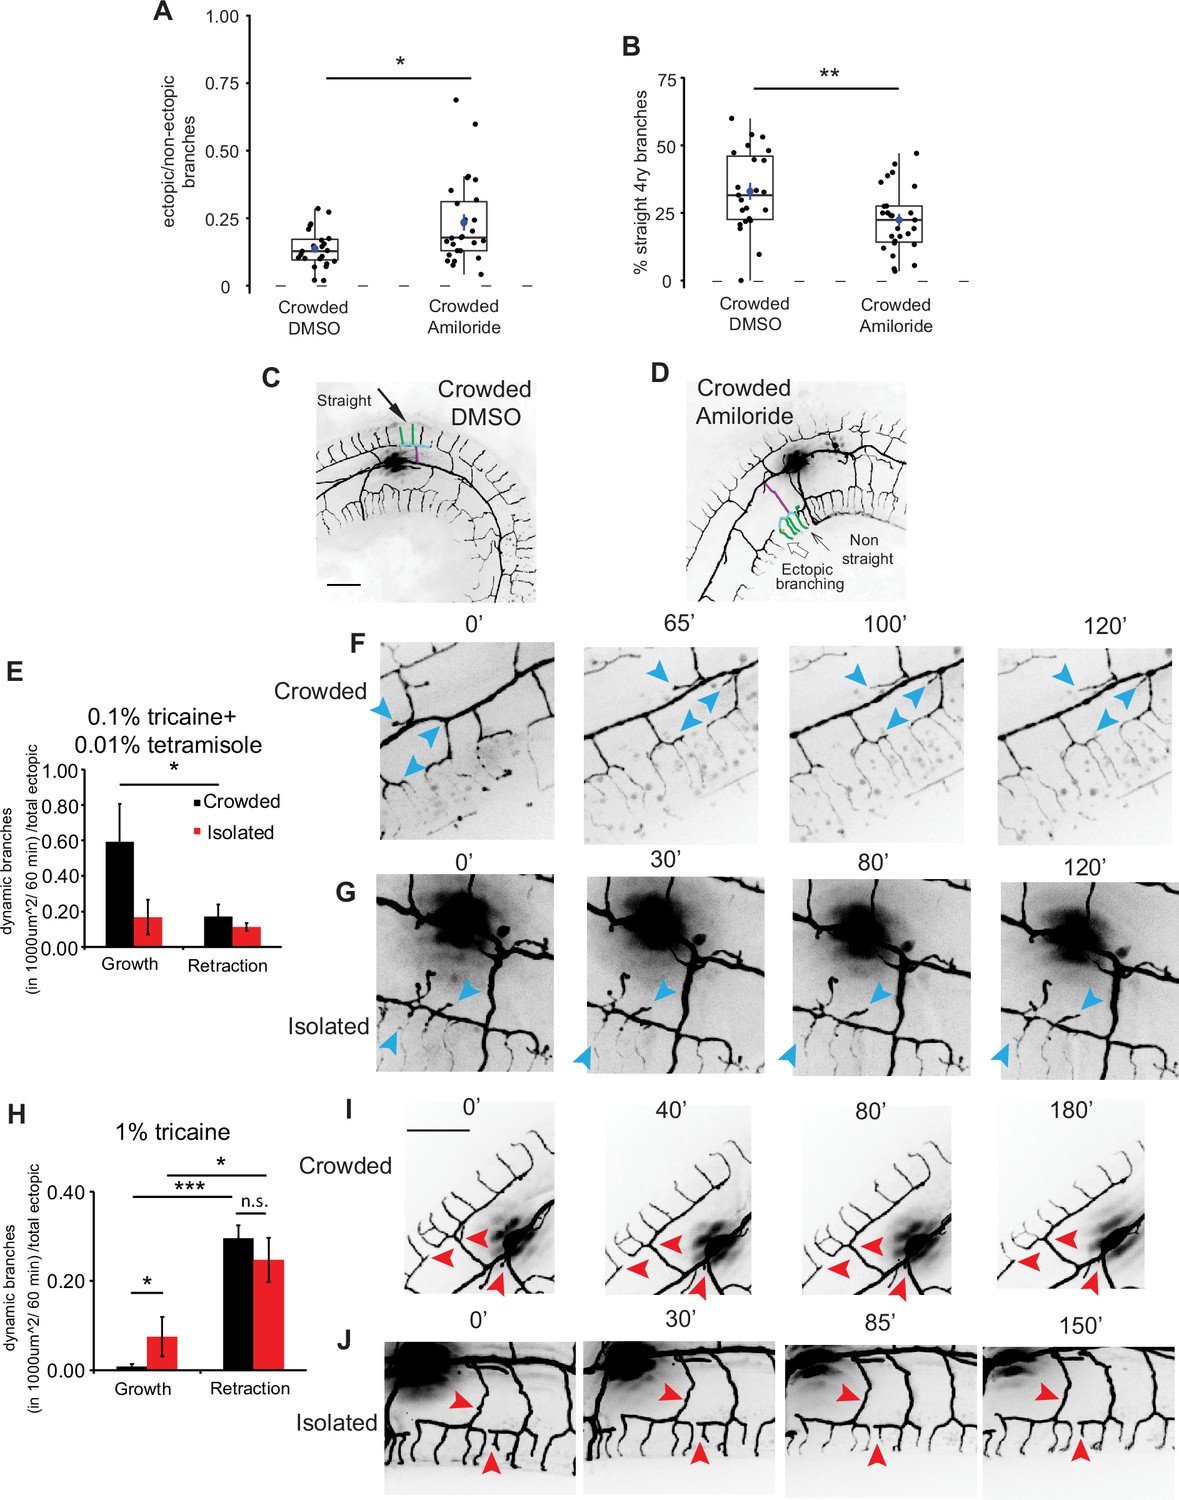
(A–D) Blocking DEG/ENaC with 3 mM amiloride in crowded plate conditions affects the structure of the PVD. (A) Increased the fraction of ectopic branches, and (B) decreased the percentage of straight quaternary branches (Crowded with DMSO, n = 23; Crowded with amiloride n = 27). (C, D) Representative PVD images in DMSO- and amiloride-treated worms. One representative candelabrum is colored as in Figure 1A (scale bar, 25 µm). (E–G) A mixture containing 0.01% tetramisole and 0.1% tricaine induced more dendritic growth than retraction in crowded conditions (E; Crowded: n = 5; Isolated, n = 5). Representative images from time lapse movies demonstrating dynamic outgrowth of branching under tricaine–tetramisole anesthetic mixture for crowded (F) and isolated worms (G). (H–J) 1% tricaine induced more dendritic retraction than growth. In addition, more dendritic growth was measured for isolated worms, compared to crowded (H); Crowded: n = 6; Isolated, n = 6. Representative time lapse movies demonstrating dynamic retraction of branching for crowded (I) and isolated (J) worms; see Videos 1 and 2. Blue arrowheads, branch growth; red arrowheads, branch retraction; bar for panel ‘I’, 25 µm. Box plots are as represented in Figure 2. Mann–Whitney test, *p < 0.05, **p < 0.01. For (E, H), t-test. *p < 0.05, ***p < 0.001, n.s., not significant.
-
Figure 3—figure supplement 2—source data 1
Original data for Figure 3—figure supplement 2 graphs on activity-modulating pharmacological agents affect the structure and the dynamics of PVD branch growth and retraction.
- https://cdn.elifesciences.org/articles/83973/elife-83973-fig3-figsupp2-data1-v2.xlsx
Figure 4 with 3 supplements
Response to harsh touch and PVD morphology are independent.
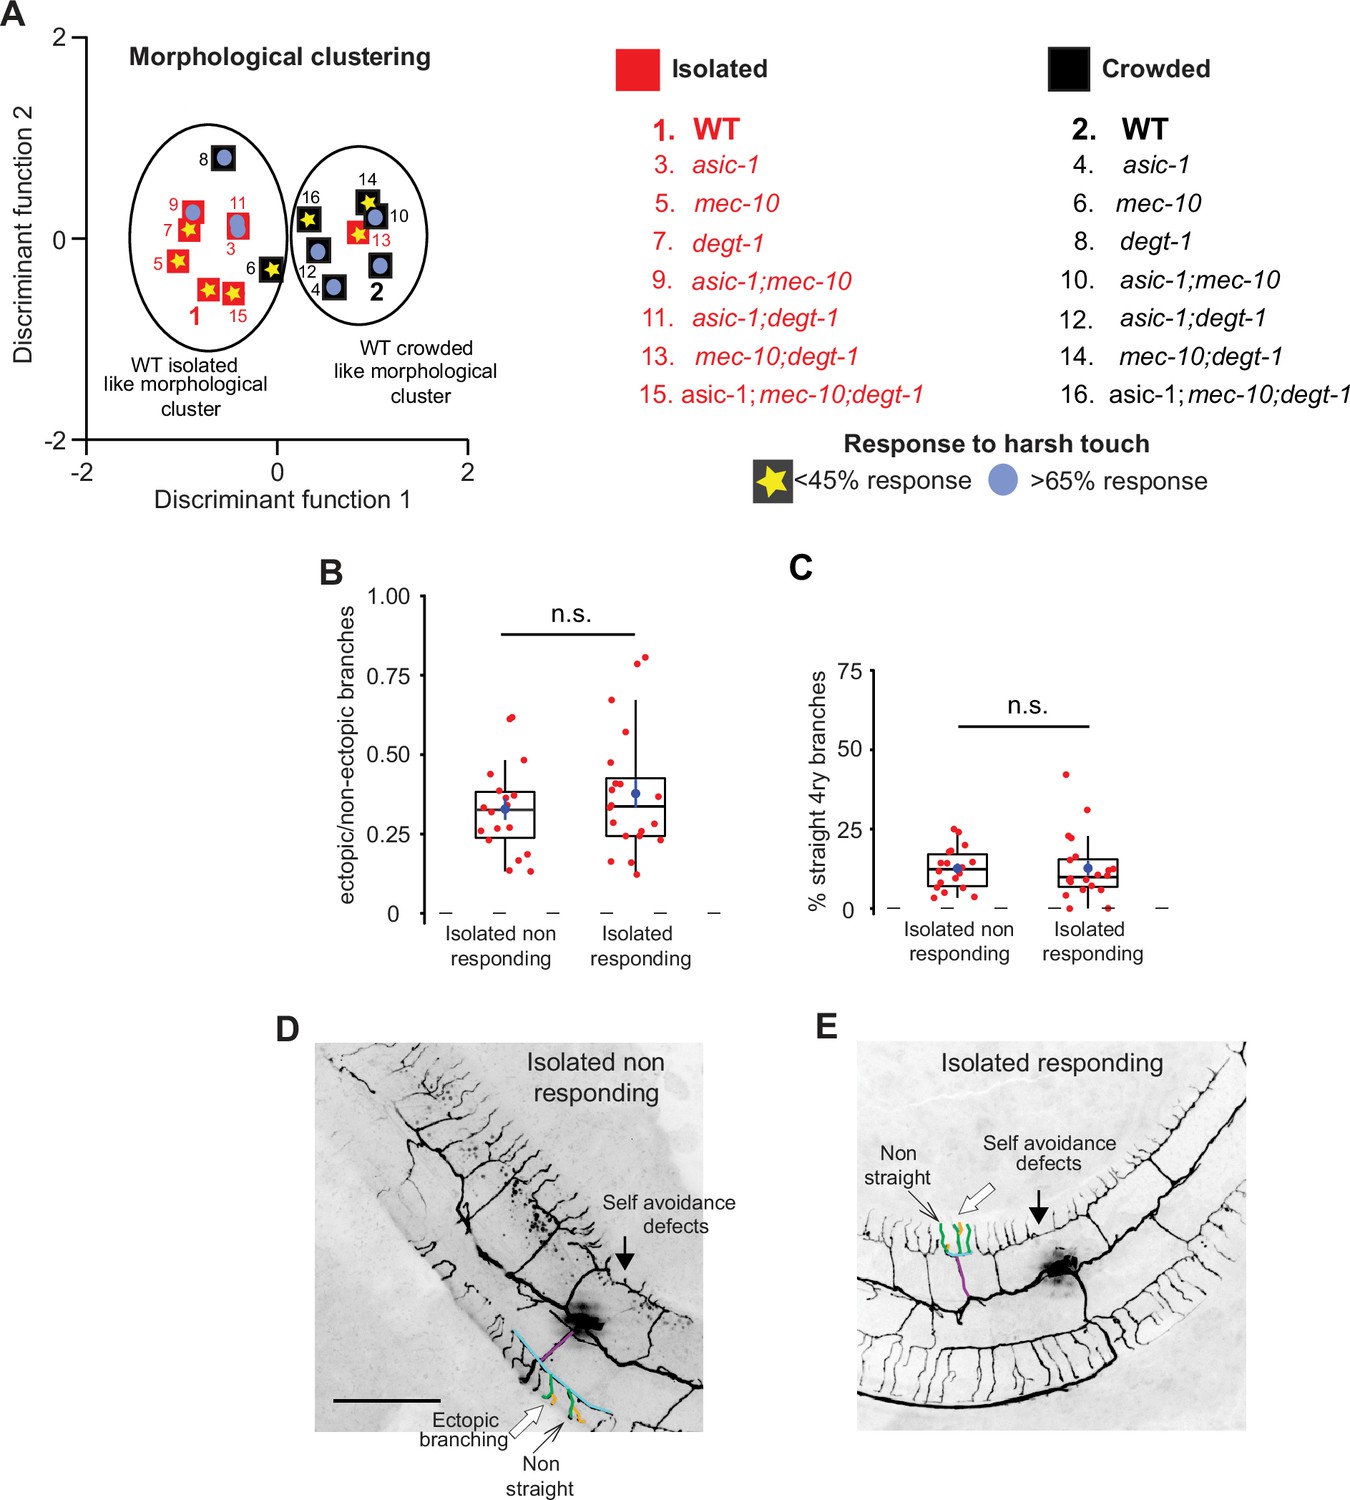
(A) Discriminant analysis shows independence of harsh touch response from the PVD’s morphological classification. Squares indicate the centroids for morphological characteristics analyzed in Figure 4—figure supplement 2A–C. The response to harsh touch (Figure 4—figure supplement 1) is illustrated by its magnitude (low, <45% in yellow star; high, >65% in light blue circles). The different genotypes are numbered in the list on the right. Crowded – black, Isolated – red. (B–E) Isolated animals show similar PVD morphology regardless of their touch response: (B) isolated responding and non-responding animals are not different with regard to the fraction of ectopic branching, and (C) the geometry of quaternary branches (Isolated non-responding, n = 18; Isolated responding, n = 20). Box plot representation as in Figure 2. Mann–Whitney test. n.s., not significant. (D, E) Representative PVD images of responding and non-responding worms (scale bar, 50 µm).
-
Figure 4—source data 1
Original data file for Figure 4 graphs on response to harsh touch and PVD morphology is independent.
- https://cdn.elifesciences.org/articles/83973/elife-83973-fig4-data1-v2.xlsx
Figure 4—figure supplement 1

The DEG/ENaC asic-1 and mec-10 mediate experience-dependent behavioral plasticity following isolation.
Posterior harsh touch assay was performed for crowded and isolated wildtype (WT) and DEG–ENaC mutants, similar to the procedure described in Figure 1B. Seven combinations of DEG–ENaC mutants were tested for the isolation effect on response to harsh touch. Isolated worms were compared to crowded worms from the same strain. N2 worms (The same set of worms as in Figure 1C. Crowded, n = 32; Isolated, n = 32), asic-1 (Crowded, n = 46; Isolated, n = 30), mec-10 (Crowded, n = 38; Isolated, n = 31), degt-1 (Crowded, n = 37; Isolated, n = 31), asic-1; mec-10 (Crowded, n = 20; Isolated, n = 22), mec-10; degt-1 (Crowded, n = 40; Isolated, n = 36), asic-1; degt-1 (Crowded, n = 35; Isolated, n = 34), and asic-1; mec-10; degt-1 (Crowded, n = 52; Isolated, n = 50). The proportion (percentage) of responding worms ±the standard error of proportion is shown. Fisher’s exact test, *p < 0.05, ***p < 0.001, n.s., not significant.
-
Figure 4—figure supplement 1—source data 1
Original data for Figure 4—figure supplement 1 on the DEG/ENaC asic-1 and mec-10 mediate experience-dependent behavioral plasticity following isolation.
- https://cdn.elifesciences.org/articles/83973/elife-83973-fig4-figsupp1-data1-v2.xlsx
Figure 4—figure supplement 2
The DEG–ENaCs, mec-10 and degt-1, mediate mechanosensory-dependent structural changes in the PVD.
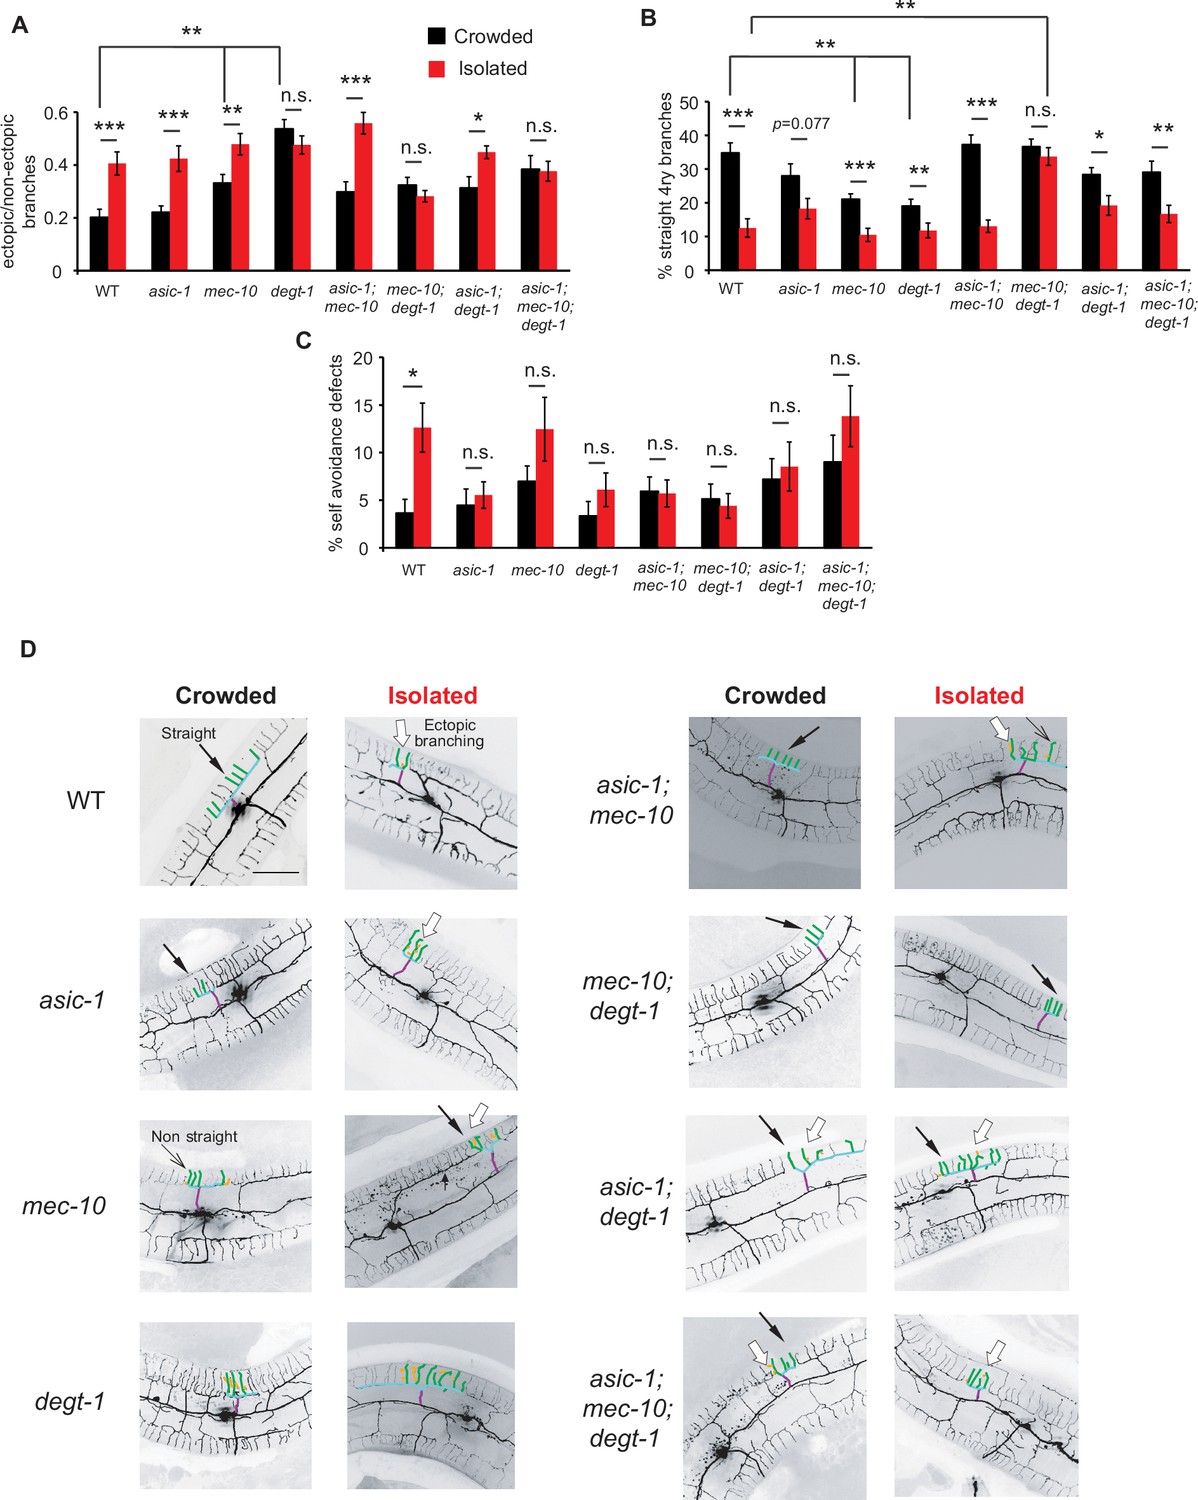
Mutants of DEG–ENaC were isolated and were compared to crowded animals from the same strain, similar to the procedure described in Figure 1B. (A) Three DEG–ENaC mutants: degt-1, mec-10; degt-1, and asic-1; mec-10; degt-1 show no difference between crowded and isolated worms in terms of ectopic branching. In addition, crowded mec-10 and degt-1 animals increased the number of ectopic branches compared to crowded wildtype (WT) worms. (B) mec-10; degt-1 mutants retain a high percentage of straight quaternary branches following isolation, while mec-10 and degt-1 single mutants have fewer straight branches compared with crowded WT animals, which decrease further upon isolation. (C) The increase in self-avoidance defects following isolation is DEG–ENaC dependent. WT (The same set of worms as shown in Figure 2A, B. Crowded, n = 28; Isolated, n = 26), asic-1 (Crowded, n = 22; Isolated, n = 25), mec-10 (Crowded, n = 27; Isolated, n = 21). The same set of worms as shown in Figure A, (B) degt-1 (Crowded, n = 28; Isolated, n = 24), asic-1; mec-10 (Crowded, n = 30; Isolated, n = 31), mec-10; degt-1 (Crowded, n = 26; Isolated, n = 28), asic-1; degt-1 (Crowded, n = 23; Isolated, n = 22), and asic-1; mec-10; degt-1 (Crowded, n = 23; Isolated, n = 21). (D) Representative PVD images for crowded and isolated worms of WT and seven different DEG–ENaC mutants (scale bar, 50 µm). The mean ± SEM are shown. Mann–Whitney test, *p < 0.05, **p < 0.01, ***p < 0.001, n.s., not significant. One representative candelabrum is colored as in Figure 1A.
-
Figure 4—figure supplement 2—source data 1
Original data for Figure 4—figure supplement 2 on the DEG–ENaCs, mec-10 and degt-1, mediate mechanosensory-dependent structural changes in the PVD.
- https://cdn.elifesciences.org/articles/83973/elife-83973-fig4-figsupp2-data1-v2.xlsx
Figure 4—figure supplement 3
Isolation induces increase in loss of self-avoidance defects, in a mec-10-dependent manner.
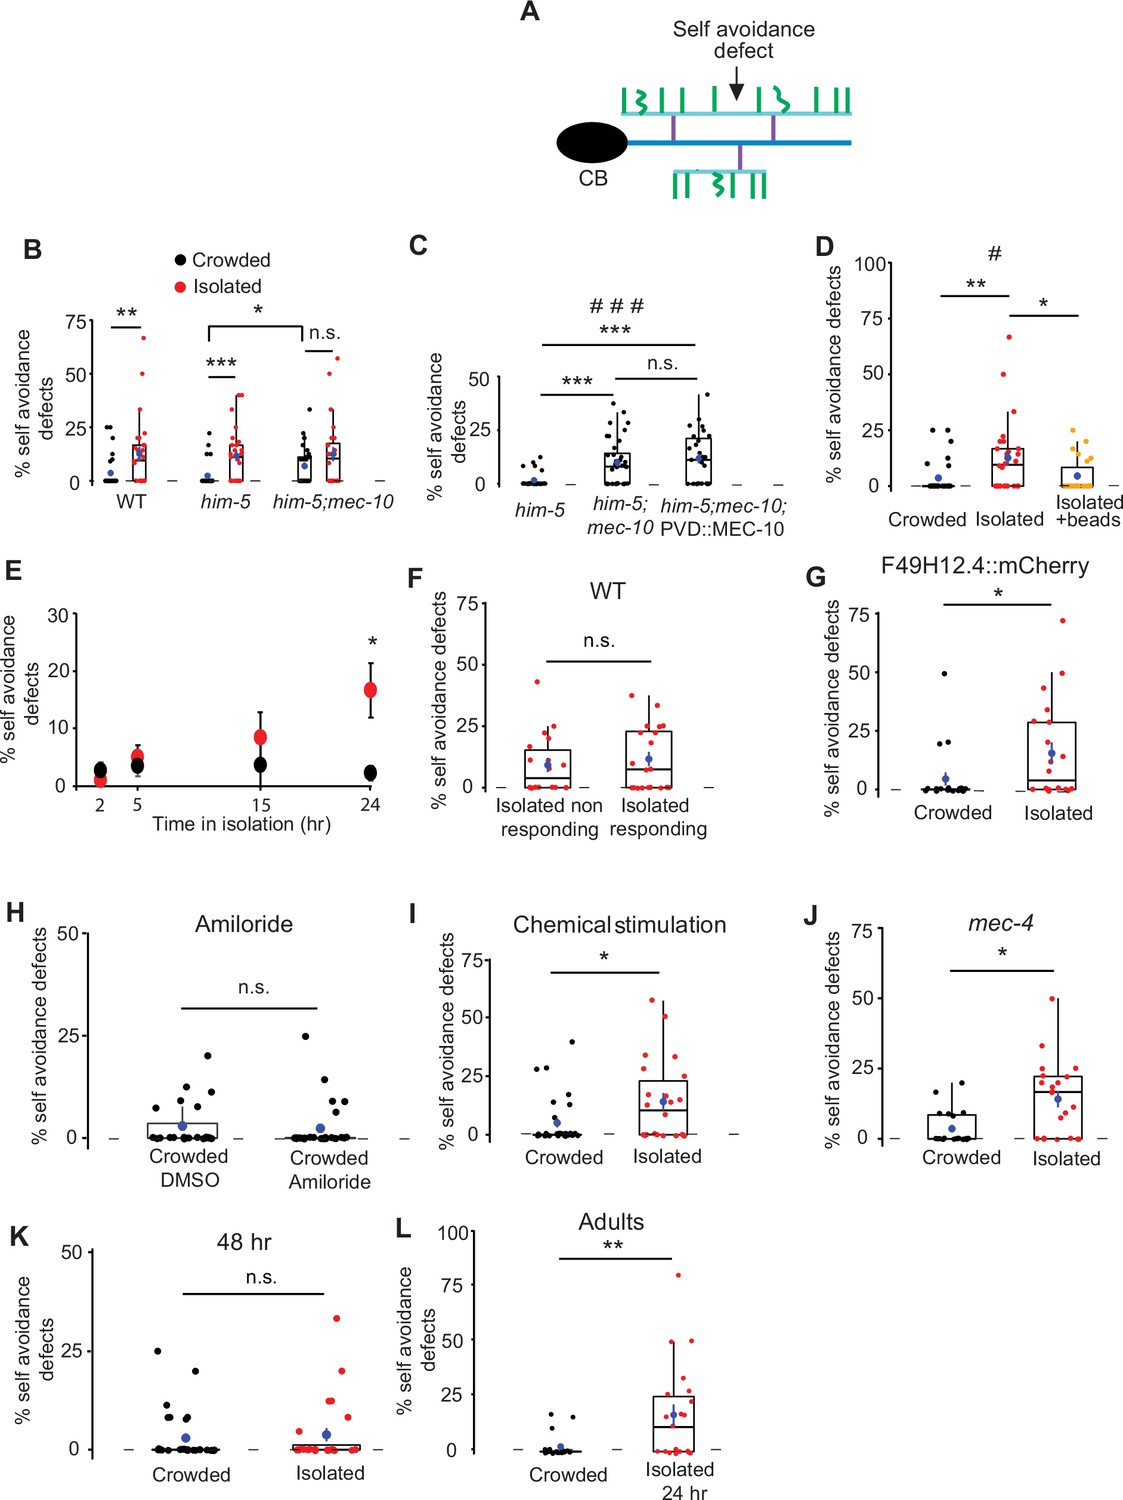
(A) Schematic representation of the PVD dendritic structure, marking a self-avoidance defect, in which two candelabra overlap. Colors correspond to Figure 2A. (B) Isolation increases the percentage of self-avoidance defects between two adjacent candelabra. Wildtype (WT) (Crowded, n = 28; Isolated, n = 26), him-5 (Crowded, n = 27; Isolated, n = 25; him-5 was used as WT background for several strains after cross), and him-5; mec-10 (Crowded, n = 30; Isolated, n = 24). (C) Overexpression of MEC-10 in the PVD does not affect the percentage of self-avoidance defects seen in mec-10 crowded animals. Crowded him-5 (n = 28), crowded him-5; mec-10 (n = 36), and crowded him-5; mec-10; PVD::MEC-10 (n = 27). (D) Isolation with glass beads reduced the percentage of self-avoidance defects, compared to isolated worms without beads (Crowded, n = 28; Isolated, n = 26; Isolated with beads, n = 22. Crowded and isolated are the same worms as used in Figure 2B, C). (E) Isolation during adulthood increases the percentage of self-avoidance defects in a time-dependent manner (2 hr: Crowded, n = 24, Isolated adults for 2 hr, n = 22; 5 hr: Crowded, n = 24, Isolated adults for 5 hr, n = 27; 15 hr: Crowded, n = 3, Isolated adults for 15 hr, n = 3; 24 hr: Crowded, n = 20, Isolated adults for 24 hr, n = 21). (F) The percentage of self-avoidance defects is not correlated with the response to harsh touch (Isolated non-responding, n = 18; Isolated responding, n = 20). (G) Worms from a different strain and fluorescent marker, dzIs53 [pF49H12.4::mCherry], were isolated as eggs for 72 hr and compared to crowded worms from the same strain. Isolated worms increased the percentage of self-avoidance defects between two adjacent candelabra (Crowded, n = 20; Isolated, n = 20). (H) Blocking DEG/ENaC does not affect the percentage of self-avoidance defects (Crowded DMSO, n = 23; Crowded 3 mM amiloride, n = 27). (I) Both crowded and isolated worms were pre-exposed to pheromonal signals, released by glp-4 worms (~40 worms for 96 hr). The glp-4 worms were taken out of the plate and the isolation protocol described in Figure 1B was used. Isolation increased the percentage of self-avoidance defects (Crowded, n = 24; Isolated, n = 20). (J) Isolation of the gentle touch impaired strain, ser-2Prom3::Kaede; mec-4 increased the percentage of self-avoidance defects after isolation of eggs (Crowded, n = 20; Isolated, n = 21). (K) Isolation of eggs for 48 hr did not affect the percentage of self-avoidance defects (Crowded, n = 30; Isolated, n = 24). (L) Isolation of young adult worms for 24 hr increased the percentage of self-avoidance defects (Crowded, n = 20; Isolated adults for 24 hr, n = 21). Each dot represents a single worm. Box plots are as represented in Figure 2. Kruskal–Wallis test, #p < 0.05, ###p < 0.001, Mann–Whitney test with Bonferroni correction α = 0.0167. *p < 0.05, **p < 0.01, ***p < 0.001, n.s., not significant.
-
Figure 4—figure supplement 3—source data 1
Original data for Figure 4—figure supplement 3 on isolation induces increase in loss of self-avoidance defects, in a mec-10-dependent manner.
- https://cdn.elifesciences.org/articles/83973/elife-83973-fig4-figsupp3-data1-v2.xlsx
Figure 5 with 1 supplement
Mechanosensory-dependent localization of degenerins and optogenetics.
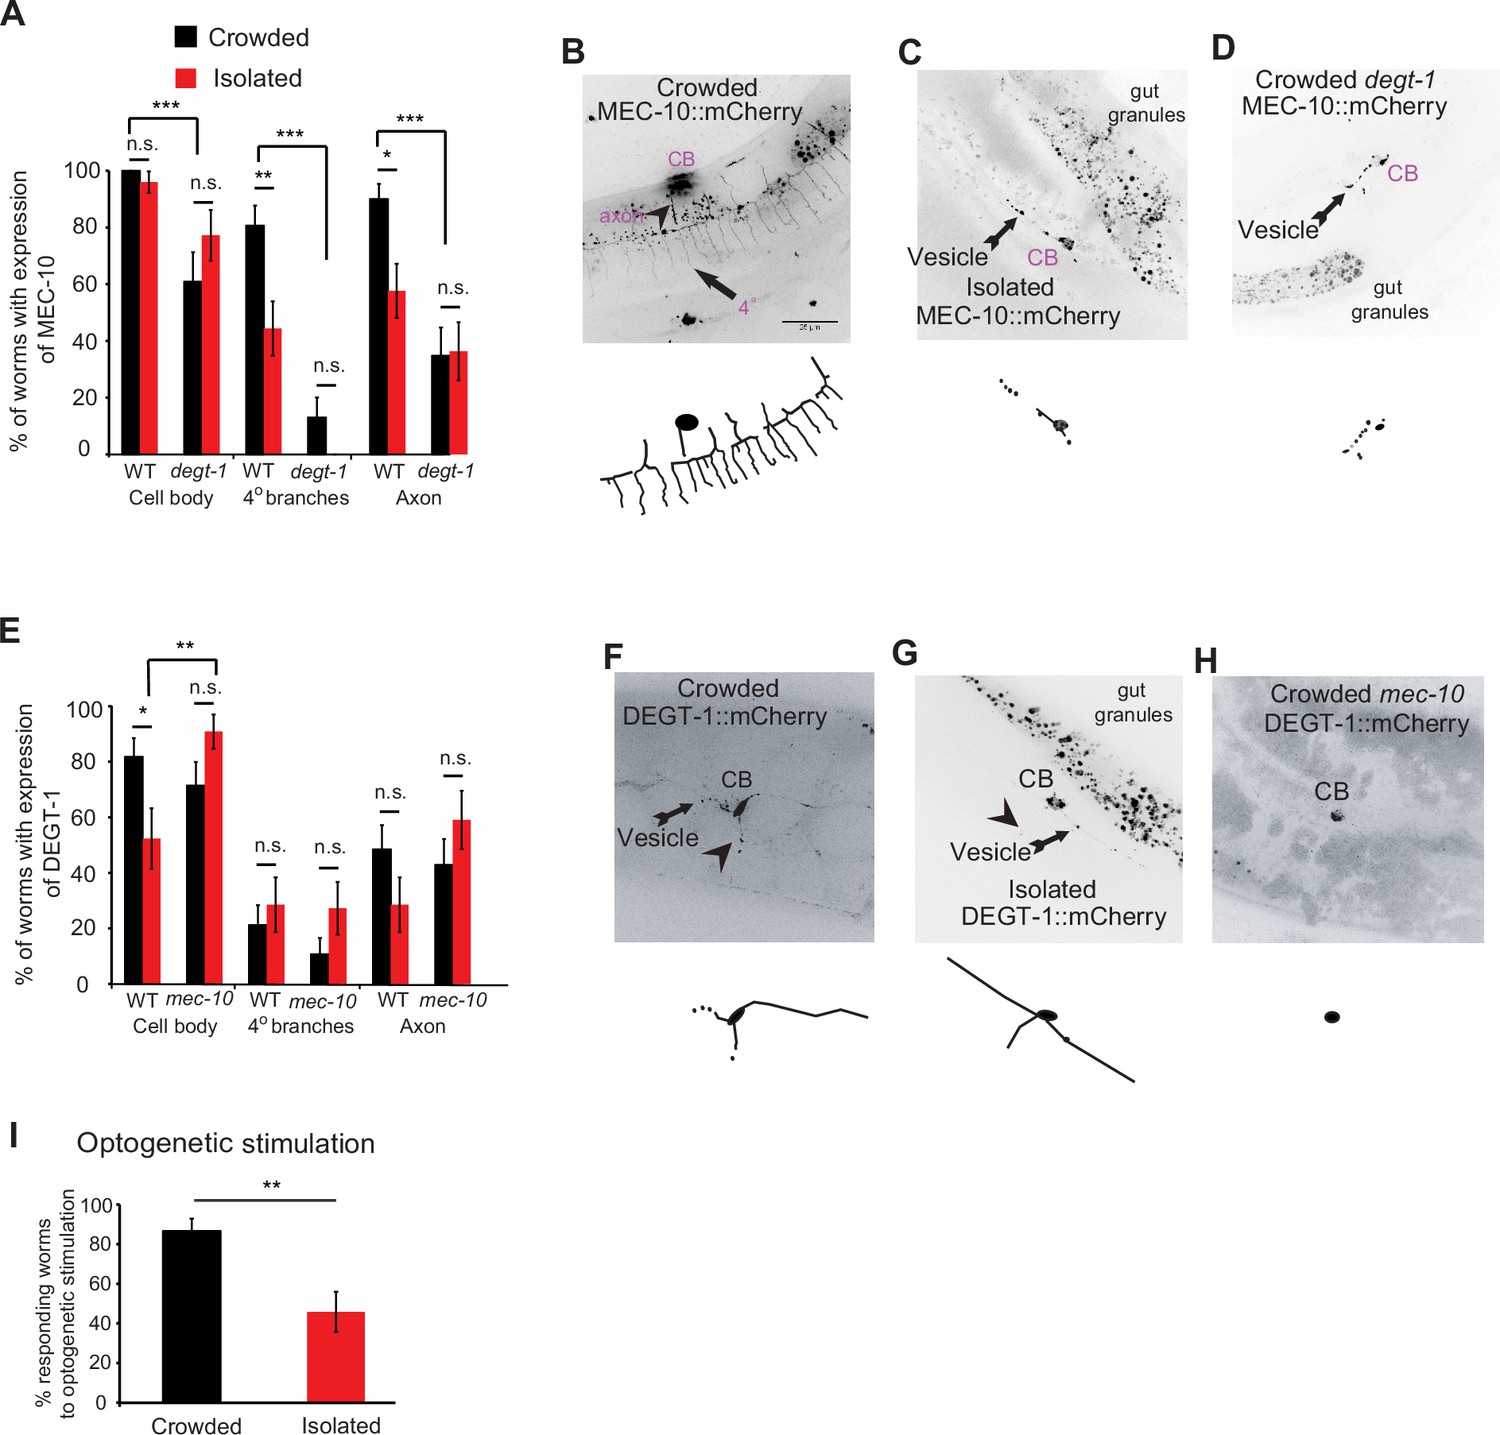
(A) PVD::MEC-10::mCherry localization (shown and labeled in purple, and in blue in Figure 7) is reduced in the quaternary branches and the axon following isolation, in a degt-1-dependent manner (wildtype [WT]: Crowded, n = 31; Isolated, n = 27; degt-1 mutants: Crowded, n = 23; Isolated, n = 22). (B–D) Representative images and reconstructions for PVD::mec-10::mCherry localization for crowded and isolated WT worms, and crowded degt-1 worms (scale bar, 25 µm). (E) PVD::degt-1::mCherry localization level is reduced at the cell body, but not in the quaternary branches or the axon, following isolation, in a mec-10-dependent manner (WT: Crowded, n = 33; Isolated, n = 21; mec-10 mutants: Crowded, n = 28; Isolated, n = 22). The percentage of expressing worms ± standard error of proportion is shown. (F–H) Representative images and reconstructions for PVD::degt-1::mCherry localization for crowded and isolated WT worms and crowded mec-10 worms. (I) Isolation leads to a reduced escape response following optogenetic photoactivation of Channelrhodopsin 2 in the PVD (Crowded, n = 30; Isolated, n = 24, grown on All Trans Retinal. No response was observed for worms grown without All Trans Retinal). Fisher’s exact test, *p < 0.05, **p < 0.01, ***p < 0.01, n.s., not significant.
-
Figure 5—source data 1
Original data file for Figure 5 graphs on mechanosensory-dependent localization of degenerins and optogenetics.
- https://cdn.elifesciences.org/articles/83973/elife-83973-fig5-data1-v2.xlsx
Figure 5—figure supplement 1
Optogenetic stimulation of isolated worms does not affect the morphology of the PVD.
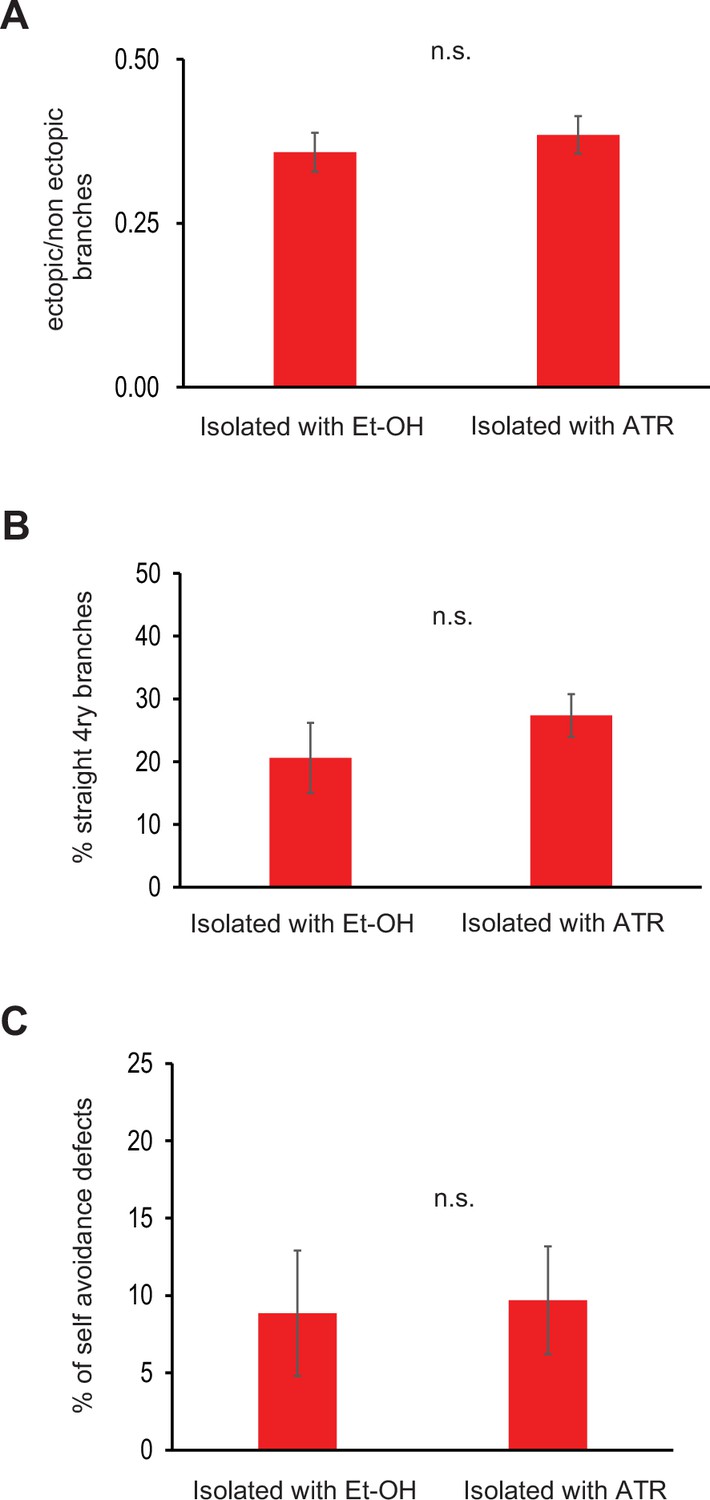
Worms were grown isolated with (n = 8) and without (n = 10) all trans retinal and subjected to 4 hr light stimulation at 488 nm. Light stimulation with all trans retinal does not affect the amount of ectopic branching (A), the geometry of the quaternary branches (B), or the the proportion of self-avoidance defects (C). n.s., not significant. The mean ± SEM are shown for panels A–C.
-
Figure 5—figure supplement 1—source data 1
Original data file for Figure 5—figure supplement 1 on optogenetic stimulation of isolated worms does not affect the morphology of the PVD.
- https://cdn.elifesciences.org/articles/83973/elife-83973-fig5-figsupp1-data1-v2.xlsx
Figure 6 with 2 supplements
The calcium response to mechanical stimulation shows no significant difference between crowded and isolated worms.
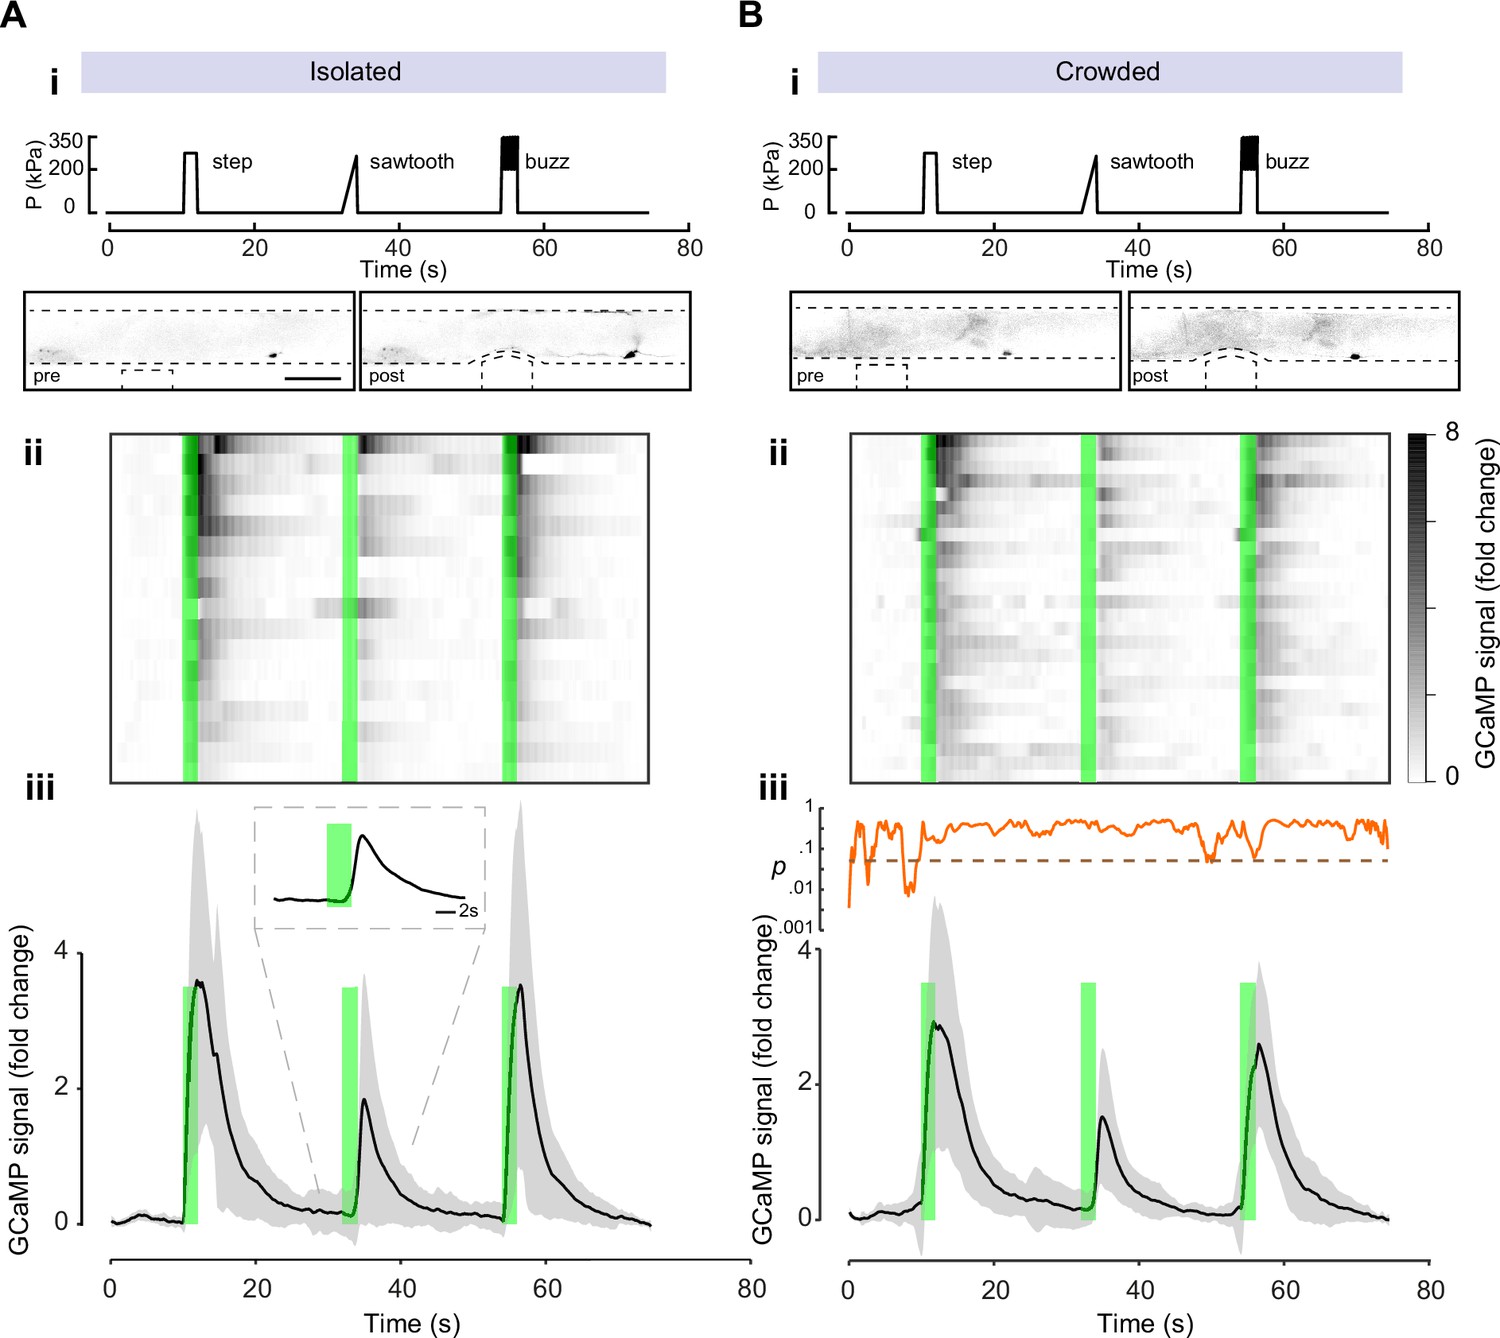
Mechanically induced calcium recordings of PVD of animals grown as (A) isolated individuals or (B) in crowded conditions. (i) Stimulus profile displaying a single step, sawtooth indentation or 10 Hz `buzz’. Bottom panels show examples of negative images from experiments at pre- and post-stimulation; note PVDs’ cell bodies about 200 μm to the right of the location of the mechanical stimuli. Scale bar, 50 μm. (ii) Kymograph of individual response for N = 17 animals and N = 27 animals for the crowded conditions. Green bars, time of application of a mechanical stimulus. (iii) Average GCaMP6s signal derived from the cell body of PVD for the duration of the recordings, black line. N = number of recordings. Mean ± standard deviation, gray region. Inset in panel iii shows the running p-value, comparing the crowded and isolated conditions (dashed line indicates alpha level of significance ∝ = 0.05).
-
Figure 6—source data 1
Original data file for Figure 6 graphs on calcium response to mechanical stimulation.
- https://cdn.elifesciences.org/articles/83973/elife-83973-fig6-data1-v2.xlsx
Figure 6—figure supplement 1

Basal calcium dynamics are indistinguishable for crowded and isolated worms.
The 90-s calcium dynamics of the PVD were measured in crowded (n = 16) and isolated (n = 17) worms. (A) Heatmaps representing the calcium activity for each worm. Note that the third isolated worm had a spontaneous Ca2+ activation. (B) The population averages for calcium dynamics. (C) The distribution of neuronal activity change across the populations of crowded and isolated worms.
-
Figure 6—figure supplement 1—source data 1
Original data file for Figure 6—figure supplement 1 on basal calcium dynamics is indistinguishable for crowded and isolated worms.
- https://cdn.elifesciences.org/articles/83973/elife-83973-fig6-figsupp1-data1-v2.xlsx
Figure 6—figure supplement 2
Calcium response in the PVD is sensitive to both onset and offset of the mechanical stimulus signals.
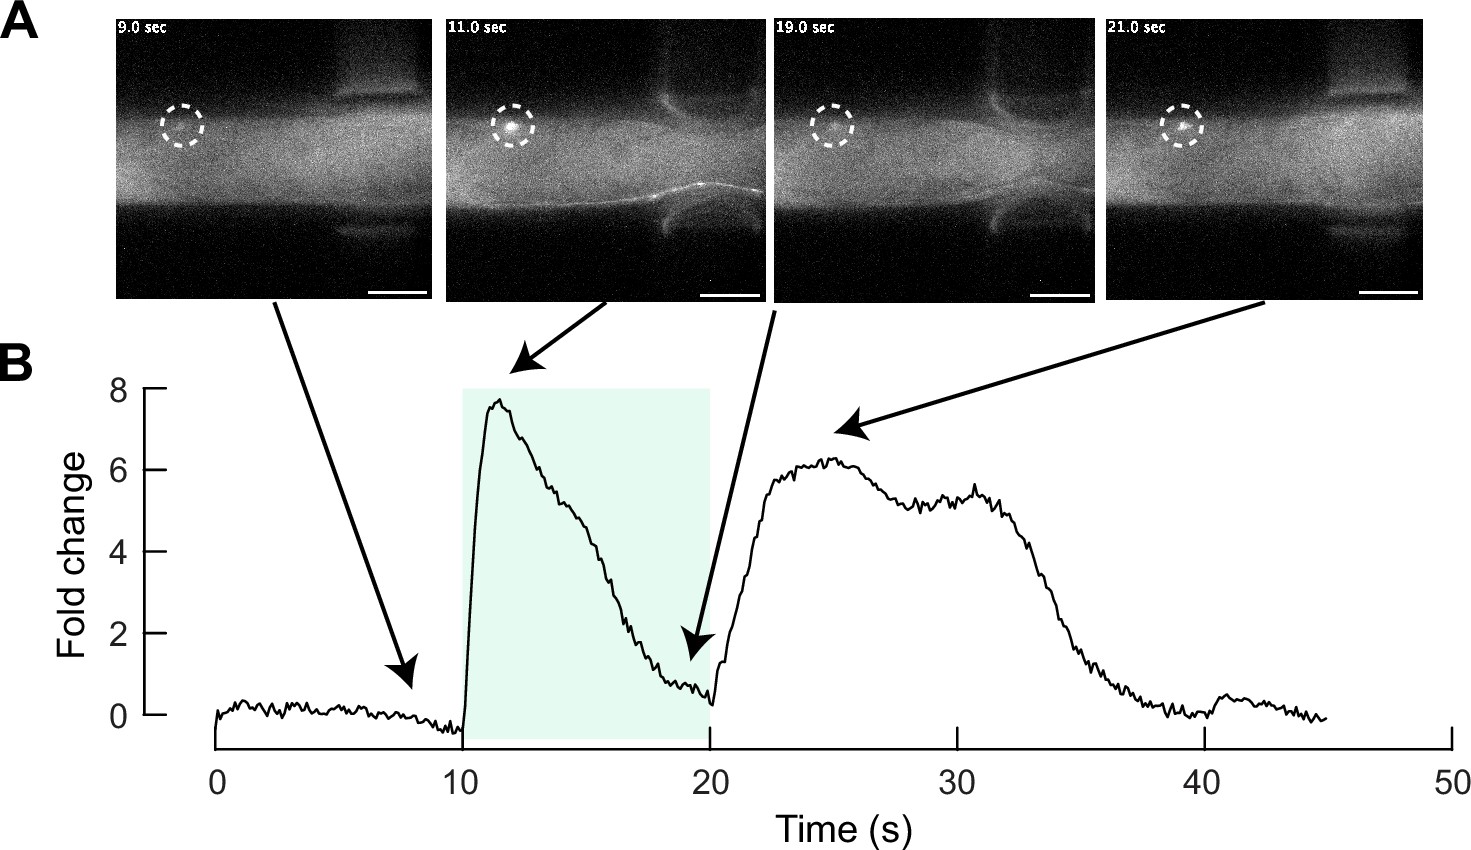
Mechanically induced calcium recordings of PVD of animals in a micromechanical device. (A) The GCaMP6s signal derived from the PVD before, during, and after application of a mechanosensory force within a micromechanical device. The cell body of the PVD is surrounded by a dashed circle. Scale bars, 100 μm. Note, to pressure channels fingers were actuated simultaneously in this particular experiment. (B) Quantification of GCaMP6s signal with the corresponding time frames indicated by arrows. Green region shows time of single step stimulus. See Video 7.
-
Figure 6—figure supplement 2—source data 1
Original data file for Figure 6—figure supplement 2 on calcium response in the PVD is sensitive to both onset and offset of the mechanical stimulus signals.
- https://cdn.elifesciences.org/articles/83973/elife-83973-fig6-figsupp2-data1-v2.xlsx
Figure 7 with 1 supplement
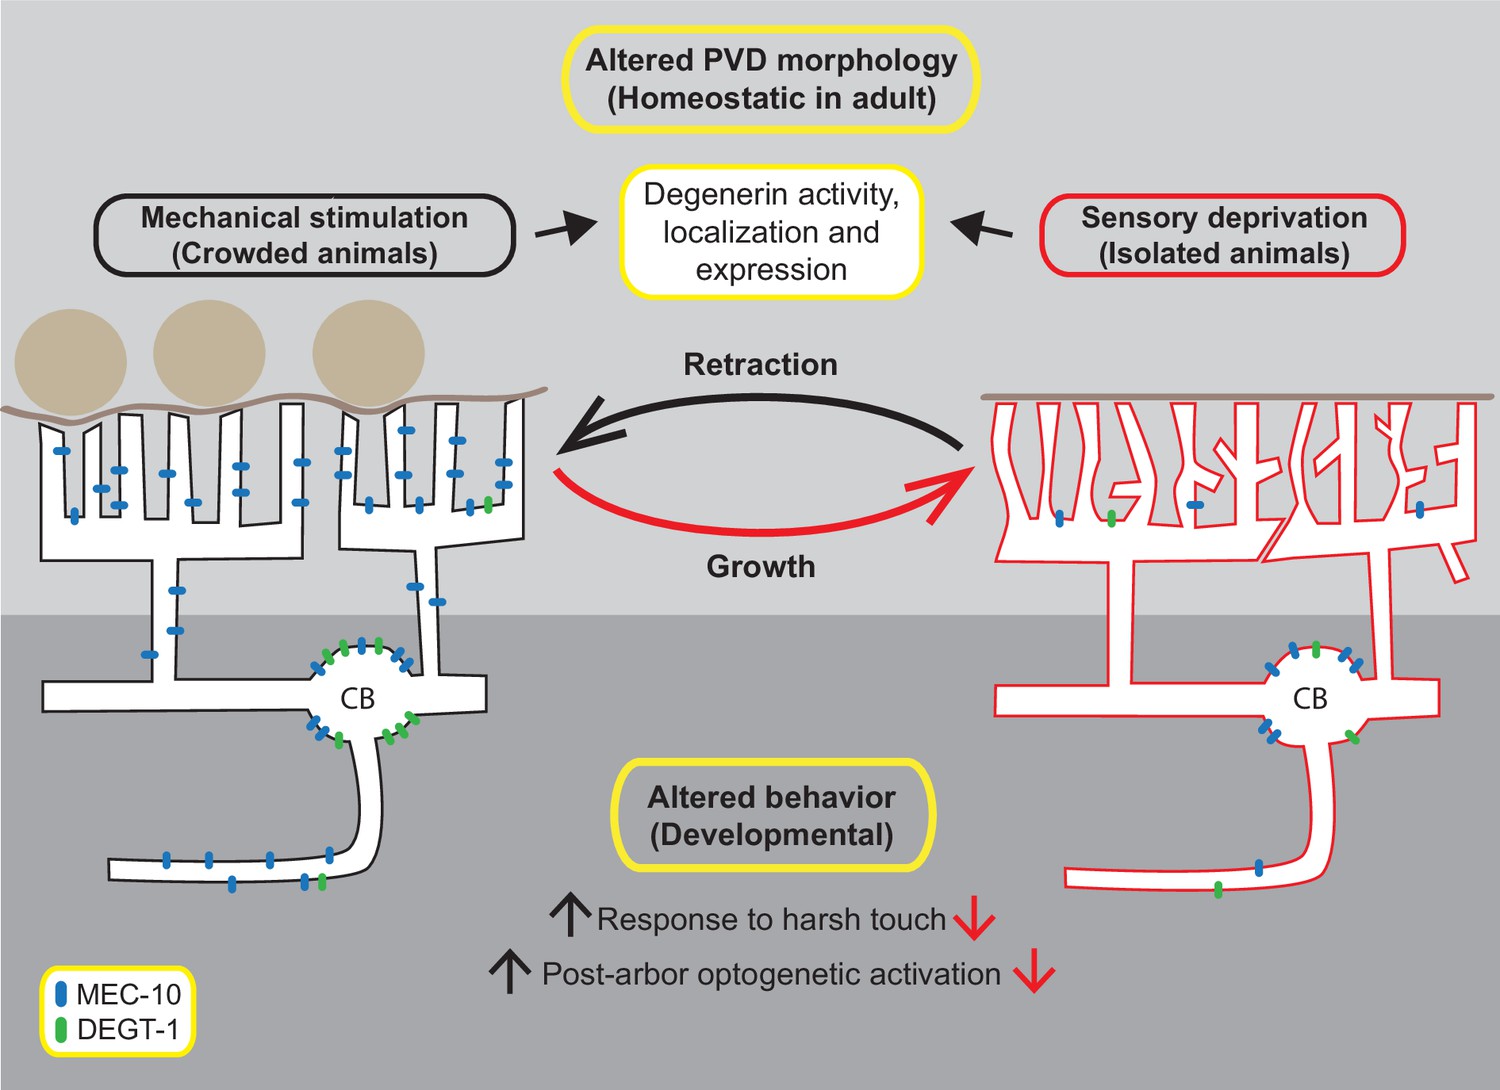
Model of experience-induced structural and behavioral plasticity.
During adulthood, mechanosensory signals maintain the structure of the PVD in crowded animals, with straight quaternary branches and fewer ectopic branches. Sensory deprivation (in isolated animals) results in ectopic dendrites, wavy branches and defects in candelabra self-avoidance. During development, mechanosensory experience alters the response to harsh touch and the crawling gait of the worm (Inberg et al., 2021), possibly through changes in MEC-10 localization in the axon and mediated by other DEG/ENaCs. Mechanosensory stimuli are a driving force for changes in the compartment-specific localization of MEC-10 and DEGT-1 in the PVD, which may affect the structure of the PVD. MEC-10 is represented in blue, DEGT-1 is represented in green.
Figure 7—figure supplement 1
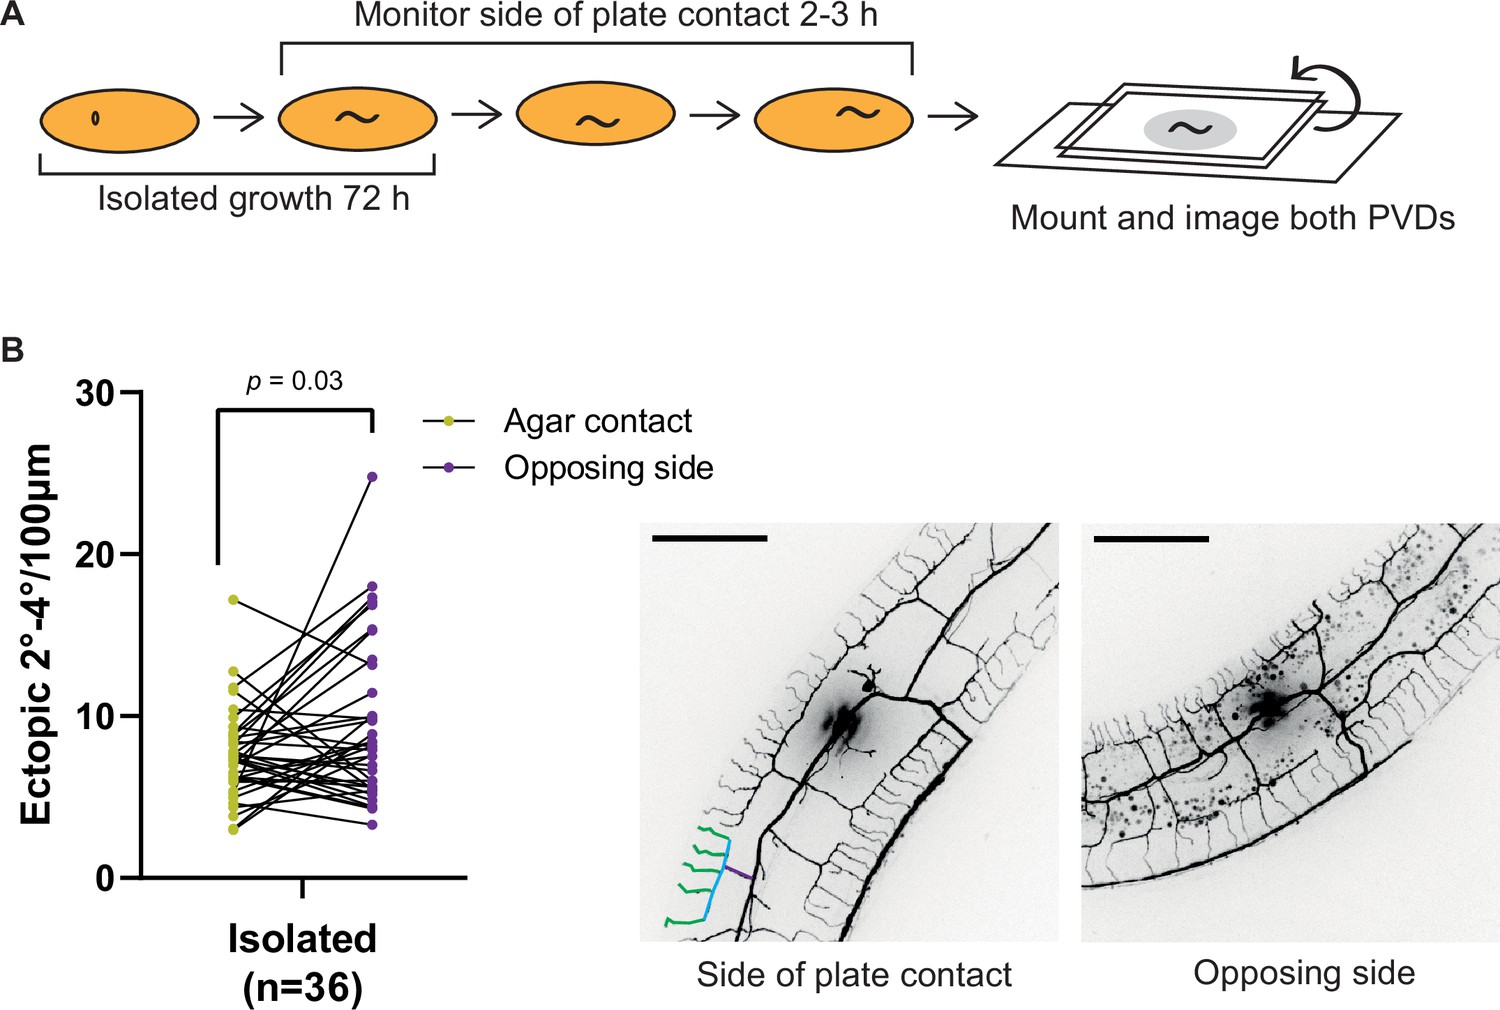
Side of plate contact alone over several hours is insufficient to elicit a difference in ectopic branching.
(A) Experiment scheme. An isolated animal is monitored in adulthood to validate same-side contact with the agar plate over several hours, prior to imaging and blind analysis of both PVD neurons using a rotatable agar pad. (B) Left: ectopic branch end counts of orders 2°, 3° and 4°, normalized to primary (1°) branch length are similar between sides, despite laterally asymmetric plate contact. Lines connect same-animal PVDs on the agar-contacting side (gold) and opposite side (purple); Right: representative images of both PVD neurons of an animal found to be consistently lying on its left side. One representative candelabrum is colored as in Figure 1A. Scale bars, 50 μm.
-
Figure 7—figure supplement 1—source data 1
Original data file for Figure 7—figure supplement 1 on side of plate contact alone over several hours is insufficient to elicit a difference in ectopic branching.
- https://cdn.elifesciences.org/articles/83973/elife-83973-fig7-figsupp1-data1-v2.xlsx
Author response image 1
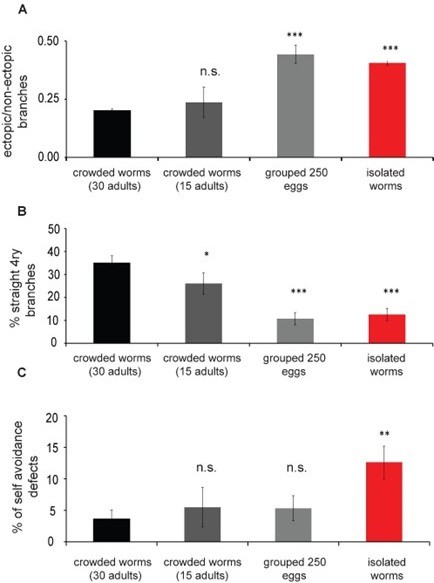
PVD morphology is dependent on the density of the worms in the plate.
Worms were grown at different population densities, either as progeny from 30 adults on the plate, progeny of 15 adults or 250 eggs collected from the source plate (crowded 30 adults, n=28; crowded 15 adults, n=12; 250 eggs, n=19; isolated single worm, n=26) for 72 h. PVD morphology was quantified at ~24 h of adulthood. (A) Animals raised as isolated or from 250 eggs in the plate show an increased amount of ectopic branching compared to crowded 30 worms. (B). Straight quaternary branches were reduced in all other plate densities assayed when compared with the progeny of 30 adults. (C) Isolated worms show increased selfavoidance defects compared with crowded progeny of 30 worms. Mann Whitney test: *p<0.05, **p<0.005, ***p<0.0005.
Videos
Video 1
Time lapse of cell body and arborizations of a wildtype young adult grown under crowded conditions and anesthetized with 1% tricaine.
Red arrows point to retracting branches. See Figure 3—figure supplement 2I for more details.
Video 2
Time lapse of cell body and arborizations of a wildtype young adult grown in isolated conditions and anesthetized with 1% tricaine.
Red arrows point to retracting branches. See Figure 3—figure supplement 2J for more details.
Video 3
Localization pattern of MEC-10::mCherry in the PVD crowded adult.
MEC-10 is localized in moving vesicles, indicated by red arrow. Six z-stack series (~60 optical slices for each) were taken around the cell body every 3 min.
Video 4
Localization pattern of MEC-10::mCherry in the PVD for crowded adult.
MEC-10 is localized in moving vesicles, indicated by red arrow. At time 00:00 quaternary branches can be seen. Six z-stack series (~60 optical slices for each) were taken around the cell body every 2 min.
Video 5
Calcium dynamics in the PVD of an isolated worm after mechanosensory stimulation.
PVD cell body received ipsilateral application of a mechanical stimulus, the calcium responses from the PVD were measured. See Figure 6 for more details. Scale bar, 40 µm.
Video 6
Calcium dynamics in the PVD of a representative crowded worm after mechanosensory stimulation.
PVD cell body received ipsilateral application of a mechanical stimulus, the calcium responses from the PVD were measured. See Figure 6 for more details. Scale bar, 40 µm.
Video 7
Calcium dynamics in the PVD is sensitive to both onset and offset signals.
PVD cell body received ipsilateral application of a mechanical stimulus and responded by increase in calcium signal for both the onset and offset stimulations. See Figure 6—figure supplement 2 for more details. Scale bar, 40 µm.
Additional files
-
Supplementary file 1
Lists of strains, transgenes and primers used in this work.
(a) List of strains and transgenes used in this work. (b) List of primers used in this work.
- https://cdn.elifesciences.org/articles/83973/elife-83973-supp1-v2.docx
-
MDAR checklist
- https://cdn.elifesciences.org/articles/83973/elife-83973-mdarchecklist1-v2.docx
Download links
A two-part list of links to download the article, or parts of the article, in various formats.
Downloads (link to download the article as PDF)
Open citations (links to open the citations from this article in various online reference manager services)
Cite this article (links to download the citations from this article in formats compatible with various reference manager tools)
Sensory experience controls dendritic structure and behavior by distinct pathways involving degenerins
eLife 14:e83973.
https://doi.org/10.7554/eLife.83973


