Nutrigenomic regulation of sensory plasticity
- Department of Molecular, Cellular and Developmental Biology, College of Literature, Science, and the Arts, The University of Michigan, United States
- The Molecular, Cellular and Developmental Biology Graduate Program, The University of Michigan, United States
- Department of Biological Chemistry, The University of Michigan Medical School, United States
- Department of Computational Medicine and Bioinformatics, The University of Michigan Medical School, United States
- The Michigan Neuroscience Institute, United States
Figures
Figure 1 with 2 supplements
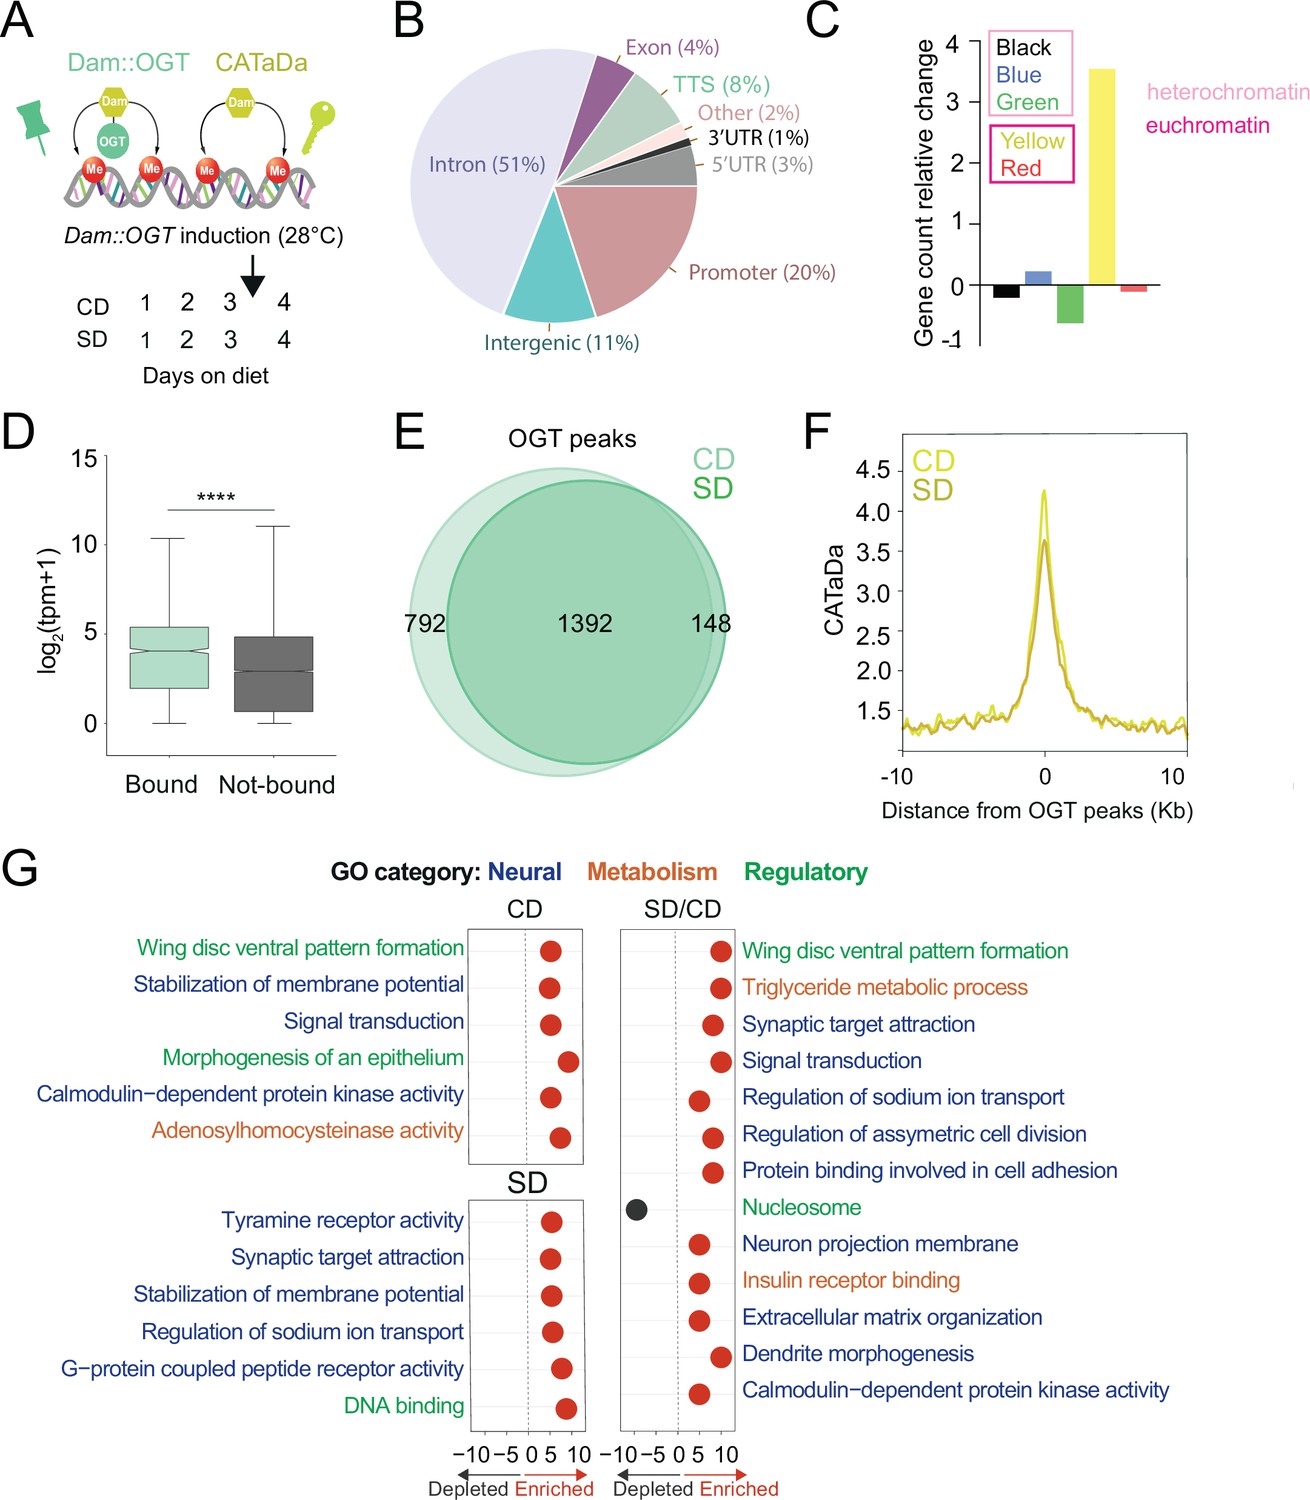
O-GlcNAc Transferase (OGT) decorates the chromatin of the sweet-taste cells.
(A) Design of Targeted Dam-ID for OGT occupancy (Dam::OGT) and Dam accessibility (CATaDa) experiments. Age-matched Gr5a;tubulin-GAL80ts>UAS-LT3-Dam::OGT and Gr5a;tubulin-GAL80ts>UAS-LT3-Dam flies were placed on a CD or SD for 3 days at 20–21°C and then switched to 28°C between days 3 and 4 to induce expression of the transgenes. (B) Annotation of OGT chromatin occupied regions (all peaks) using HOMER. (C) The proportion of observed Dam::OGT consensus peaks allocated to their respective chromatin domains normalized to the expected proportions across the whole genome. Heterochromatin: black, high in H3K27m; green, bound by HP-1, high in H3K9me2; blue, bound by Polycomb Group Proteins, high in H3K27m. Yellow and red euchromatin are high in H3K4me2 and H3K79m3; yellow is also enriched for H3K36me3. (D) The distribution in normalized reads (Transcript Per Million, TPM + 1) for genes occupied by OGT (green). Two-tailed t test, ****p<0.0001 (E) Overlap of log2(Dam::OGT/Dam) chromatin-binding peaks of CD (light green) and SD (dark green) (find_peaks, q < 0.01). (F) Average CATaDa signal on CD (light yellow) and SD (dark yellow) centered at OGT peaks. (G) iPAGE summary plots for OGT peaks on a CD (top left), SD (bottom left), and the difference of SD/CD (right). Text in blue represents neural GO terms, orange represents metabolic GO terms, and green represents regulatory GO terms.
Figure 1—figure supplement 1
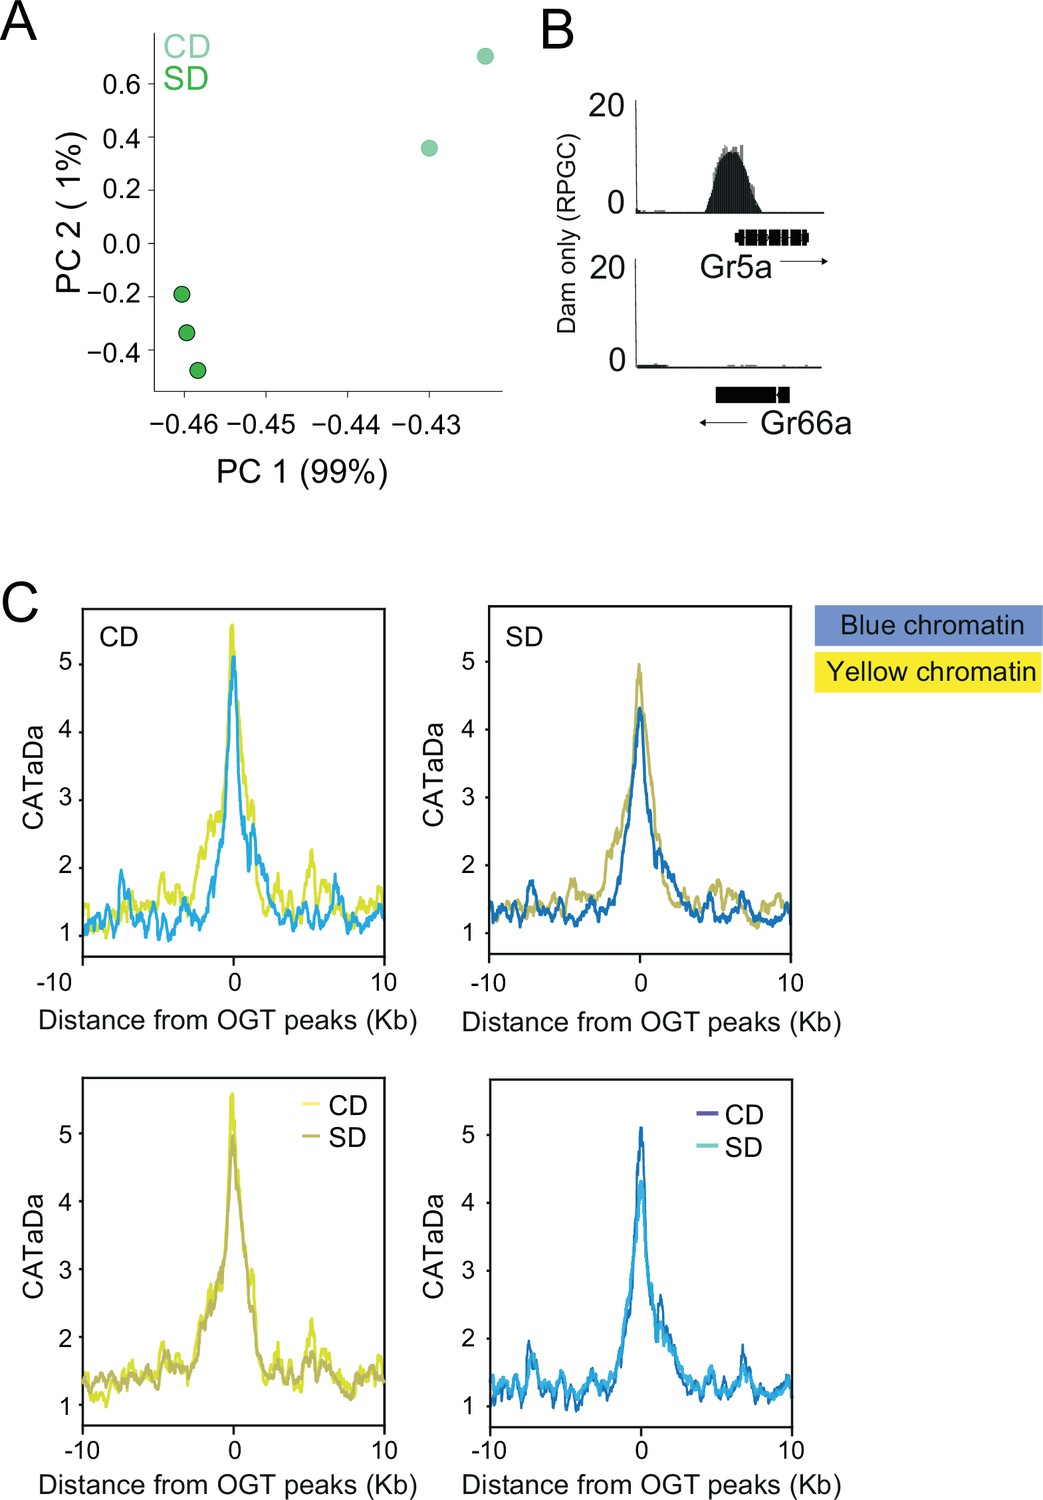
O-GlcNAc Transferase (OGT) resides on the chromatin of the Gr5a+ neurons.
(A) Principal component analysis of normalized log2(OGT::Dam/Dam) flies on CD (light green) or SD (dark green). (B) CATaDa from control diet flies at the sweet gustatory receptor Gr5a and the bitter gustatory receptor Gr66a. (C) Average CATaDa signal on CD (light) and SD (dark) centered at OGT peaks for genes in the blue and yellow chromatin intervals.
Figure 1—figure supplement 2
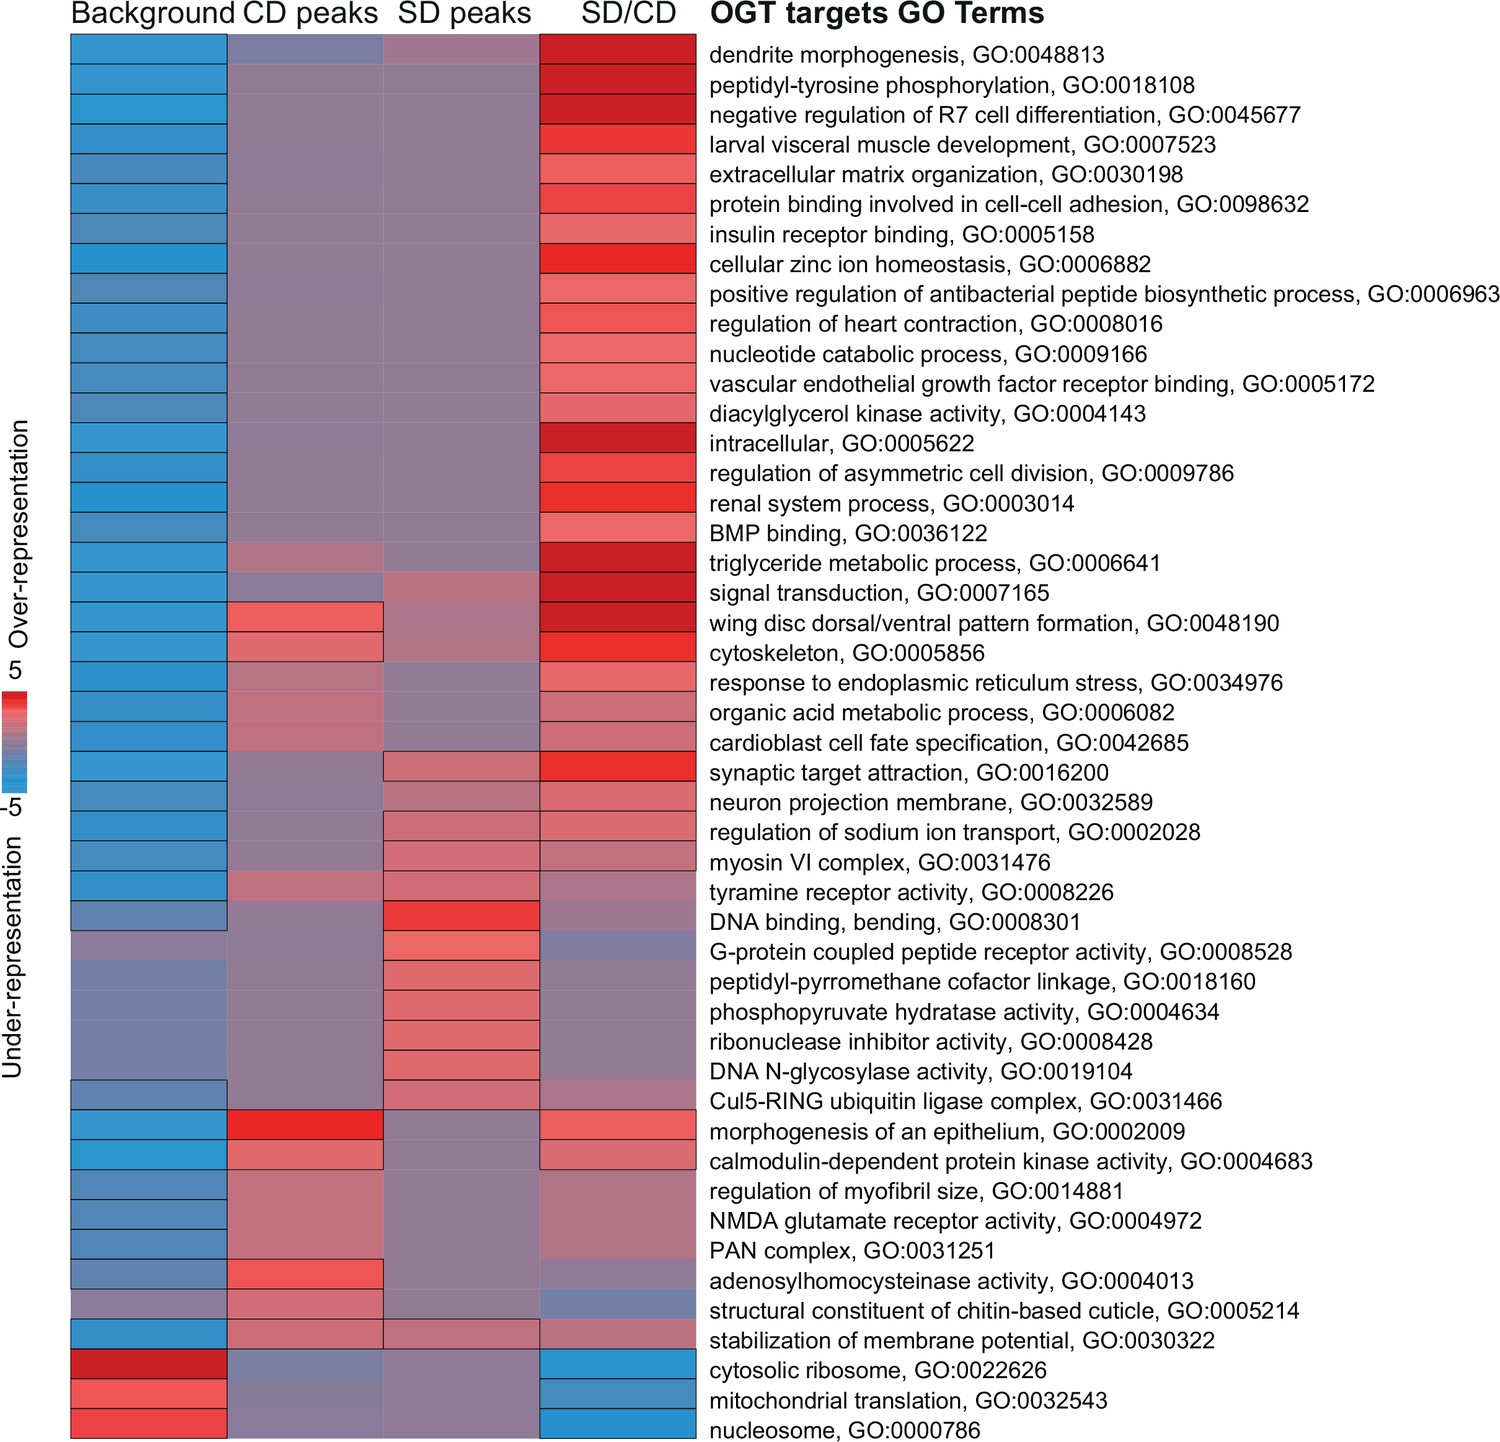
Pathway enrichment analysis of O-GlcNAc Transferase (OGT) chromatin targets in the Gr5a+ neurons.
iPAGE identification of pathways depleted (blue) or enriched (red) compared to background gene list from the OGT::Dam peaks on a control, sugar, and difference of sugar/control diet. The scale represents over-representation (red) or under-representation (blue) of genes within a specific bin for the corresponding GO term. Black outlined boxes represent q < 0.05.
Figure 2

O-GlcNAc Transferase (OGT) and Polycomb Repressive Complex 2.1 (PRC2.1) mark nutrient-sensitive chromatin in the sweet-taste cells.
(A) Diagram of the Targeted Dam-ID (TaDa occupancy, Dam::OGT green, and Dam::Pcl pink) and (CATaDa, accessibility, yellow) experiments analyzed in this figure. Overlap of log2(Dam::Pcl/Dam, pink) and log2(Dam::OGT/Dam, green) chromatin occupancy peaks (all peaks, peak calling: find_peaks, q<0.01). (B) The distribution in normalized reads (Transcript Per Million, TPM +1) for genes occupied by OGT (green), Pcl (pink), and OGT and Pcl (purple). Two-tailed t test, ****p<0.0001. (C) Average log2(Dam::OGT/Dam; left) and log2(Dam::Pcl/Dam) (right) signal on a CD (lighter shades) and SD (darker shades) diet centered at OGT + Pcl co-occupied peaks. (D) Average CATaDa signal on CD (lighter shade) and SD (darker shade) centered at OGT + Pcl co-occupied peaks. (E) (left) iPAGE pathway analysis of genes co-occupied by OGT and Pcl and (right) STRING interaction network of genes co-occupied by OGT + Pcl, colors represent GO terms from the pathway enrichment analysis.
Figure 3
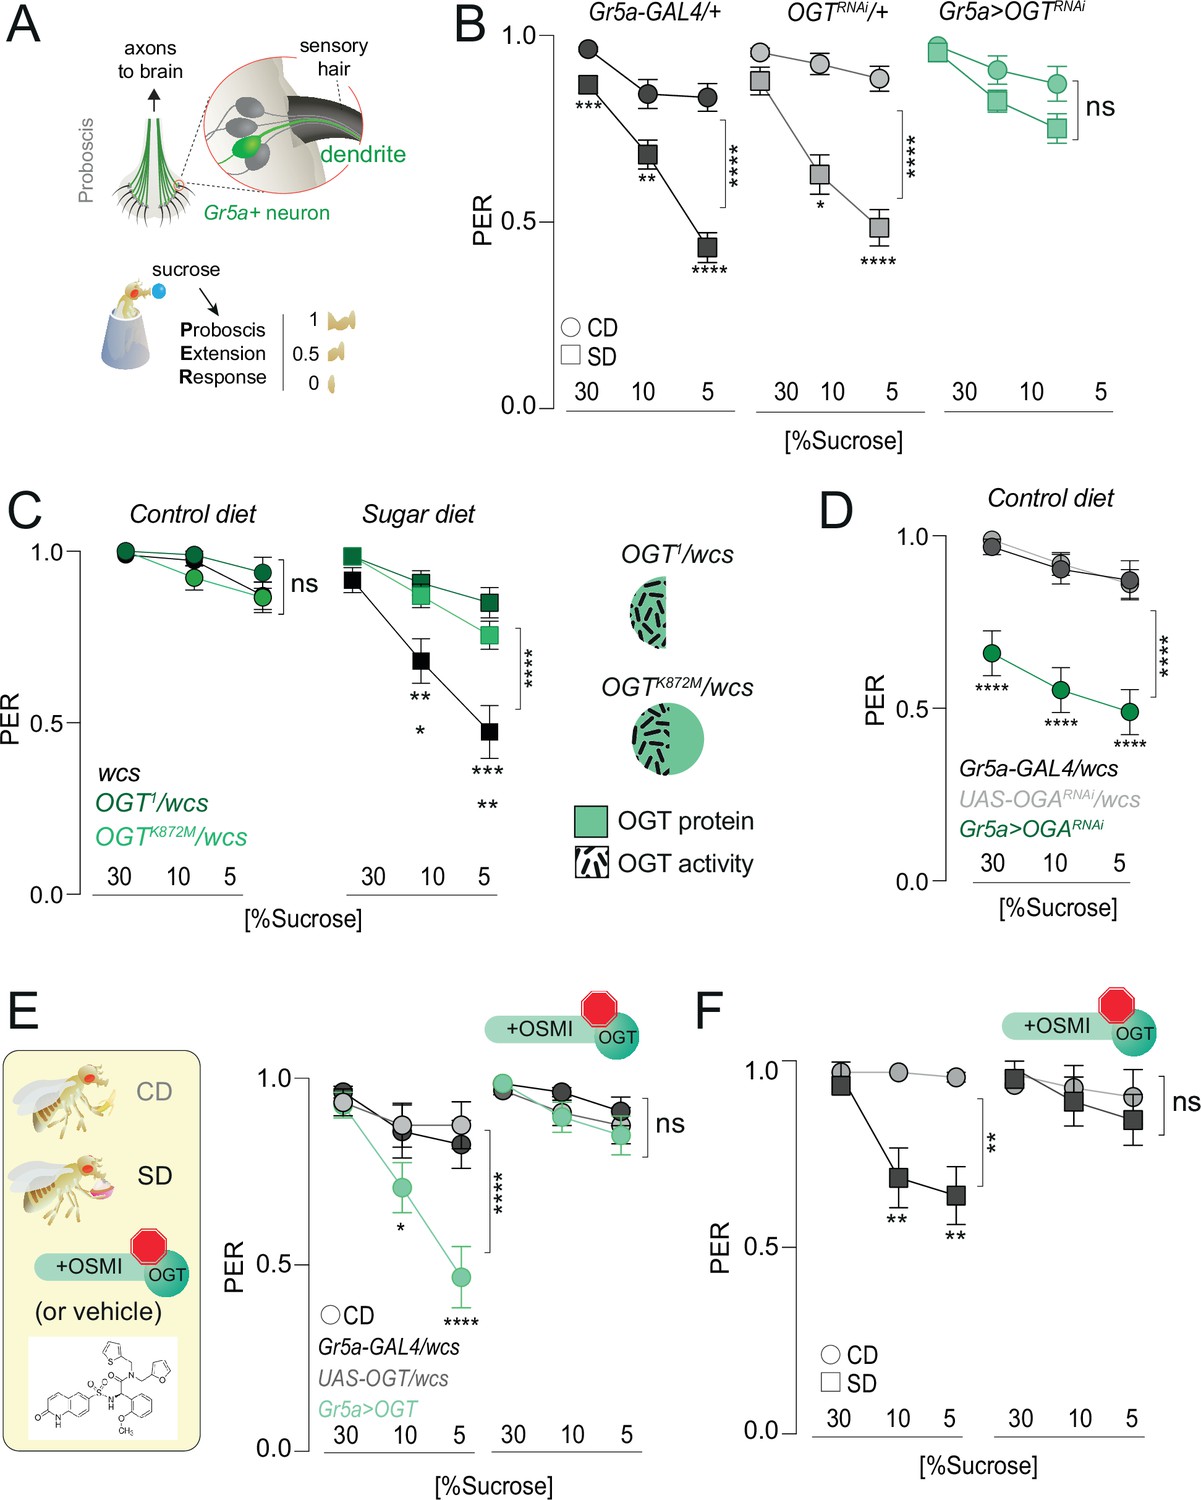
O-GlcNAc Transferase (OGT) activity is necessary for taste plasticity in response to the sugar diet environment.
(A) (top) Anatomy of the sensory system showing the cell bodies, dendrites, and axons of the sweet-sensing Gr5a+ neurons; (bottom) Diagram of the Proboscis Extension Response (PER). (B) Taste responses (y-axis) to stimulation of the labellum with 30, 10, and 5% sucrose (x-axis) in flies with knockdown of OGT (green) or controls (shades of gray) in flies fed a CD (circles) or SD (squares); n = 18–51. Two-way repeated measure analysis of variance (ANOVA), main effect of genotype: Gr5a>wcs p < 0.0001 (Tukey multiple comparison 30% p = 0.0008, 10% p = 0.0047, 5% p < 0.0001), Gr5a>OGT-RNAi p = 0.2657 (Sidak multiple comparison 30% p = 0.2792, 10% p = 0.9756, 5% p = 0.4883), OGT-RNAi>wcs (Sidak multiple comparison 30% p = 0.5923, 10% p = 0.0381, 5% p < 0.0001). (C) Taste responses (y-axis) to stimulation of the labellum with 30, 10, and 5% sucrose (x-axis) in flies with mutations in OGT (green) or controls (black) while on a control diet (CD, n = 16–26) or SD, n = 26–29. Two-way repeated measure ANOVA, main effect of genotype compared to wcs controls: ****p < 0.0001. Tukey multiple comparisons test, ****p < 0.0001, ***p < 0.001, **p < 0.01, *p < 0.05. (right) Diagram of OGT alleles: OGT1, protein null, OGTK872M catalytically dead. (D) Taste responses (y-axis) to stimulation of the labellum with 30, 10, and 5% sucrose (x-axis) in flies with knowdown of OGA (green) or controls (shades of gray) while on a control diet (CD), n = 31–47. Two-way repeated measure ANOVA, main effect of Gr5a>OGARNAi genotype compared to each control genotype: ****p < 0.0001. Tukey multiple comparisons test, ****p < 0.0001. (E) (left) Diagram of experiments with 10 μM OGT Small Molecule Inhibitor-1 (OSMI-1) in E and F; (right) taste responses (y-axis) to stimulation of the labellum with 30, 10, and 5% sucrose (x-axis) in flies with overexpression of OGT (green) or controls (shades of gray) while on a control diet (CD) supplemented with OSMI or vehicle, n = 19–22. Two-way repeated measure ANOVA, main effect of Gr5a>OGT genotype compared to each control genotype: ****p < 0.0001. Tukey multiple comparisons test, ****p < 0.0001 and *p < 0.05. (F) Taste responses (y-axis) to stimulation of the labellum with 30, 10, and 5% sucrose (x-axis) of age-matched male w1118cs flies on a CD (circle) or SD (square) diet with vehicle (DMSO) or OSMI. n = 14–17. Two-way repeated measure ANOVA, main effect of OSMI treatment p = 0.0089; Tukey multiple comparisons test for 30, 10, and 5% sucrose: (1) CD vs. SD (DMSO) p < 0.05, p = 0.0090, p = 0.0034 and (2) CD vs. SD (+OSMI-1), p > 0.05 at all concentrations. Data are shown as mean ± standard error of the mean (SEM).
Figure 4 with 4 supplements
O-GlcNAc Transferase (OGT) activity is necessary for chromatin and transcriptional dynamics in response to the sugar diet environment.
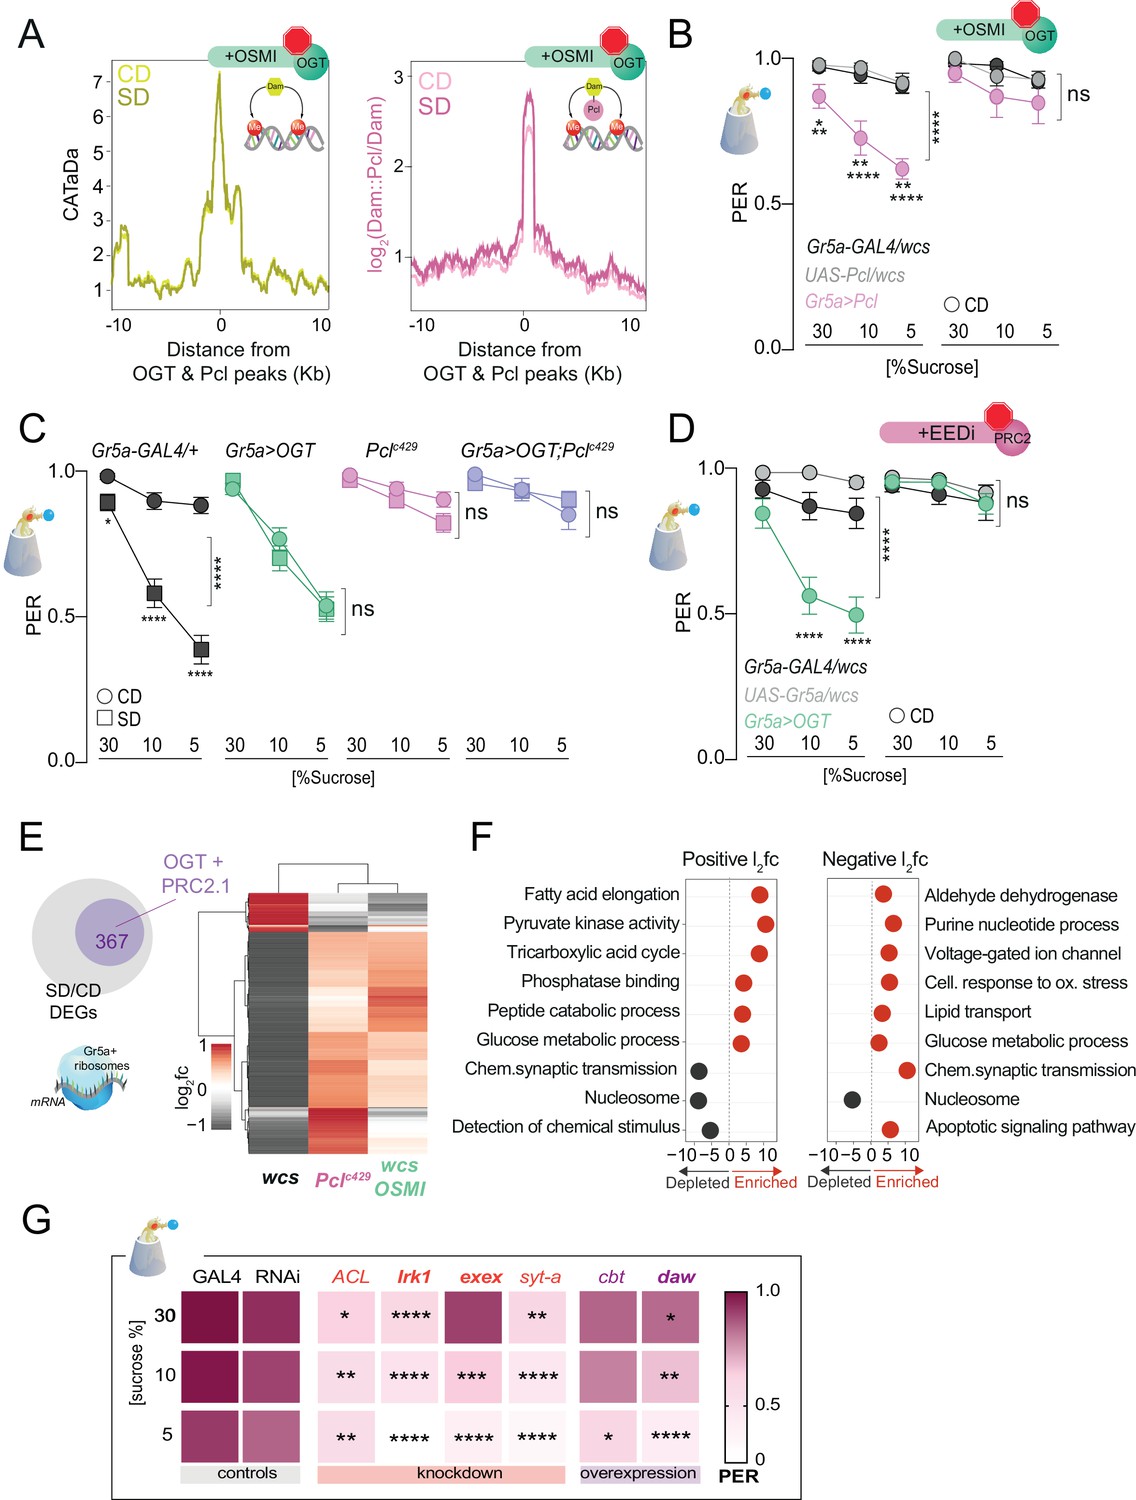
(A) (left) Average CATaDa signal on a CD (light yellow) and SD (dark yellow) with OSMI centered at OGT + Pcl peaks (compare to Figure 2D); (right) Average log2 Dam::Pcl/Dam signal on a CD (light pink) and SD (dark pink) with OSMI centered at OGT + Pcl peaks (compare to Figure 2). (B) Taste responses (y-axis) to stimulation of the labellum with 30, 10, and 5% sucrose (x-axis) of age-matched male Gr5a>Pcl (pink) and transgenic controls (shades of gray) on CD supplemented with vehicle (DMSO, n = 14–23) or 10 µM OSMI (n = 20–42). Two-way repeated measure analysis of variance (ANOVA): (1) DMSO, main effect of genotype (****p < 0.0001) and genotype x concentration (*p < 0.05); Tukey multiple comparisons test for 30, 10, and 5% sucrose concentrations: Gr5a>wcs vs. Gr5a>Pcl p = 0.0165, p = 0.0056, p = 0.0025; Pcl>wcs vs. Gr5a>wcs, ns. (2) OSMI: main effect of genotype p = 0.3194 and genotype × concentration p = 0.6893. (C) Taste responses (y-axis) to stimulation of the labellum with 30, 10, and 5% sucrose (x-axis) in Gr5a>OGT;Pclc429 (purple), Gr5a>OGT (green), Pclc429/+ (pink), and transgenic controls (gray) on CD or SD, n = 20–37. Two way repeated measure ANOVA, main effect of diet: ****p < 0.0001. Tukey multiple comparisons test, ****p < 0.0001 and *p < 0.05. (D) Taste responses (y-axis) to stimulation of the labellum with 30, 10, and 5% sucrose (x-axis) in Gr5a>OGT (green) and transgenic controls (shades of gray) on a CD supplemented with vehicle or 8 µM EEDi, n = 20–22. Two-way repeated measure ANOVA, main effect of Gr5a>OGT genotype compared to each control genotype: ****p < 0.0001. Tukey multiple comparisons test, ****p < 0.0001. (E) Log2fold (l2fc) of differentially expressed genes (DEGs) between SD/CD in w1118cs ± OSMI and Pclc429 SD/CD. (F) GO term analysis of the DEGs measured in the Gr5a+ neurons of flies fed a CD and SD + OSMI. (G) Taste responses (y-axis) to stimulation of the labellum with 30, 10, and 5% sucrose (x-axis) for a subset of DEGs in (E, purple circle) that show dependence on OGT and Polycomb Repressive Complex 2.1 (PRC2.1). n = 14–49. Purple, knockdown; red, overexpression; bold, direct OGT/PRC2.1 targets. Two-way repeated measure ANOVA, main effect of GAL4>wcs control genotype compared to each control genotype: ****p <0.0001. Tukey multiple comparisons test, ****p < 0.0001, ***p < 0.001, **p < 0.01, *p < 0.05. ACL, ATP Citrate Lyase; Irk1, inwardly rectifier potassium channel 1; daw, dawdle; cbt, cabut; exex, extra extra; syt-a, synaptotagmin alpha. Data are shown as mean ± standard error of the mean (SEM).
Figure 4—figure supplement 1
Pcl occupancy at PRE and Pcl peaks with inhibition of O-GlcNAc Transferase (OGT) activity.
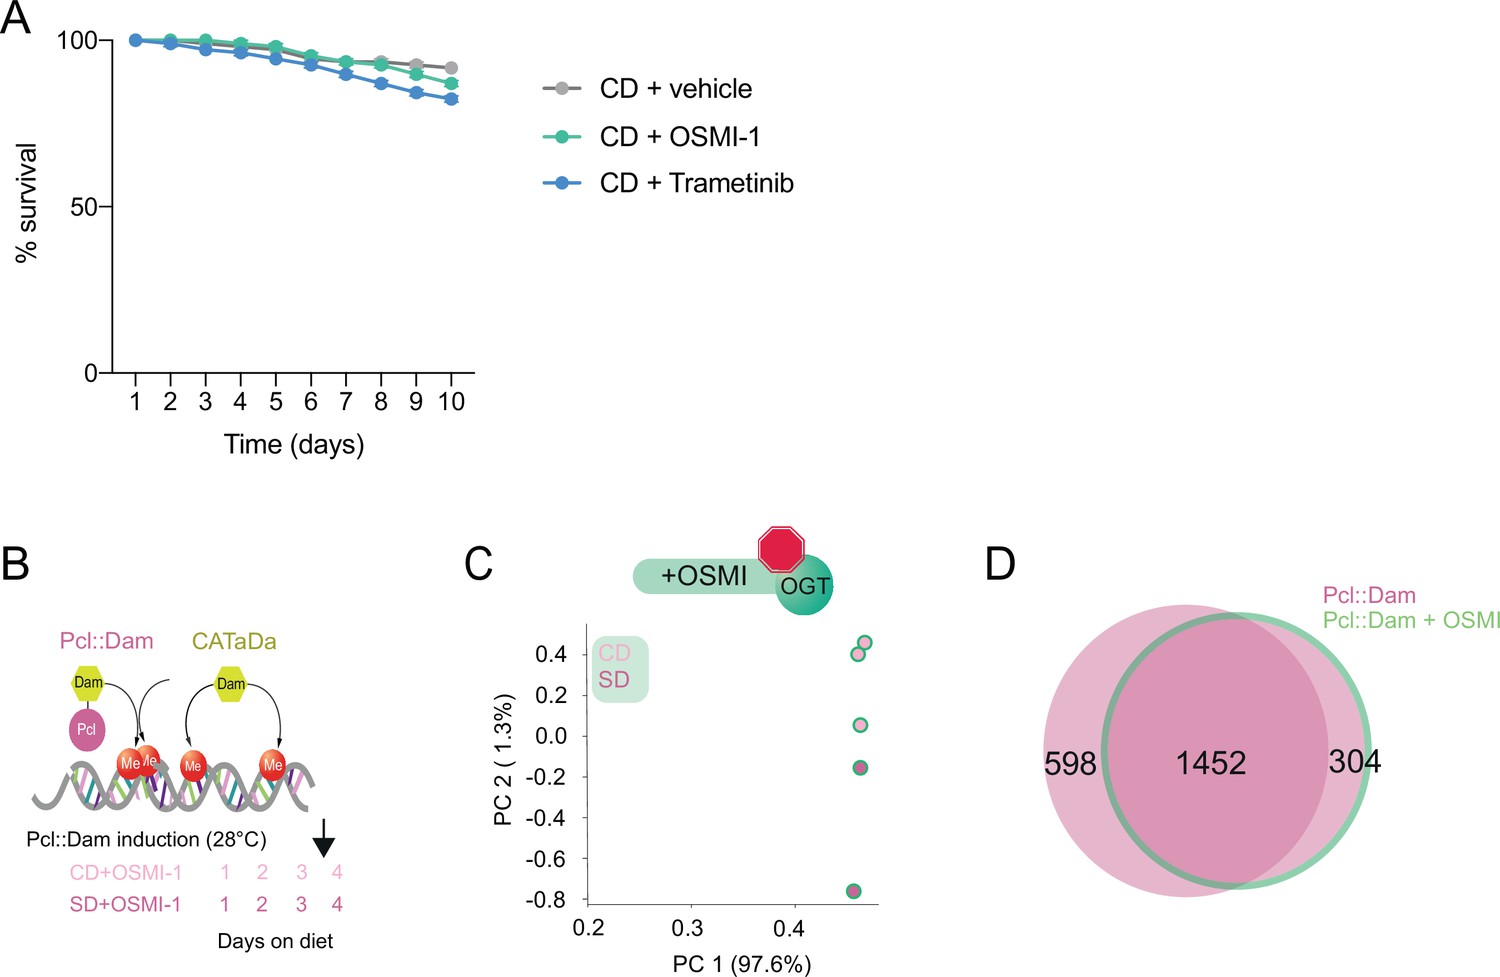
(A) Effects of OSMI and Tretmetibin treatments on survival, n = 3 vials of 30 flies each. One-way analysis of variance (ANOVA) with Dunnett’s test. (B) Design of the TaDa and CaTaDa experiment in flies fed a CD + OSMI and SD + OSMI. (C) Principal component analysis of normalized log2(Pcl::Dam/Dam) flies on CD + OSMI (light pink) or SD + OSMI (dark pink). (D) Overlap of log2(Dam::Pcl/Dam) chromatin occupancy peaks in flies with (green outline) or without (pink) OSMI (find_peaks, q < 0.01).
Figure 4—figure supplement 2
Pathway enrichment analysis of the effects of OSMI on Dam::Pcl peaks.
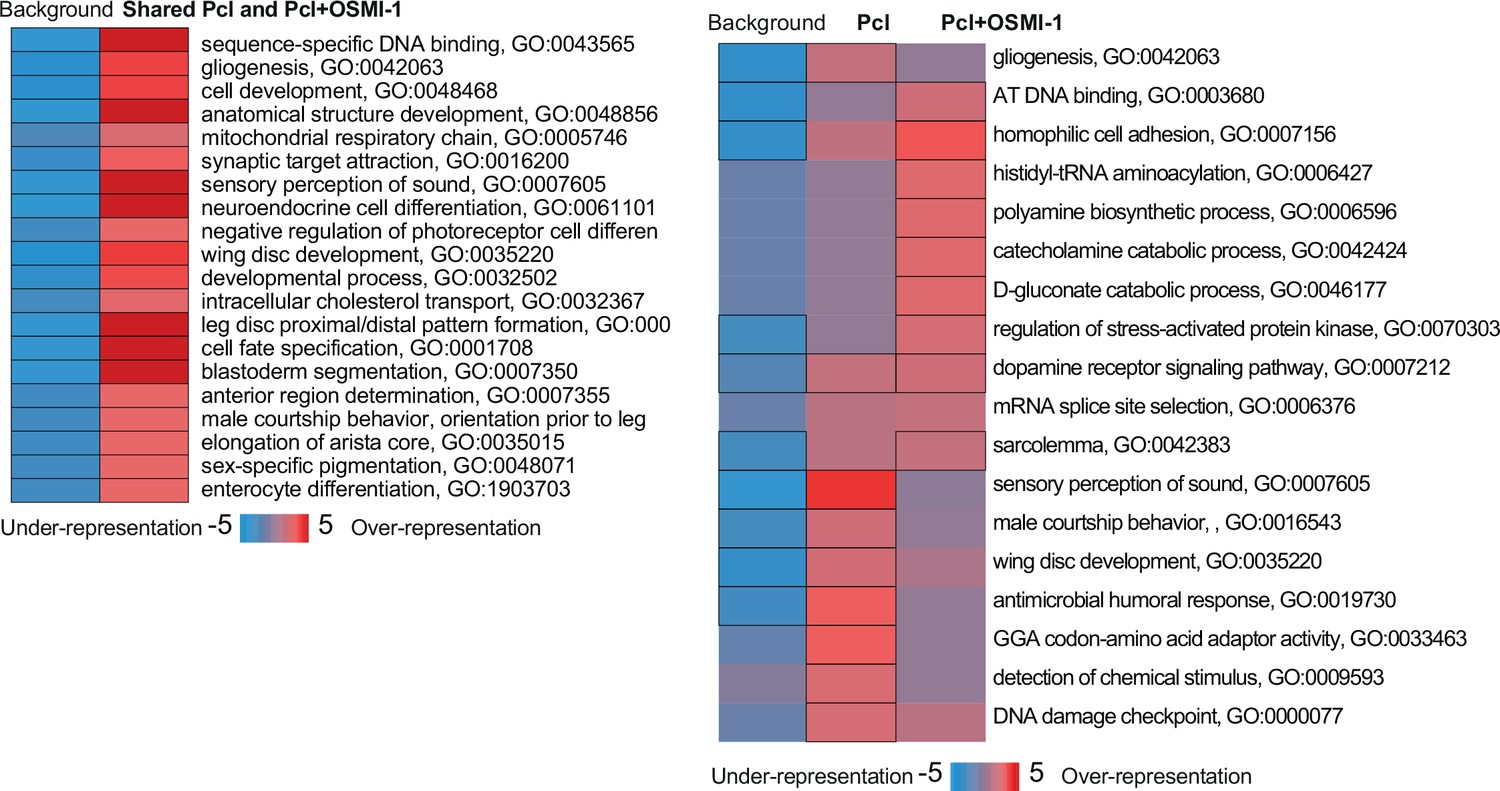
iPAGE identification of pathways depleted (blue) or enriched (red) compared to background gene list from the Dam::Pcl peaks shared (left) or different (right) between SD/CD with or without OSMI. Scale represents over-representation (red) or under-representation (blue) of genes within a specific bin for the corresponding GO term. Black outlined boxes represent q < 0.05.
Figure 4—figure supplement 3
Transcriptional responses to the dietary environment when O-GlcNAc Transferase (OGT) activity was inhibited.
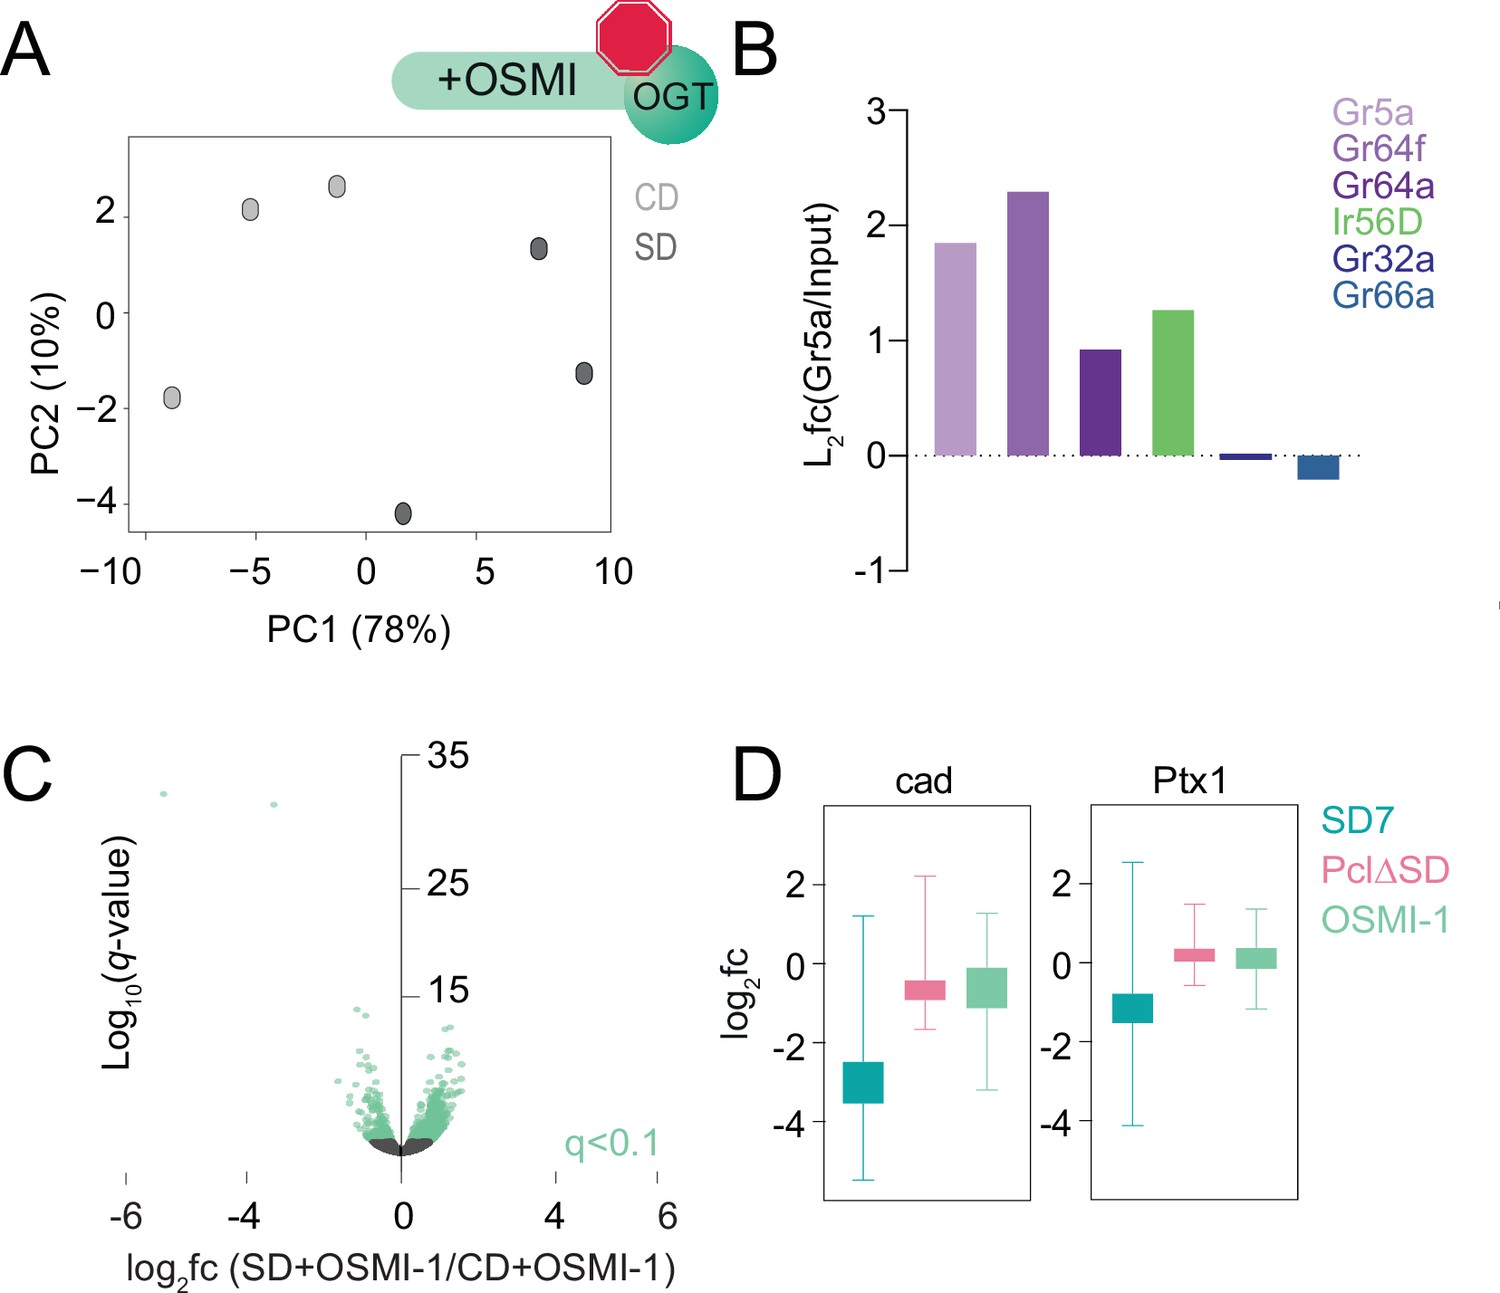
(A) Principal component analysis of Gr5a>UAS-Rpl3-3XFLAG flies on a control (light gray) or sugar (dark gray) diet for 7 days supplemented with OSMI-1. (B) Log2fold change (l2fc) (Gr5a IP/Input) for Gr5a, Gr64f, Gr64a, Ir56D, Gr32a, and Gr66a genes. (C) Volcano plot representing differential expression in the Gr5a+ neurons of age-matched male Gr5a>UAS-Rpl3-3XFLAG flies on a control or sugar diet for 7 days supplemented with OSMI. n = 3 replicates per condition. Genes with q < 0.1 (Wald test) are in green. (D) Log2fold change (l2fc) for candidate gene targets of Cad and Ptx1 at SD7 (teal), Pclc429 (pink), and OSMI fed flies at SD7 (green).
Figure 4—figure supplement 4
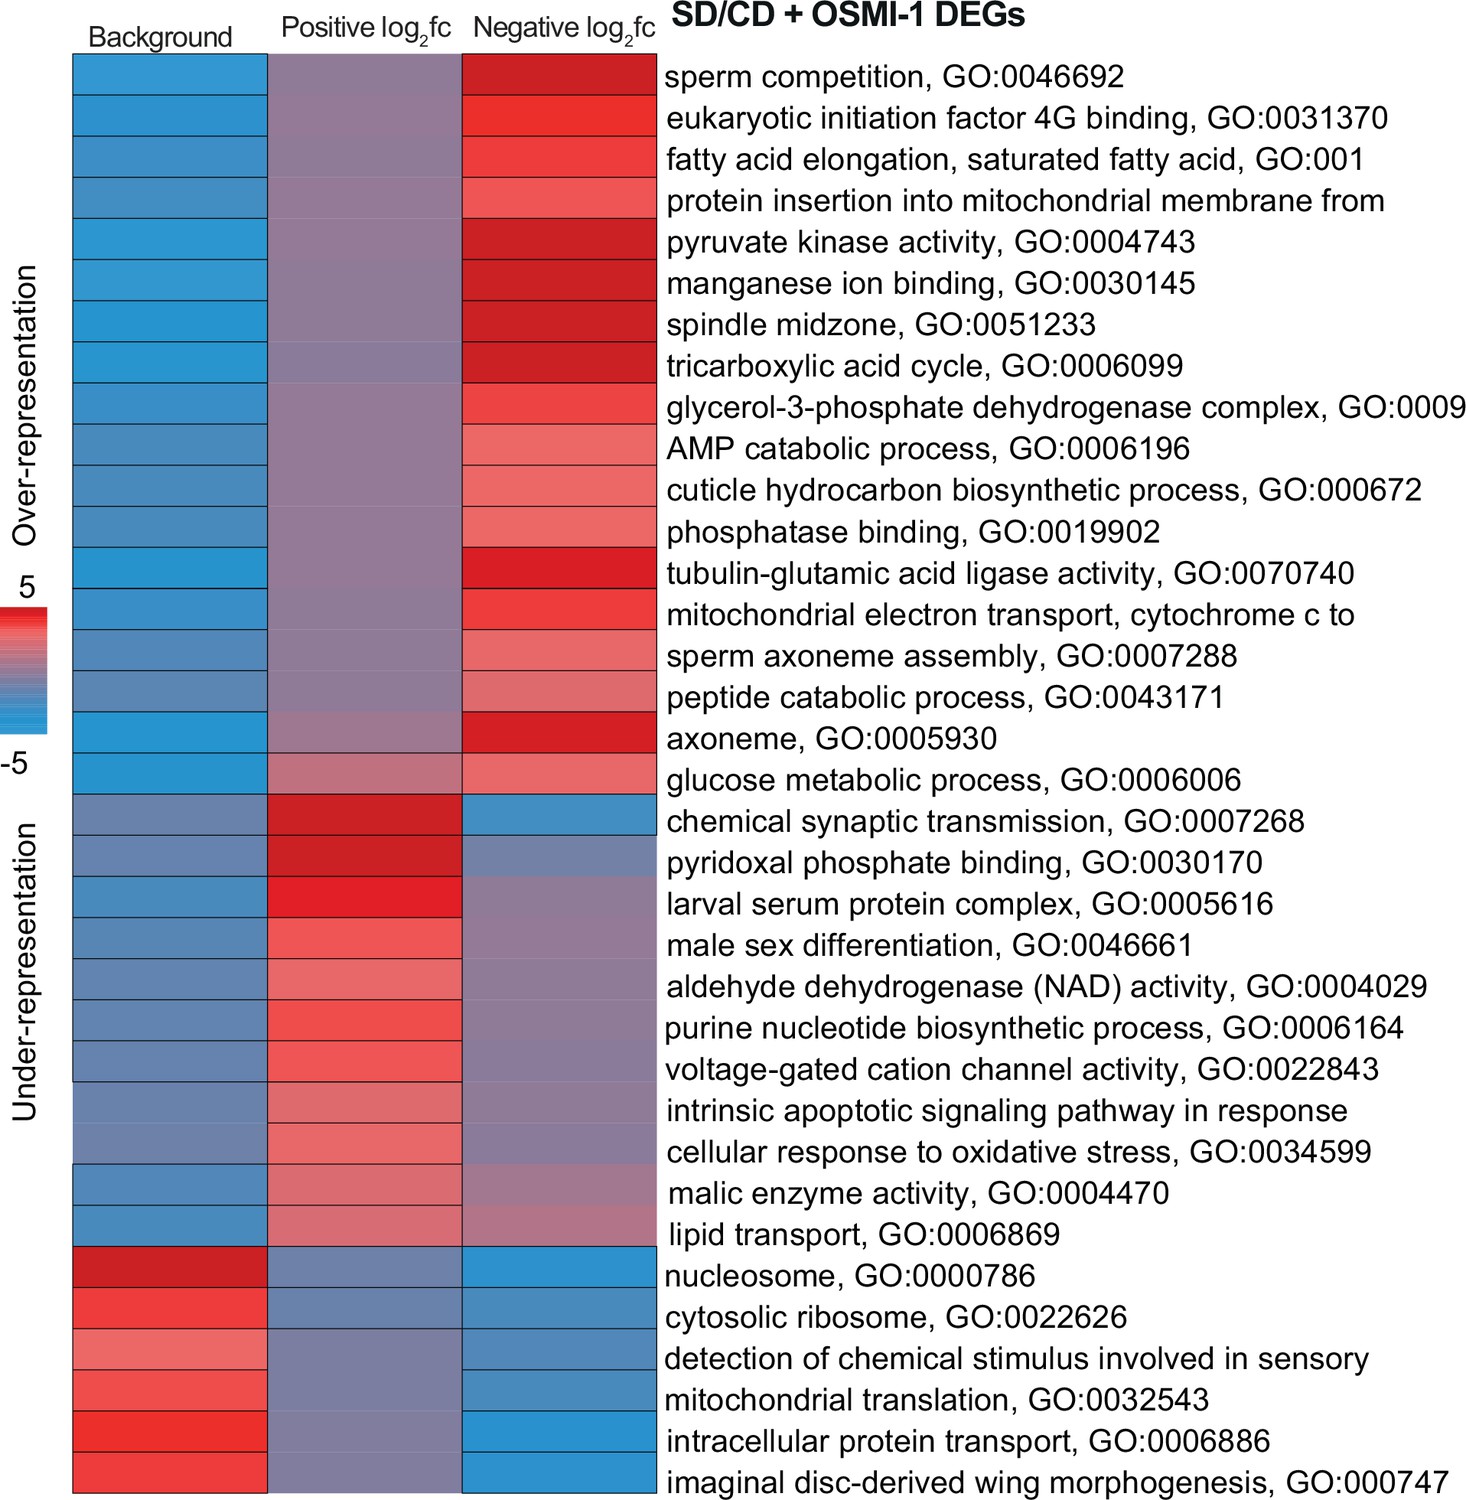
Pathway enrichment analysis of genes reverted or unchanged by OSMI.
iPAGE identification of pathways depleted (blue) or enriched (red) compared to background gene list from genes with positive or negative log2 fold changes on SD + OSMI. Scale represents over-representation (red) or under-representation (blue) of genes within a specific bin for the corresponding GO term. Black outlined boxes represent q < 0.05.
Figure 5 with 1 supplement
The immediate early gene Sr is found at PRC2 × OGT genes and is involved in sweet-taste sensation.
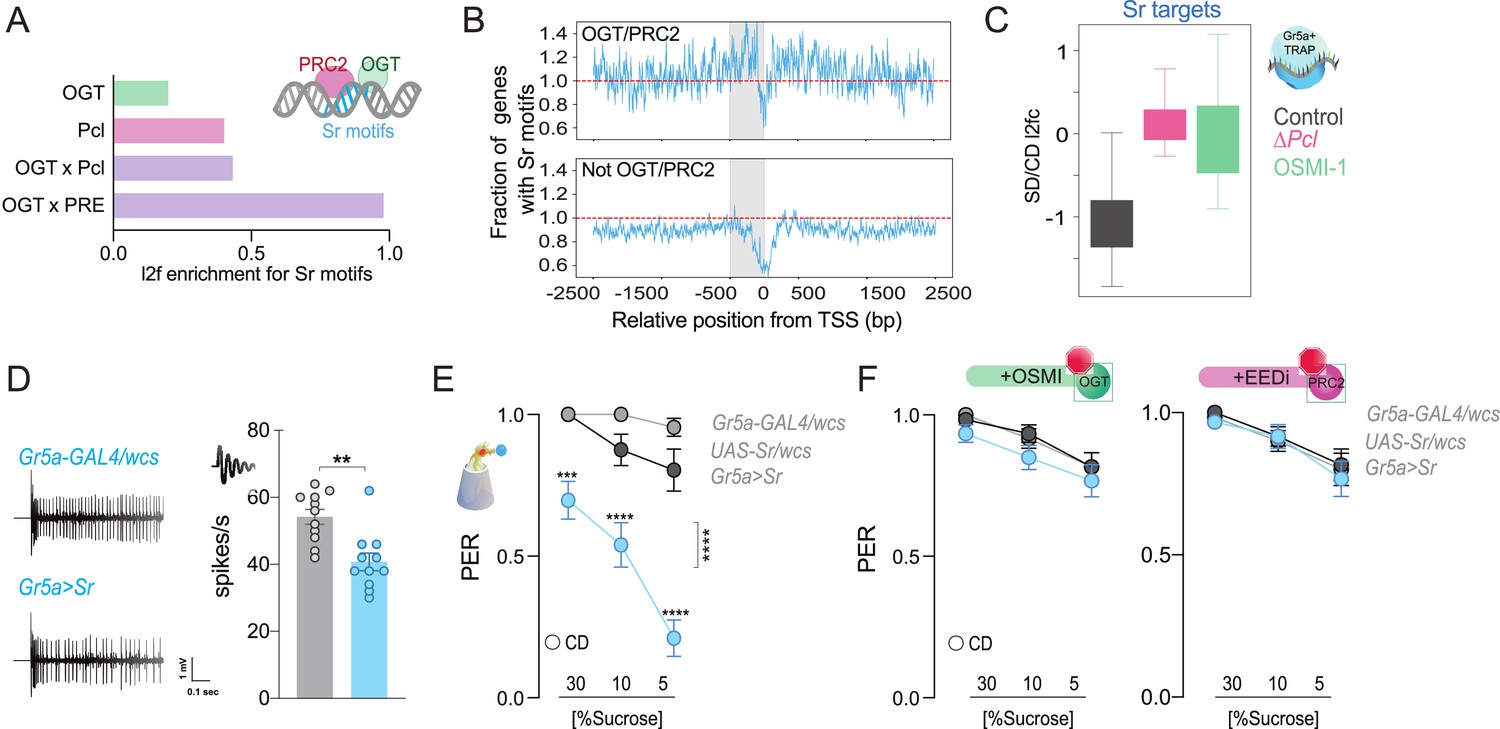
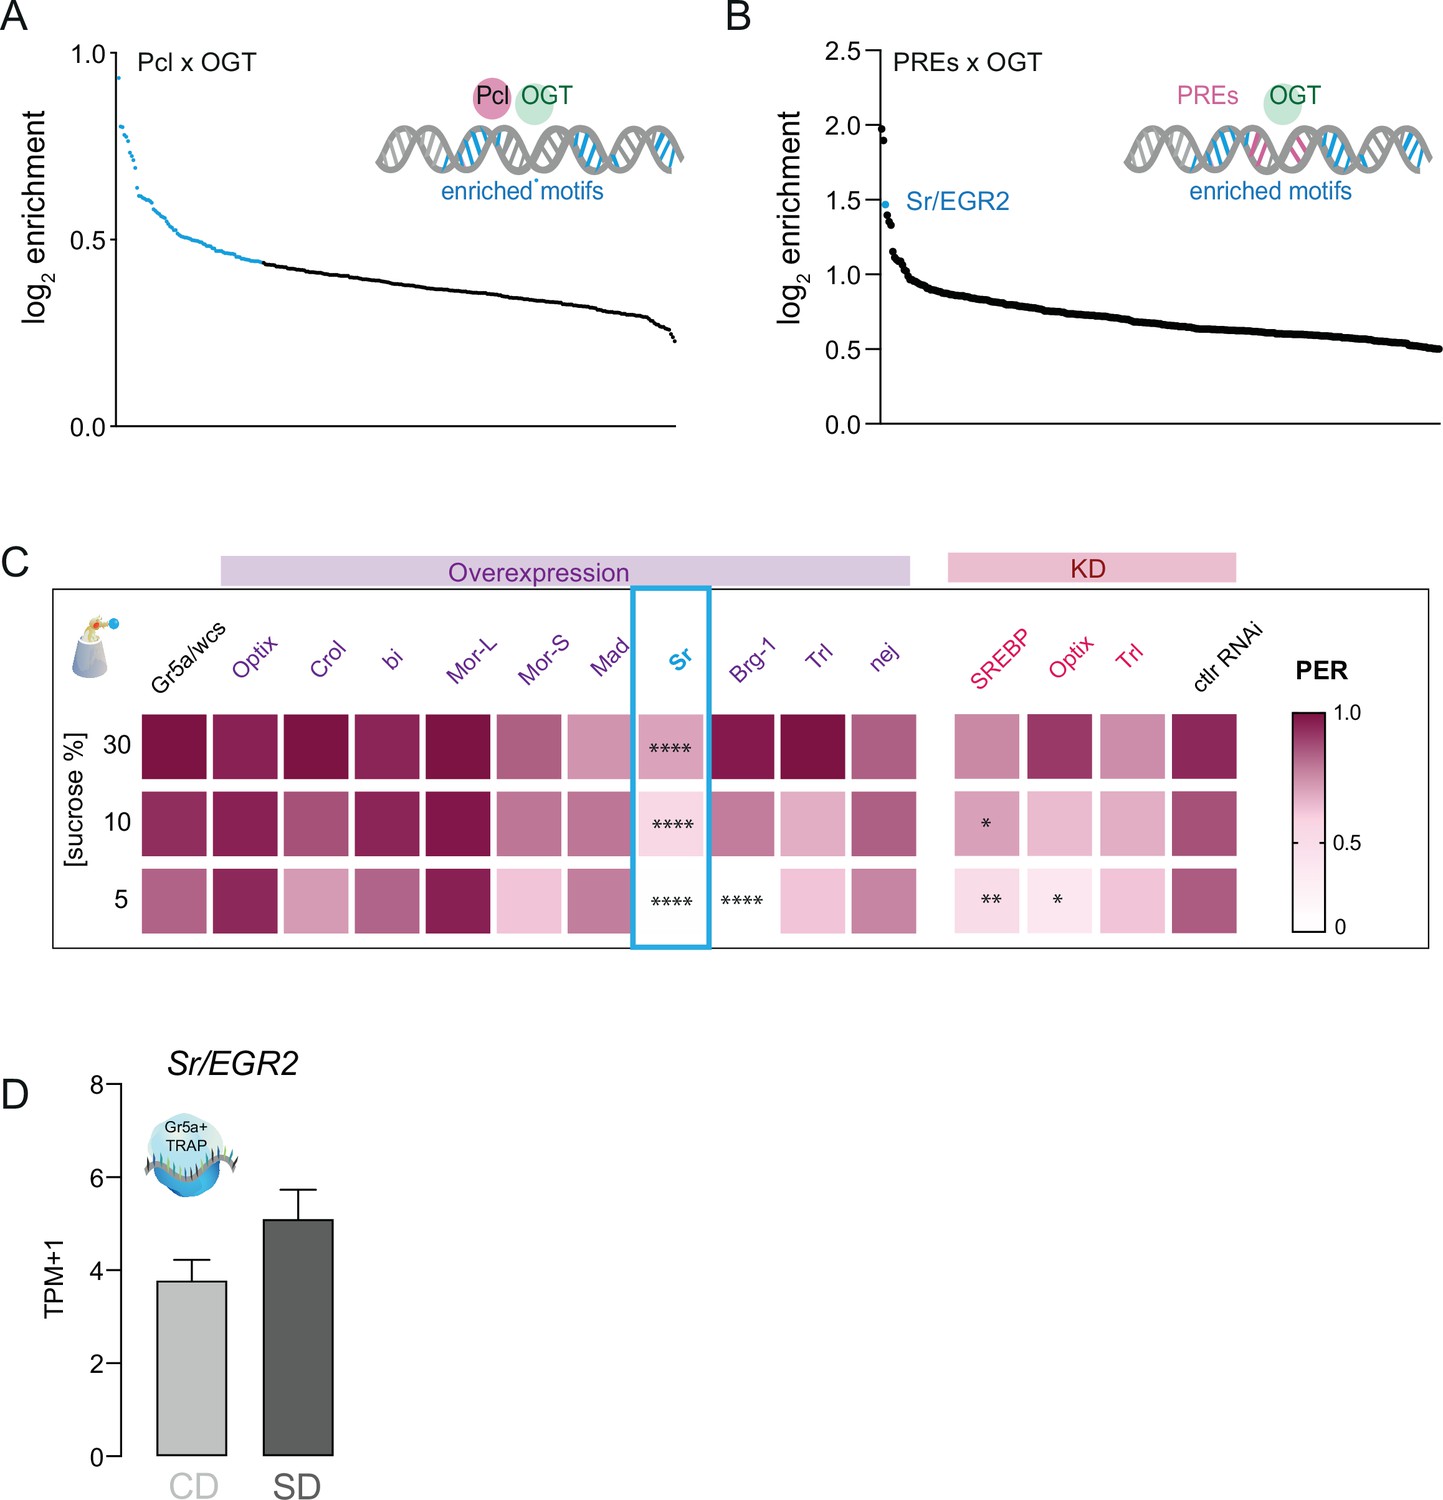
(A) Log2fold (l2f) enrichment for Sr motifs at sites occupied by O-GlcNAc Transferase (OGT; green), Pcl (pink), or OGT + Pcl and OGT + PREs (purple), p < 0.0001. (B) Normalized distribution of Sr motifs along the regulatory regions 2500 bp up and downstream the transcriptional start site (TSS) for the genes in (A); the 500 bp immediately before each TSS are shaded in grey. Counts are normalized relative to the genome-wide expectation (derived by multiplying the number of potential target genes by the fractional coverage of Sr motifs on the genome); a score of 1.0 indicates the hypothetical genome-wide average overlap with Sr motifs and is shown as a red dashed line. (C) The distribution of RNA l2fc for genes that have Sr sites and are expressed in the Gr5a+ neurons of flies on a CD and SD in control flies or flies with mutations in Pcl or inhibition of OGT. q > 0.01. (D) Representative traces (left) and averaged neuronal responses to 25 mM sucrose stimulation from the L-type sensilla of Sr overexpression flies (blue) and controls (gray). n = 11. Mann–Whitney test: **p = 0.001. (E) Taste responses (y-axis) to stimulation of the labellum with 30, 10, and 5% sucrose (x-axis) in Sr overexpression flies (blue) and controls (gray). n = 22–38. Two-way repeated measure analysis of variance (ANOVA), main effect of genotype ****p < 0.0001 and genotype × concentration ****p < 0.0001; Tukey post-test for multiple comparisons: 30%: ***p = 0.0002 for Gr5a>Sr compared to each control, 10%: Gr5a>Sr vs. Gr5a>wcs p = 0.0025 and Gr5a>Sr vs. Sr >wcs ****p < 0.0001; 5%: ****p < 0.0001 for Gr5a>Sr compared to each control. Gr5a>wcs vs. Sr>wcs p > 0.05 at all concentrations. (F) Taste responses (y-axis) to stimulation of the labellum with 30, 10, and 5% sucrose (x-axis) in Sr overexpression flies (blue) and controls (gray) treated with the OGT inhibitor OSMI (green) or the PRC2 inhibitor EEDi (pink). n = 30. Two-way repeated measure ANOVA, main effect of genotype p = 0.2993 and p = 0.9146 and genotype × concentration p = 0.9293 and p = 0.9146, respectively. Data are shown as mean ± standard error of the mean (SEM).
Figure 5—figure supplement 1
Enrichment analysis of cis-regulatory sites present in O-GlcNAc Transferase (OGT) and PREs.
(A) Log2fold enrichment of TF cis-regulatory sites found at OGT + Pcl; blue q < 0.01. (B) Log2fold enrichment of TF cis-regulatory sites found at OGT + PREs. (C) Taste responses (y-axis) to stimulation of the labellum with 30, 10, and 5% sucrose (x-axis) for genes with cis-regulatory enrichment in A and B. n = 21–55. Two-way repeated measure analysis of variance (ANOVA), main effect of GAL4>wcs control genotype compared to each control genotype: ****p < 0.0001. Tukey multiple comparisons test, ****p < 0.0001, **p < 0.01, *p < 0.05. (D) Sr mRNA reads normalized as transcripts per million (TPMs) in the Gr5a+ neurons of flies on a CD (light gray) or SD (dark gray) for 7 days, q > 0.01. Data are shown as mean ± standard error of the mean (SEM).
Figure 6 with 1 supplement
The effect of the kinase rl/ERK on sweet taste depends on O-GlcNAc Transferase (OGT) activity.
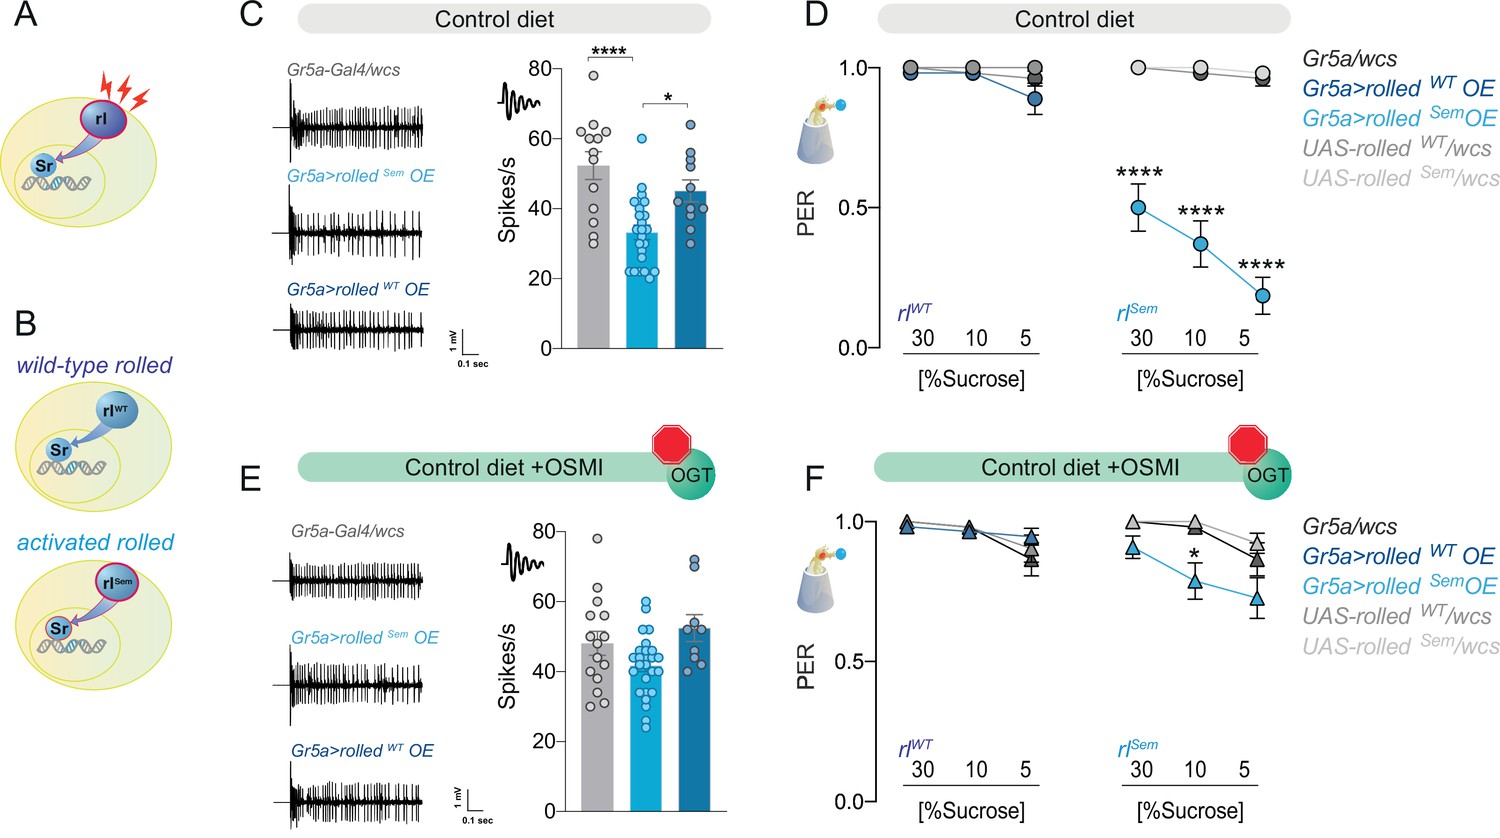
(A) Diagram of the rl/ERK > Sr pathway, red sparks represent neural activity, and red outline represents activation. (B) Diagram of the two types of rl/ERK transgenes used. (C) Representative traces (left) and averaged neuronal responses to 25 mM sucrose of L-type sensilla in overexpression of wild-type (rlWT) or constitutively active (rlSem) rl/ERK in the Gr5a+ neurons (blue) and control (gray) on a CD. n = 11–23. One-way analysis of variance (ANOVA); Tukey’s multiple comparison test: ****p < 0.0001 for Gr5a/+ vs. Gr5a>rlSem, p = 0.279 for Gr5a/+ vs. Gr5a>rlWT, and *p = 0.018 for Gr5a>rlSem vs. Gr5a>rlWT. (D) Taste responses (y-axis) to stimulation of the labellum with 30, 10, and 5% sucrose (x-axis) in flies with overexpression of wild-type (rlWT) or constitutively active (rlSem) rl/ERK in the Gr5a+neurons (blue) and control (gray) flies on a CD + vehicle (DMSO). n = 24–27. Two-way repeated measure ANOVA, main effect of genotype p < 0.0001 and concentration × genotype p < 0.0001. Tukey multiple comparisons tests: ****p < 0.0001 for Gr5a>rlSem vs. all other genotypes at 30, 10, and 5% and p > 0.05 for all other comparisons at all concentrations. (E) Representative traces (left) and averaged neuronal responses to 25 mM sucrose of L-type sensilla in overexpression of wild-type (rlWT) or constitutively active (rlSem) rl/ERK in the Gr5a+ neurons (blue) and control (gray) on a CD + OSMI. n = 11–23. One-way ANOVA; Tukey’s multiple comparison test: p = 0.172 for Gr5a/+ vs. Gr5a>rlSem, p = 0.603 for Gr5a/+ vs. Gr5a>rlWT, and p = 0.034 for Gr5a>rlSem vs. Gr5a>rlWT. (F) Taste responses (y-axis) to stimulation of the labellum with 30, 10, and 5% sucrose (x-axis) in flies with overexpression of wild-type (rlWT) or constitutively active (rlSem) rl/ERK in the Gr5a+ neurons (blue) and control (gray) in flies fed a CD + OSMI. n = 26–33. Two-way repeated measure ANOVA, main effect of genotype p = 0.005; Tukey multiple comparisons tests: p > 0.05 for all other comparisons at all concentrations except for p < 0.0001 for Gr5a>rlSem vs. rlSem/wcs at 10% p = 0.0216. Effect of OSMI vs. vehicle: Gr5a>rlSem 30% p = 0.0012, 10% p = 0.0030, 5% p < 0.0001, and p < 0.05 for all other genotypes. Data are shown as mean ± standard error of the mean (SEM).
Figure 6—figure supplement 1
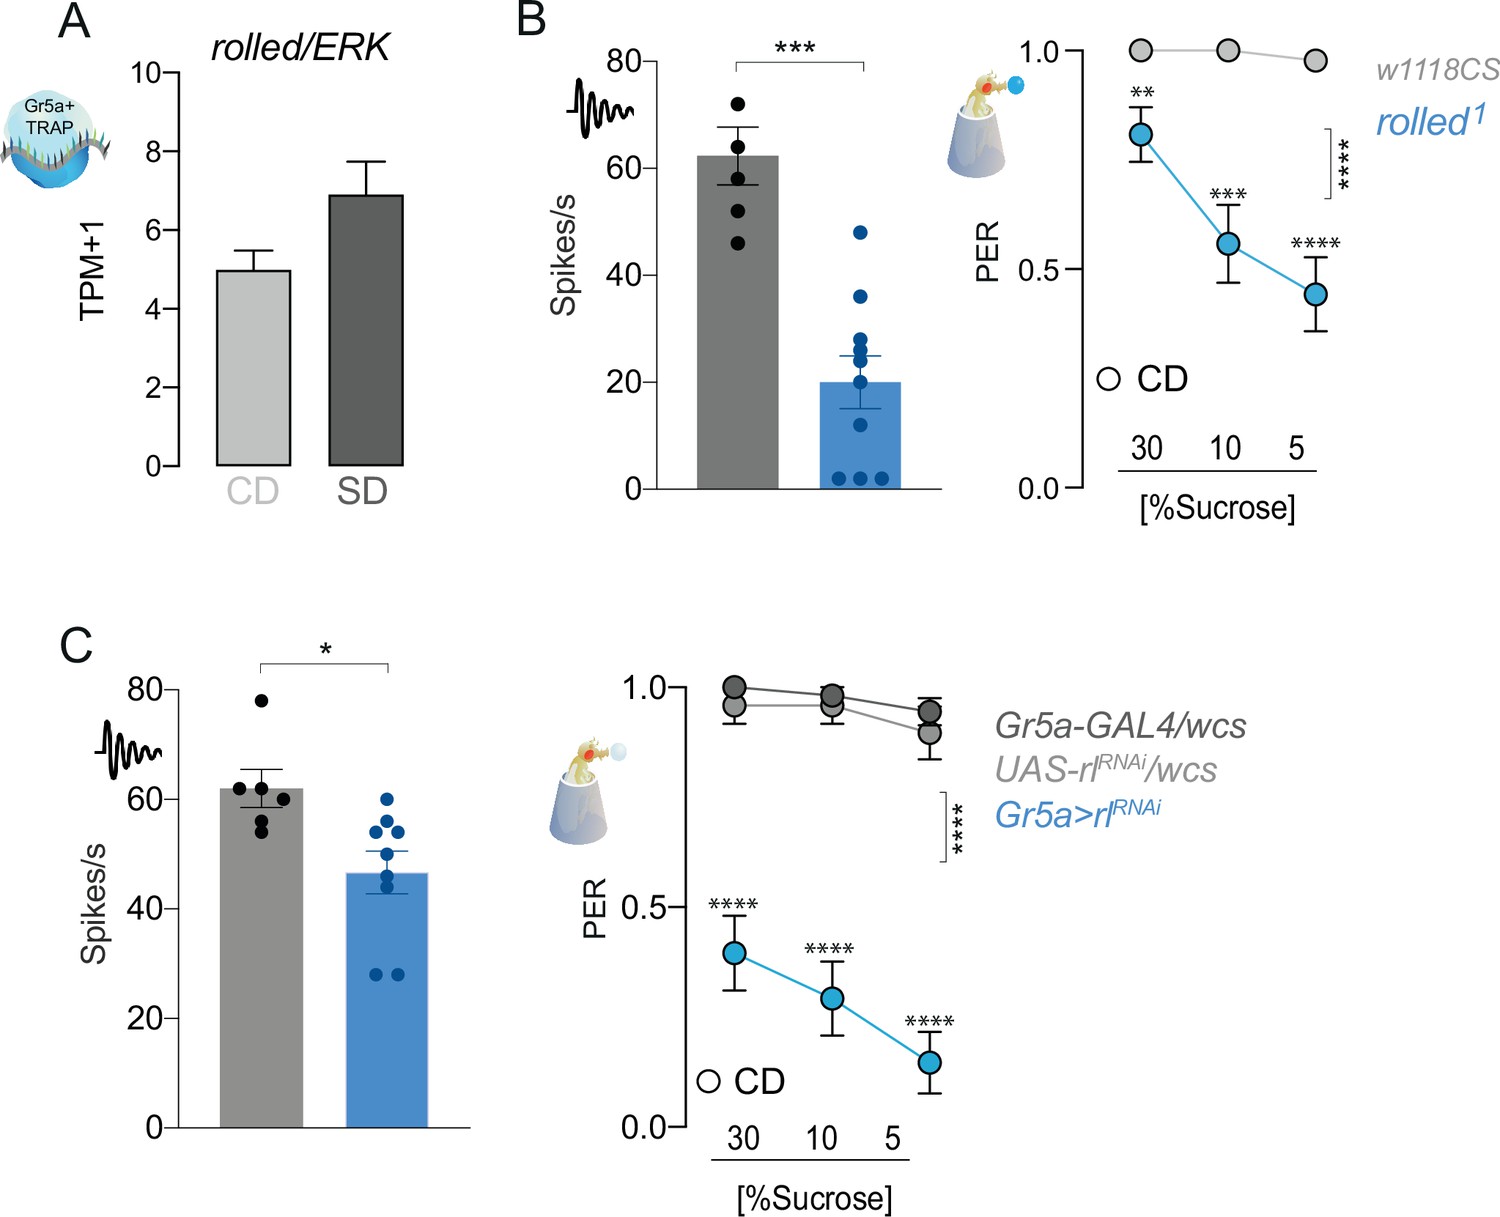
rl/ERK is required for taste responses to sugar.
(A) rl RNA reads normalized as transcripts per million (TPMs) in the Gr5a+ neurons of flies on a CD (light gray) or SD (dark gray) for 7 days. q > 0.01. (B) (left) Averaged neuronal responses to 25 mM sucrose from L-type sensilla in rl mutant (blue) and control (gray) flies. n = 6–10. Mann–Whitney test: p = 0.0005. (right) Taste responses (y-axis) to stimulation of the labellum with 30, 10, and 5% sucrose (x-axis) in rl mutant and control flies fed a CD. n = 26. Two-way repeated measure analysis of variance (ANOVA), main effect of genotype p < 0.0001; Dunn’s post-test **p < 0.01 and ***p < 0.001 vs. controls. (C) (left) Averaged neuronal responses to 25 mM sucrose from L-type sensilla in rl RNAi (blue) and control (gray) flies. n = 6–9. Mann–Whitney test: *p < 0.05. (right) Taste responses (y-axis) to stimulation of the labellum with 30, 10, and 5% sucrose (x-axis) in rl RNAi and control flies fed a CD. n = 24–27. Two-way repeated measure ANOVA, main effect of genotype ****p < 0.0001; Dunn’s post-test ****p < 0.001 vs. controls. Data are shown as mean ± standard error of the mean (SEM).
Figure 7 with 1 supplement
The rl > Sr pathway is important for taste adaptations in response to diet.
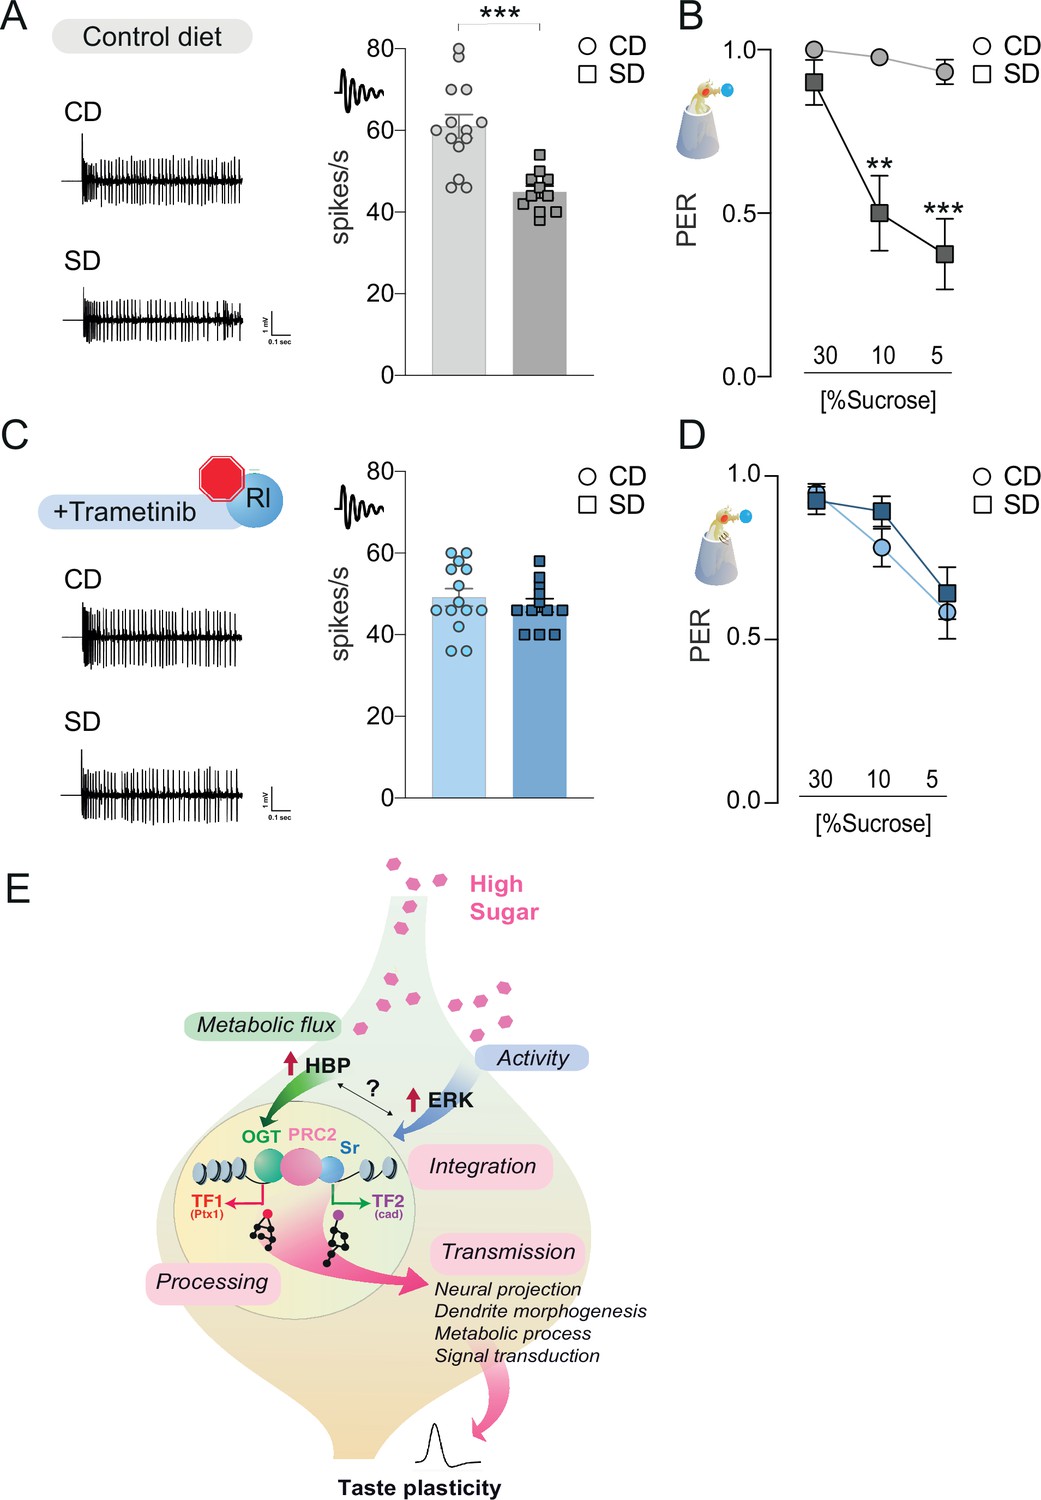
Representative traces (left) and averaged responses to 25 mM sucrose from L-type sensilla of flies fed a CD and SD (A), gray or Trametinib (C), blue. n = 11–14. Unpaired t-test: ***p = 0.0001 for CD vs. SD, and p = 0.486 for CD Trametinib vs. SD Trametinib. Taste responses to stimulation of the proboscis with sucrose in flies fed a CD and SD + vehicle (B), DMSO, gray or Trametinib (D), blue. PER, n = 20–33. PER: two-way repeated measure analysis of variance (ANOVA), main effect of diet, vehicle p < 0.0001 and Trametinib p = 0.4701; Tukey multiple comparison test: vehicle CD vs. SD 30% p = 0.421, 10% **p = 0.0017, and 5% ***p = 0.0002 and Trametinib CD vs. SD 30% p = 0.9702, 10% p = 0.4470, and 5% p = 0.9575. Effect of Trametinib: CD vehicle vs. CD Trametinib, 30% p = 0.1745, 10% p = 0.0108, 5% p = 0.0015; SD vehicle vs. SD Trametinib, 30% p = 0.4837, 10% p = 0.0228, 5% p = 0.2339. (E) A model for how O-GlcNAc Transferase (OGT), PRC2, and ERK orchestrate taste plasticity in response to a changing food environment. Boxes in pink describe the different steps of ‘information processing’ (see discussion). Data are shown as mean ± standard error of the mean (SEM).
Figure 7—figure supplement 1
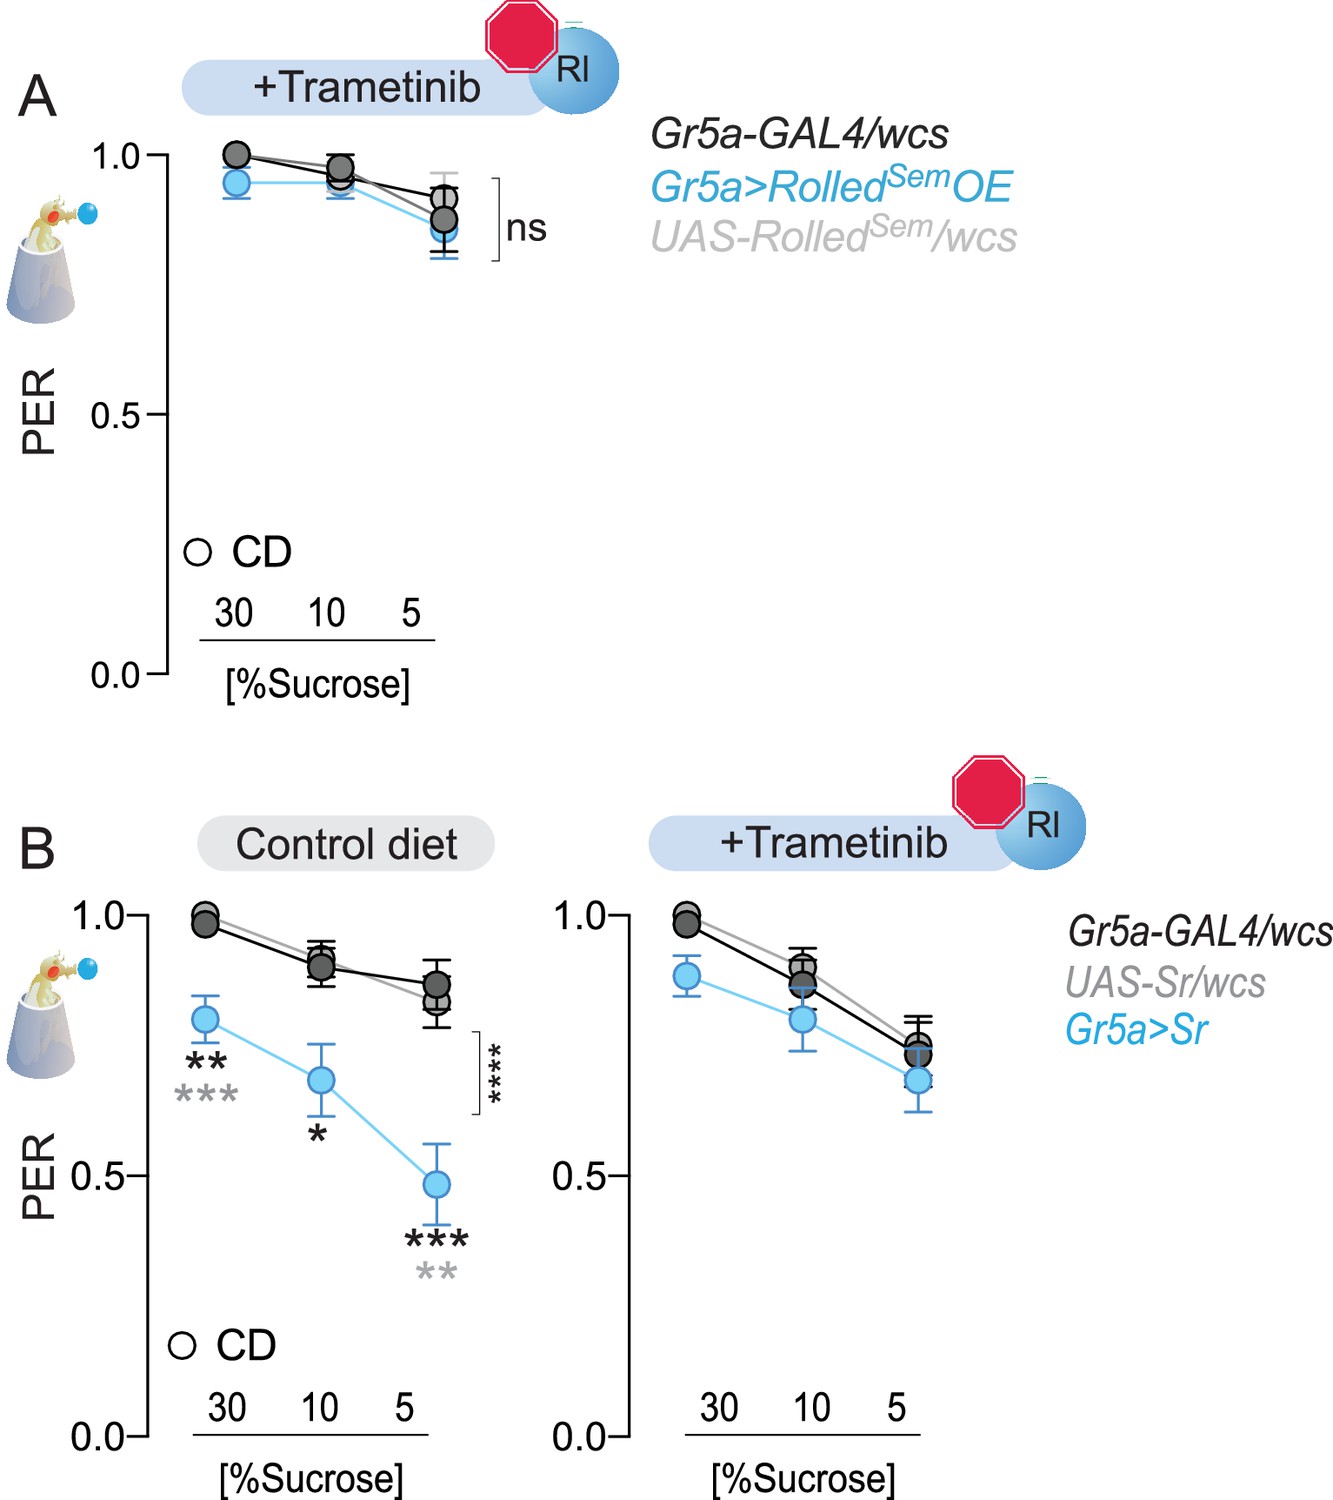
Effects of ERK inhibitor Trametinib on genetic manipulations of Sr and rl levels.
(A) Taste responses (y-axis) to stimulation of the labellum with 30, 10, and 5% sucrose (x-axis) in flies fed a CD + Trametinib (blue) and with overexpression of rl (blue or controls in gray) n = 24–28. Two-way repeated measure analysis of variance (ANOVA), main effect of genotype p = 0.0206 and genotype × concentration p = 0.3671. (B) Taste responses (y-axis) to stimulation of the labellum with 30, 10, and 5% sucrose (x-axis) in flies fed a CD with or without Trametinib (blue) and with overexpression of Sr (blue, or controls in gray) n = 22–38. CD: two-way repeated measure ANOVA main effect of genotype ****p < 0.0001 and genotype × concentration p = 0.0037 with Sidak multiple comparison tests, 30%: Gr5a>Sr vs. Gr5a>wcs ***p = 0.0004 and Gr5a>Sr vs. Sr>wcs **p=0.0016; 10%: *p<0.05 for Gr5a>Sr compared to each control; 5%: Gr5a>Sr vs. Gr5a>wcs **p=0.0012 and Gr5a>Sr vs. Sr>wcs ***p=0.0003; Trametinib: two-way repeated measure ANOVA main effect of genotype p = 0.2192. Data are shown as mean ± standard error of the mean (SEM).
Tables
Key resources table
| Reagent type (species) or resource | Designation | Source or reference | Identifiers | Additional information |
|---|---|---|---|---|
| Genetic reagent (D. melanogaster) | w[1118]CS | Other | Gift from A Simon | |
| Genetic reagent (D. melanogaster) | UAST-sxc(Ogt)RNAiCLb38 | PMID:24706800 | Gift from C Lehner | |
| Genetic reagent (D. melanogaster) | Gr5a-GAL4 | Bloomington Drosophila Stock Center | BDSC: 57592 | |
| Genetic reagent (D. melanogaster) | Tubulin-GAL80ts | Bloomington Drosophila Stock Center | BDSC: 7018 | |
| Genetic reagent (D. melanogaster) | UAS-Pcl | FlyORF | FlyORF: F001897 | |
| Genetic reagent (D. melanogaster) | Pclc429 | Other | Gift from N Liu | |
| Genetic reagent (D. melanogaster) | UAS-Rpl3-3XFLAG | PMID:29194454 | Gift from D Dickman | |
| Genetic reagent (D. melanogaster) | UAS-LT3-Dam | Other | Gift from AH Brand | |
| Genetic reagent (D. melanogaster) | UAS-LT3-Dam::Pcl | PMID:33177090 | ||
| Genetic reagent (D. melanogaster) | UAS-LT3-Dam::OGT | This paper | See the Materials and methods | |
| Genetic reagent (D. melanogaster) | Gr64f-GAL4 | Bloomington Drosophila Stock Center | BDSC: 57669 | |
| Genetic reagent (D. melanogaster) | UAS-Sr | Bloomington Drosophila Stock Center | BDSC: 26553 | |
| Genetic reagent (D. melanogaster) | UAS-rlWT | Bloomington Drosophila Stock Center | BDSC: 36270 | |
| Genetic reagent (D. melanogaster) | UAS-rlSem | Bloomington Drosophila Stock Center | BDSC: 59006 | |
| Genetic reagent (D. melanogaster) | rl1 | Bloomington Drosophila Stock Center | BDSC: 386 | |
| Genetic reagent (D. melanogaster) | rl RNAi | Bloomington Drosophila Stock Center | BDSC: 34855 | |
| Genetic reagent (D. melanogaster) | OGA RNAi | Bloomington Drosophila Stock Center | BDSC: 41882 | |
| Genetic reagent (D. melanogaster) | OGT1 | PMID:26348912 | Gift from D van Aalten | |
| Genetic reagent (D. melanogaster) | OGTK872M | PMID:26348912 | Gift from D van Aalten | |
| Antibody | Mouse monoclonal anti-Flag | Sigma | Cat#: F1804, RRID:AB_262044 | 3:50 |
| Peptide, recombinant protein | Dynabeads Protein G | Thermo Fisher Scientific | Cat#: 10004D | |
| Peptide, recombinant protein | T4 DNA ligase | New England Biolabs | Cat#: M0202S | |
| Commercial assay or kit | NEBuilder HiFi DNA Assembly kit | New England Biolabs | Cat#: E5520S | |
| Commercial assay or kit | ThruPLEX Kit | Takara | Cat#: 022818 | |
| Chemical compound, drug | OSMI-1 | Sigma | Cat#: SML1621 | |
| Chemical compound, drug | EED226 | Axon Medchem | Cat#: 2701 | |
| Chemical compound, drug | Trametinib | LC labs | Cat#: T-8123 | |
| Chemical compound, drug | TRIzol LS Reagent | Thermo Fisher Scientific | Cat#: 10296010 | |
| Software, algorithm | Autospike3.9 | Syntech | http://www.ockenfels-syntech.com/products/signal-acquisition-systems-2/ | |
| Software, algorithm | Prism 9 | GraphPad | RRID:SCR_002798 | |
| Software, algorithm | Python | Python | RRID:SCR_008394 |
Additional files
-
Supplementary file 1
Excel file with the analyses of the DAM and TRAP experiments.
- https://cdn.elifesciences.org/articles/83979/elife-83979-supp1-v1.xlsx
-
MDAR checklist
- https://cdn.elifesciences.org/articles/83979/elife-83979-mdarchecklist1-v1.pdf
-
Source code 1
Python script to run the practical equivalence test (see methods).
- https://cdn.elifesciences.org/articles/83979/elife-83979-code1-v1.zip
Download links
A two-part list of links to download the article, or parts of the article, in various formats.
Downloads (link to download the article as PDF)
Open citations (links to open the citations from this article in various online reference manager services)
Cite this article (links to download the citations from this article in formats compatible with various reference manager tools)
Nutrigenomic regulation of sensory plasticity
eLife 12:e83979.
https://doi.org/10.7554/eLife.83979


