N6-methyladenosine (m6A) reader Pho92 is recruited co-transcriptionally and couples translation to mRNA decay to promote meiotic fitness in yeast
- The Francis Crick Institute, United Kingdom
- Department of Molecular Biology, Faculty of Science, Radboud Institute for Molecular Life Sciences (RIMLS), Oncode Institute, Radboud University Nijmegen, Netherlands
- Department of Human Genetics, University of Miami Miller School of Medicine, Sylvester Comprehensive Cancer Center, Biomedical Research Building, United States
- Biological Mass Spectrometry Facility, The University of Texas at Austin, United States
- Department of Biochemistry, Charité Universitätsmedizin Berlin, Germany
- Dementia Research Institute, King's College London, United Kingdom
- Department of Genetics, Evolution and Environment, UCL Genetics Institute, United Kingdom
- Okinawa Institute of Science and Technology Graduate University, Japan
Figures
Figure 1 with 2 supplements

Pho92, but not Gis2, binds to m6A-modified transcripts.
(A) Schematic overview of the yeast meiotic program. Ime1 induces the transcription of the MIS complex. m6A occurs during early meiosis. (B) Scheme describing set up for synchronized meiosis. Cells were grown in rich medium till saturation, shifted to SPO, and cells were induced to enter meiosis using CUP1 promoter fused to IME1 (pCUP-IME1, FW2444). Time points were taken at 2 hr and 4 hr. (C) Scatter plot displaying proteins identified in m6A consensus oligo pull down versus control. In short, cells were grown in rich medium till saturation, and shifted to SPO, and cells were induced to enter meiosis using CUP1 promoter fused to IME1 (pCUP-IME1, FW 2444). Protein extracts were incubated using m6A and control RNA oligo bound to streptavidin beads. Eluted proteins were differentially labelled with light and heavy dimethyl isotopes, mixed, and proteins from forward and reverse label swap reactions were identified by MS. (D) Pho92 expression prior and during meiosis. Diploid cells with Pho92 tagged with V5 (FW 4478) were induced to enter meiosis in sporulation medium (SPO). Samples were taken at the indicated time points, and Pho92 RNA and protein levels were determined by RT-qPCR and western blotting. n=2 biological repeats. (E) ChIP-seq data for Ume6 at the PHO92 locus. Indicated are the Ume6 binding site, and the ChIP-seq signal. Data were taken from Chia et al., 2021. (F) Pho92 expression prior to and after induction of Ime1 expression. Cells harbouring pCUP-IME1 and Pho92 tagged with V5 (FW 9962) were induced to enter meiosis in sporulation medium (SPO). After 2 hr in SPO, Ime1 was induced with copper sulphate (labelled with *). Samples were taken at the indicated time points, and protein levels were determined by western blotting. Hxk1 was used as loading control respectively. n=2 biological repeats. (G) Experimental setup for Pho92 4TU-iCLIP, Gis2 iCLIP, and m6A CLIP (miCLIP) in wild-type (WT) and ime4Δ cells. At least n=3 biological repeats were performed. (H) Autoradiograph showing the protein RNA complexes in no tag (NT) and Pho92-V5 cells. In short, cells were grown till 4 hr in SPO in presence of 4-thiouracil. Cell were harvested and crosslinked. Protein extracts were generated, and Pho92 was immunoprecipitated with anti V5 antibodies. RNA-protein complexes were labelled with (γ-32P)-ATP, and separated by SDS page, and transferred to nitrocellulose membrane. Displayed are the signals obtained for no tag control (FW4256), Pho92-V5 (WT, FW 4472), and Pho92-V5 in ime4Δ (FW4505). (I) Integrative genome browser (IGV) view of BDF2 gene for Pho92, Gis2 iCLIP and miCLIP in WT and ime4Δ cells. Tracks are crosslink per million normalised, strand-specific bigWigs. (J and K) Volcano plots comparing WT and ime4Δ cells for miCLIP (J) and Pho92 4TU-iCLIP (K). The Ime4-dependent binding sites are labeled, as determined by a criteria of log2FoldChange –1 and adjusted p-value <0.001 for miCLIP and log2FoldChange <= –2 and adjusted p-value <0.001 for the iCLIP experiments. (L) Metagene analysis of Pho92 CLIP Ime4-dependent sites for WT and ime4Δ cells. Data was centred on the m6A sites identified with miCLIP.
-
Figure 1—source data 1
Licor Odyssey multi-channel scan of western blot probed for Pho92-V5 and Hxk1 in Figure 1D.
- https://cdn.elifesciences.org/articles/84034/elife-84034-fig1-data1-v3.zip
-
Figure 1—source data 2
Licor Odyssey multi-channel scan of western blot probed for Pho92-V5 and Hxk1 in Figure 1F.
- https://cdn.elifesciences.org/articles/84034/elife-84034-fig1-data2-v3.zip
-
Figure 1—source data 3
Scan of Autoradiograph with RNA-protein crosslinks of Pho92-V5 in Figure 1H.
- https://cdn.elifesciences.org/articles/84034/elife-84034-fig1-data3-v3.zip
Figure 1—figure supplement 1
Pho92, but not Gis2, binds to m6A marked transcripts in vitro and in vivo.
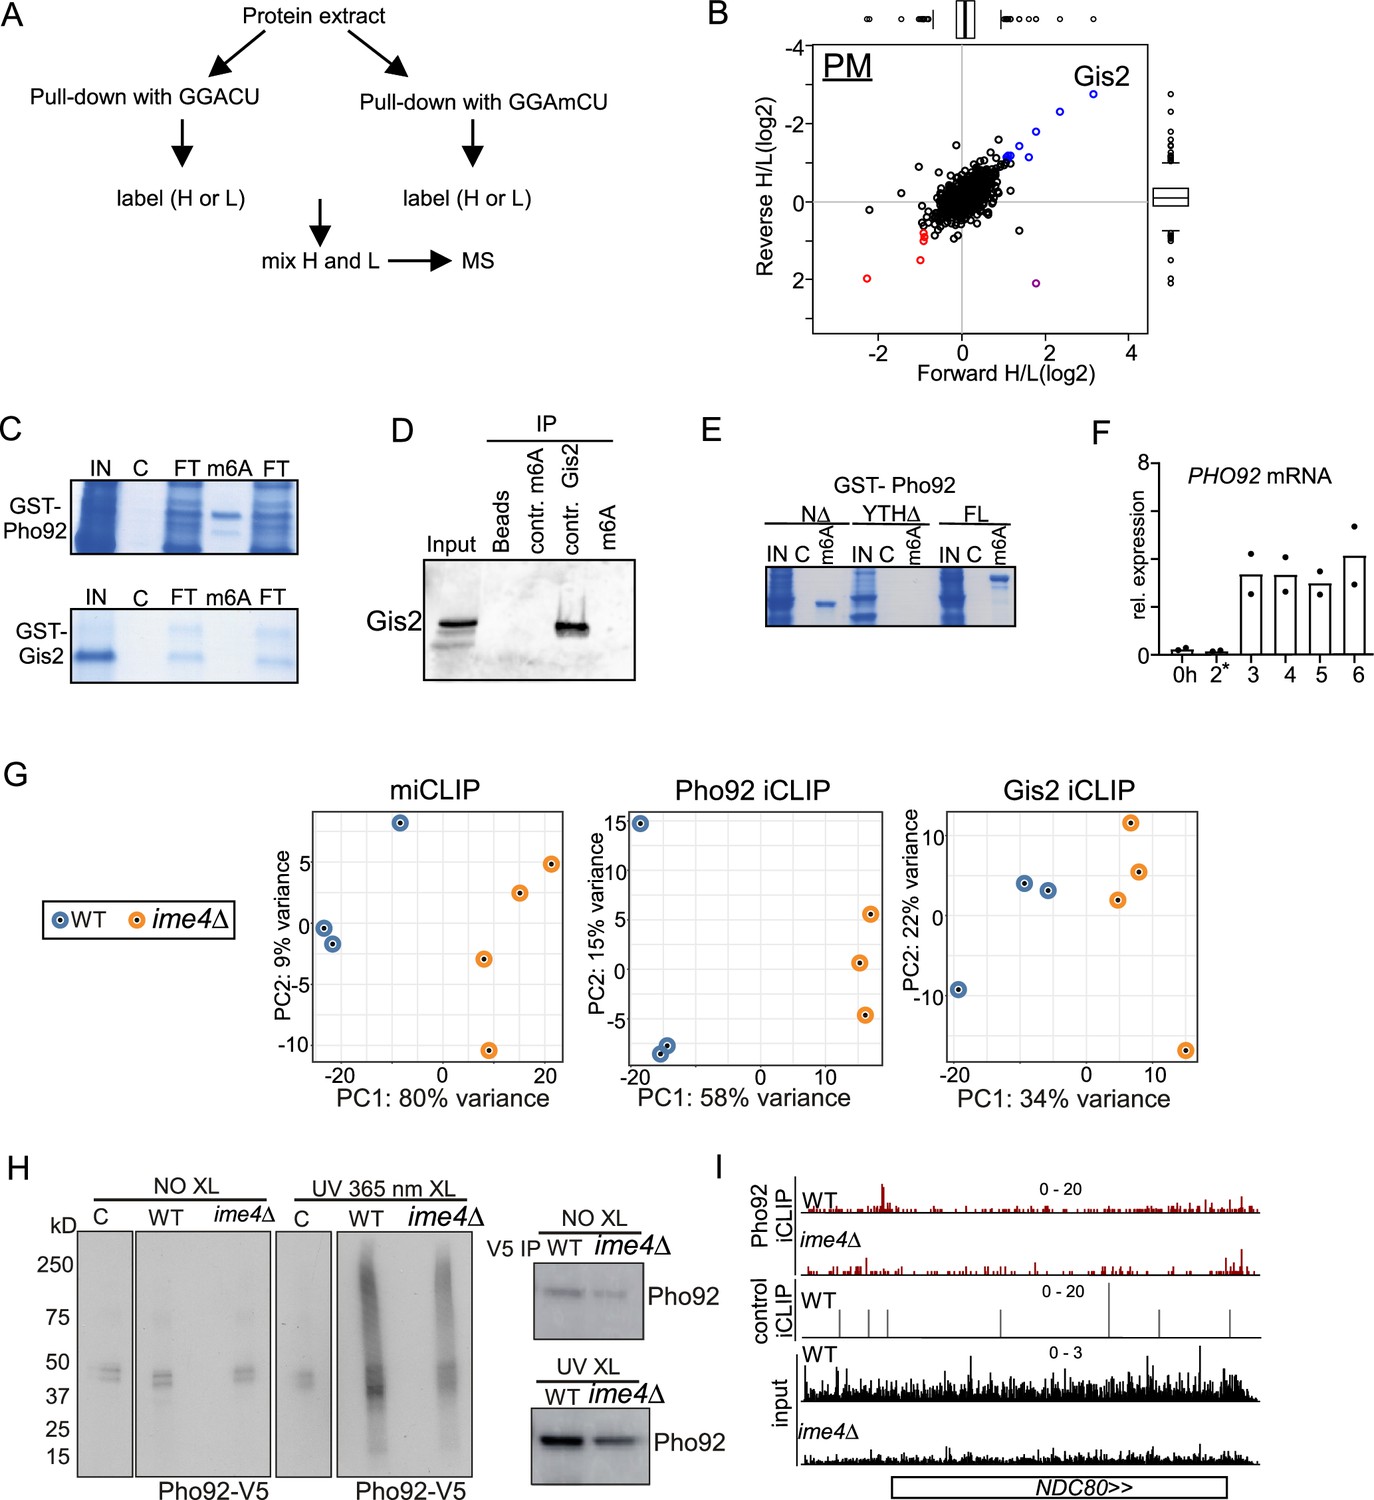
(A) Scheme describing setup for pull-down experiment. In short, protein extracts were incubated using m6A and control RNA oligo bound to streptavidin beads. Eluted proteins were labelled with heavy (H) and light (L) dimethyl isotopes, mixed, and proteins were identified by MS. (B) Scatter plots displaying proteins identified in m6A oligo pull down versus control in pre-meiosis (PM). (C) In vitro m6A pull down to assess binding of GST-Pho92 and GST-Gis2. Expression of GST-Pho92 and GST-Gis2 were induced in bacteria, clarified lysates were incubated with m6A consensus and control RNA oligos bound to streptavidin beads, and eluates were run on an SDS-page gel and Coomassie-stained. Input (IN), Unlabelled oligo (C), m6A oligo (m6A), Unbound flow through after incubation (FT). (D) Gis2 does not bind to m6A labelled or unlabelled oligos but does to control RNA oligos. Protein extracts expressing Gis2-V5 (FW 3312) were incubated with unlabelled oligo, m6A oligo, and control oligo harbouring the canonical Gis2 motif (GA(A/U)). (E) Similar as C except that lysates from truncations of GST-Pho92 in N-terminus (NΔ) and YTH domain (YTHΔ) were used. (F) Pho92 expression prior to and after induction of Ime1 expression. Cells harbouring pCUP-IME1 and Pho92 tagged with V5 (FW 9962) were induced to enter meiosis in sporulation medium (SPO). After 2 hr in SPO, Ime1 was induced with copper sulphate (labelled with *). Samples were taken at the indicated time points, and RNA levels were determined by RT-qPCR. ACT1 was used for normalization. n=2 biological repeats. (G) Principle component analysis (PCA) of miCLIP (left), Pho92 iCLIP (middle), and Gis2 iCLIP (right) at the level of counts per peak. Indicated are the biological repeats for the WT (blue) and ime4Δ (yellow). (H) Autoradiograph showing the protein RNA complexes in control untagged (C) and Pho92-V5 cells. In short, cells were grown till 4 hr in SPO in presence of 4-thiouracil. Cell were harvested and either crosslinked or left untreated. Protein extracts were generated, and Pho92 was immunoprecipitated with anti V5 antibodies. RNA-protein complexes were labelled with (γ-32P)-ATP, and separated by SDS page, and transferred to nitrocellulose membrane. Displayed are the signals obtained for untagged control (FW 4256), Pho92-V5 (WT, FW 4472), and Pho92-V5 in ime4Δ (FW 4505). In right panel, western blots probed with anti-V5 showing the immunoprecipitation of Pho92. (I) Integrative genome browser (IGV) tracks of NDC80 gene for Pho92 CLIP in WT and ime4Δ, and untagged control CLIP in WT background. Tracks are crosslink per million normalised, strand-specific bigWigs.
-
Figure 1—figure supplement 1—source data 1
Scan of coomassie gel showing m6A pulldown with GST-Proteins in Figure 1—figure supplement 1C.
- https://cdn.elifesciences.org/articles/84034/elife-84034-fig1-figsupp1-data1-v3.zip
-
Figure 1—figure supplement 1—source data 2
Scan of western blot - probed for Gis2-V5 showing pulldown of GST-Gis2 with control consensus in Figure 1—figure supplement 1D.
- https://cdn.elifesciences.org/articles/84034/elife-84034-fig1-figsupp1-data2-v3.zip
-
Figure 1—figure supplement 1—source data 3
Scan of coomassie gel showing m6A pulldown with GST-Pho92 full length and truncations in Figure 1—figure supplement 1E.
- https://cdn.elifesciences.org/articles/84034/elife-84034-fig1-figsupp1-data3-v3.zip
-
Figure 1—figure supplement 1—source data 4
Scan of Autoradiograph with RNA-protein crosslinks of Pho92-V5 in Figure 1—figure supplement 1H.
- https://cdn.elifesciences.org/articles/84034/elife-84034-fig1-figsupp1-data4-v3.zip
-
Figure 1—figure supplement 1—source data 5
Scan of western blot showing IP of Pho92-V5 in Figure 1—figure supplement 1H.
- https://cdn.elifesciences.org/articles/84034/elife-84034-fig1-figsupp1-data5-v3.zip
Figure 1—figure supplement 2
Pho92, but not Gis2, binds to m6A marked transcripts in vitro and in vivo.
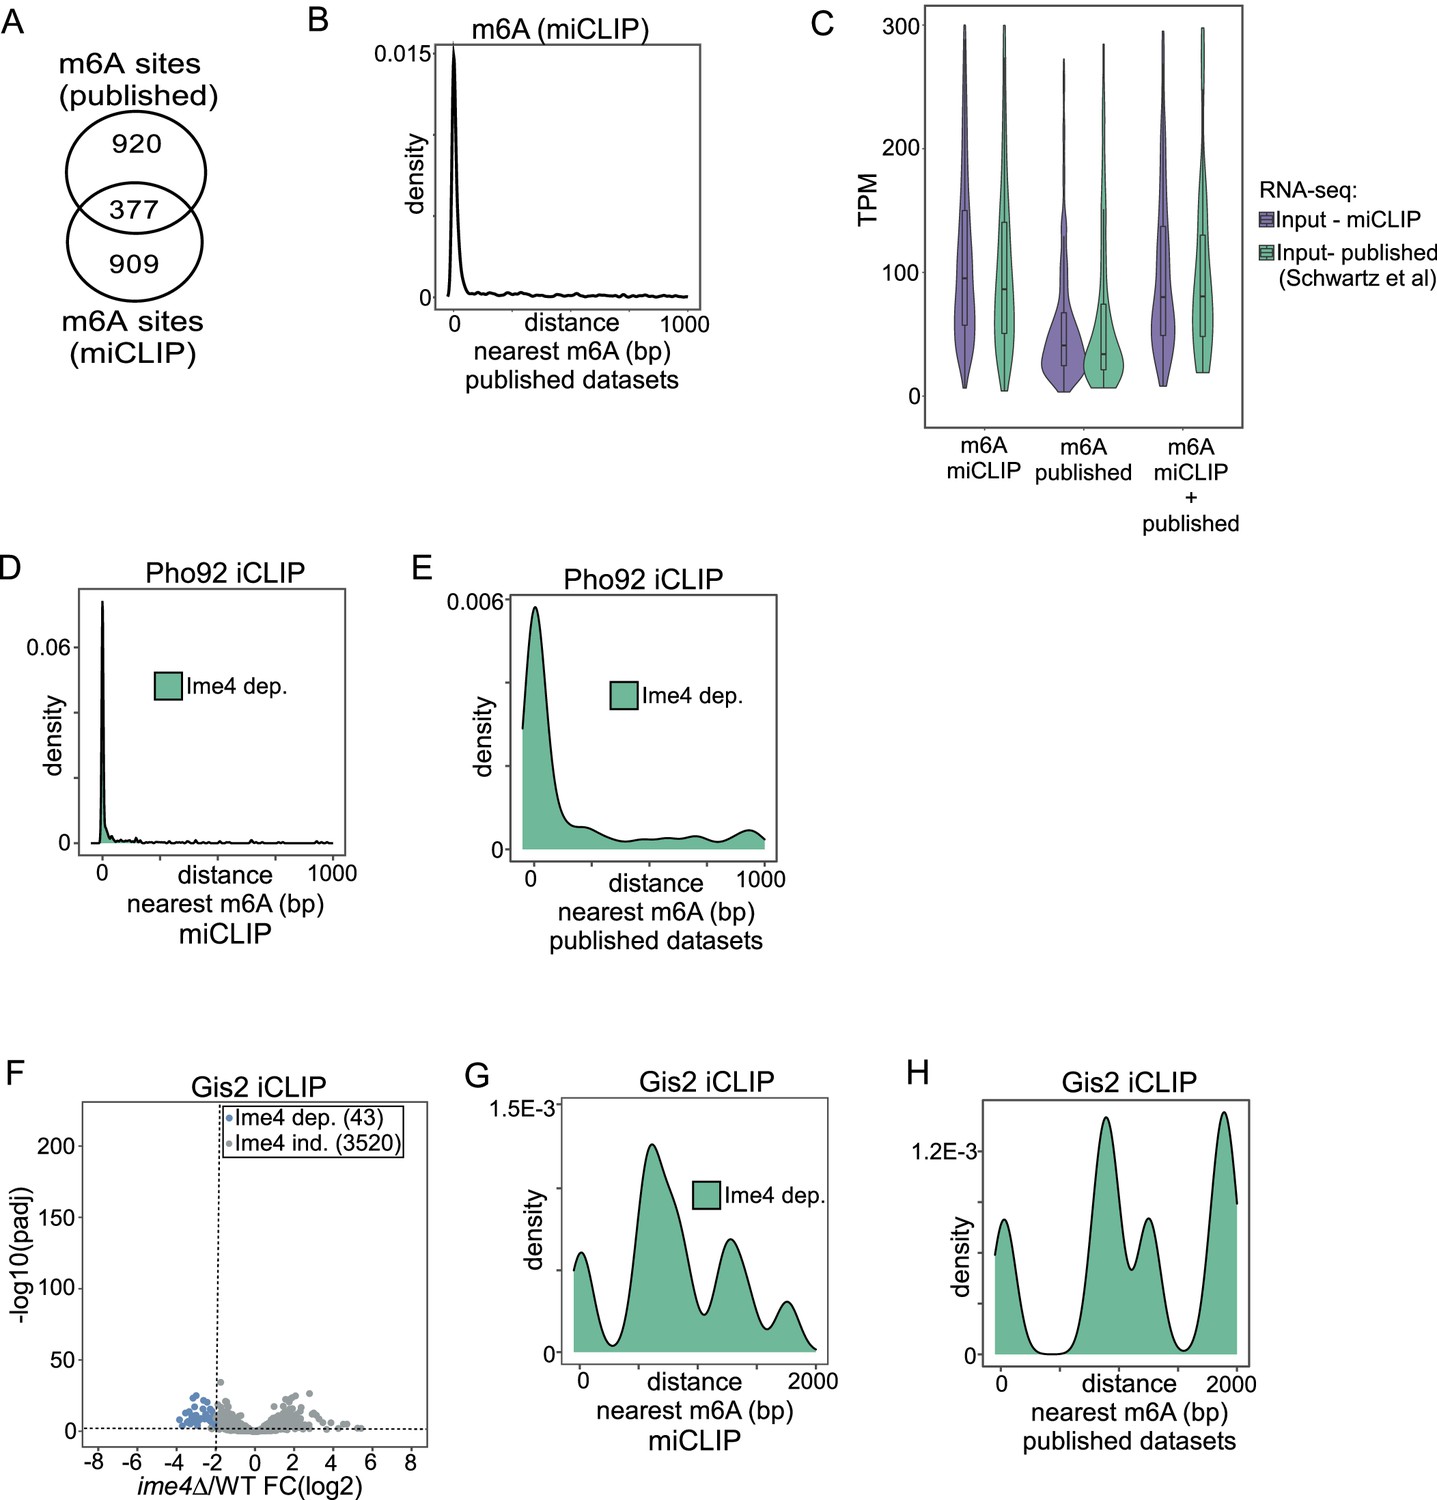
(A) A Venn diagram showing the number of miCLIP and published m6A sites within 100nt of each other. (B) Metanalysis comparing the miCLIP-identified m6A sites to a compendium of published m6A data. For each m6A site, the closest published m6A site was calculated. (C) Expression of genes containing published and/or miCLIP-defined m6A sites as described in A. Violin plot with box plot overlay showing the normalised abundance (transcripts per million - TPM) of transcripts containing m6A defined by miCLIP, the published data or by both datasets. The expression data input from RNA-seq WT data from this work (input – miCLIP, purple) and from the m6A-Seq paper (input – published green). (D) Similar as B except that Pho92 binding sites that depended on Ime4 were compared to m6A sites (miCLIP). (E) Metanalysis comparing the distance between Ime4-dependent Pho92 binding sites to curated m6A sites from published datasets. For each Pho92 binding site the distance to the nearest m6A site was calculated. (F) Volcano plots comparing WT and ime4Δ cells for Gis2 iCLIP. (G) Similar as E except that Gis2 Ime4 dependent sites were compared to m6A sites (miCLIP). (H) Similar as E except that Gis2 Ime4-dependent sites were compared to the curated m6A sites.
Figure 2 with 1 supplement
Features of transcripts bound by Pho92.
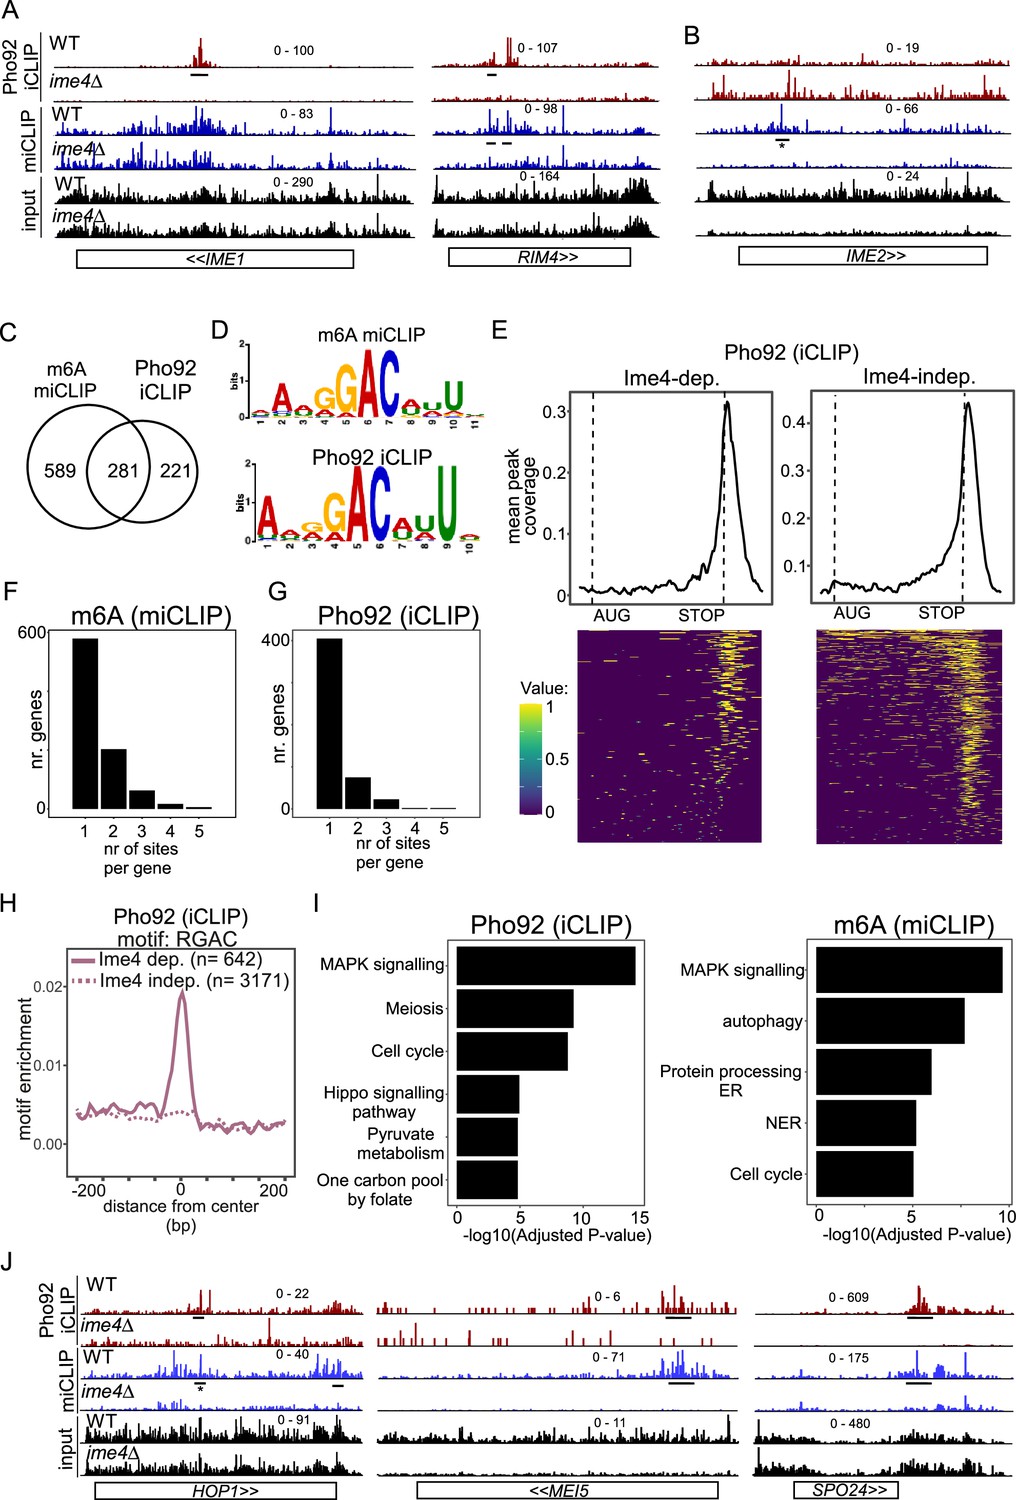
(A) IME1 and RIM4 transcripts bound by Ime4-dependent Pho92. Shown are the crosslinks per million normalised bigWigs for Pho92 iCLIP and miCLIP in WT and ime4Δcells. Underlined are the binding sites identified in the analysis. (B) Similar as A, except that IME2 locus is displayed, which exhibits an m6A peak but no Pho92 binding. The m6A site is labelled. * this was reported in our analysis below the significance threshold (log2FC = −0.6, padj = 0.007). (C) Venn diagram showing the overlap between genes with m6A sites and Ime4-dependent Pho92 binding. (D) Sequence logos of the top ranked motifs from m6A sites and Ime4-dependent Pho92 sites as determined by STREME. (E) Pho92 metagene profile split into genes containing Ime4-dependent Pho92 binding sites (left) and Ime4-independent sites (right). The matrix underlying the heatmap is scored 1 for binding site and 0 for no binding, intermediate values between 0 and 1 are due to smoothing in the visualisation. (F) Number of m6A sites (miCLIP) per transcript. On the x-axis transcripts with 1, 2, 3, 4, or 5 bindings sites. On the y-axis the number of genes for each category is displayed. (G) Similar to F, except that Pho92 binding sites were analysed. (H) Motif enrichment around m6A sites and Pho92 Ime4-dependent and independent binding sites for RGAC. Motif frequency plotted around the centre of Pho92 binding sites, split into Ime4-dependent sites (solid line) and Ime4-independent sites (dotted line). (I) Gene ontology (GO) enrichment analysis for Pho92-bound transcripts (left) and m6A harbouring transcripts based on the miCLIP analysis (right). On the y-axis the category of processes involved, while on x-axis the -log10(adjusted p-value) is displayed. (J) HOP1, MEI5, and SPO24 transcripts bound by Pho92 and marked with m6A. Data tracks are crosslinks per million normalised bigWigs, visualised in IGV. Underlined are the binding sites identified in the analysis. * this was reported in our analysis below the significance threshold (log2FC = −0.94, padj = 0.004).
Figure 2—figure supplement 1
Features of transcripts bound by Pho92.
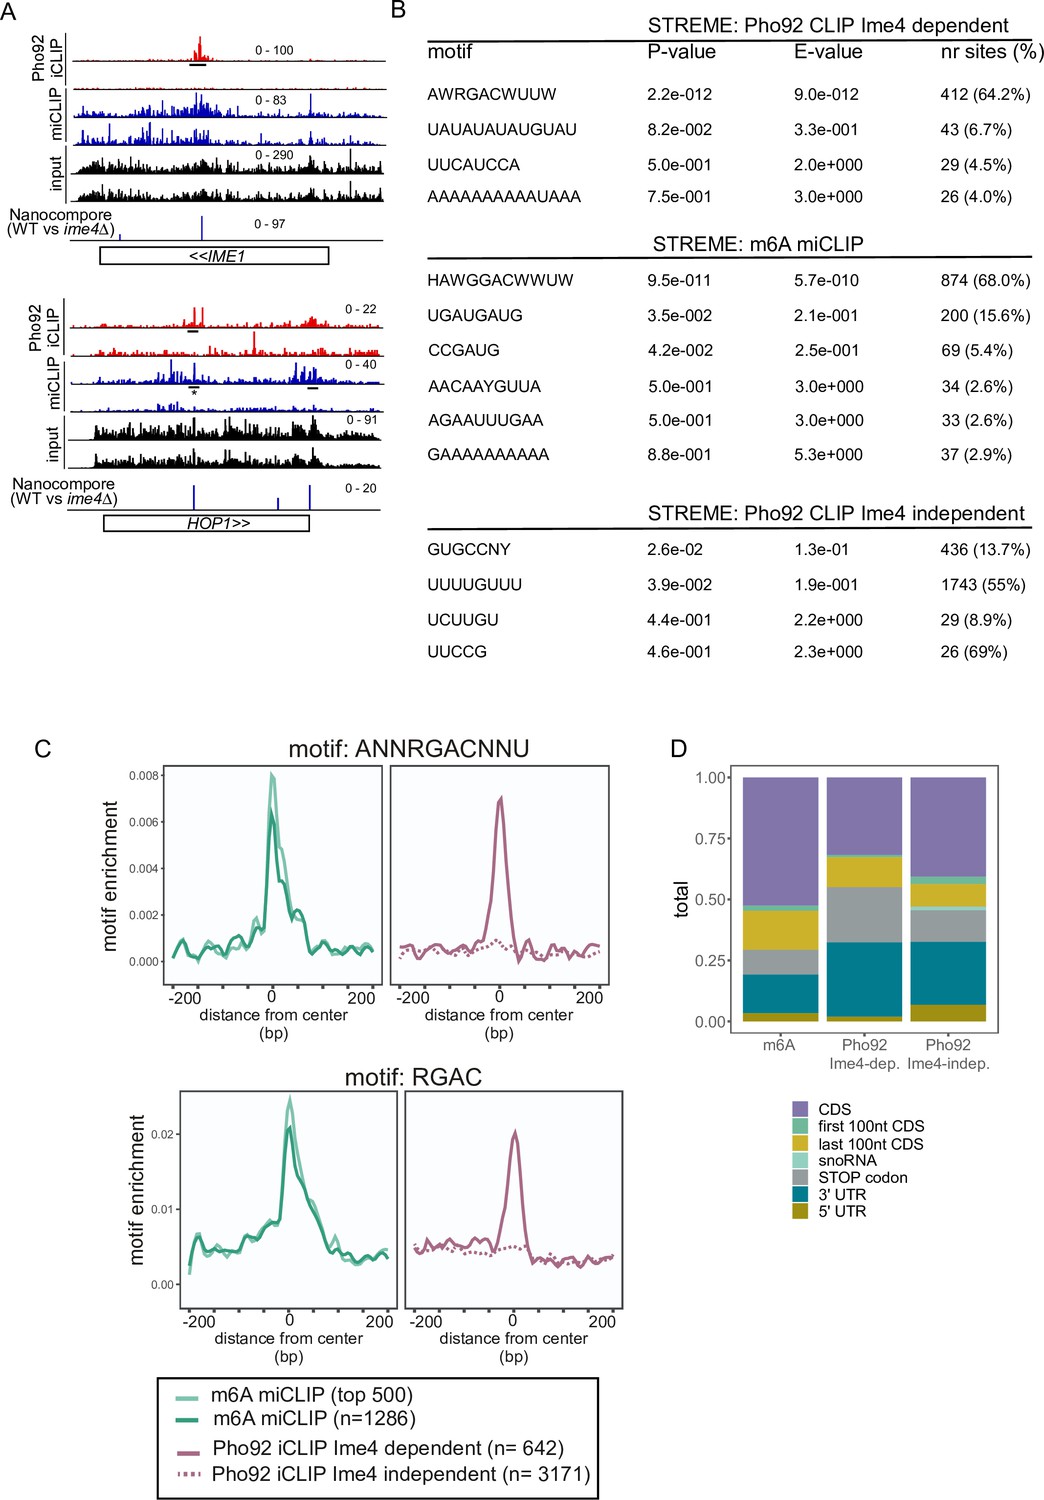
(A) IME1 and HOP1 IGV tracks. Shown are the crosslinks per million normalised bigWigs for Pho92 iCLIP, and miCLIP in WT and ime4Δcells. Underlined are the binding sites identified in the analysis. * this site was reported in our analysis below the significance threshold (miCLIP). The bottom IGV track shows the significant m6A sites identified with comparative Nanopore direct RNA sequencing, with the scale of the bars representing -log10(p value) from a logistic regression test, (Nanocompore, WT versus ime4Δ) (Leger et al., 2021). (B) Motif analysis of Ime4-dependent Pho92 binding sites, m6A sites (miCLIP) and Ime4-independent Pho92 binding sites using STREME. Significant motif sequences are shown. (C) Motif enrichment around m6A sites and Pho92 Ime4-dependent and independent binding sites for RGAC and ANNRGACNNU motifs. Motif frequency plotted around the centre of Pho92 binding sites, split into Ime4-dependent sites (solid line) and Ime4-independent sites (dotted line). (D) Stacked bar graph showing peak distributions over transcript regions for m6A sites, and Pho92 Ime4-dependent and independent binding sites.
Figure 3 with 2 supplements
Pho92 is important for meiosis and fitness of gametes.
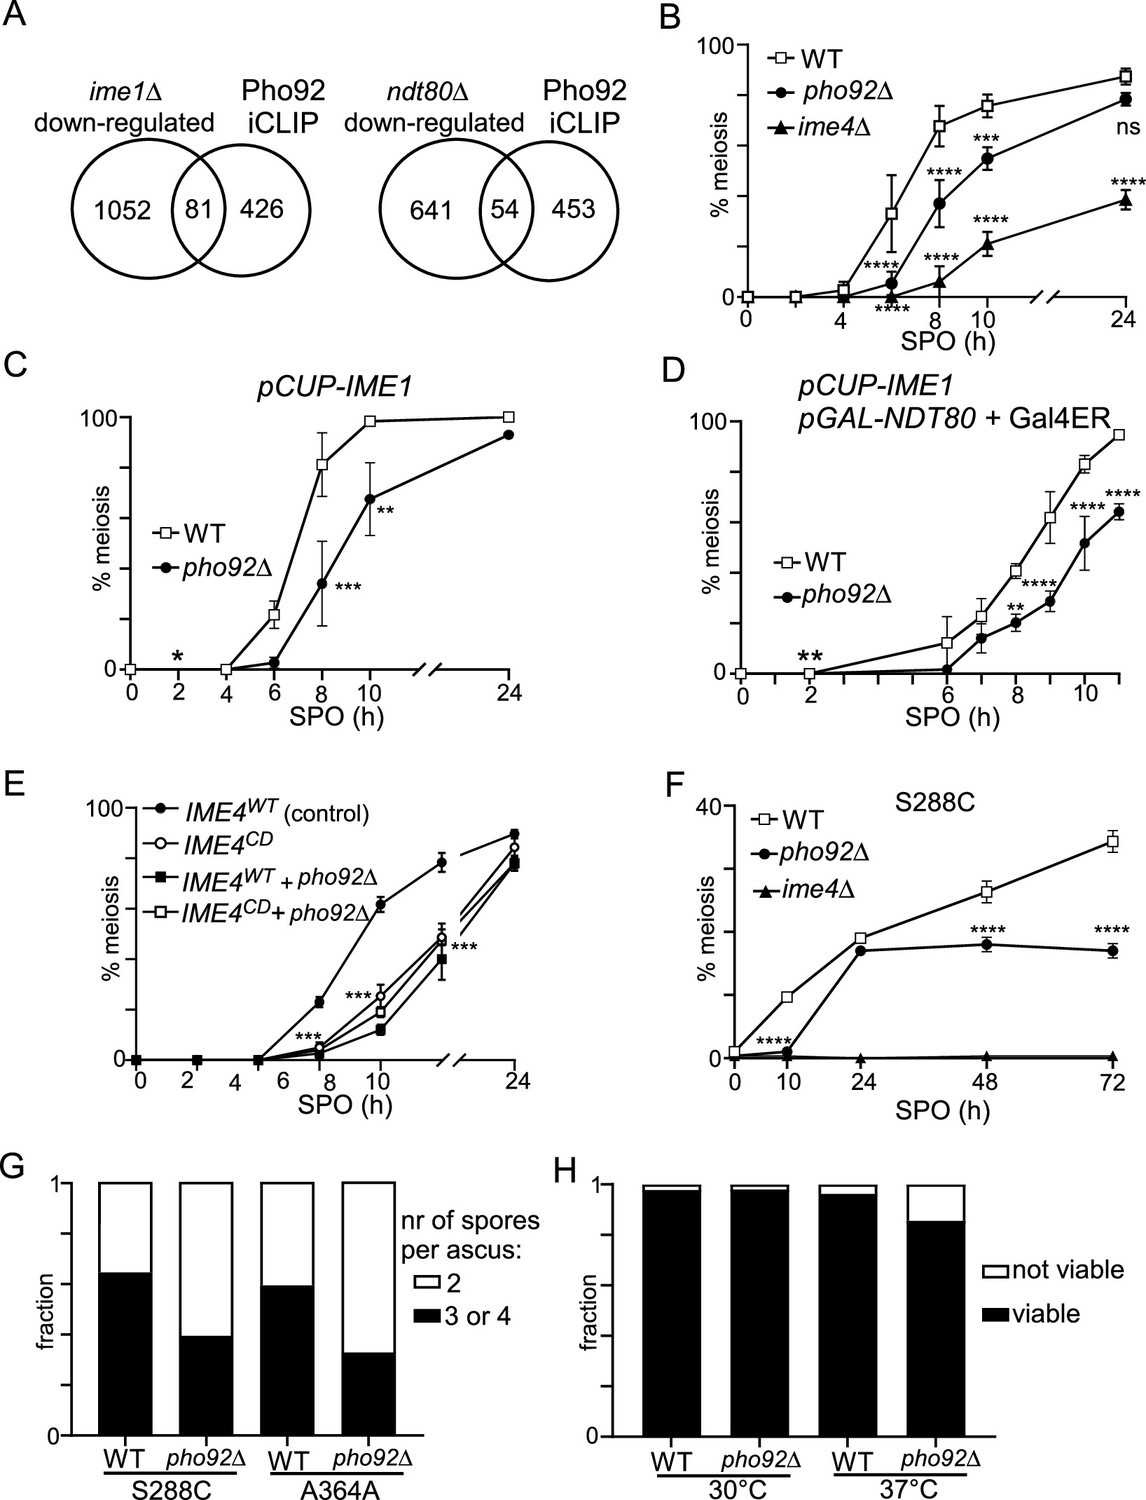
(A) Venn diagram displaying the comparison between RNA-seq of ime1Δ (FW81) and ndt80Δ (FW 4911), and transcripts bound by Pho92. For this analysis, Ime1 and Ndt80-dependent genes were selected by taking the transcripts that were significantly down-regulated compared to the WT control. n=3 biological repeats. (B) Onset of meiosis in WT, pho92Δ, and ime4Δ cells (FW1511, FW3528, and FW725). Cells were grown in rich medium till saturation, shifted to pre-sporulation medium and grown for an additional 16 hr. Subsequently, cells were shifted to SPO, and samples were taken at the indicated time points. Cells were fixed, and stained, DAPI masses were counted for at least n=200 cells per biological repeat (n=3). Cells with two or more DAPI masses were considered as undergoing meiosis. (C) Similar as B, except that cells were induced to undergo meiosis using pCUP-IME1 (WT FW2444, pho92Δ FW3576). Cells were grown as described in B, shifted to SPO, and after 2 hr treated with copper sulphate to induce IME1 expression. (D) Similar as C, except that these also harboured NDT80 under control of the GAL1-10 promoter and fused Gal4 activation domain plus estrogen receptor (Gal4ER). Ndt80 expression was induced at 2 hr in SPO with β-estradiol together with Ime1 expression (WT FW2795, pho92Δ FW9070). (E) Similar analysis as B, except that strains harbouring IME4WT(FW8736), IME4WT + pho92Δ(FW11001), IME4CD (FW8773), or IME4CD + pho92Δ (FW10998) were used for analysis. The error bars represent the standard error of the mean (SEM) of n=3 biological repeats. Indicated is the highest p-value of the following comparisons: IME4WT + pho92Δor IME4CD or IME4CD + pho92Δ versus IME4WT (***p<0.001) on a two-way ANOVA followed by a Fisher’s least significant difference (LSD) test. (F) Similar analysis as B, except that A364A was used for the analysis (WT FW1671, pho92Δ FW8912, ime4Δ FW8913). The error bars represent SEM of n=3; *p<0.05, **p<0.01, ***p<0.001, ****p<0.0001, compared to WT control on a two-way ANOVA followed by a Fisher’s least significant difference (LSD) test. n=3 biological repeats. (G) Spore packaging was assessed in WT and pho92Δ strains (S288C and A364A background). Number of packaged spores per ascus were counted for at least 200 asci. (H) Spore viability of WT (FW 1511) and pho92Δ (FW3531). Cells were patched from YPD agar plates to SPO agar plates and incubated for 3 days at 30 °C or 37 °C. Subsequently tetrads were dissected, and spores grown on YPD agar plates. The fraction of viable and not viable spores is indicated. At least n=150 spores for each condition (30 °C or 37 °C) and each strain (WT and pho92Δ) were used for the analysis.
Figure 3—figure supplement 1
Pho92 is important for meiosis and fitness of gametes.
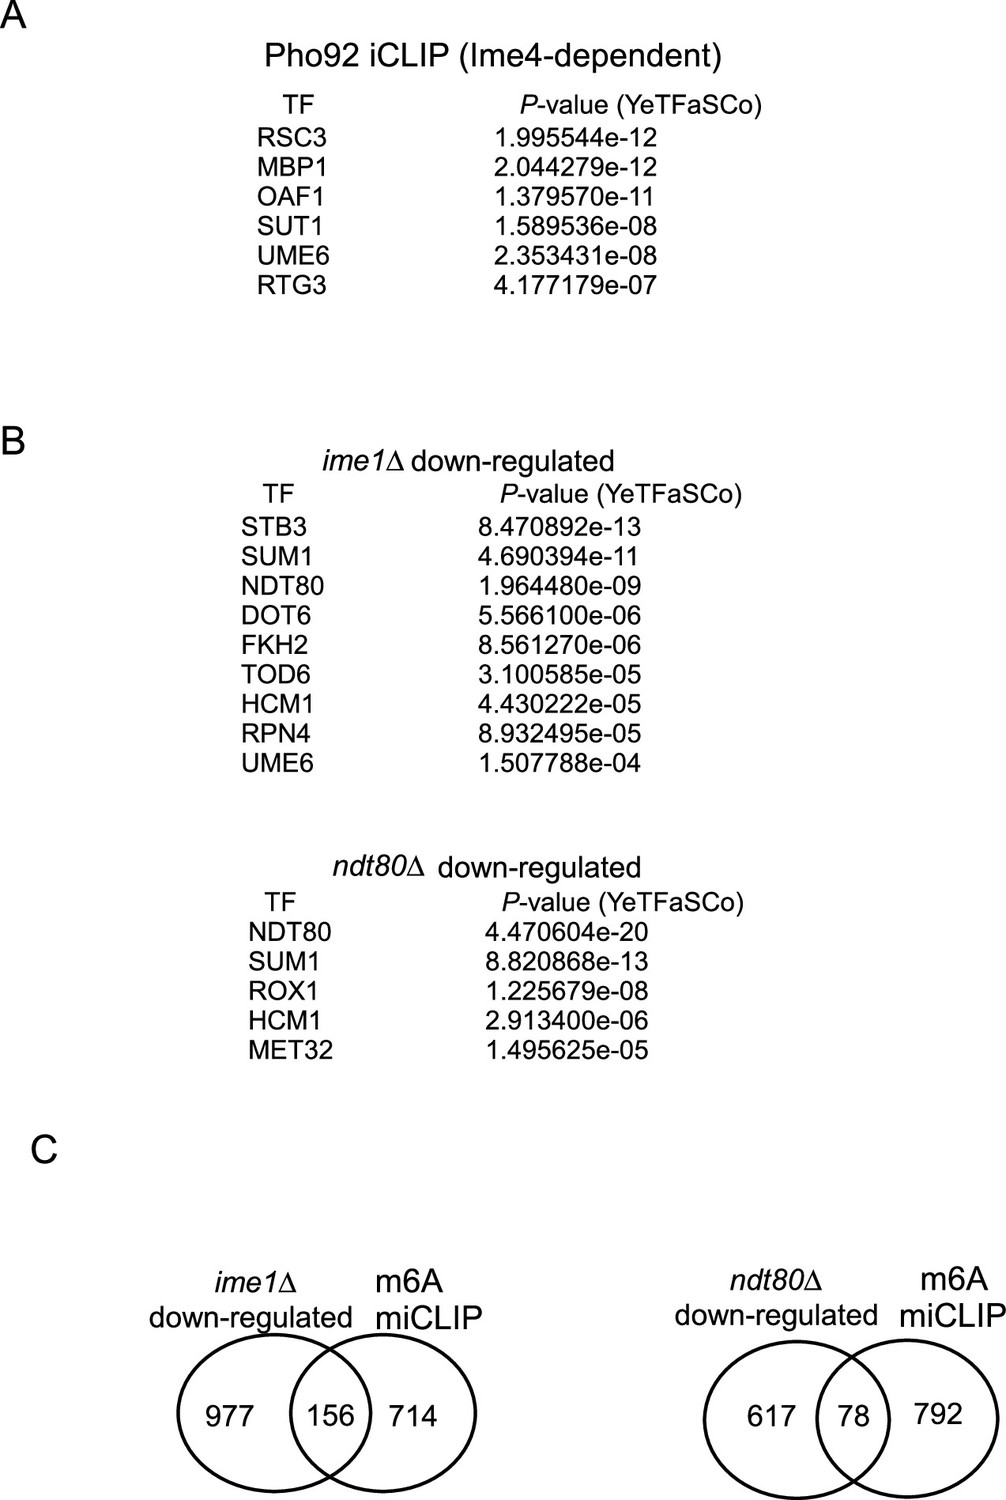
(A) Motif analysis of promoters of transcripts bound by Pho92 in an Ime4-dependent manner. YTFaSCo was used for the analysis {de Boer and Hughes, 2012 #276}. (B) Motif analysis of promoters down-regulated in ime1Δ (FW81) and ndt80Δ (FW 4911) cell during early meiosis. YTFaSCo was used for the analysis {de Boer and Hughes, 2012 #276}. (C) Venn diagram displaying the comparison between RNA-seq of ime1Δ (FW81) and ndt80Δ (FW4911), and transcripts determined by miCLIP. For this analysis, Ime1 and Ndt80-dependent genes were selected by taking the transcripts that were significantly down-regulated compared to the WT control in the ime1Δ and ndt80Δ.
Figure 3—figure supplement 2
Pho92 is important for meiosis and fitness of gametes.
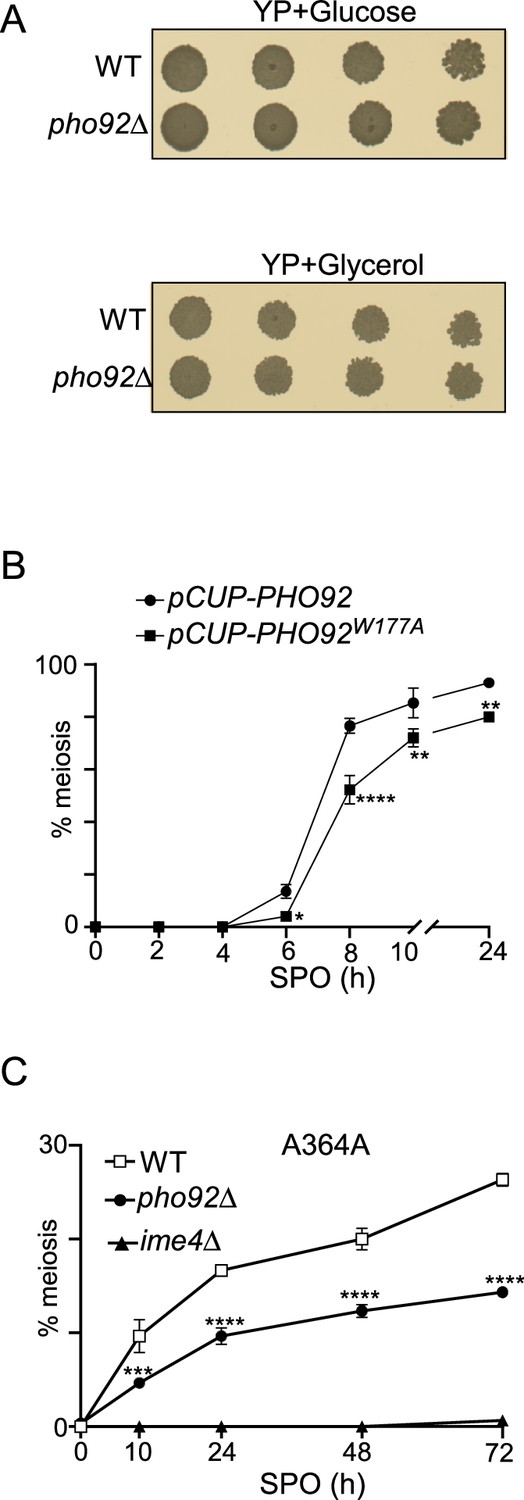
(A) Spot assay of WT and pho92Δcells (FW1511 and FW3528). Cells were grown overnight in YPD, and either spotted on YP glucose or YP glycerol agar plates in fivefold dilutions. (B) Onset of meiosis in pCUP-PHO92 (FW10829) and pCUP-PHO92W177A (FW10892) cells. Cells were induced to enter meiosis in the presence of 50 μM copper sulphate. (C) Onset of meiosis in A364A strain background. For the analysis, we used WT (FW1671), pho92Δ (FW8912), and ime4Δ (FW8913). The error bars represent the standard error of the mean (SEM) of n=3; *p<0.05, **p<0.01, ***p<0.001, ****p<0.0001, compared to WT control on a two-way ANOVA followed by a Fisher’s least significant difference (LSD) test. n=3 biological repeats.
Figure 4 with 3 supplements
Paf1C interacts with Pho92 to direct Pho92 to nucleus.
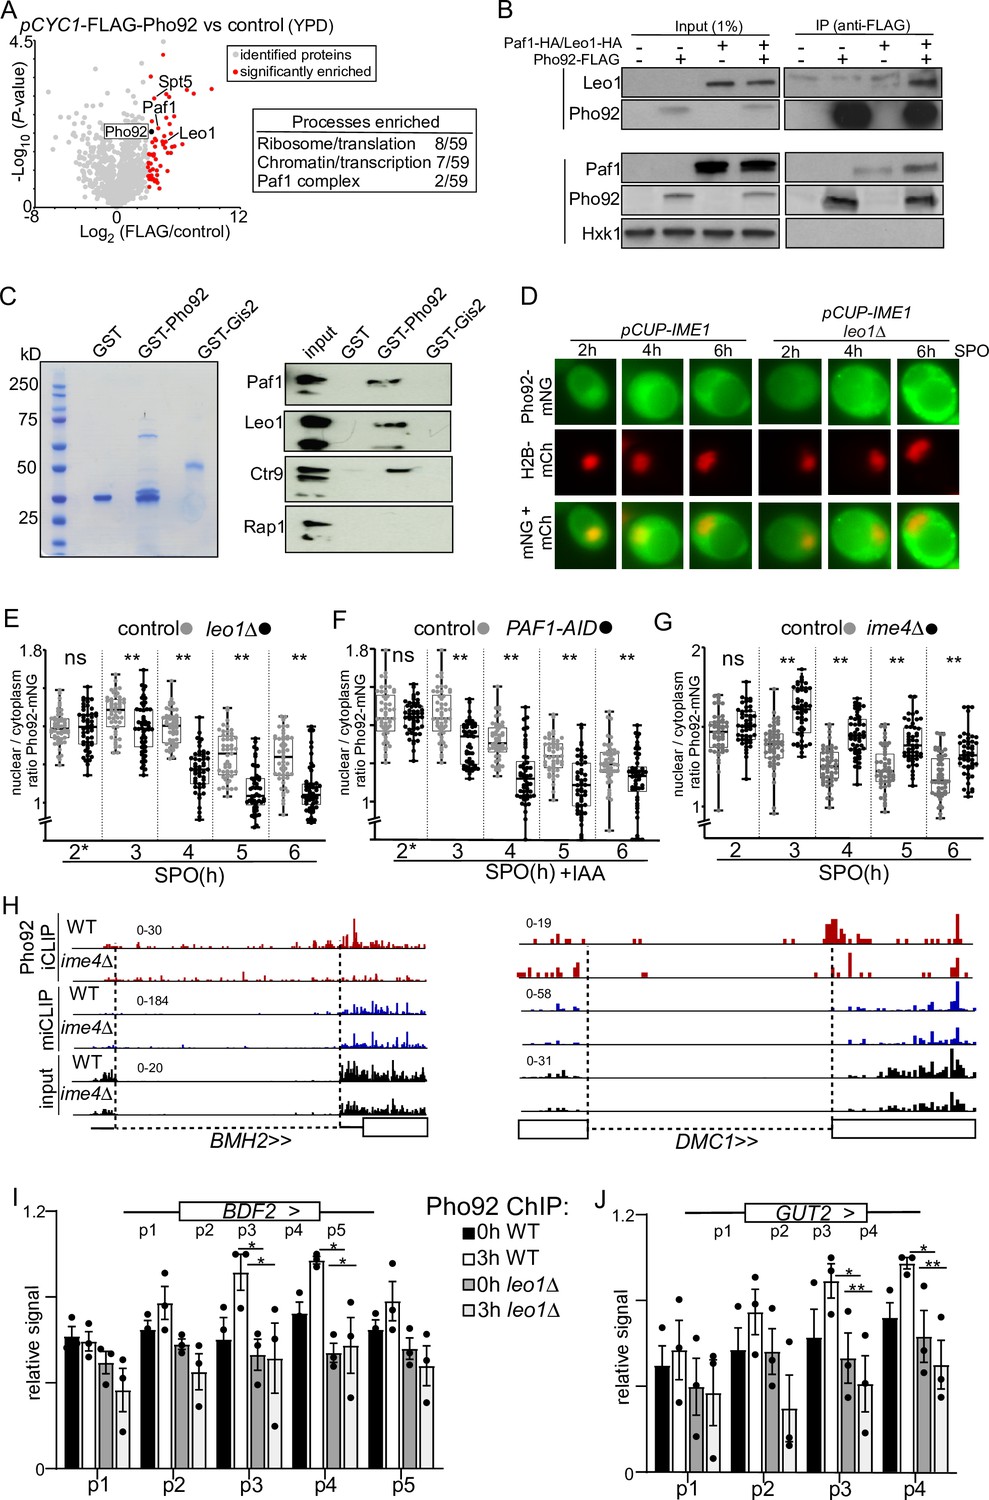
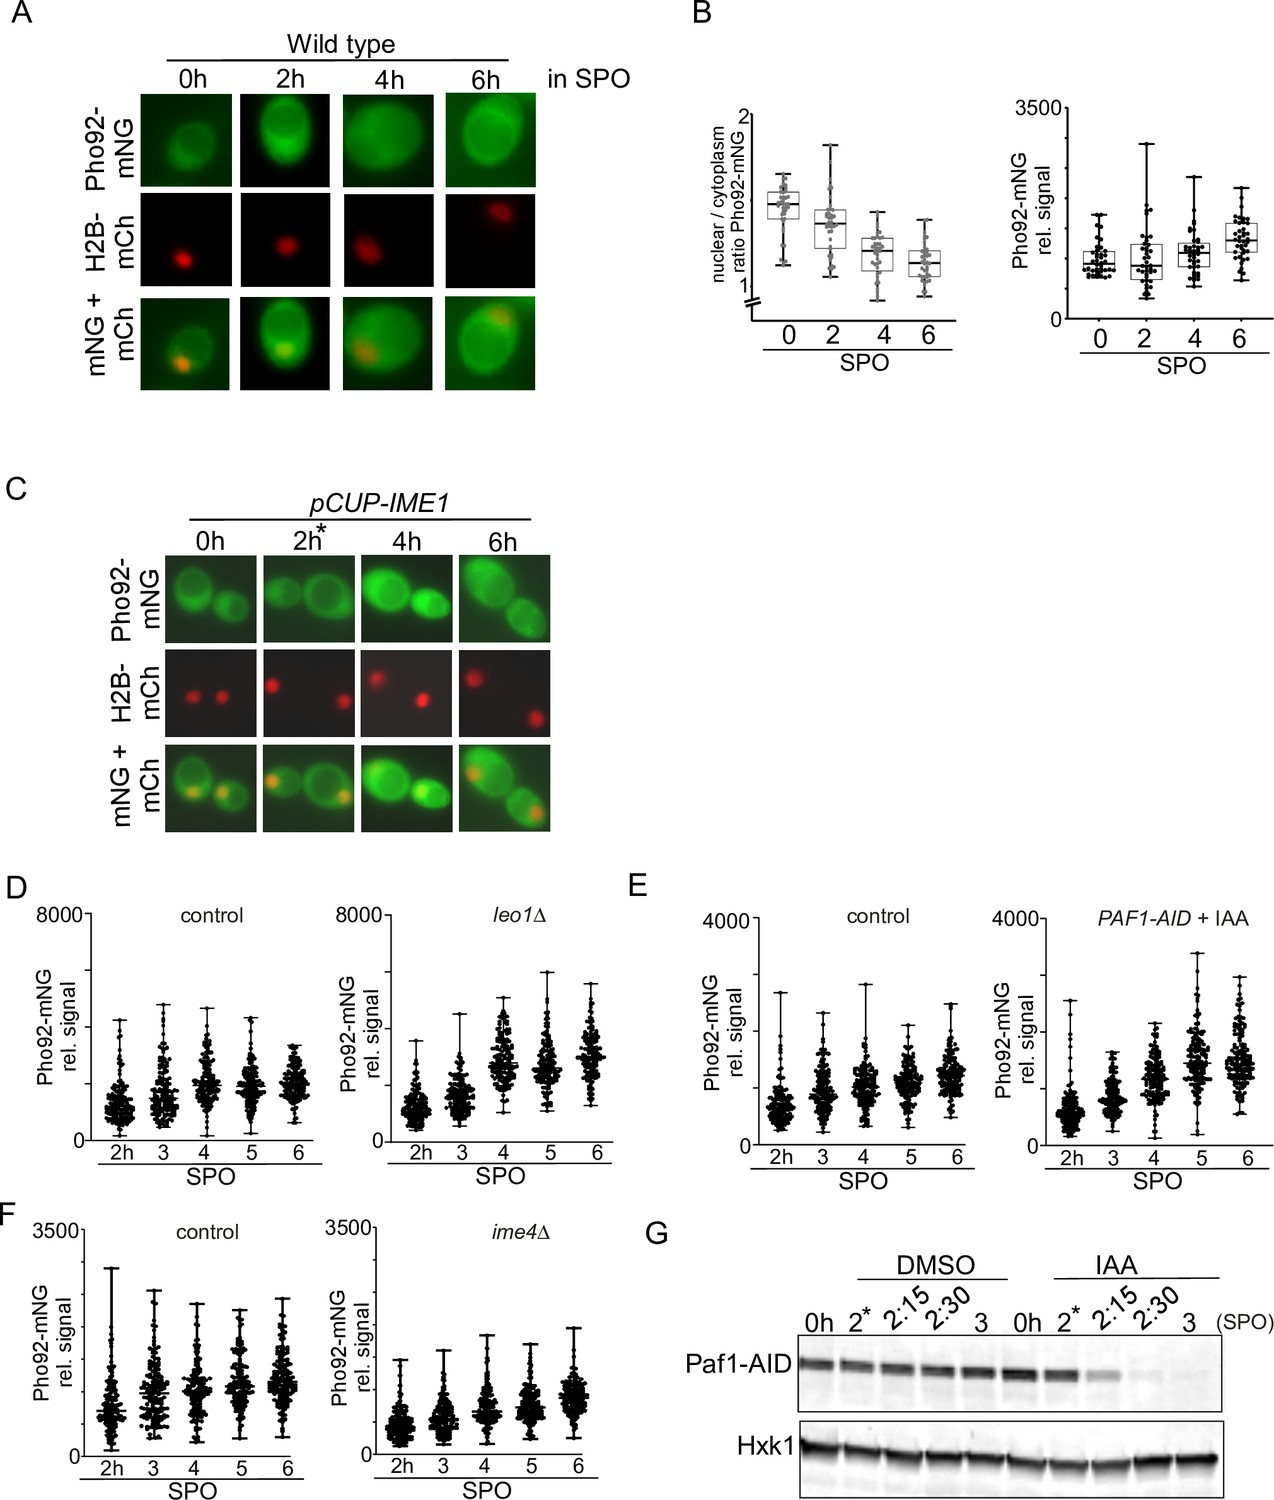
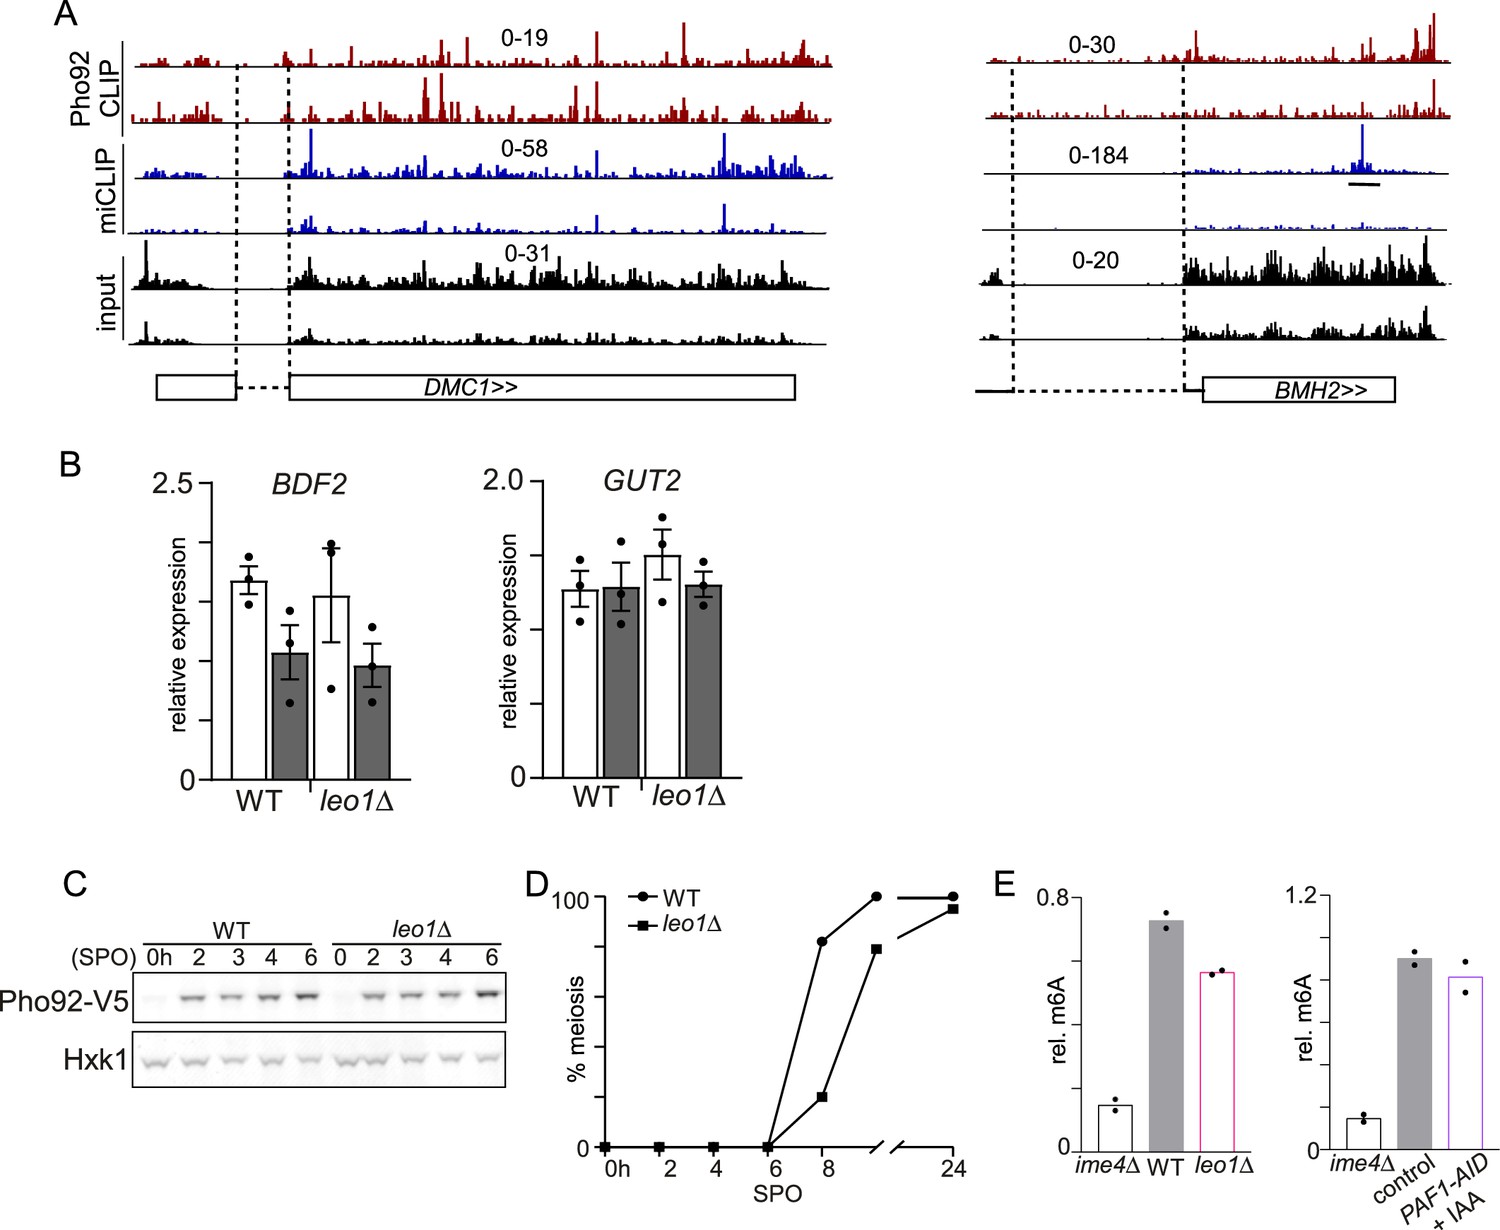
(A) Volcano plot IP-MS of Pho92 (left). Cells expressing the CYC1 promoter (pCYC1-FLAG-Pho92, FW8734) controlling Pho92 expression and a FLAG-tag at the amino terminus were grown in rich medium conditions. Cell extracts from pCYC1-FLAG-Pho92 and control (FW629) were incubated with anti-FLAG beads and eluted with FLAG peptides and analysed by MS using label free quantification method. Significantly enriched proteins are displayed in red. Table (right) proteins enriched in IP-MS experiment (also data from plots in Figure 4—figure supplement 1). Highlighted are the processes and protein complexes enriched. (B) Co-immunoprecipitation of Pho92 and Paf1C. We used strains where pPYK1-FLAG-Pho92 was expressed with or without tagged HA-Paf1 or HA-Leo1 (FW9880 and FW9791). Cells harbouring FLAG-Pho92, HA-Paf1, or HA-Leo1 only were used as control (FW8732, FW9782, and FW9763). As a negative, control membranes were also probed for Hxk1, which does not interact with Pho92. (C) Pull-down of Paf1C by GST-Pho92, GST-Gis2 or GST alone induced in bacteria. Cell extracts were prepared and immobilized on Glutathione- agarose beads. GST-Pho92 bound to beads were subsequently incubated with extracts expressing HA-tagged Paf1, Leo1, Crt9, and Rap1 (FW9782, FW9763, FW9784, FW 4948). (D) Localization of Pho92 during entry in meiosis control and leo1Δ cells (FW9633 and FW9736). Cells expressing Pho92 fused with mNeongreen (Pho92-mNG) were used for the analysis. To determine nuclear localization, we used histone H2B fused to mCherry (H2B-mCh) and the cells also harboured pCUP-IME1 to enable induction of synchronous meiosis. Cells were treated with copper sulphate at 2 hr (labelled with *), and samples were taken at the indicated time points. (E) Quantification of nuclear over cytoplasmic signal for Pho92-mNG in WT and leo1Δ (FW9633 and FW9736). Cells were grown as described in D. At least 150 cells were quantified per time point. Each datapoint is shown in addition to the box plots. ** p<0.01 Welch’s paired t test. (F) Similar to E, except with Paf1 depletion strain. Paf1 is fused to an auxin induced degron (AID-tag), which is induced by copper sulphate and IAA treatment at 2 hr (FW10128). These cells also express TIR1 ligase under control of the CUP1 promoter. Cells harbouring the TIR1 ligase alone were used as controls (FW10129). (G) Same as in E, except that ime4Δ cells were used for the analysis (FW9604). (H) Pho92 binding overlaps with BMH2 and DMC1 introns. Data tracks of Pho92 iCLIP, miCLIP, and miCLIP-input in WT and ime4Δ cells. Intron regions are designated with dashed lines. (I and J) ChIP-qPCR of Pho92 at the BDF2 and GUT2 loci during entry into meiosis in WT (FW4478) and leo1Δ (FW10113) cells. Biological repeats of WT and leo1Δ cells were grown in parallel, each sample was input normalized, subsequently the primer pair with highest signal was set to 1 for each biological repeat, which was primer pair p4 for 3 h WT BDF2 and GUT2. The relative mean signal of n=3 biological repeats are displayed. *p<0.05 and ***p<0.01, on a two-way ANOVA followed by a Fisher’s least significant difference (LSD) test.
-
Figure 4—source data 1
Scan of western blot - probed for Paf1 (HA) in Figure 4B.
- https://cdn.elifesciences.org/articles/84034/elife-84034-fig4-data1-v3.zip
-
Figure 4—source data 2
Scan of western blot - probed for Flag-Pho92 (reprobe of Paf1 (HA) blot) in Figure 4B.
- https://cdn.elifesciences.org/articles/84034/elife-84034-fig4-data2-v3.zip
-
Figure 4—source data 3
Scan of western blot - probed for Paf1 (HA) in Figure 4B.
- https://cdn.elifesciences.org/articles/84034/elife-84034-fig4-data3-v3.zip
-
Figure 4—source data 4
Scan of western blot - probed for Flag-Pho92 (reprobe of Paf1 (HA) blot) in Figure 4B.
- https://cdn.elifesciences.org/articles/84034/elife-84034-fig4-data4-v3.zip
-
Figure 4—source data 5
Scan of western blot -probed for Hxk1 (control)- (reprobe of Paf1 (HA) blot) in Figure 4B.
- https://cdn.elifesciences.org/articles/84034/elife-84034-fig4-data5-v3.zip
-
Figure 4—source data 6
Scan of coomassie gel showing expression of GST proteins in Figure 4C.
- https://cdn.elifesciences.org/articles/84034/elife-84034-fig4-data6-v3.zip
-
Figure 4—source data 7
Scan of western blot with high exposure ECL detection probed for Paf1 (HA) and Leo1 (HA) in Figure 4C.
- https://cdn.elifesciences.org/articles/84034/elife-84034-fig4-data7-v3.zip
-
Figure 4—source data 8
Scan of western blot with low exposure ECL detection probed for Ctr9 (HA) in Figure 4C.
- https://cdn.elifesciences.org/articles/84034/elife-84034-fig4-data8-v3.zip
-
Figure 4—source data 9
Scan of western blot with medium exposure ECL detection probed for Control Rap1(HA) in Figure 4C.
- https://cdn.elifesciences.org/articles/84034/elife-84034-fig4-data9-v3.zip
Figure 4—figure supplement 1

Paf1C interacts with Pho92 to direct Pho92 to nucleus.
(A) Western blot of Pho92 eluates used for MS analysis. Diploid cells harbouring Pho92-V5 tagged and untagged control (FW4478 and FW1511). Cells were grown and induced to enter meiosis, and samples were collected at 4 hr in SPO. Cell extracts were incubated with anti-V5 beads and eluted with V5 peptides followed by laemmli sample buffer boiling elution. E1, E2, and E3 represent peptide eluates. (B) Similar as A, except that cells with the CYC1 promoter (pCYC1-FLAG-Pho92, FW8734) controlling Pho92 expression and a FLAG-tag at the amino terminus was grown in rich medium conditions. Cell extracts were incubated with anti-FLAG beads and eluted with FLAG peptides. E1, E2, and E3 represent eluates. (C) Volcano plots of IP-MS of Pho92-V5 compared to untagged control. Significantly enriched proteins are displayed in red. Pho92 is labelled in black.
-
Figure 4—figure supplement 1—source data 1
Scan of western blot showing IP of Pho92-V5 in Figure 4—figure supplement 1A.
- https://cdn.elifesciences.org/articles/84034/elife-84034-fig4-figsupp1-data1-v3.zip
-
Figure 4—figure supplement 1—source data 2
Scan of western blot showing IP of Flag-Pho92 in Figure 4—figure supplement 1B.
- https://cdn.elifesciences.org/articles/84034/elife-84034-fig4-figsupp1-data2-v3.zip
Figure 4—figure supplement 2
Paf1C interacts with Pho92 to direct Pho92 to nucleus.
(A) Localization of Pho92 during entry in meiosis control WT (FW9323). Cells expressing Pho92 fused with mNeongreen (Pho92-mNG) were used for the analysis. To determine nuclear localization, we used histone H2B fused to mCherry (H2B-mCh). (B) Quantification of nuclear over cytoplasmic signal (left) and whole cell signal (right) for Pho92-mNG (FW9323). At least 50 cells were quantified per time point. Each datapoint is shown in addition to the box plots. (C) Localization of Pho92 during entry in meiosis in pCUP-IME1 (FW9633). Cells expressing Pho92-mNG and H2B-mCh were used for the analysis. Cells were treated with copper sulphate at 2 hr (labelled with *), and samples were taken at the indicated time points. (D) Whole cell quantification of Pho92-mNG in WT and leo1Δ cells during entry into meiosis. These cells also harboured pCUP-IME1. Cells were treated with copper sulphate at 2 hr. Samples were taken at the indicated time points. Signal for Pho92-mNG in WT and leo1Δ (FW9633 and FW9736). At least 150 cells were quantified per time point. (E) Similar as D, except that Paf1 depletion allele was used for the analysis. Paf1 fused to the auxin-induced degron (AID) was used (FW10128). These cells expressed TIR1 ligase under control of the CUP1 promoter. The depletion was induced by treating cells with copper sulphate and IAA. Cells harbouring the TIR1 ligase alone were used as controls (FW10129). (F) Same as in D, except that ime4Δ cells (FW9604) were used for the analysis. (G) Western blot of strains used in E showing the depletion of PAF1-AID. * indicates treatment with copper sulphate and IAA.
-
Figure 4—figure supplement 2—source data 1
Licor Odyssey multi-channel scan of western blot probed for Paf1-AID and Hxk1 in Figure 4—figure supplement 2G.
- https://cdn.elifesciences.org/articles/84034/elife-84034-fig4-figsupp2-data1-v3.zip
Figure 4—figure supplement 3
Paf1C interacts with Pho92 to direct Pho92 to nucleus.
(A) Pho92 binds to some intronic regions in transcripts. IGV data tracks of Pho92 iCLIP, miCLIP, and input in WT and ime4Δ cells. Intron regions of BMH2 and DMC1 are shown. (B) RT-qPCR of BDF2 and GUT2 expression at 3 hr in SPO. Signals were normalized to ACT1. n=3 biological replicates + SEM. (C) Pho92 expression in WT and leo1Δ cells during entry into meiosis. Diploid cells harbouring Pho92-V5 in WT and leo1Δ (FW4478 and FW10113) were induced to enter meiosis. Samples were taken at the indicated time points, and protein extracts were assessed by western blotting with anti-V5 antibodies. As a loading control Hxk1 was used. (D) Onset of meiosis in WT and leo1Δ cells (FW4478 and FW10113). Cells were shifted to SPO, and samples were taken at the indicated time points. Cells were fixed, and stained, DAPI masses were counted for at least n=200 cells. Cells with two or more DAPI masses were considered as undergoing meiosis. (E) m6A ELISA during entry into meiosis of WT, ime4Δ and leo1Δ cells (left) and after Paf1 depletion (right). The relative m6A signals are displayed. n=2 biological repeats.
-
Figure 4—figure supplement 3—source data 1
Licor Odyssey multi-channel scan of western blot probed for Pho92-V5 and Hxk1 in Figure 4—figure supplement 3C.
- https://cdn.elifesciences.org/articles/84034/elife-84034-fig4-figsupp3-data1-v3.zip
Figure 5 with 2 supplements

Pho92 and CCR4-NOT promotes decay of m6A marked transcripts.
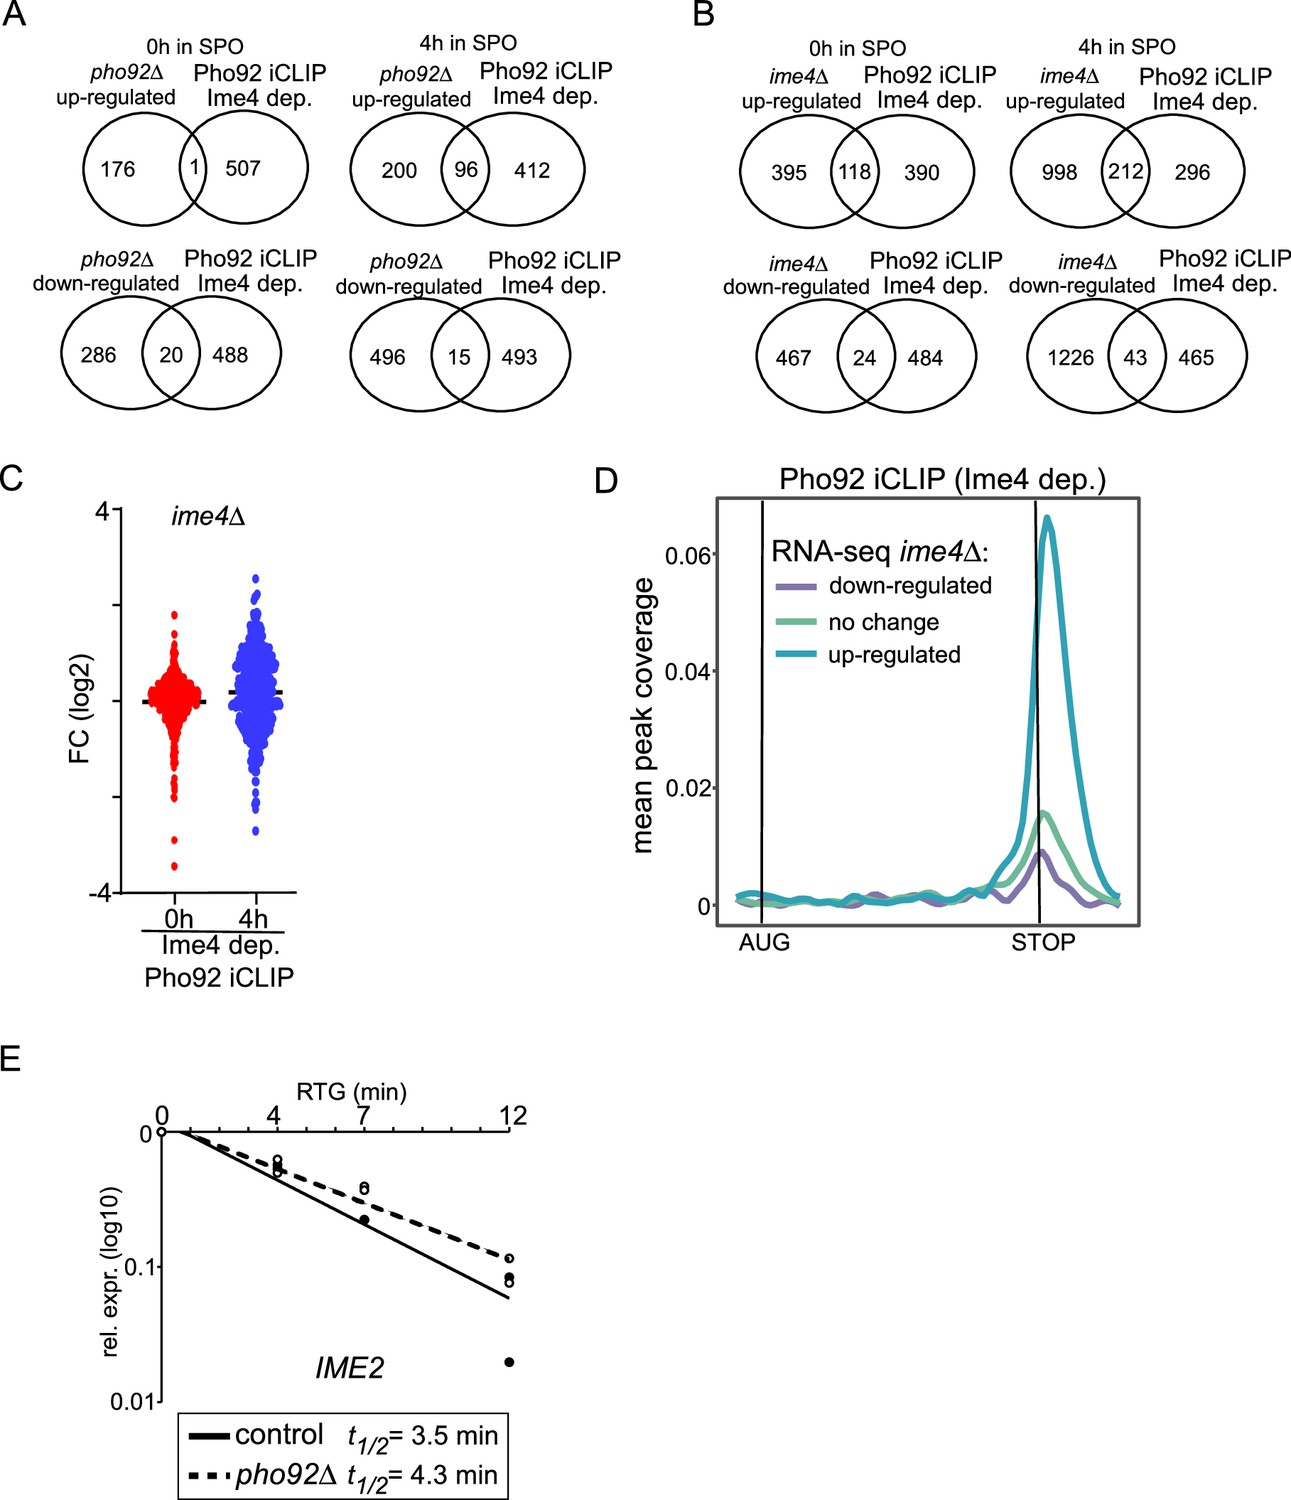
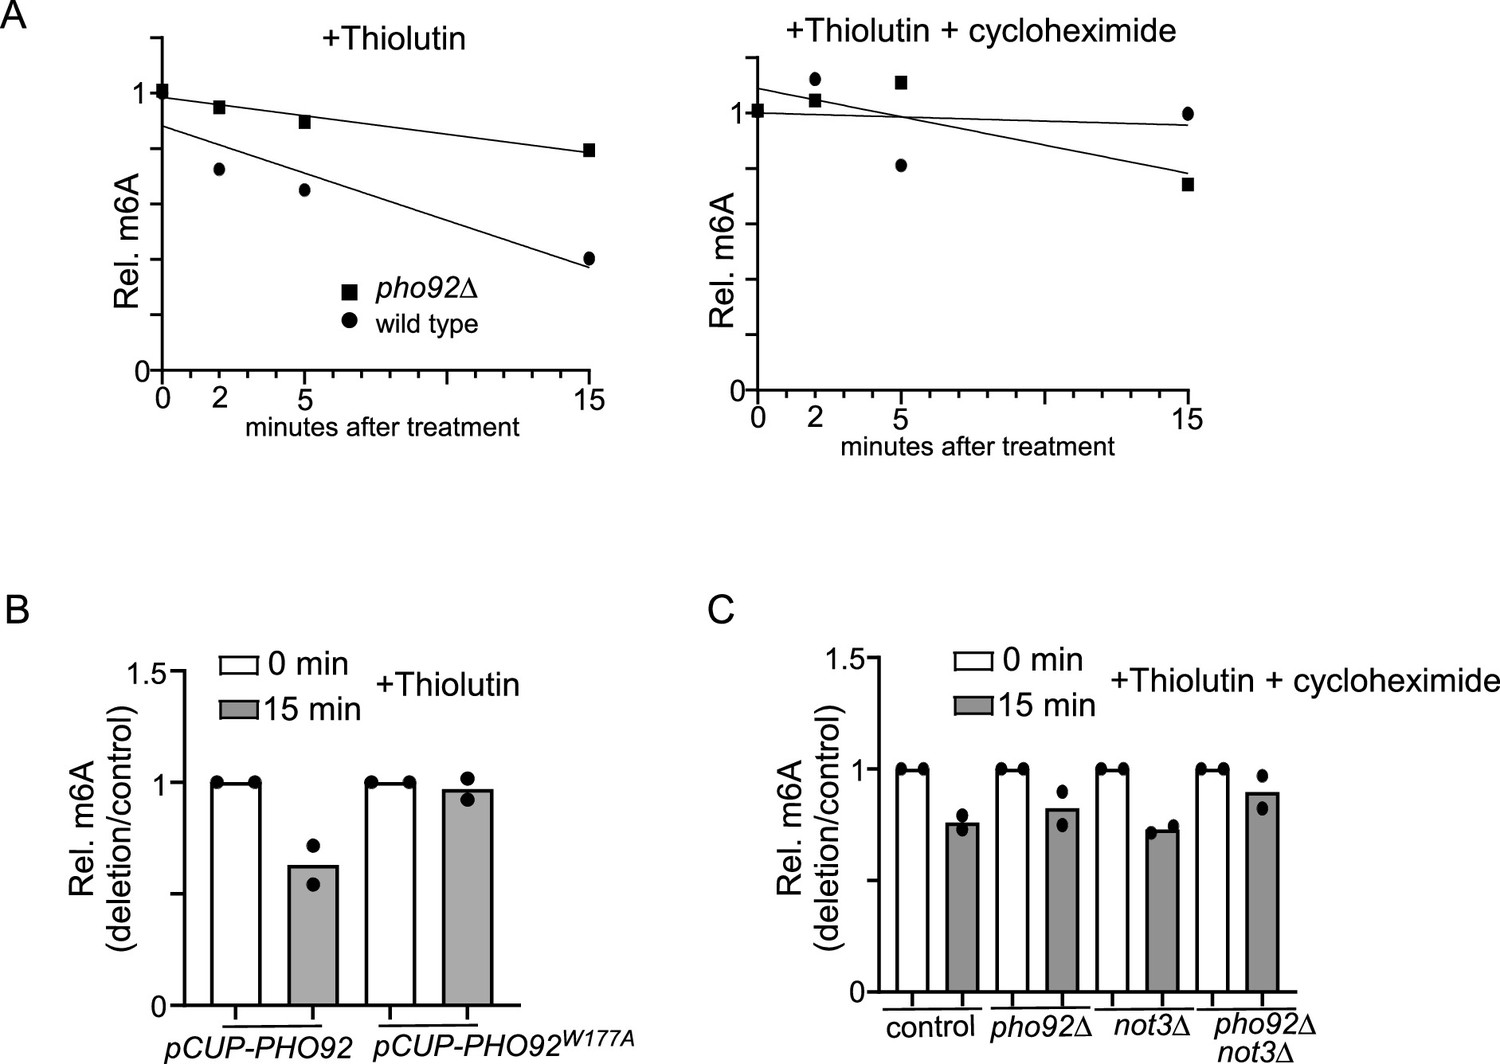
(A) m6A-MS for control, ime4Δ, and pho92Δ (FW4911, FW6060, and FW6997). Samples were taken at 6 h in SPO. mRNA was isolated using oligodT paramagnetic beads. Samples were digested, and m6A levels of A were determined by LC-MS. **p<0.01 and ***p<0.001, compared to WT control on a two-way ANOVA followed by a Fisher’s least significant difference (LSD) test. n=3 biological repeats. (B) Differential analysis of pho92Δ vs WT for transcripts with Ime4-dependent and Ime4-independent Pho92 binding sites. Samples were taken at 0 and 4 hours in SPO for WT and pho92Δ cells (FW1511 and FW3528). RNA-seq was performed. Displayed are transcripts that are bound by Pho92 in an Ime4-dependent and independent manner as determined by iCLIP. Differential expression between 0 hr in SPO for pho92Δ vs WT are displayed (red), and 4 hr in SPO pho92Δ vs WT are displayed (blue). (C) Metagene analysis plotting Ime4-dependent Pho92 binding sites on genes that were either significantly upregulated, down regulated, or unchanged in 4 hr in SPO pho92Δ vs WT RNA-Seq. The y-axis represents the proportion of transcripts in that RNA-seq category with a binding site overlapping a given x coordinate. (D) mRNA decay measurements after transcriptional shut-off by returning cells to growth (YPD) for specific meiotic mRNAs (GUT2, HOP1, and IME1). For the analysis samples were taken at 4 hours in SPO (0 min timepoint), and 4, 7, and 12 min after return of cells to growth. mRNA expression was determined by RT-PCR. Samples were normalized by ACT1. Indicated are the estimated mRNA half-lives (t1/2) based on n=2 biological repeats. (E) m6A-ELISA in WT and pho92Δ cells (FW1511 and FW3528) after blocking transcription using thiolutin. Cells were grown and induced to enter meiosis. Cells were treated with thiolutin, and samples were taken at the indicated time points. Relative m6A levels were determined by m6A-ELISA. (F) Relative m6A levels in depletion mutants of various decay pathways determined by m6A-MS and m6A-seq2 (FW5958, FW6080, FW6048, FW5880, FW 6070, FW6043, FW5956, FW5964). In short, cells were grown and induced to enter meiosis. Each decay mutant bearing auxin-induced depletion alleles (AID) was depleted by adding auxin at 4 hr in SPO, and samples were collected at 6 hr in SPO. m6A-MS (n=2 biological repeats) and m6A-seq2 data were normalized to a control strain harbouring the TIR ligase. m6A-seq2 data were obtained from Dierks et al., 2021. (G) Similar analysis as E, except that the signals for ime4Δ and not3Δ cells are shown (control, FW4911, FW6060 and FW6093). *p<0.05 and ***p<0.001, for m6A-MS compared to WT control on a two-way ANOVA followed by a Fisher’s least significant difference (LSD) test. WT and ime4Δ data are the same as in A. At least n=2 biological repeats were performed. (H) m6A-ELISA comparing WT, pho92Δ and not3Δ single and double mutants (FW1511, FW3528, FW6090, and FW6179) before and after blocking transcription with thiolutin for 15 min. Cells were grown to and induced to enter meiosis, treated with thiolutin, and samples were taken at 15 min after treatment. Relative m6A levels were determined by m6A-ELISA. n=2 biological repeats. (I) Similar analysis as E, but cells were treated with both thiolutin and cycloheximide.
Figure 5—figure supplement 1
Pho92 and CCR4-NOT promotes decay of m6A marked transcripts.
(A) Venn diagrams comparing differentially expressed transcripts in pho92Δ RNA-seq vs transcripts with Ime4-dependent Pho92 binding. (B) Similar as A, except that differentially expressed transcripts from ime4Δ vs WT RNA-seq is compared to Pho92-bound transcripts. (C) Differential analysis of ime4Δ vs WT for transcripts with Ime4-dependent Pho92 binding sites. Samples were taken at 0 and 4 hr in SPO for WT and pho92Δ cells (FW1511 and FW725). RNA-seq was performed. Displayed are transcripts that are bound by Pho92 in an Ime4-dependent manner as determined by iCLIP. Differential expression between 0 hr in SPO for ime4Δ vs WT are displayed (red), and 4 hr in SPO ime4Δ vs WT are displayed (blue). (D) Metagene analysis plotting Ime4-dependent Pho92 binding sites on genes that were either significantly upregulated, down regulated, or unchanged in 4 hr SPO ime4Δ vs WT RNA-seq. The y-axis represents the proportion of transcripts in that RNA-seq category with a binding site overlapping a given x coordinate. (E) mRNA decay measurements after transcriptional shut-off by returning cells to growth (YPD) for IME2. For the analysis, samples were taken at 4 hr in SPO (0 min timepoint), and 4, 7, and 12 min after return cells to growth. mRNA expression was determined by RT-PCR. Samples were normalized by ACT1. Indicated are the estimated mRNA half-lives (t1/2) based on n=2 biological repeats.
Figure 5—figure supplement 2
Pho92 and CCR4-NOT promotes decay of m6A marked transcripts.
(A) m6A-MS in WT and pho92Δ cells (FW1511 and FW 3528) after blocking transcription using thiolutin. Cells were grown and induced to enter meiosis. Cells were treated with thiolutin (left panel) or thiolutin + cycloheximide (right panel), and samples were taken at the indicated time points. Relative m6A levels were determined by LC-MS. (B) m6A-ELISA comparing pCUP-PHO92 (FW10829) and pCUP-PHO92W177A (FW10892). Cells were treated with thiolutin samples were taken at 15 min after treatment. Relative m6A levels were determined by m6A-ELISA. n=2 biological repeats. (C) m6A-ELISA comparing WT, pho92Δ and not3Δ single and double mutants (FW1511, FW3528, FW6090 and FW6179). Cells were grown to be induced to enter meiosis, treated with thiolutin + cycloheximide, and samples were taken at 15 min after treatment. Relative m6A levels were determined by m6A-ELISA. n=2 biological repeats.
Figure 6 with 1 supplement

Pho92 interacts with polysomes and controls protein expression.
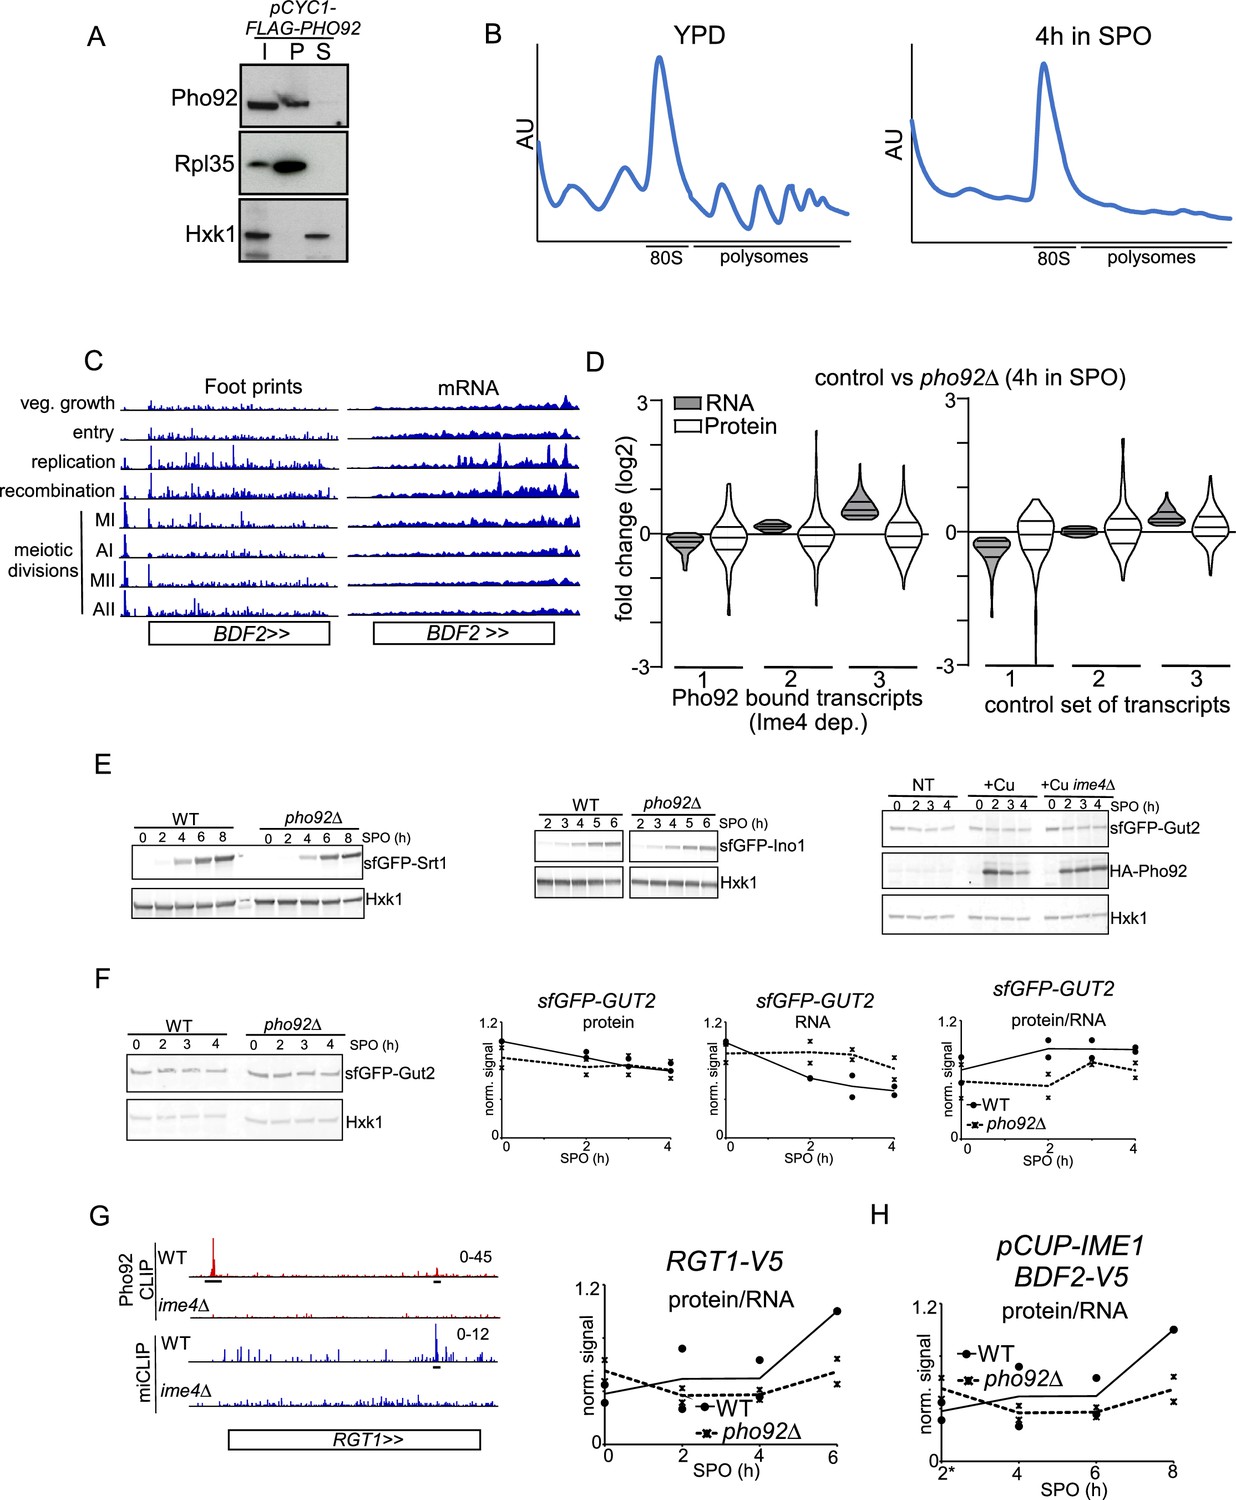
(A) Sucrose cushion analysis of cells expressing pPYK1-FLAG-Pho92 (FW 8732) were grown in rich medium. Immunoblots of total (T) pellet/ribosomal (P) and soluble (S) fractions are shown for FLAG-Pho92, hexokinase (Hxk1) and Rpl35 (ribosomal subunit of 60 S) proteins. (B) Polysome fractionation and western blot of Pho92. Diploid cells harbouring Pho92 tagged with V5 (FW4478). Cells were induced to enter meiosis and at 4 hr in SPO samples were taken. The small (40 S), large (60 S), both (80 S) subunits and polysomes are highlighted from the polysome traces. Protein extracts from fractions were probed for Pho92-V5 by immunoblotting. As controls membranes were probed for Rpl35 and Hxk1. (C) Polyribo-seq analysis was performed 4 hr SPO pho92Δ vs WT (FW1511 and FW3528). Ribosomal fractionation was performed to isolate mRNAs bound to polysomes. Polyribo-seq was performed and the data was compared to RNA-seq from total fraction. Displayed are transcripts that are bound by Pho92 in an Ime4-dependent manner as determined by iCLIP. Differential expression between pho92Δ vs WT are displayed for total mRNA from total fraction (red), and polysome fraction (blue). Non-significant (ns) compared to WT control on a Welsch’s t-test. (D) Analysis of translation efficiency (TE) using Brar et al., 2012 dataset. We assessed the TE for transcripts harbouring Ime4-dependent Pho92 binding sites, m6A sites and a control set of transcripts comprised of the rest of expressed mRNAs at 4 hr in SPO. Boxes show the median and interquartile range, extending lines show first and fourth quartiles. *p<0.005 and **p<0.001 compared to control using Welsch’s t-test. (E) Violin plots describing RNA-seq and proteome data from comparing pho92Δ(FW3528) to control (FW1511). In short, cells were induced to enter meiosis. Samples for RNA-seq and whole proteome analysis were taken at 4 hr in SPO for WT and pho92Δcells. Transcripts with Ime4-dependent Pho92 binding sites and with a signal in whole proteome quantification were used for the analysis. The RNA-seq data divided in the three groups (1–3), group 1 represents genes with the reduced RNA-seq signal, group 2 little change, group 3 upregulated in pho92Δ RNA-seq. The corresponding signal from the whole protein data is displayed. (F) Similar analysis as E, except that the control entailed a group of genes up-regulated in the RNA-seq that were not bound by Pho92 were used for the analysis. *p<0.05 and **p<0.01 compared to control on a Welsch’s t-test. (G–I) SRT1, GUT2 and INO1 transcripts bound by Pho92 and marked with m6A. Shown are the data tracks for Pho92 CLIP for WT (FW4472) and ime4Δ (FW4505) cells, and miCLIP for WT (FW1511) and ime4Δ (FW725). Underlined are the binding sites identified in the analysis. Tracks are crosslink per million normalised stranded bigWigs viewed in IGV. Relative protein, RNA, and protein over RNA ratios. WT and pho92Δ cells were grown to enter meiosis and samples from time points indicated. For the analysis SRT1, INO1, and GUT2 were tagged seamlessly with sfGFP at the amino terminus. Protein expression was determined by western blotting. The relative signal is displayed with max signal for each biological repeat (n=2) scaled to one. RNA levels were determined by RT-qPCR. The relative signal was computed by setting the maximum signal for each time course experiment (which included WT and pho92Δ) repeat to one. Right panel. The ratio of protein and RNA signals. The relative signal was computed by setting the maximum signal for each time course experiment (which included WT and pho92Δ) repeat to 1. For SRT1 analysis, cells were induced to enter meiosis at the indicated time points (FW9949 and FW9950). For INO1 analysis, meiosis was induced using pCUP-IME1 synchronization system (FW9746 and FW9747). For GUT2 analysis was performed in the presence or absence of Pho92 expression from the CUP1 promoter (FW 10438 and ime4Δ, FW10441).
-
Figure 6—source data 1
Raw scans of Figure 6A.
- https://cdn.elifesciences.org/articles/84034/elife-84034-fig6-data1-v3.zip
-
Figure 6—source data 2
Raw scans of Figure 6A.
- https://cdn.elifesciences.org/articles/84034/elife-84034-fig6-data2-v3.zip
-
Figure 6—source data 3
Raw scans of Figure 6A.
- https://cdn.elifesciences.org/articles/84034/elife-84034-fig6-data3-v3.zip
-
Figure 6—source data 4
Raw scans of Figure 6B.
- https://cdn.elifesciences.org/articles/84034/elife-84034-fig6-data4-v3.zip
-
Figure 6—source data 5
Raw scans of Figure 6B.
- https://cdn.elifesciences.org/articles/84034/elife-84034-fig6-data5-v3.zip
-
Figure 6—source data 6
Raw scans of Figure 6B.
- https://cdn.elifesciences.org/articles/84034/elife-84034-fig6-data6-v3.zip
Figure 6—figure supplement 1
Pho92 interacts with polysomes and controls protein expression.
(A) Sucrose cushion of cells expressing pCYC1-FLAG-Pho92 (FW 8734). Cells were grown in rich medium. Immunoblots of total (T) pellet/ribosomal (P) and soluble (S) fractions are shown for FLAG-Pho92, hexokinase (Hxk1) and Rpl35 (ribosomal subunit of 60 S) proteins. (B) Polysome traces from cells grown in rich medium (YPD), and cells in early meiosis (4 hr in SPO). (C) Ribosome footprint and mRNA-seq (RPKM) data from Brar et al., 2012 at the BDF2 locus. BDF2 has multiple m6A peaks and Pho92 binding sites. Indicated are the different phases of yeast gametogenesis. (D) Related to Figure 6E. A control set of transcripts was included for the analysis that showed no binding to Pho92. (E) Related to Figure 6G–I, sfGFP-Srt1, sfGFP-Ino1, and sfGFP-Gut2 protein expression was determined by western blot. (F) Similar analysis as Figure 6G, except that GUT2 protein and RNA signals are displayed. For the analysis GUT2 was seamlessly tagged with sfGFP at the N-terminus (FW9836 and FW9781). (G) Similar analysis as Figure 6G, except that RGT1 protein over RNA signals are displayed (n=2 biological repeats). For the analysis, RGT1 was tagged with V5 at the C-terminus (FW9951 and FW9952). Also shown are the RGT1 tracks for Pho92 iCLIP for WT (FW4472) and ime4Δ (FW4505) cells, and miCLIP for WT (FW1511) and ime4Δ (FW725). Underlined are the binding sites identified in the analysis. Tracks are crosslink per million normalised stranded bigWigs viewed in IGV. (H) Similar analysis as Figure 6G, except that BDF2 protein over RNA signals are displayed (n=2 biological repeats). For the analysis, meiosis was induced using pCUP-IME1 synchronization system. For the analysis, BDF2 was tagged with V5 at the C-terminus (FW8973 and FW9093).
-
Figure 6—figure supplement 1—source data 1
Raw scans of Figure 6—figure supplement 1A.
- https://cdn.elifesciences.org/articles/84034/elife-84034-fig6-figsupp1-data1-v3.zip
-
Figure 6—figure supplement 1—source data 2
Raw scans of Figure 6—figure supplement 1A.
- https://cdn.elifesciences.org/articles/84034/elife-84034-fig6-figsupp1-data2-v3.zip
-
Figure 6—figure supplement 1—source data 3
Raw scans of Figure 6—figure supplement 1A.
- https://cdn.elifesciences.org/articles/84034/elife-84034-fig6-figsupp1-data3-v3.zip
-
Figure 6—figure supplement 1—source data 4
Licor Odyssey multi-channel scan of western blot probed for SfGFP-Srt1 and Hxk1 in Figure 6—figure supplement 1E.
- https://cdn.elifesciences.org/articles/84034/elife-84034-fig6-figsupp1-data4-v3.zip
-
Figure 6—figure supplement 1—source data 5
Licor Odyssey multi-channel scan of western blot probed for SfGFP-Ino1 and Hxk1 in Figure 6—figure supplement 1E.
- https://cdn.elifesciences.org/articles/84034/elife-84034-fig6-figsupp1-data5-v3.zip
-
Figure 6—figure supplement 1—source data 6
Licor Odyssey multi-channel scan of western blot probed for SfGFP-Gut2 and Hxk1 (reprobed for HA-Pho92) in Figure 6—figure supplement 1E.
- https://cdn.elifesciences.org/articles/84034/elife-84034-fig6-figsupp1-data6-v3.zip
-
Figure 6—figure supplement 1—source data 7
Licor Odyssey multi-channel scan of western blot probed for SfGFP-Gut2 and Hxk1 in Figure 6—figure supplement 1F.
- https://cdn.elifesciences.org/articles/84034/elife-84034-fig6-figsupp1-data7-v3.zip
-
Figure 6—figure supplement 1—source data 8
Licor Odyssey multi-channel scan of western blot probed for RGT1-V5 and Hxk1 in Figure 6—figure supplement 1G.
- https://cdn.elifesciences.org/articles/84034/elife-84034-fig6-figsupp1-data8-v3.zip
-
Figure 6—figure supplement 1—source data 9
Licor Odyssey multi-channel scan of western blot probed for BDF2-V5 and Hxk1 in Figure 6—figure supplement 1H.
- https://cdn.elifesciences.org/articles/84034/elife-84034-fig6-figsupp1-data9-v3.zip
Figure 7
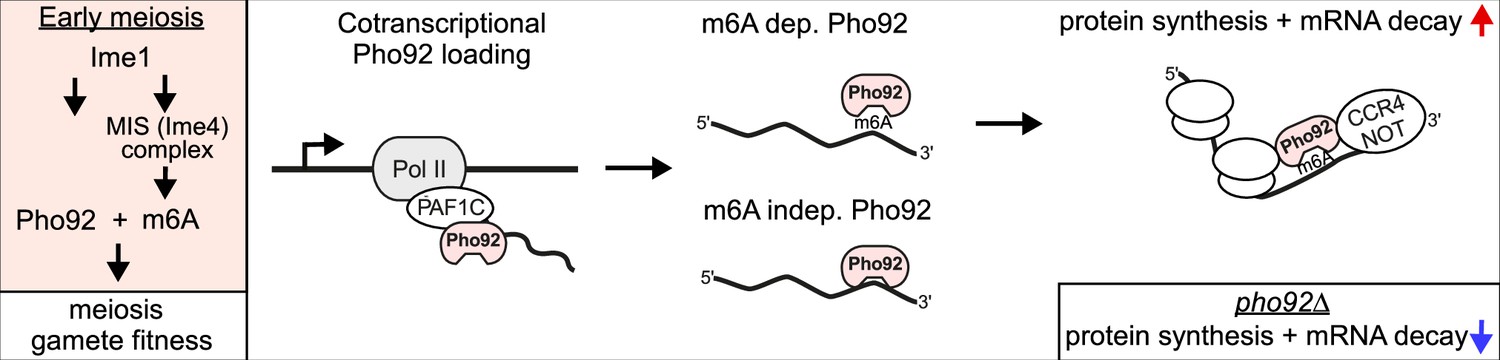
Model for role of Pho92 in early meiosis.
Pho92 and MIS complex (Ime4) expression are induced by Ime1. Subsequently, Pho92 is loaded to mRNAs during transcription via Paf1C, and Pho92 promotes the protein synthesis to mRNA decay fate of m6A modified transcripts involving CCR4-NOT.
Additional files
-
Supplementary file 1
Yeast strains.
- https://cdn.elifesciences.org/articles/84034/elife-84034-supp1-v3.xlsx
-
Supplementary file 2
Plasmids.
- https://cdn.elifesciences.org/articles/84034/elife-84034-supp2-v3.docx
-
Supplementary file 3
Oligos sequences.
- https://cdn.elifesciences.org/articles/84034/elife-84034-supp3-v3.xlsx
-
Supplementary file 4
MS pulldown data.
- https://cdn.elifesciences.org/articles/84034/elife-84034-supp4-v3.xlsx
-
Supplementary file 5
iCLIP and miCLIP data table.
- https://cdn.elifesciences.org/articles/84034/elife-84034-supp5-v3.xlsx
-
Supplementary file 6
IP-MS data table.
- https://cdn.elifesciences.org/articles/84034/elife-84034-supp6-v3.xlsx
-
MDAR checklist
- https://cdn.elifesciences.org/articles/84034/elife-84034-mdarchecklist1-v3.pdf
Download links
A two-part list of links to download the article, or parts of the article, in various formats.
Downloads (link to download the article as PDF)
Open citations (links to open the citations from this article in various online reference manager services)
Cite this article (links to download the citations from this article in formats compatible with various reference manager tools)
N6-methyladenosine (m6A) reader Pho92 is recruited co-transcriptionally and couples translation to mRNA decay to promote meiotic fitness in yeast
eLife 11:e84034.
https://doi.org/10.7554/eLife.84034


