Evaluation of antibody kinetics and durability in healthy individuals vaccinated with inactivated COVID-19 vaccine (CoronaVac): A cross-sectional and cohort study in Zhejiang, China
- Department of Immunization Program, Zhejiang Provincial Center for Disease Control and Prevention, China
- School of Medicine, Ningbo University, China
- Xihu District Center for Disease Control and Prevention, China
- Shangyu District Center for Disease Control and Prevention, China
- Kaihua District Center for Disease Control and Prevention, China
- Yuecheng District Center for Disease Control and Prevention, China
- Department of Immunization Program, Jiaxing Center for Disease Control and Prevention, China
- Longyou District Center for Disease Control and Prevention, China
- School of Public Health, Xiamen University, China
Figures
Figure 1
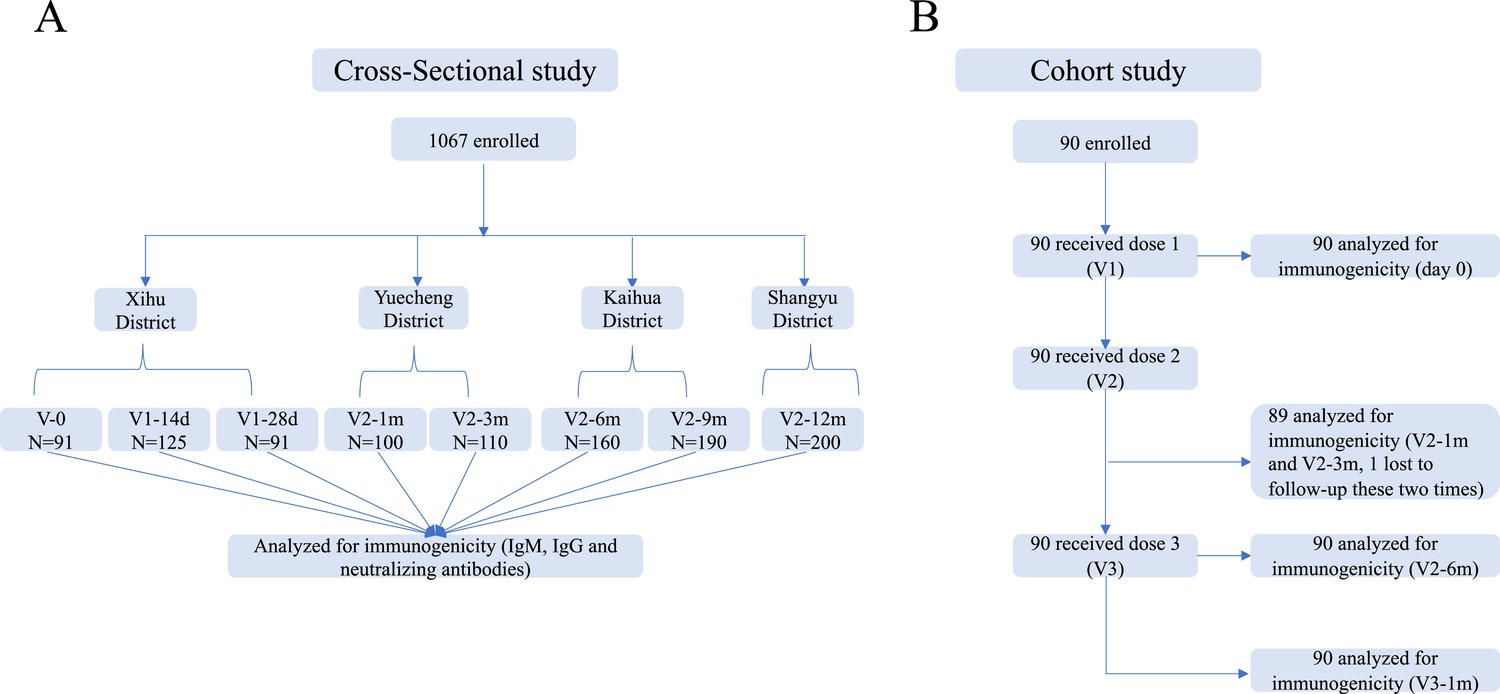
Schedule of sample collection.
(A) Cross-sectional survey: a total of 1067 participants aged 18–59 were enrolled in five counties in Zhejiang, China. The participants had no previous vaccination or were vaccinated with one or two doses of CoronaVac. Venous blood (3–5 ml) was collected on day 0 (V-0, no vaccination), day 14±2 (V1-14d), and day 28±3 (V1-28d) after the first dose, and day 30±3 (V2-1m), day 90±7 (V2-3m), day 180±14 (V2-6m), day 270±14 (V2-9m), and day 365±30 (V2-12m) after the second dose. (B) Prospective cohort study: 90 healthy adults aged 18–80 years in Jiaxing city were recruited and administered 4 µg/0.5 mL of CoronaVac following a 3-shot vaccine schedule 28 days and 6 months apart. Following that, venous blood was collected from recipients at five timepoints: day 0 (Pre-V, before vaccination), day 30±3 (V2-1m), day 90±7 (V2-3m), and day 180±14 (V2-6m) after the second dose, and day 30±3 (V3-1m) after the third dose.
Figure 2
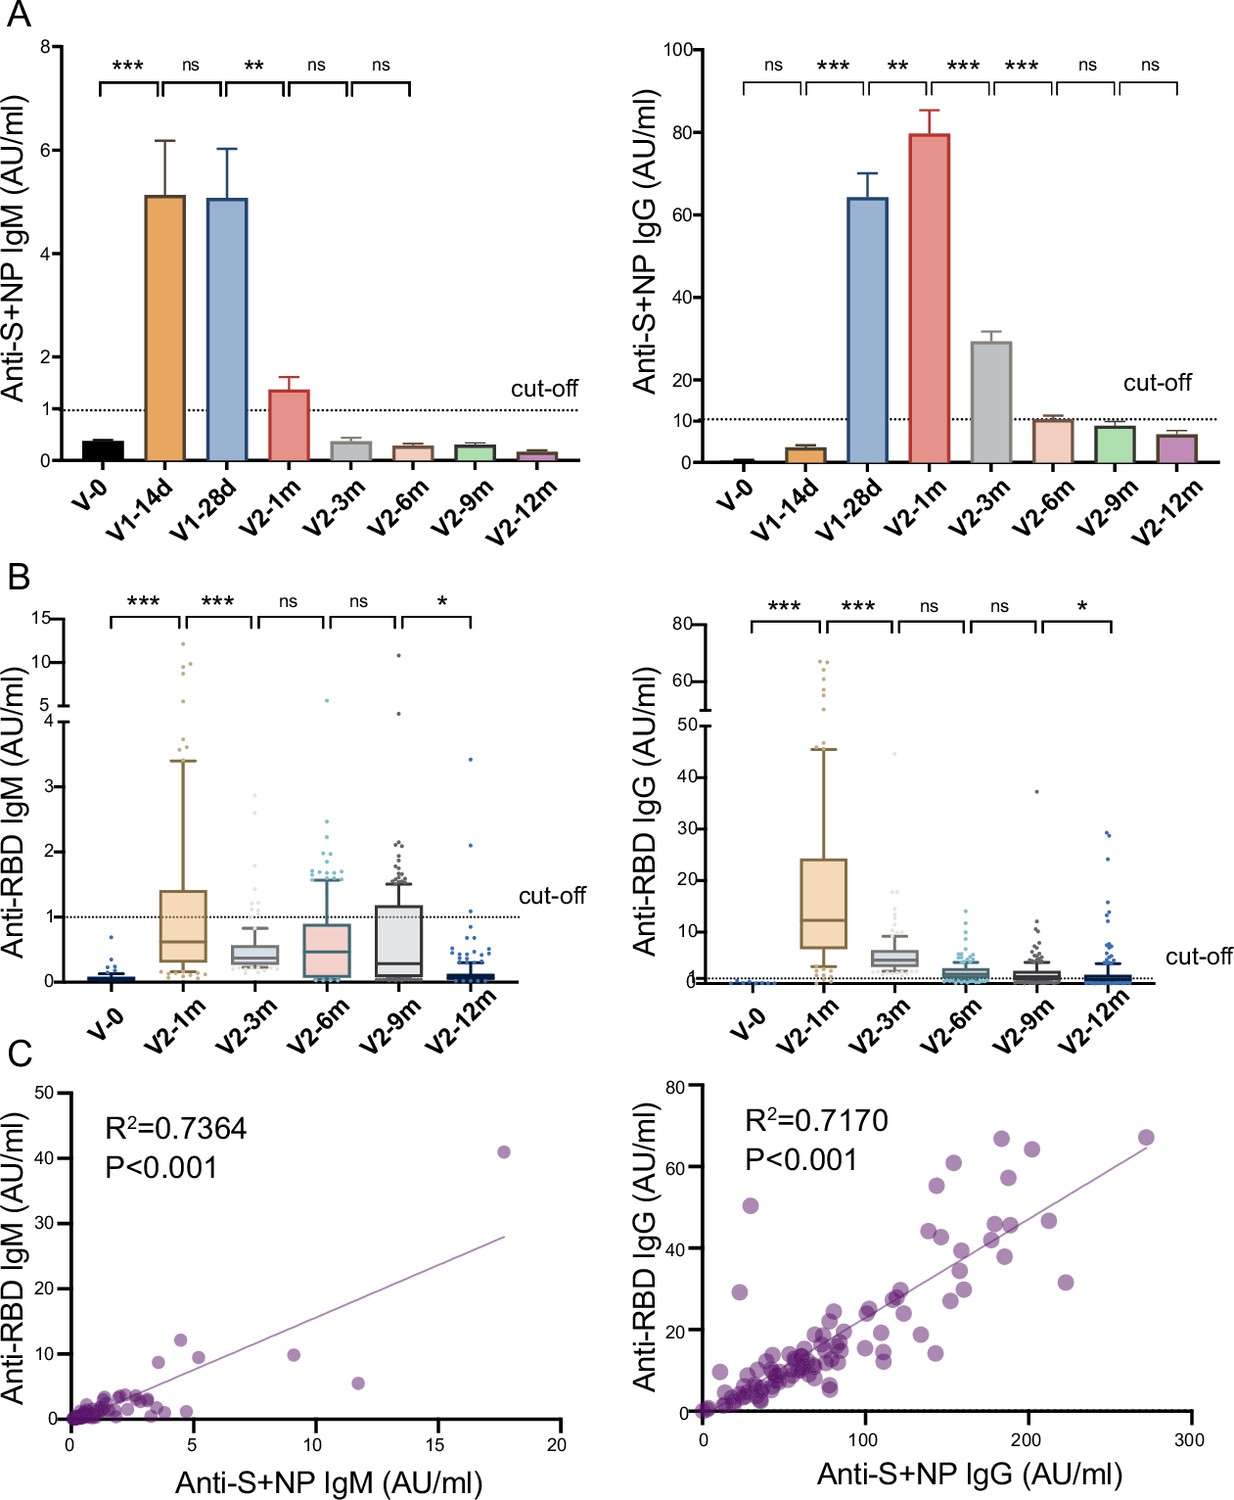
Anti-SARS-CoV-2-specific IgG and IgM levels induced by inactivated COVID-19 vaccines.
(A, B) Dynamic changes in anti-S/ N- (A) and anti-RBD- (B) specific IgM/IgG in serum samples from CoronaVac-vaccinated participants at V-0, V1-14d, V1-28d, V2-1m, V2-3m, V2-6m, V2-9m, and V2-12m. (C) Correlation between levels of anti-S/anti-N- and anti-RBD-specific antibodies in IgM (left) or IgG (right) at V2-1m. Dates are presented as mean ± SEM. One-way analysis of variance was used for comparison. Correlations were assessed using Pearson’s correlation coefficient. Two-tailed p values were calculated. ns, not significant, * p<0.05, **p<0.01, ***p<0.001.
-
Figure 2—source data 1
Anti-SARS-CoV-2-specific IgG and IgM levels induced by inactivated COVID-19 vaccines.
- https://cdn.elifesciences.org/articles/84056/elife-84056-fig2-data1-v2.xlsx
Figure 3

Neutralizing antibodies induced by inactivated COVID-19 vaccines.
(A, B) Dynamic changes in GMT of NAb titer (A) and neutralized fraction (B) in serum samples from CoronaVac-vaccinated participants at V-0, V2-1m, V2-3m, V2-6m, V2-9m, and V2-12m. (C) Correlation among levels of anti-SARS-CoV-2-IgM and IgG, GMT of NAb titer, and neutralized fraction at V2-1m. One-way analysis of variance was used for comparison. Correlations were assessed using Pearson’s correlation coefficient. Two-tailed p values were calculated. ns, not significant, * p<0.05, **p<0.01, ***p<0.001.
-
Figure 3—source data 1
Neutralizing antibodies induced by inactivated COVID-19 vaccines.
- https://cdn.elifesciences.org/articles/84056/elife-84056-fig3-data1-v2.xlsx
Figure 4
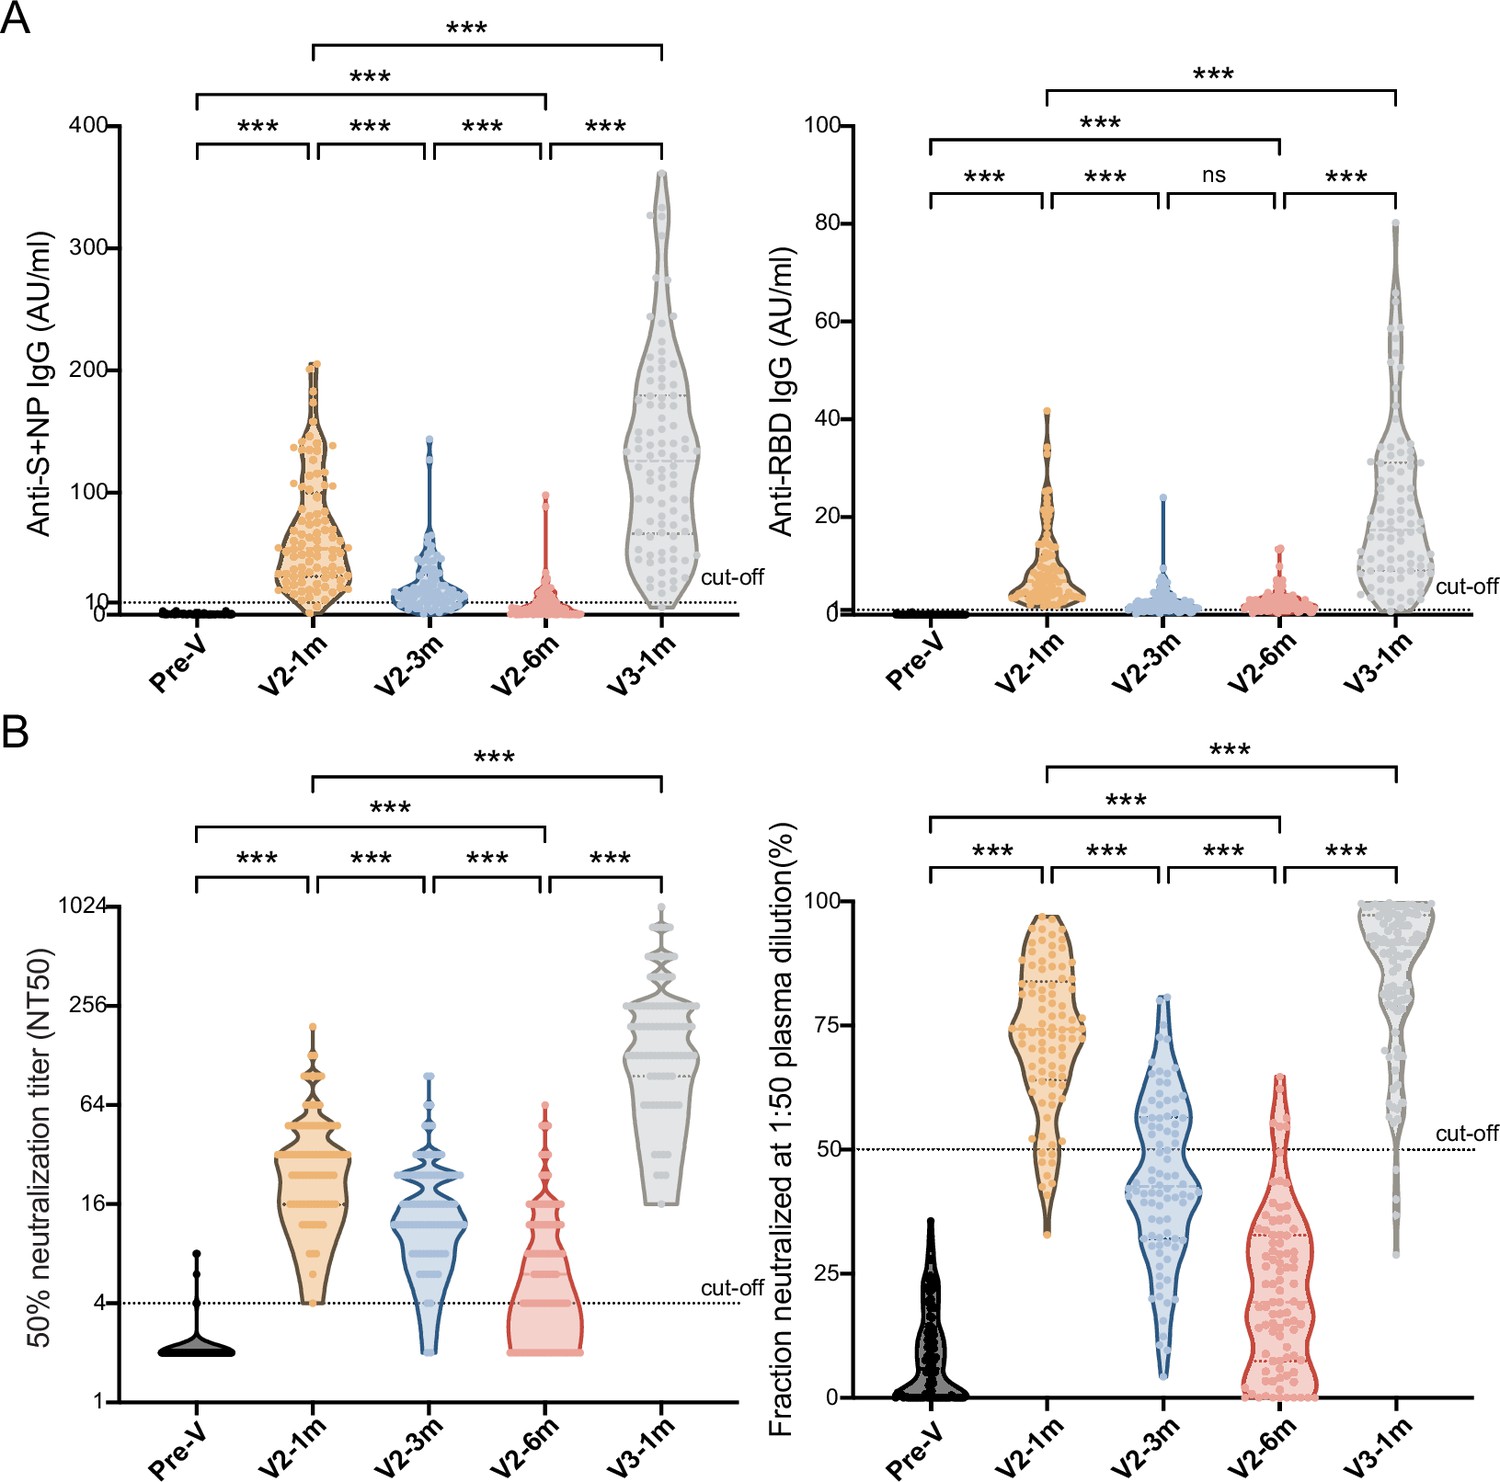
Comparisons of anti-SARS-CoV-2-specific IgG and IgM levels and neutralizing activity before and after booster immunization.
(A, B) Dynamic changes in anti-S/N IgM and IgG (A), GMT of NAb titer, and neutralized fraction (B) in serum samples from CoronaVac-vaccinated participants at V-0, V2-1m, V2-3m, V2-6m, and V3-1m. One-way analysis of variance was used for comparison. Two-tailed P values were calculated. ns, not significant, * p< 0.05, **p < 0.01, ***p < 0.001.
-
Figure 4—source data 1
Comparisons of anti-SARS-CoV-2-specific IgG and IgM levels and neutralizing activity before and after booster immunization.
- https://cdn.elifesciences.org/articles/84056/elife-84056-fig4-data1-v2.xlsx
Figure 5

Antibody responses to Delta and Omicron variants.
Neutralized fraction of Wuhan strain, Delta (B.1.617.2), and Omicron (B.1.1.529) variants for CoronaVac primary- and booster-vaccinated participants, as evaluated by pseudovirus-based neutralization test. The paired Student’s t-test and one-way analysis of variance were used for comparison. Two-tailed p values were calculated. * p<0.05, **p<0.01, ***p<0.001.
-
Figure 5—source data 1
Antibody responses to Delta and Omicron variants.
- https://cdn.elifesciences.org/articles/84056/elife-84056-fig5-data1-v2.xlsx
Tables
Table 1
Baseline characteristics and anti-S/N antibody levels in the cross-sectional study.
| V-0N=91 | V1-14dN=125 | V1-28dN=91 | V2-1mN=100 | V2-3mN=110 | V2-6mN=160 | V2-9mN=190 | V2-12mN=200 | |
|---|---|---|---|---|---|---|---|---|
| Median age (IQR), years | 38(31,47) | 39(34,47) | 38(31,47) | 40(32,50) | 41(33,55) | 41(31,48) | 41(31,48) | 41(34,49) |
| Sex | ||||||||
| Male | 37 | 45 | 37 | 49 | 54 | 80 | 85 | 75 |
| Female | 54 | 80 | 54 | 51 | 56 | 80 | 105 | 125 |
| IgM | ||||||||
| Concentration (AU/ml) | 0.4±0.02 | 5.1±1.0 | 5.1±0.9 | 1.4±0.2 | 0.4±0.1 | 0.3±0.04 | 0.3±0.04 | 0.2±0.03 |
| Seropositivity (%) | 3.3 | 57.6 | 75.8 | 33.0 | 3.6 | 4.4 | 4.7 | 2.0 |
| IgG | ||||||||
| Concentration (AU/ml) | 0.6±0.1 | 3.7±0.5 | 64.3±5.8 | 79.7±5.7 | 29.4±2.4 | 10.5±0.9 | 8.9±1.0 | 6.8±0.9 |
| Seropositivity (%) | 0.0 | 7.2 | 97.8 | 97.0 | 88.2 | 32.5 | 22.1 | 13.5 |
-
Data are n (%) or median (IQR), or mean ± SEM. The seropositivity rate is when positive concentration of anti-S/N antibody is 10.0 AU/mL (IgG) and ≥1.0 AU/mL (IgM) or more.
-
Table 1—source data 1
Baseline characteristics and anti-S/N antibody levels in the cross-sectional study.
- https://cdn.elifesciences.org/articles/84056/elife-84056-table1-data1-v2.xlsx
Table 2
Baseline characteristics for the prospective cohort.
| N=90 | P (%) | |
|---|---|---|
| Age group (years) | ||
| 18–44 | 28 | 31.1 |
| 45–64 | 21 | 23.3 |
| 65–80 | 41 | 45.6 |
| Sex | ||
| Male | 40 | 44.4 |
| Female | 50 | 55.6 |
| BMI (kg/m2) | ||
| <18.5 | 3 | 3.3 |
| 18.5–23.9 | 57 | 63.4 |
| ≥24 | 30 | 33.3 |
| Chronic conditions | ||
| Yes | 30 | 33.3 |
| No | 60 | 66.7 |
-
Table 2—source data 1
Baseline characteristics for the prospective cohort.
- https://cdn.elifesciences.org/articles/84056/elife-84056-table2-data1-v2.xlsx
Table 3
The influence of age to GMT and Seropositivity.
| Time point | Statistic | Total | 18–44 years | 45–64 years | ≥65 years | p |
|---|---|---|---|---|---|---|
| Pre-V | GMT | 2.1 | 2.2 | 2.1 | 2.1 | 0.908 |
| 95% CI | 2.0–2.2 | 1.9–2.4 | 1.9–2.4 | 2.0–2.3 | ||
| Seropositivity (%) | 3.3 | 3.6 | 4.8 | 2.4 | ||
| V2-1m | GMT | 29.4 | 33.2 | 36.8 | 24.3 | 0.019 |
| 95% CI | 23.5–24.2 | 25.3–43.4 | 24.3–55.7 | 20.0–29.5 | ||
| Seropositivity (%) | 98.9 | 100 | 95.2 | 100 | ||
| V2-3m | GMT | 15.5 | 22.9 | 16.0 | 11.5 | <0.01 |
| 95% CI | 13.3–18.0 | 17.0–30.9 | 12.5–20.5 | 9.4–14.2 | ||
| Seropositivity (%) | 95.5 | 100 | 95.2 | 92.7 | ||
| V2-6m | GMT | 6.6 | 10.2 | 7.9 | 4.4 | <0.01 |
| 95% CI | 5.4–8.0 | 7.0–14.7 | 5.1–12.3 | 3.5–5.7 | ||
| Seropositivity (%) | 57.8 | 82.1 | 66.7 | 35.6 | ||
| V3-1m | GMT | 168.2 | 217.2 | 152.3 | 148.7 | 0.369 |
| 95% CI | 139.7–202.6 | 165.7–287.7 | 97.3–238.5 | 110.7–199.7 | ||
| Seropositivity (%) | 100.0 | 100 | 100 | 100 |
-
The seropositivity rate is when positive NT50 is above 1:4.
-
GMT, geometric mean titers.
Additional files
-
Supplementary file 1
Supplementary tables for supplemental instruction.
Table S1 Baseline characteristics for the cross-sectional survey; Table S2 Correspondence of neutralized fraction (%) and serum dilution; Table S3 The influence of sex, BMI, and chronic condition to GMT and Seropositivity.
- https://cdn.elifesciences.org/articles/84056/elife-84056-supp1-v2.docx
-
Supplementary file 2
Statistical analysis.
- https://cdn.elifesciences.org/articles/84056/elife-84056-supp2-v2.docx
-
MDAR checklist
- https://cdn.elifesciences.org/articles/84056/elife-84056-mdarchecklist1-v2.pdf
Download links
A two-part list of links to download the article, or parts of the article, in various formats.
Downloads (link to download the article as PDF)
Open citations (links to open the citations from this article in various online reference manager services)
Cite this article (links to download the citations from this article in formats compatible with various reference manager tools)
Evaluation of antibody kinetics and durability in healthy individuals vaccinated with inactivated COVID-19 vaccine (CoronaVac): A cross-sectional and cohort study in Zhejiang, China
eLife 12:e84056.
https://doi.org/10.7554/eLife.84056


