BUB-1 and CENP-C recruit PLK-1 to control chromosome alignment and segregation during meiosis I in C. elegans oocytes
- Centre for Gene Regulation and Expression, Sir James Black Centre, School of Life Sciences, University of Dundee, United Kingdom
- Ludwig Institute for Cancer Research, San Diego Branch, United States
- Wellcome Centre for Cell Biology & Institute of Cell Biology, School of Biological Sciences, University of Edinburgh, United Kingdom
Figures
Figure 1 with 3 supplements

Analysis of PLK-1 localisation and inhibition during meiosis I.
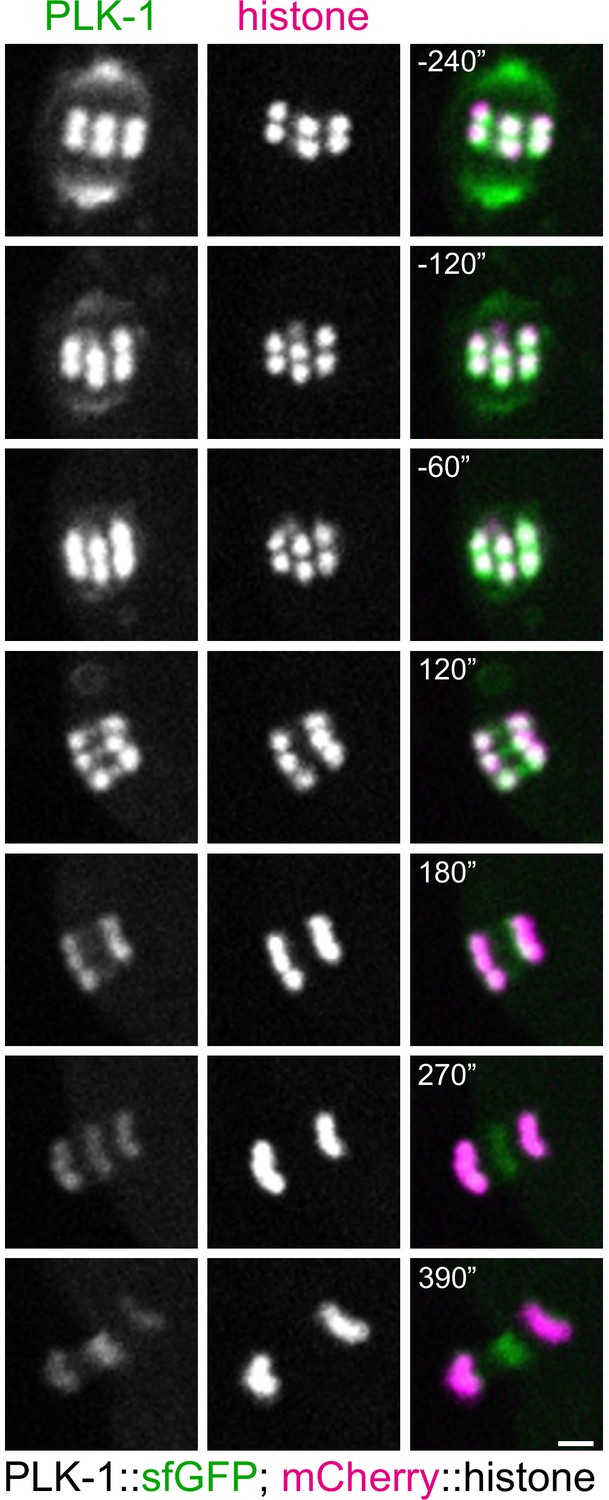
(A) Schematic of a C. elegans bivalent, highlighting the midbivalent and kinetochore. (B) Immunostaining of (untagged) PLK-1 in fixed oocytes. The insets represent a magnified image of single bivalents for each channel. Scale bar, 2 µm. (C) In situ GFP-tagged PLK-1 (Martino et al., 2017) was followed through meiosis I in live, dissected oocytes. More detailed sequence of events are displayed in Figure 1—figure supplement 1. Yellow arrows point to chromosomes, blue arrows indicate spindle poles, magenta arrows point towards the midbivalent, and green arrow indicates the central spindle. Scale bars, 2 µm and 1 µm (in zoomed-in bivalents). (D) Schematic of the last two maturing oocytes and the fertilised egg, highlighting the difference between PLK-1 depletion and acute PLK-1 inhibition. (E) plk-1as worms expressing GFP-tagged tubulin and mCherry-tagged histone were dissected in medium containing ethanol (‘EtOH’, control) or the PP1 analogue 3IB-PP1 (10 µM). Yellow arrows point to the each of the six bivalents. Scale bar, 2 µm. (F) plk-1as worms expressing GFP-tagged tubulin and mCherry-tagged histone were dissected in medium containing ethanol (‘EtOH’, control) or 0.1 µM PP1 analogue 3IB-PP1. Scale bar, 2 µm. The panels on the right show specific Z slices to highlight individual chromosomes. Yellow arrows point to misaligned chromosomes contained within the spindle, whereas blue arrows indicate chromosomes outside the spindle. See also Figure 1—figure supplement 3. (G) Chromosome alignment defects scored for 1 µM 3IB-PP1-treated oocytes are presented in the graph. (H) Worms expressing GFP-tagged ASPM-1 (pole marker) and mCherry-tagged histone along with analogue-sensitive plk-1 were dissected in medium containing ethanol (‘EtOH’, control) or the PP1 analogue 3IB-PP1 at 1 µM or 10 µM. Scale bar, 2 µm. Early metaphase I spindles are shown for each condition. Cyan arrows point to spindle poles whereas yellow arrows indicate misaligned chromosomes.
Figure 1—figure supplement 1
PLK-1 localisation during oocyte meiosis.
In situ GFP-tagged PLK-1 (Martino et al., 2017) was followed through meiosis I in live, dissected oocytes. Scale bar, 2 µm. This panel shows a more detailed sequence of events of the same movie presented in Figure 1B.
Figure 1—figure supplement 2

Embryonic viability assays after PLK-1as inhibition.
Three different PP1 analogues were tested: 3IB-PP1, 3MB-PP1, and 1NA-PP1. Inhibitors were included in the plates at 10, 20, and 50 µM, and worms were then allowed to lay eggs. Viable progeny was assessed 24 and 48 hr later.
-
Figure 1—figure supplement 2—source data 1
Data utilised to generate the graphs in Figure 1—figure supplement 2.
- https://cdn.elifesciences.org/articles/84057/elife-84057-fig1-figsupp2-data1-v2.xlsx
Figure 1—figure supplement 3

Chromosome alignment defects upon acute PLK-1as inhibition.
(A) Wild type or plk-1as worms expressing GFP-tagged tubulin and mCherry-tagged histone were dissected in medium containing 1 µM 3IB-PP1 (‘low’) or 10 µM (‘high’). Maximum intensity projections are shown, and the arrows have different colours to identify those chromosomes in panel (B). Scale bar, 2 µm. (B) Detailed analysis of individual chromosome behaviour using selected Z slices of +3IB-PP1 ‘low’ from panel (A). Highly unstable behaviour of specific chromosomes (switching back and forth between aligned and misaligned) can be followed by the different coloured arrows. Panels outside of the green rectangle are time points not shown in (A). Time between frames is 20 s. Scale bar, 2 µm.
Figure 2 with 1 supplement
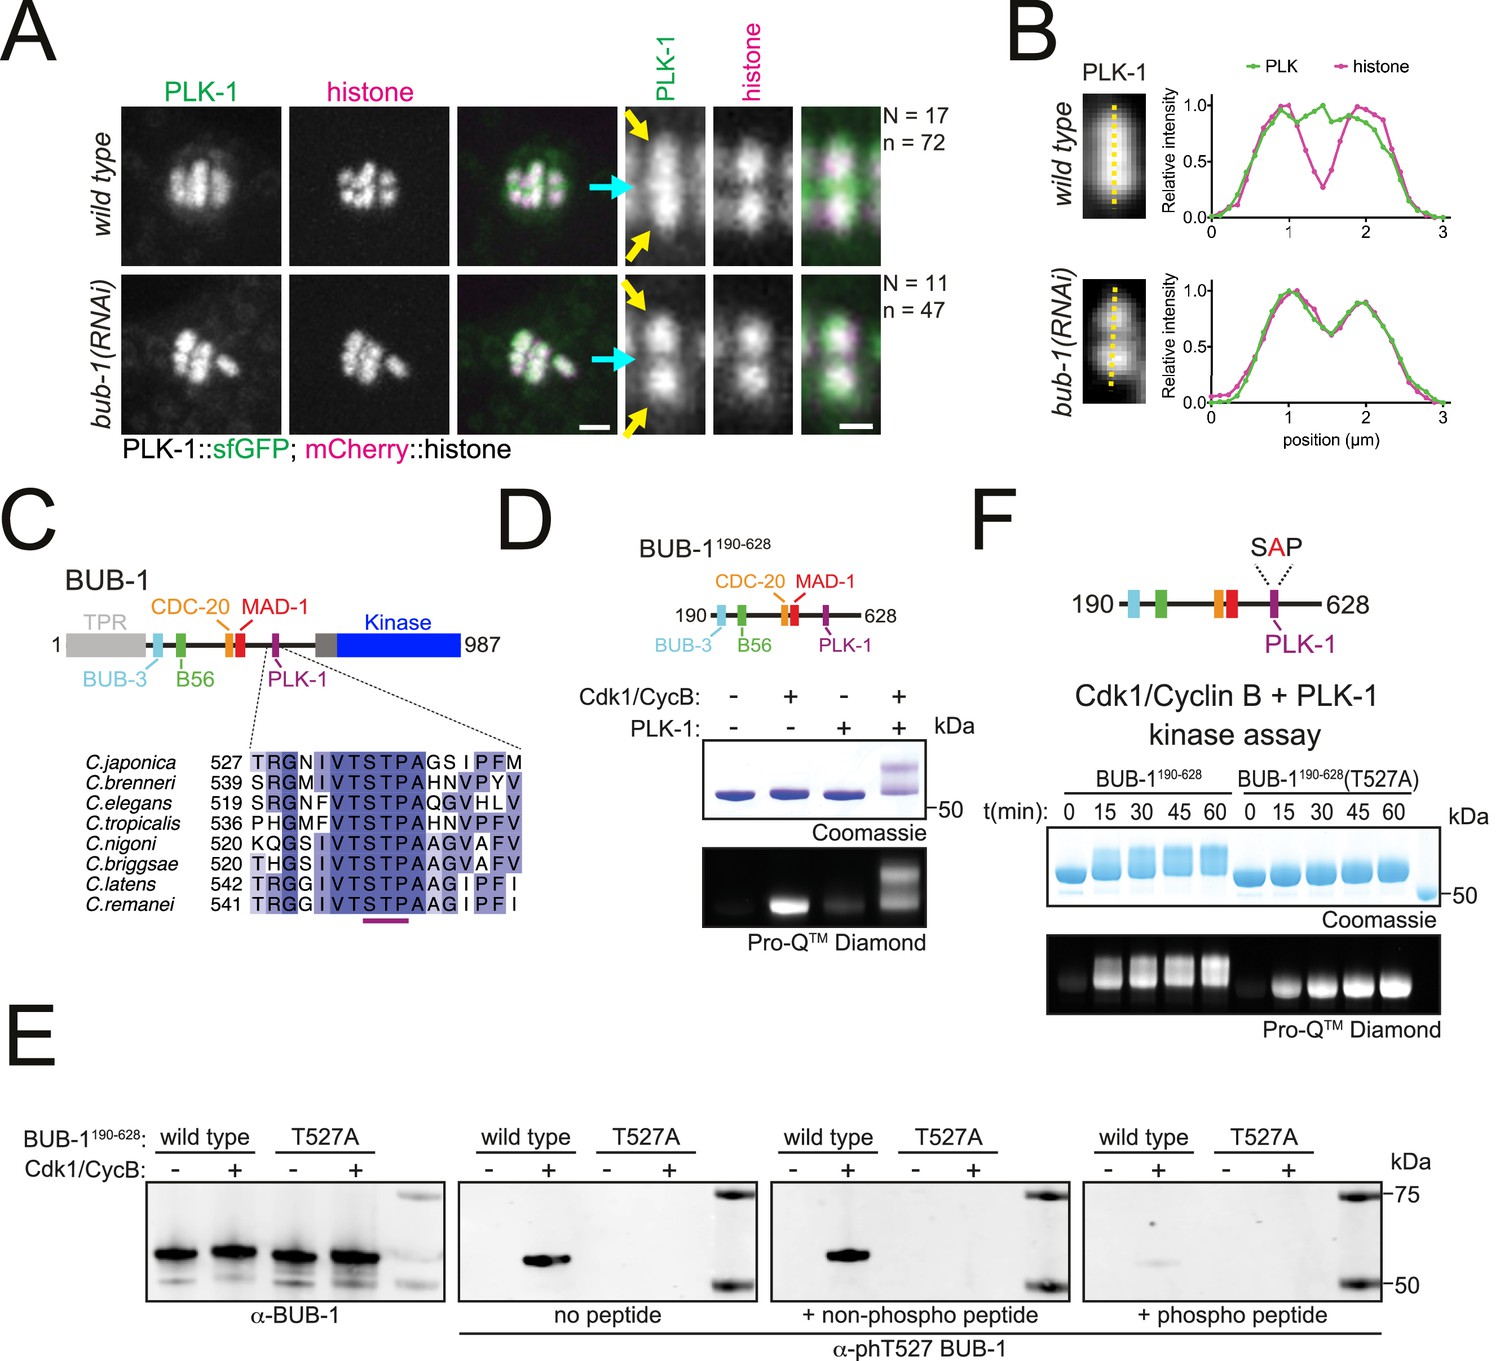
BUB-1 contains a putative STP motif and regulates PLK-1 localisation in vivo.
(A) Control (‘wild type’) and BUB-1-depleted [‘bub-1(RNAi)’] oocytes expressing sfGFP-tagged PLK-1 (and mCherry-tagged histone) were dissected and recorded throughout meiosis I. Prometaphase/metaphase I is shown (before spindle rotation/shortening). The cyan arrows point to the midbivalent, and the yellow arrows point to the chromosome arms. 'N’ and ‘n’ denote the number of oocytes and bivalents analysed, respectively. Left scale bar, 2 µm. Right scale bar, 1 µm. (B) Line profile analysis of PLK-1::sfGFP during prometaphase I in wild type and bub-1(RNAi) oocytes, as indicated by the yellow lines. Background signal was subtracted, and maximum signal for each channel was set to 1. (C) Schematic representation of the C. elegans BUB-1 protein (top) and sequence alignment of the putative STP motif in nematode species (bottom). (D) (top) Schematic of BUB-1190-628 (bottom) kinase assay of recombinant BUB-1190-628 with Cdk1/Cyclin B, PLK-1, and both kinases combined as indicated. Phosphorylation was assessed using SDS-PAGE followed by Coomassie (total protein) or ProQ diamond (phosphoprotein) staining. (E) Western blot of recombinant BUB-1190-628 Cdk1/Cyclin B kinase assays incubated with either α-BUB-1 or α-phT527 BUB-1 antibodies. To ensure specificity, α-phT527 BUB-1 antibody was incubated alone or together with an unphosphorylated or phT527 BUB-1 STP motif peptide, respectively. (F) (top) Schematic of BUB-1190-628(T527A) (bottom) kinase assay of recombinant BUB-1190-628 and BUB-1190-628(T527A) with Cdk1/Cyclin B and PLK-1 combined. Proteins were incubated with the kinases for the indicated time points before phosphorylation was assessed by SDS-PAGE and staining with either Coomassie (total protein) or ProQ diamond (phosphoprotein).
-
Figure 2—source data 1
Gel/blot images for data presented in Figure 2.
(A) Full gel images corresponding to the kinase assays shown in Figure 2D. Top gels were stained with Coomassie (total protein) after the scan for ProQ Diamond (phosphoprotein) was performed. The region marked by the dotted line shows the portion shown in the main figure. (B) Full blots for the portions shown in Figure 2E, corresponding to Cdk1/Cyclin B kinase assays using wild type or T527A mutant BUB fragment (190-628). Total BUB-1 and phT527-specific antibodies were used. The region marked by the dotted line shows the portion shown in the main figure. (C) Full gel images corresponding to the Cdk1/Cyclin B-PLK-1 kinase assays using wild type or T527A mutant BUB-1 fragment (190-628), shown in Figure 2F. Top: image of the gel stained with Coomassie (total protein) after the scan for ProQ Diamond (phosphoprotein), shown in the bottom, was performed. The region marked by the dotted line shows the portion shown in the main figure.
- https://cdn.elifesciences.org/articles/84057/elife-84057-fig2-data1-v2.zip
Figure 2—figure supplement 1

BUB-1 phosphorylation by Cdk1 and PLK-1 in vitro.
(A) Kinase assay of recombinant BUB-1190-628 and BUB-1190-628(T527A) with Cdk1/Cyclin B. Proteins were incubated with Cdk1:Cyclin B for the indicated time points before phosphorylation was assessed by SDS-PAGE and staining with either Coomassie (total protein) or ProQ diamond (phosphoprotein). (B) Kinase assay of recombinant BUB-1190-628 and BUB-1190-628(T527A) with PLK-1. Proteins were incubated with PLK-1 for the indicated time points before phosphorylation was assessed by SDS-PAGE and staining with either Coomassie (total protein) or ProQ diamond (phosphoprotein).
-
Figure 2—figure supplement 1—source data 1
Gel scan images for data presented in Figure 2—figure supplement 1.
(A) Full gel images corresponding to the Cdk1/Cyclin B kinase assay shown in Figure 2—figure supplement 1A. Top gels were stained with Coomassie (total protein) after the scan for ProQ Diamond (phosphoprotein) was performed (bottom). The region marked by the dotted line shows the portion shown in the main figure. (B) Full gel images corresponding to the PLK-1 kinase assay shown in Figure 2—figure supplement 1B. Top gels were stained with Coomassie (total protein) after the scan for ProQ Diamond (phosphoprotein) was performed (bottom). The region marked by the dotted line shows the portion shown in the main figure.
- https://cdn.elifesciences.org/articles/84057/elife-84057-fig2-figsupp1-data1-v2.zip
Figure 3
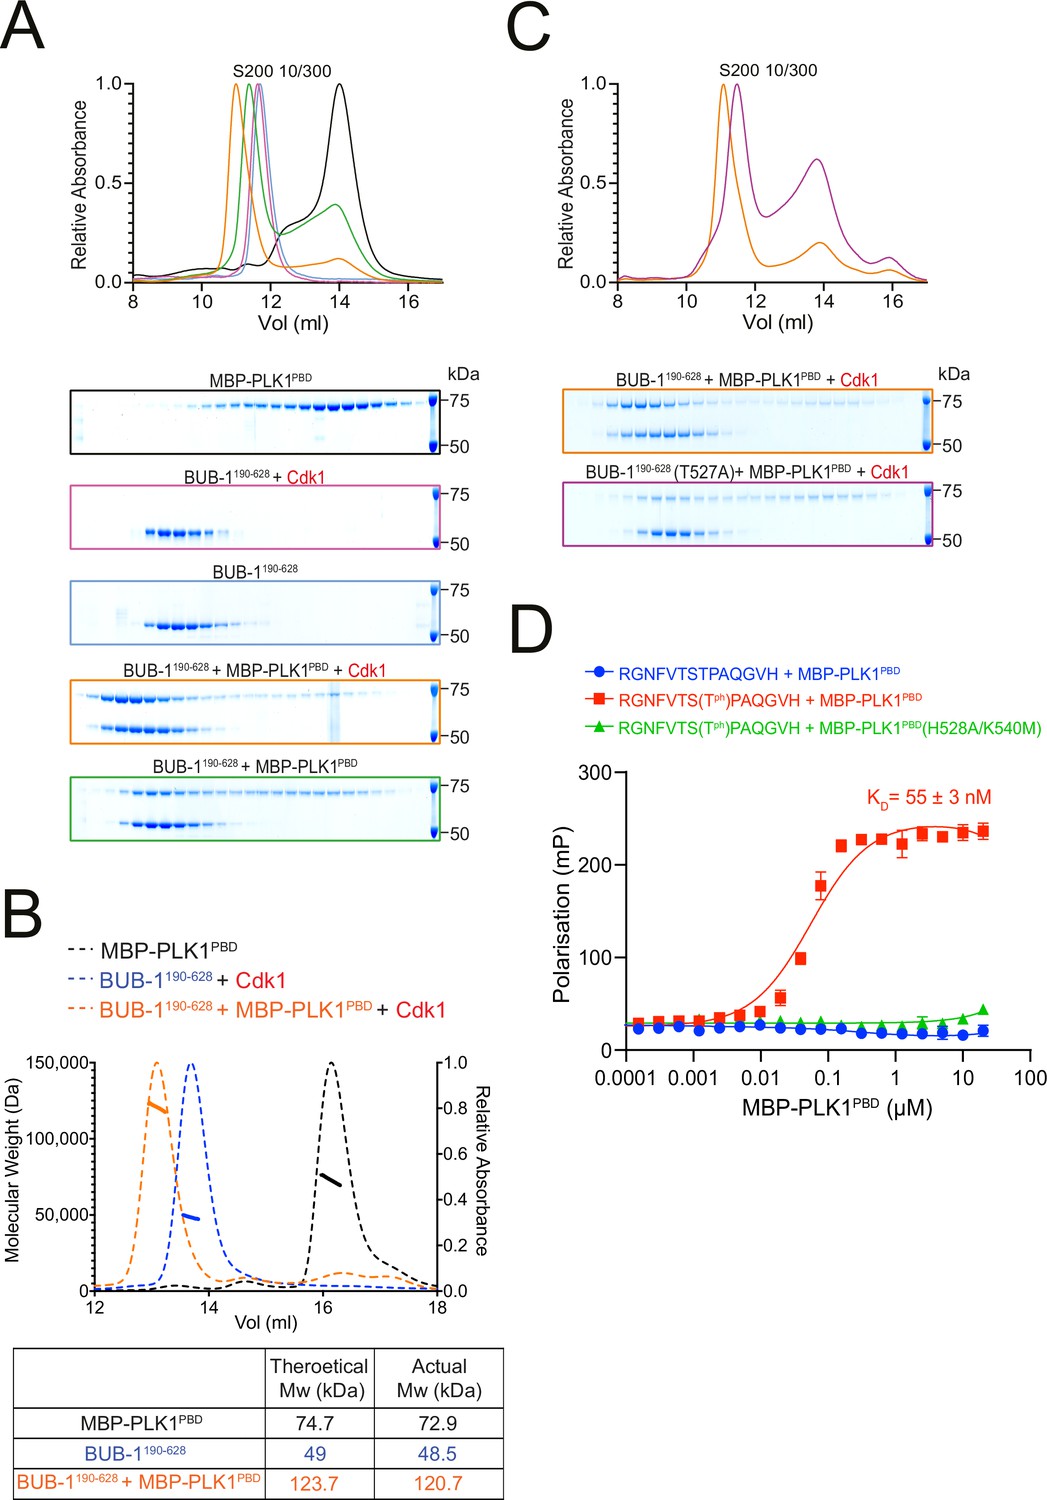
BUB-1 directly binds to PLK1 in vitro via a Cdk1-phosphorylated STP motif.
(A) Elution profile and Coomassie-stained SDS-PAGE gels of representative fractions from the Superdex 200 10/300 SEC column. BUB-1190-628 was incubated with MBP-PLK1PBD at equimolar concentrations before separation by size-exclusion chromatography (SEC). Binding was conducted with unphosphorylated or Cdk1/Cyclin B phosphorylated BUB-1190-628 as indicated. The colours of the gel borders correspond to the colours of the respective elution profile. (B) SEC coupled with multi-angle light scattering (SEC-MALS) analysis of BUB-1190-628 and MBP-PLK1PBD binding indicates a 1:1 complex stoichiometry. Relative absorbance (dotted lines) and molecular weight (solid lines) are colour-coded to match the corresponding proteins. (C) Elution profile and Coomassie-stained SDS-PAGE gels of representative fractions from the Superdex 200 10/300 SEC column. Wild type or T527A mutant BUB-1190-628 was phosphorylated by Cdk1/Cyclin B before incubation with an equimolar concentration of MBP-PLK1PBD, binding was assessed by SEC. The colours of the gel borders correspond to the colours of the respective elution profile. (D) FITC-labelled peptides containing the BUB-1 STP motif were incubated with increasing concentrations of MBP-PLK1PBD or MBP-PLK-1PBD(H538A/K540M) and binding analysed by fluorescence polarisation. ‘TPh’ denotes phosphorylated threonine. The colours of the data points correspond to the colours of the experimental conditions as indicated. Data represents mean of 3 independent experiments with error bars/uncertainties denoting the standard deviation between these.
-
Figure 3—source data 1
Full gel images for data presented in Figure 3.
(A) Full gel images showing the fractions eluted from the size-exclusion chromatography in the different conditions tested in Figure 3A. Gels were stained with Coomassie (total protein), and the region marked by the dotted line shows the portion shown in the main figure. (B) Full gel images showing the fractions eluted from the size-exclusion chromatography in the different conditions tested in Figure 3C. Gels were stained with Coomassie (total protein), and the region marked by the dotted line shows the portion shown in the main figure.
- https://cdn.elifesciences.org/articles/84057/elife-84057-fig3-data1-v2.zip
Figure 4
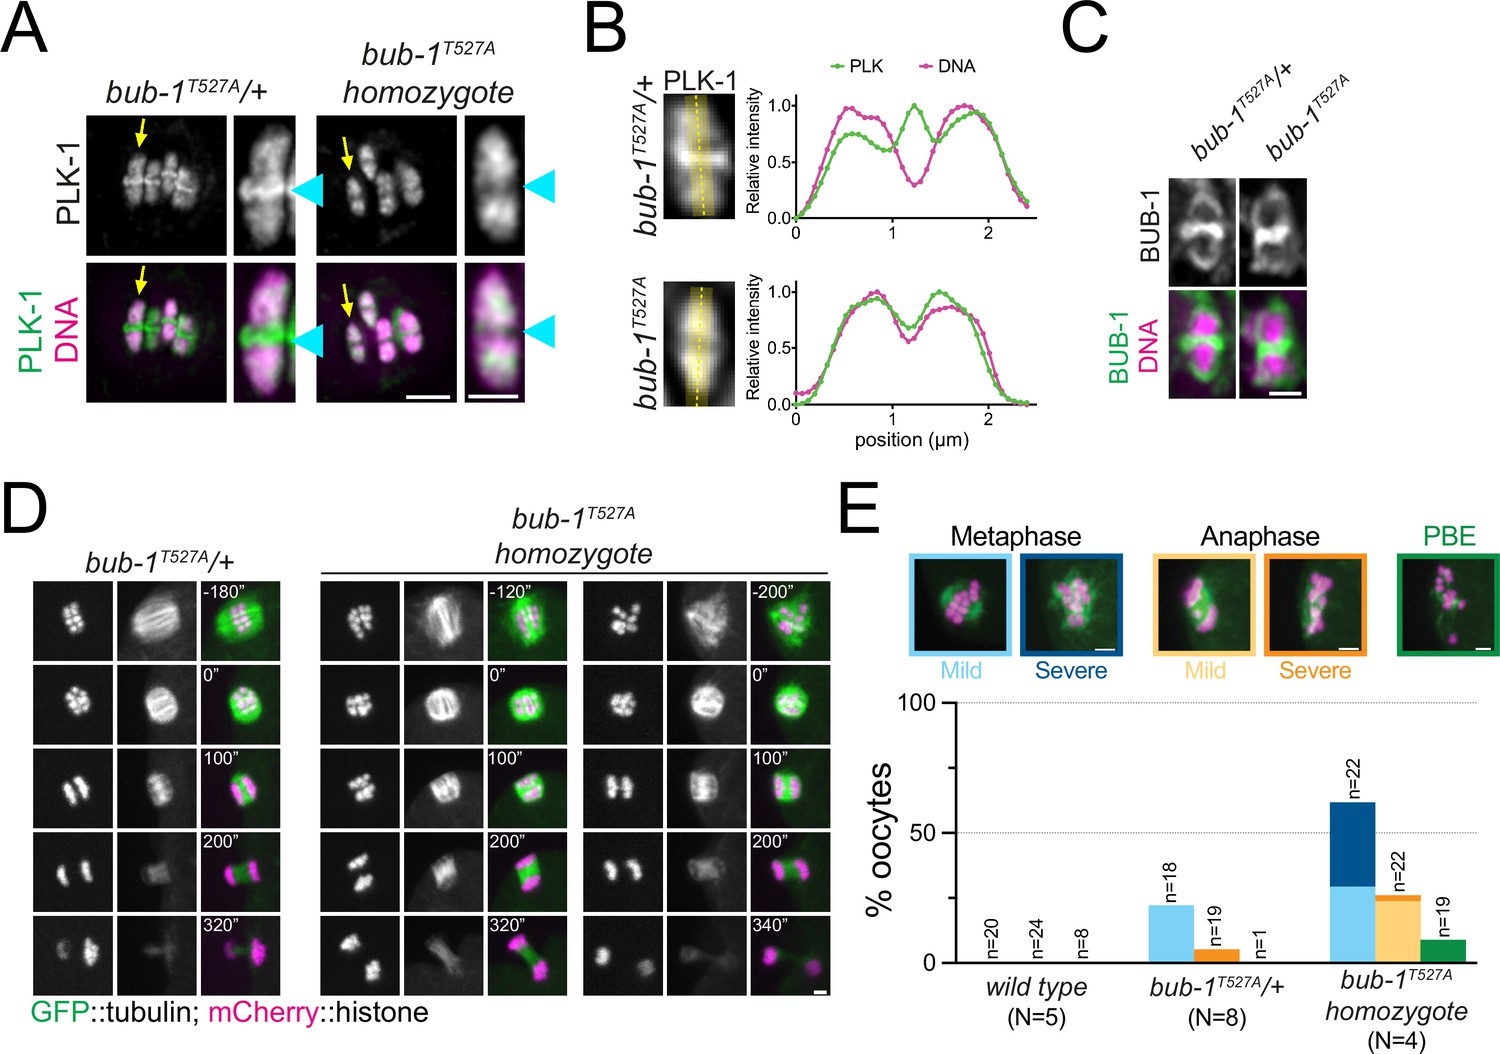
The BUB-1 STP motif is required for PLK-1 targeting and chromosome alignment.
(A) Fixed oocytes were stained with a PLK-1-specific antibody (green), and bub-1T527A heterozygote and homozygote oocytes were compared. DNA is shown in magenta. The yellow arrow points to the midbivalent magnified on the right in each case, and the blue arrowhead points to the midbivalent. Scale bars, 2 µm (left) and 1 µm (right). (B) Line profile analysis of PLK-1 localisation in fixed oocytes during early metaphase I in bub-1T527A heterozygote (‘bub-1T527A/+’) and homozygote (‘bub-1T527A’) oocytes, as indicated by the yellow lines. Background signal was subtracted, and maximum signal for each channel was set to 1. (C) Fixed oocytes were stained with a BUB-1-specific antibody (green), and bub-1T527A heterozygote and homozygote oocytes were compared. DNA is shown in magenta. Scale bar, 1 µm. (D) bub-1T527A heterozygote (‘bub-1T527A/+’) and homozygote (‘bub-1T527A’) oocytes expressing GFP-tagged tubulin and mCherry-tagged histone were filmed during meiosis I. Two homozygote (‘bub-1T527A’) oocytes are shown to depict the difference in severity of the alignment defect. Scale bar, 2 µm. (E) Meiotic defects (as described in the ‘Methods’ section) were assessed in wild type, bub-1T527A heterozygote (‘bub-1T527A/+’) and homozygote oocytes. Representative images of the different phenotypes analysed are presented on top (scale bars, 2 µm). ‘N’ represents the number of experiments, and ‘n’ denotes the number of oocytes analysed.
-
Figure 4—source data 1
Data utilised to generate the graph in Figure 4.
The two tables show the data obtained to generate the graph presented in Figure 4E, as total meiosis analysed (left) and the incidence of each phenotype (right).
- https://cdn.elifesciences.org/articles/84057/elife-84057-fig4-data1-v2.zip
Figure 5 with 1 supplement

CENP-CHCP-4 contains a putative STP motif and is required for chromosomal PLK-1 targeting.
(A) In situ GFP-tagged CENP-CHCP-4 was followed through meiosis I in live, dissected oocytes. Scale bar, 2 µm. (B) Schematic representation of the C. elegans CENP-CHCP-4 (top) and sequence alignment of the putative STP motif in nematode species (bottom). (C) Control (‘wild type’) and CENP-CHCP-4-depleted [‘hcp-4(RNAi)’] oocytes expressing sfGFP-tagged PLK-1 (and mCherry-tagged histone) were dissected and recorded throughout meiosis I. Prometaphase I is shown (before spindle rotation/shortening). On the right, the cyan arrows point to the midbivalent, and the yellow arrow points to the kinetochore. 'N’ and ‘n’ denote the number of oocytes and bivalents analysed, respectively. Left scale bar, 2 µm. Right scale bar, 1 µm. (D) Line profile analysis of PLK-1::sfGFP during early metaphase I in wild type and hcp-4(RNAi) oocytes, as indicated by the yellow lines. Background signal was subtracted, and maximum signal for each channel was set to 1. The blue arrows point to the midbivalent, and the yellow arrow points to the kinetochore. (E) Schematic of recombinant CENP-CHCP-4(1-214) proteins. (F) Kinase assay of recombinant CENP-CHCP-4(1-214) wild type and T163A proteins with Cdk1:Cyclin B. Reactions were analysed by SDS-PAGE followed by ProQ diamond (phosphoprotein) or Coomassie (total protein) staining. (G) Western blot of recombinant CENP-CHCP-4(1-214) Cdk1/Cyclin B kinase assays incubated with either α-HCP-4 or α-phT163 HCP-4 antibodies. To ensure specificity, α-phT163 HCP-4 antibody was incubated alone or together with an unphosphorylated or phT163 HCP-4 STP motif peptide, respectively.
-
Figure 5—source data 1
Gel/blot images for data presented in Figure 5.
(A) Full gel images corresponding to the Cdk1/Cyclin B kinase assays shown in Figure 5F, using wild type or T163A mutant HCP-4 fragment (1-214). Top gels were stained with Coomassie (total protein) after the scan for ProQ Diamond (phosphoprotein) was performed. The region marked by the dotted line shows the portion shown in the main figure. (B) Full blots for the portions shown in Figure 5G, corresponding to Cdk1/Cyclin B kinase assays using wild type or T163A mutant HCP-4 fragment (1-214). Total BUB-1 and phT163-specific antibodies were used. The region marked by the dotted line shows the portion shown in the main figure.
- https://cdn.elifesciences.org/articles/84057/elife-84057-fig5-data1-v2.zip
Figure 5—figure supplement 1
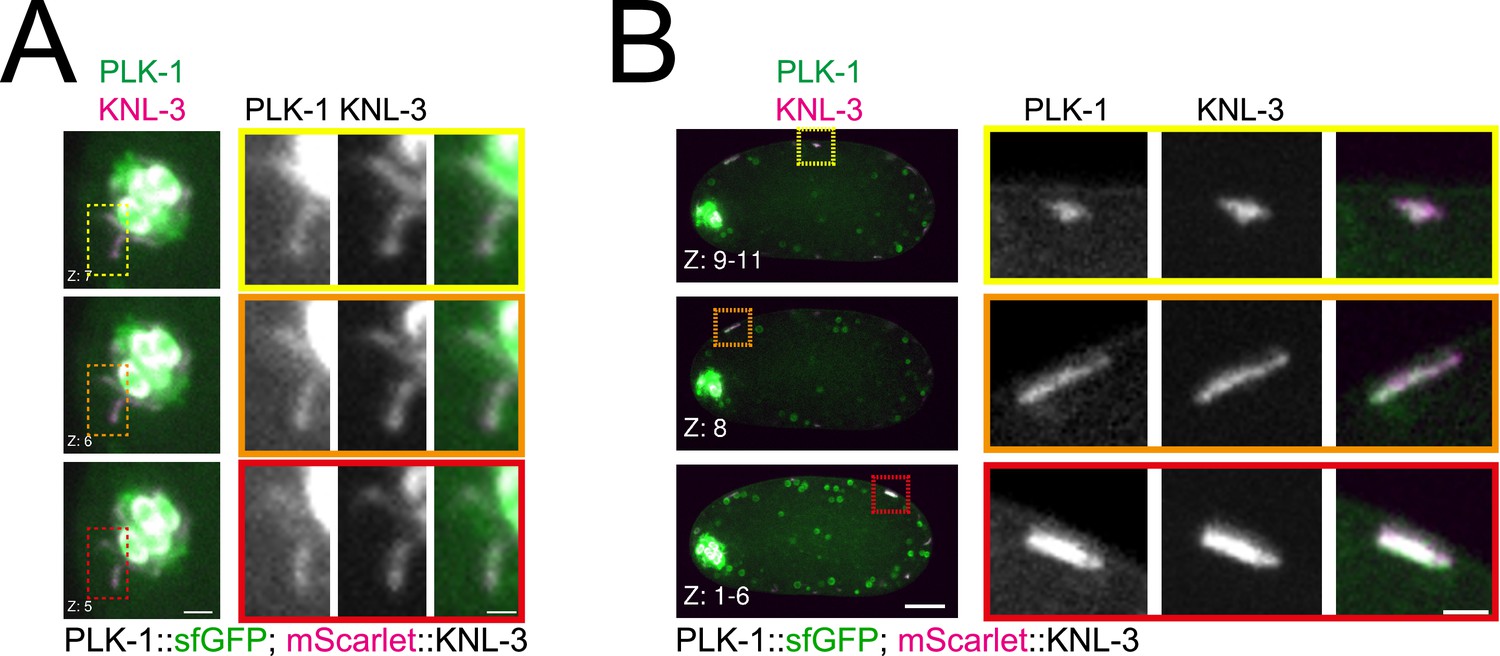
PLK-1 co-localises with the kinetochore component KNL-3 in non-chromosomal kinetochore assemblies.
(A) Oocytes co-expressing sfGFP-tagged PLK-1 and mScarlet-tagged KNL-3 were analysed. The panels show different Z-slices and the panels on the right are higher magnification images of the delineated areas to better visualise the spindle-associated PLK-1 kinetochore localisation. Scale bars, 2 µm (left) and 1 µm (right). (B) Same as in (A), but with detail on the cortical kinetochore assemblies. Scale bars, 10 µm (left) and 2 µm (right).
Figure 6

CENP-CHCP-4 interacts with PLK-1 in vitro in a Cdk1-dependent manner.
(A) Elution profile and Coomassie-stained SDS-PAGE gels of representative fractions from the Superdex 200 10/300 size-exclusion chromatography (SEC) column. CENCP-CHCP-4(1-214) was incubated with MBP-PLK1PBD at equimolar concentrations before being analysed by SEC. Binding was conducted with unphosphorylated or Cdk1:Cyclin B phosphorylated CENP-CHCP-4(1-214) as indicated. The colours of the gel borders correspond to the colours of the respective elution profile. (B) Size-exclusion chromatography coupled with multi-angle light scattering (SEC-MALS) analysis of CENP-CHCP-4(1-214) and MBP-PLK1PBD binding indicates a 1:1 complex stoichiometry. Relative absorbance (dotted lines) and molecular weight (solid lines) are colour-coded to match the corresponding proteins. (C) Elution profile and Coomassie-stained SDS-PAGE gels of representative fractions from the Superdex 200 10/300 SEC column. Wild type or T163A mutant CENP-CHCP-4(1-214) was phosphorylated by Cdk1/Cyclin B before incubation with an equimolar concentration of MBP-PLK1PBD. Binding was then assessed by SEC. The colours of the gel borders correspond to the colours of the respective elution profile. (D) FITC-labelled peptides containing the HCP-4 STP motif were incubated with increasing concentrations of MBP-PLK1PBD or MBP-PLK-1PBD(H538A/K540M) and binding analysed by fluorescence polarisation. Unphosphorylated versus T163-phosphorylated (Tph) peptides were compared. The colours of the data points correspond to the colours of the experimental conditions as indicated. Data represents mean of 3 independent experiments with error bars/uncertainties denoting the standard deviation between these.
-
Figure 6—source data 1
Full gel images for data presented in Figure 6.
(A) Full gel images showing the fractions eluted from the size-exclusion chromatography in the different conditions tested in Figure 6A. Gels were stained with Coomassie (total protein), and the region marked by the dotted line shows the portion shown in the main figure. (B) Full gel images showing the fractions eluted from the size-exclusion chromatography in the different conditions tested in Figure 6C. Gels were stained with Coomassie (total protein), and the region marked by the dotted line shows the portion shown in the main figure.
- https://cdn.elifesciences.org/articles/84057/elife-84057-fig6-data1-v2.zip
Figure 7
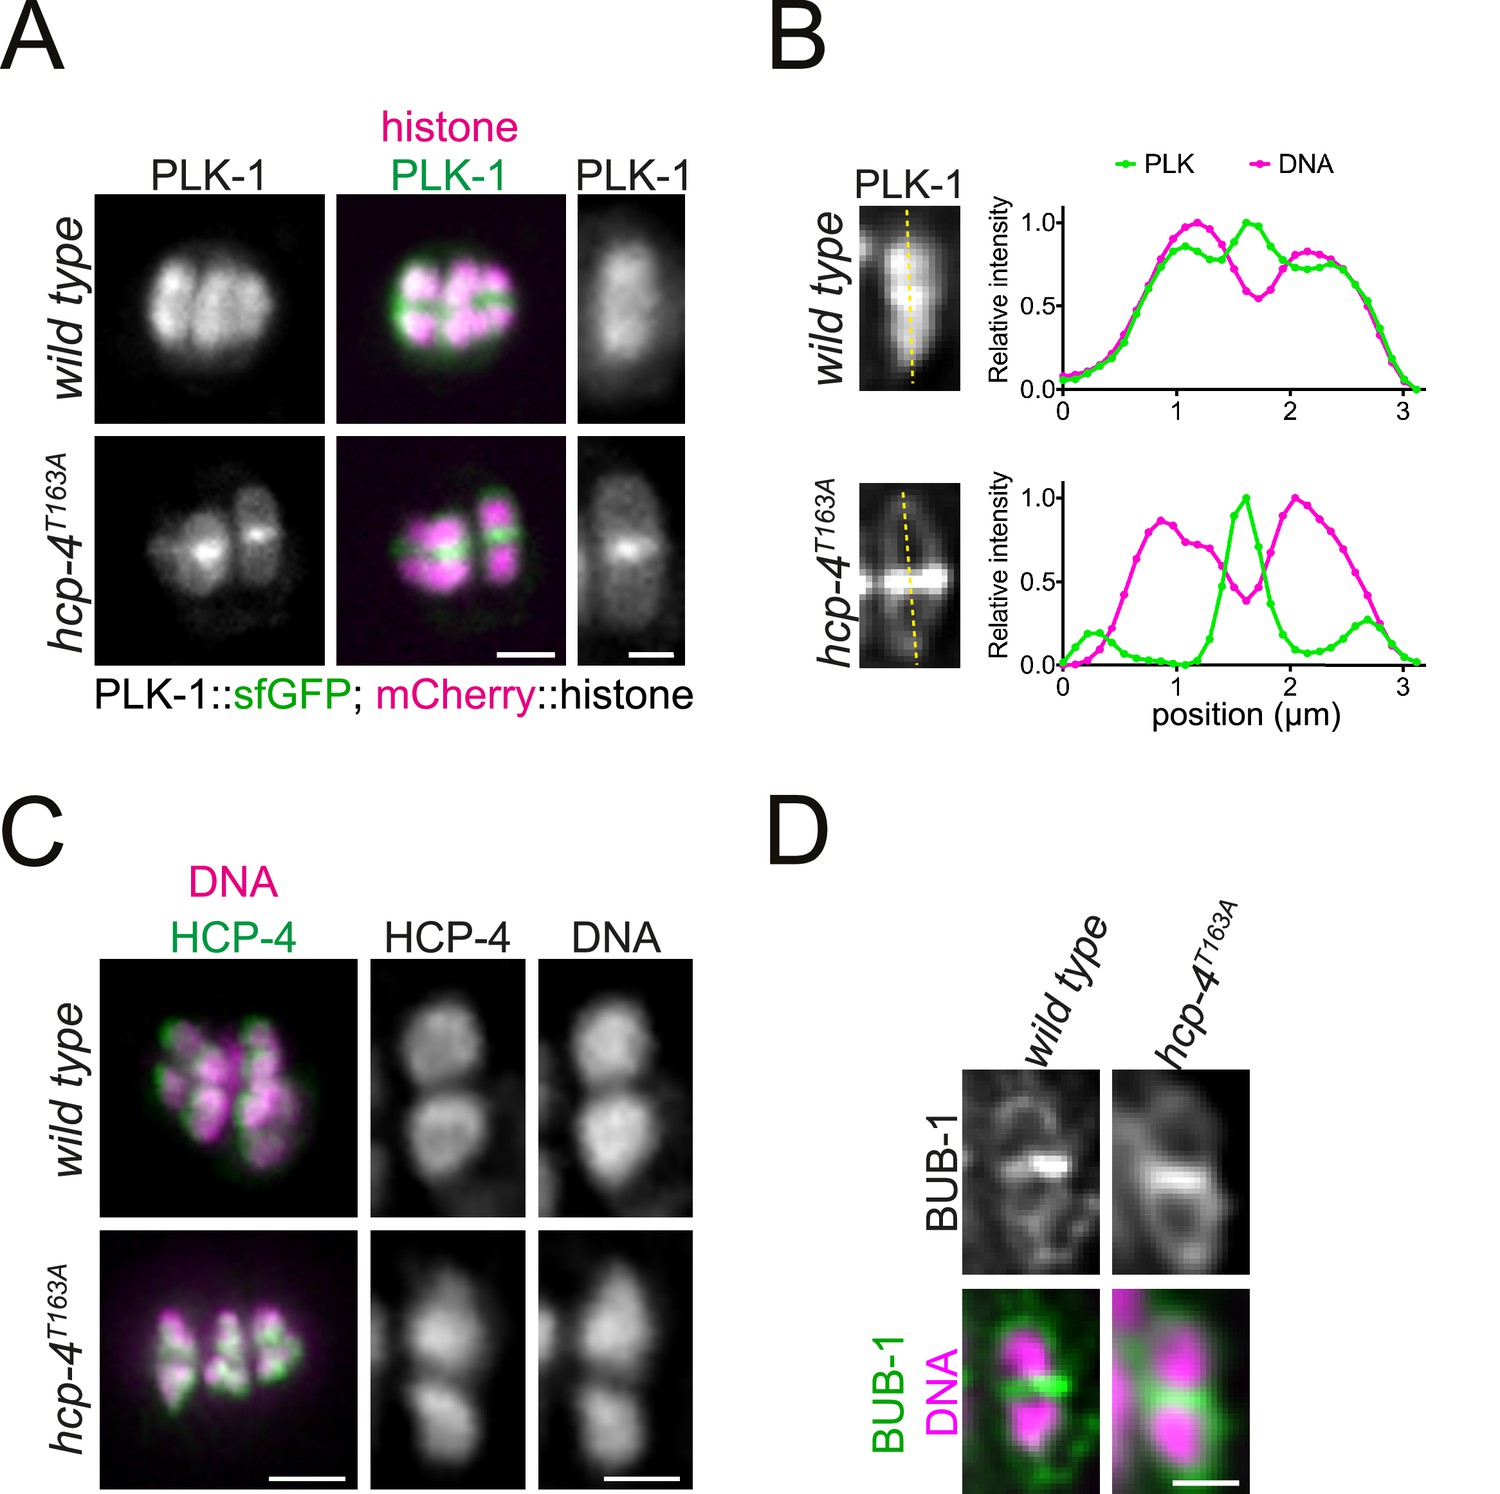
CENP-CHCP-4 directly recruits PLK-1 to chromosome arms.
(A) Control (‘wild type’) and CENP-CHCP-4 STP mutant [‘hcp-4T163A’] oocytes expressing sfGFP-tagged PLK-1 (and mCherry-tagged histone) were dissected and recorded throughout meiosis I. Metaphase I is shown. Left scale bar, 2 µm. Right scale bar, 1 µm. (B) Line profile analysis of PLK-1::sfGFP during early metaphase I in wild type and hcp-4T163A oocytes, as indicated by the yellow lines. Background signal was subtracted, and maximum signal for each channel was set to 1. (C) Fixed oocytes were stained with an HCP-4 specific antibody (green in the merged image). hcp-4T163A mutant oocytes were compared to wild type. DNA is shown in magenta in the merged panel. Scale bar on the left, 2 µm; scale bar on the right, 1 µm. (D) Same as in (C) but using a BUB-1-specific antibody to compare BUB-1 localisation in wild type and hcp-4T163A mutant oocytes. Scale bar, 1 µm.
Figure 8 with 2 supplements
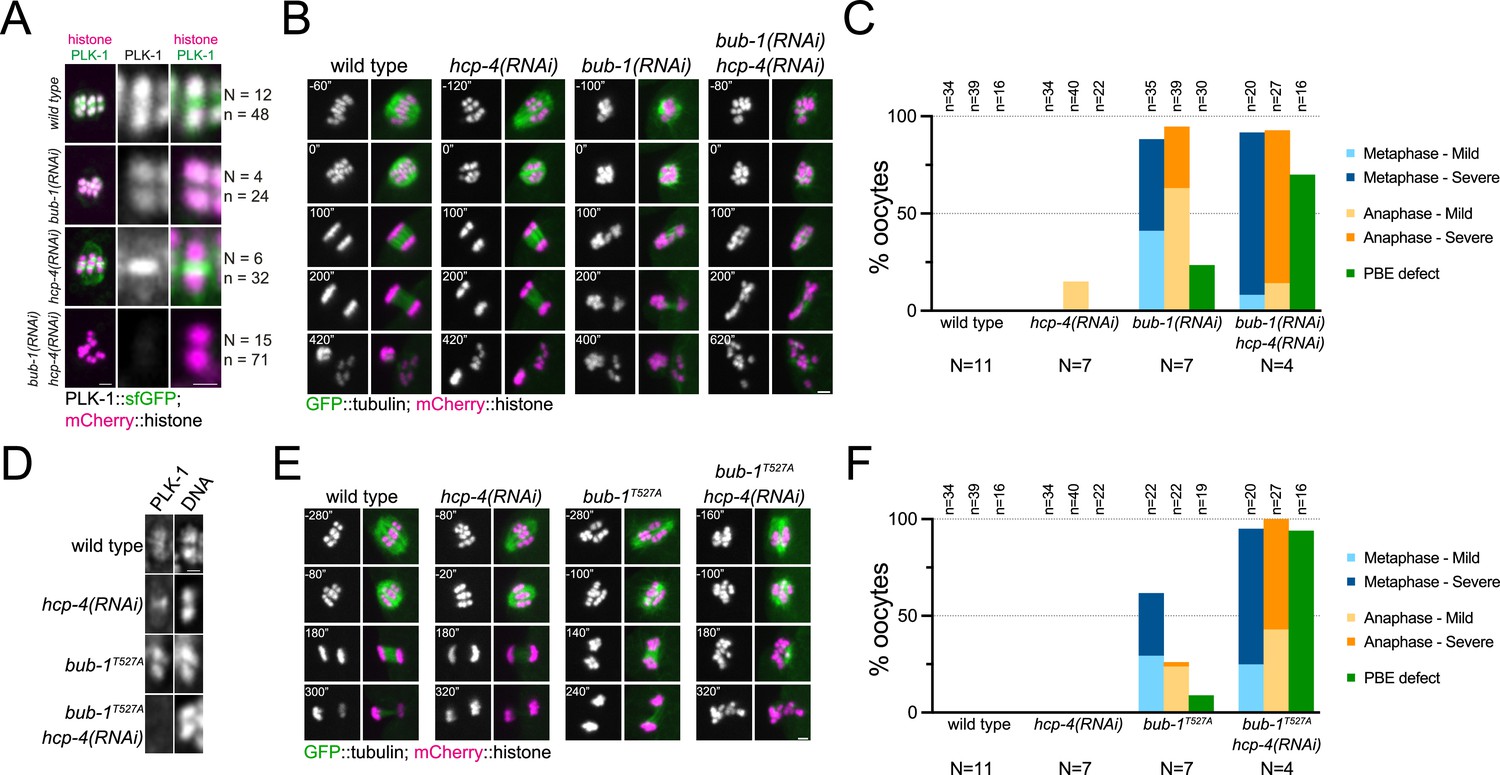
Combined disruption of BUB-1- and CENP-CHCP-4-dependent PLK-1 recruitment leads to severe meiotic defects.
(A) Control (‘wild type’), BUB-1-depleted [‘bub-1(RNAi)’], and CENP-CHCP-4-depleted [‘hcp-4(RNAi)’] oocytes expressing sfGFP-tagged PLK-1 (and mCherry-tagged histone) were dissected and recorded throughout meiosis I. Prometaphase/metaphase I is shown (before spindle rotation/shortening). 'N’ and ‘n’ denote the number of oocytes and bivalents analysed, respectively. Left scale bar, 2 µm. Right scale bar, 1 µm. (B) Control (‘wild type’), BUB-1-depleted [‘bub-1(RNAi)’], and CENP-CHCP-4-depleted [‘hcp-4(RNAi)’] oocytes expressing GFP-tagged tubulin (and mCherry-tagged histone) were dissected and recorded throughout meiosis I. Scale bar, 2 µm. (C) Meiotic defects (as described in the ‘Methods’ section) were assessed in wild type, bub-1(RNAi), and hcp-4(RNAi) oocytes. 'N’ and ‘n’ denote the number of oocytes and bivalents analysed, respectively. (D) Fixed wild type, hcp-4(RNAi), bub-1T527A, and bub-1T527A+hcp-4(RNAi) oocytes were stained with a PLK-1-specific antibody. Scale bar, 1 µm. (E) Control (‘wild type’), BUB-1T527A [‘bub-1T527A’], and CENP-CHCP-4-depleted [‘hcp-4(RNAi)’] oocytes expressing GFP-tagged tubulin (and mCherry-tagged histone) were dissected and recorded throughout meiosis I. Scale bar, 2 µm. (F) Meiotic defects (as described in the ‘Methods’ section) were assessed in wild type, bub-1T527A, hcp-4(RNAi), and bub-1T527A+hcp-4(RNAi) oocytes. 'N’ and ‘n’ denote the number of oocytes and bivalents analysed, respectively.
-
Figure 8—source data 1
Data utilised to generate the graph in Figure 8C.
The two tables show the data obtained to generate the graph presented in Figure 8C, as total meiosis analysed (left) and the incidence of each phenotype (right).
- https://cdn.elifesciences.org/articles/84057/elife-84057-fig8-data1-v2.zip
-
Figure 8—source data 2
Data utilised to generate the graph in Figure 8F.
The two tables show the data obtained to generate the graph presented in Figure 8F, as total meiosis analysed (left) and the incidence of each phenotype (right).
- https://cdn.elifesciences.org/articles/84057/elife-84057-fig8-data2-v2.docx
Figure 8—figure supplement 1
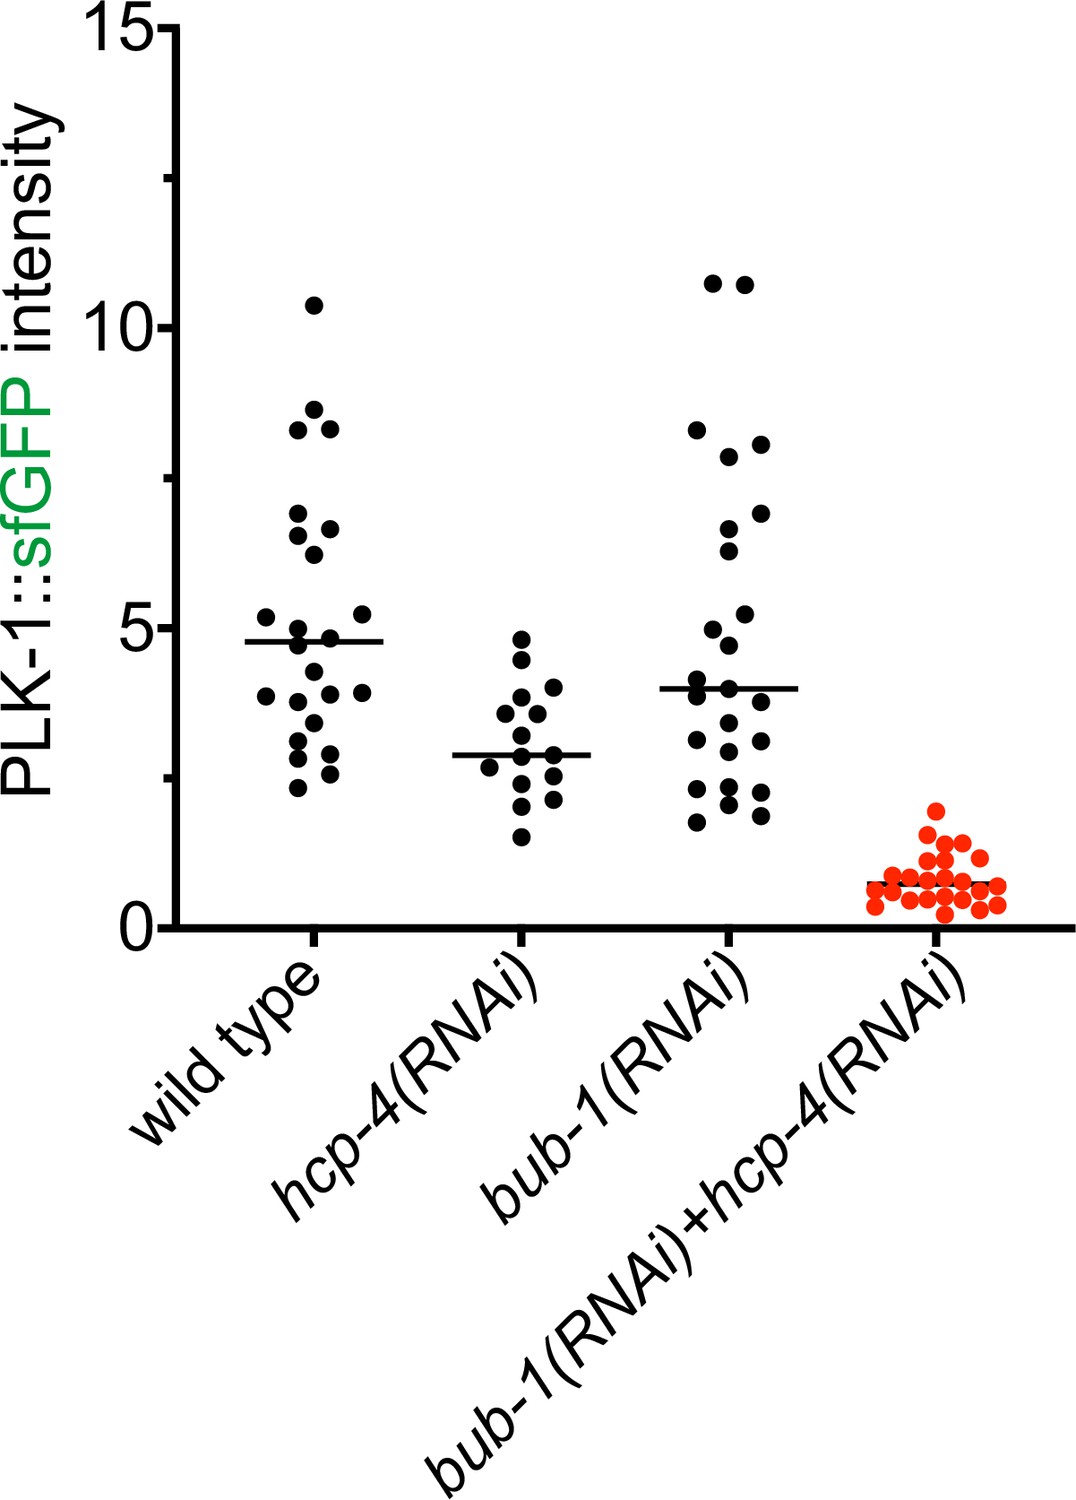
PLK-1 intensity measurements.
Chromosome-associated PLK-1 intensity was measured (relative to background). The graph shows the individual values (circles) along with the median of the population (horizontal black lines).
-
Figure 8—figure supplement 1—source data 1
Data utilised to generate the graph in Figure 8—figure supplement 1, along with the statistical analysis.
- https://cdn.elifesciences.org/articles/84057/elife-84057-fig8-figsupp1-data1-v2.xlsx
Figure 8—figure supplement 2
Combined disruption of BUB-1- and CENP-CHCP-4-dependent PLK-1 recruitment leads to severe meiotic defects.
(A) Control (‘wild type’), BUB-1-depleted [‘bub-1(RNAi)’], CENP-CHCP-4(T163A) [‘hcp-4T163A’], and bub-1(RNAi)+hcp-4T163A oocytes expressing sfGFP-tagged PLK-1 (and mCherry-tagged histone) were dissected and recorded throughout meiosis I. Prometaphase/metaphase I is shown (before spindle rotation/shortening). Panels on the left show the full spindle, while the right-most two columns display single bivalents. Left scale bar, 2 µm. Right scale bar, 1 µm. 'N’ and ‘n’ denote the number of oocytes and bivalents analysed, respectively. (B) Control (‘wild type’), BUB-1-depleted [‘bub-1(RNAi)’], CENP-CHCP-4(T163A) [‘hcp-4T163A’], and bub-1(RNAi)+hcp-4T163A oocytes expressing GFP-tagged tubulin (and mCherry-tagged histone) were dissected and recorded throughout meiosis I. Scale bar, 2 µm. (C) Meiotic defects (as described in the ‘Methods’ section) were assessed in wild type, bub-1(RNAi), hcp-4T163A, and bub-1(RNAi)+hcp-4T163A oocytes. 'N’ and ‘n’ denote the number of oocytes and bivalents analysed, respectively.
-
Figure 8—figure supplement 2—source data 1
Data utilised to generate the graph in Figure 8—figure supplement 2.
The two tables show the data obtained to generate the graph presented in Figure 8—figure supplement 2C, as total meiosis analysed (left) and the incidence of each phenotype (right).
- https://cdn.elifesciences.org/articles/84057/elife-84057-fig8-figsupp2-data1-v2.docx
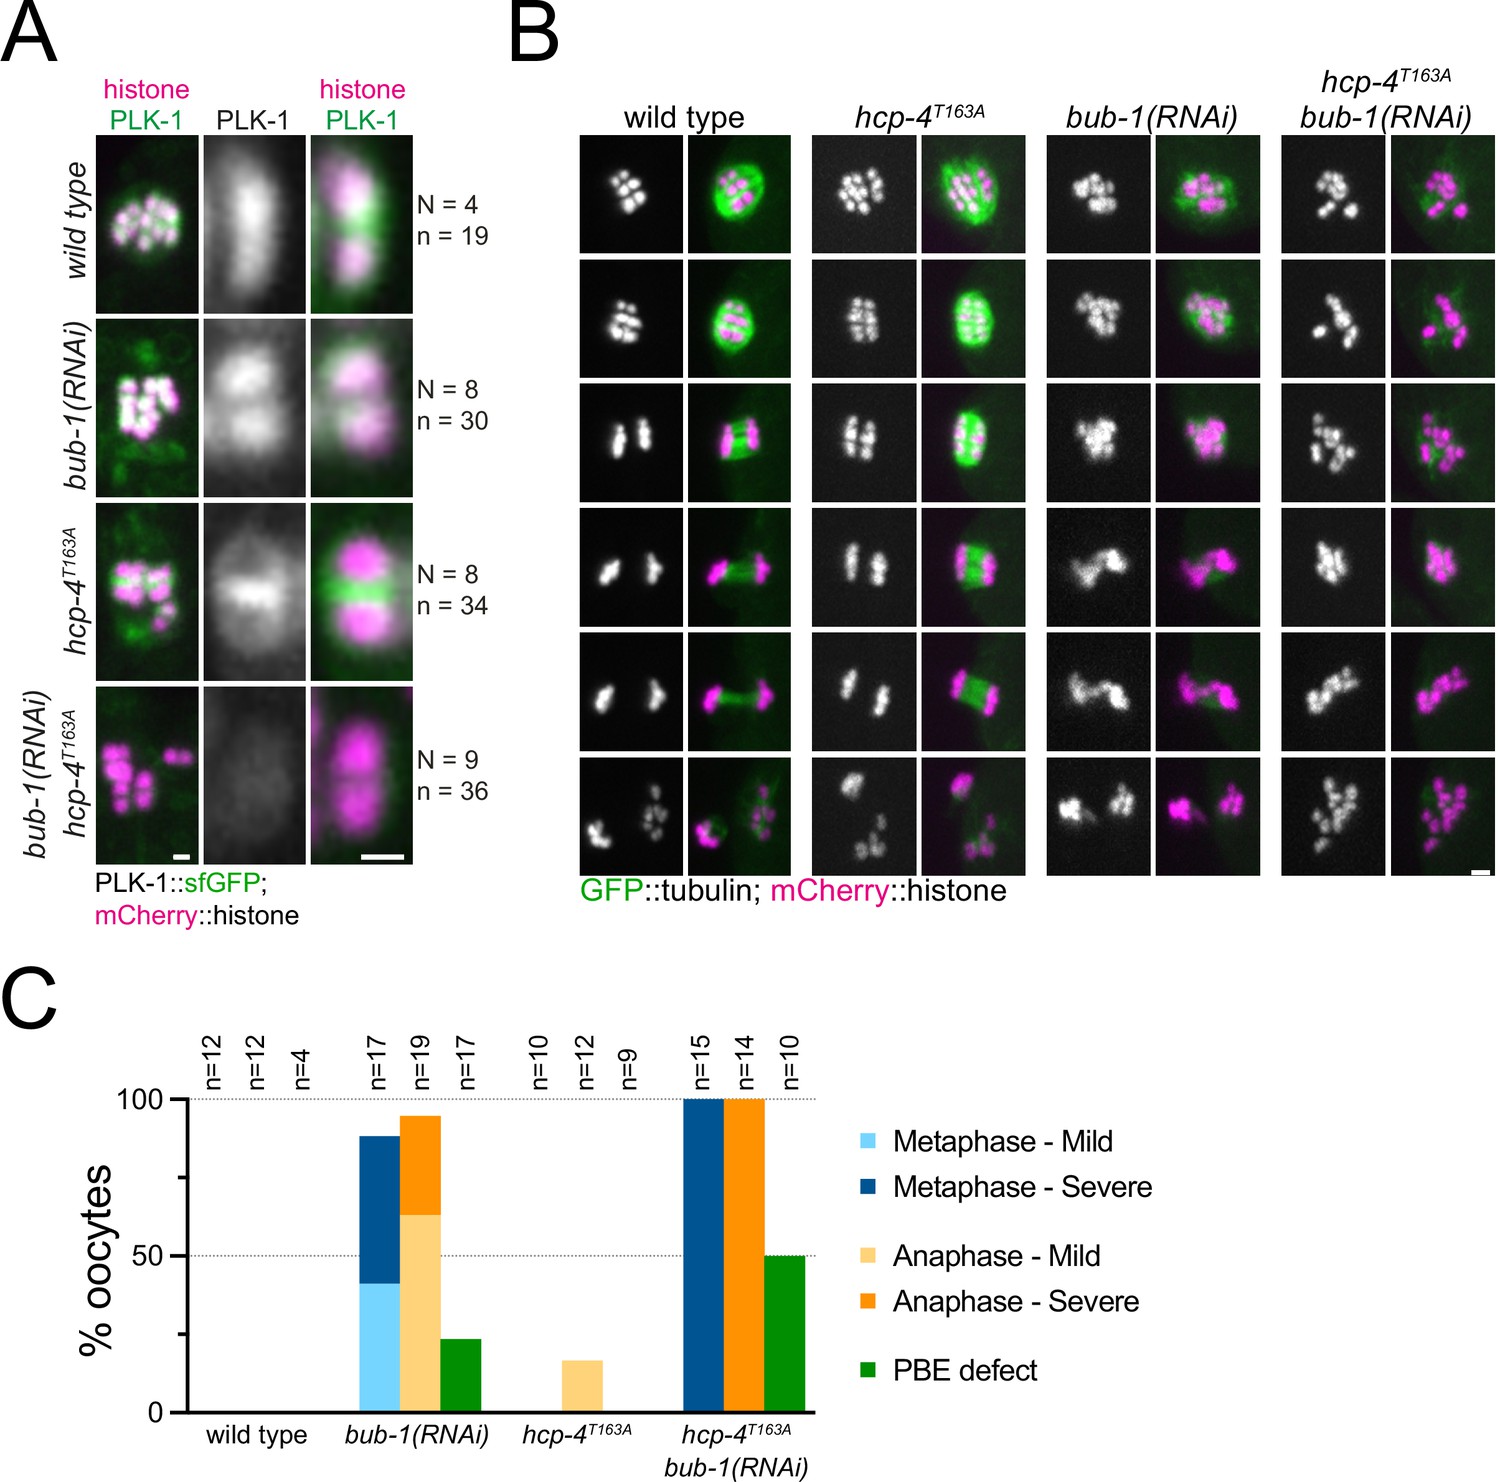
Figure 9 with 2 supplements

Disruption of BUB-1- and CENP-CHCP-4 STP motifs leads to severe meiotic defects.
(A) Wild type BUB-1 (‘BUB-1wt’) and T527A BUB-1 (‘BUB-1T527A’) were expressed from transgenes in the absence of endogenous BUB-1, in wild type (‘hcp-4wt’) or HCP-4 T163A (‘hcp-4T163A’) worms. Oocytes expressing sfGFP-tagged PLK-1 (and mCherry-tagged histone) were dissected and recorded throughout meiosis I. Images from oocytes in prometaphase I are shown. Cyan arrow points to the midbivalent, and yellow arrows point to chromosome arms. Scale bar, 2 µm. (B) Oocytes from the same conditions as in (A) but expressing GFP-tagged tubulin (and mCherry-tagged histone) were dissected and recorded throughout meiosis I. Scale bar, 2 µm. In the case of the double mutant hcp-4T163A/bub-1T527A, two oocytes are shown, one that achieved (defective) PBE ('oocyte #1’) and another in which PBE failed ('oocyte #2’). (C) Meiotic defects were assessed and are shown as % of oocytes showing each defect. See ‘Methods’ for more details. 'N’ and ‘n’ denote the number of oocytes and bivalents analysed, respectively.
Figure 9—figure supplement 1
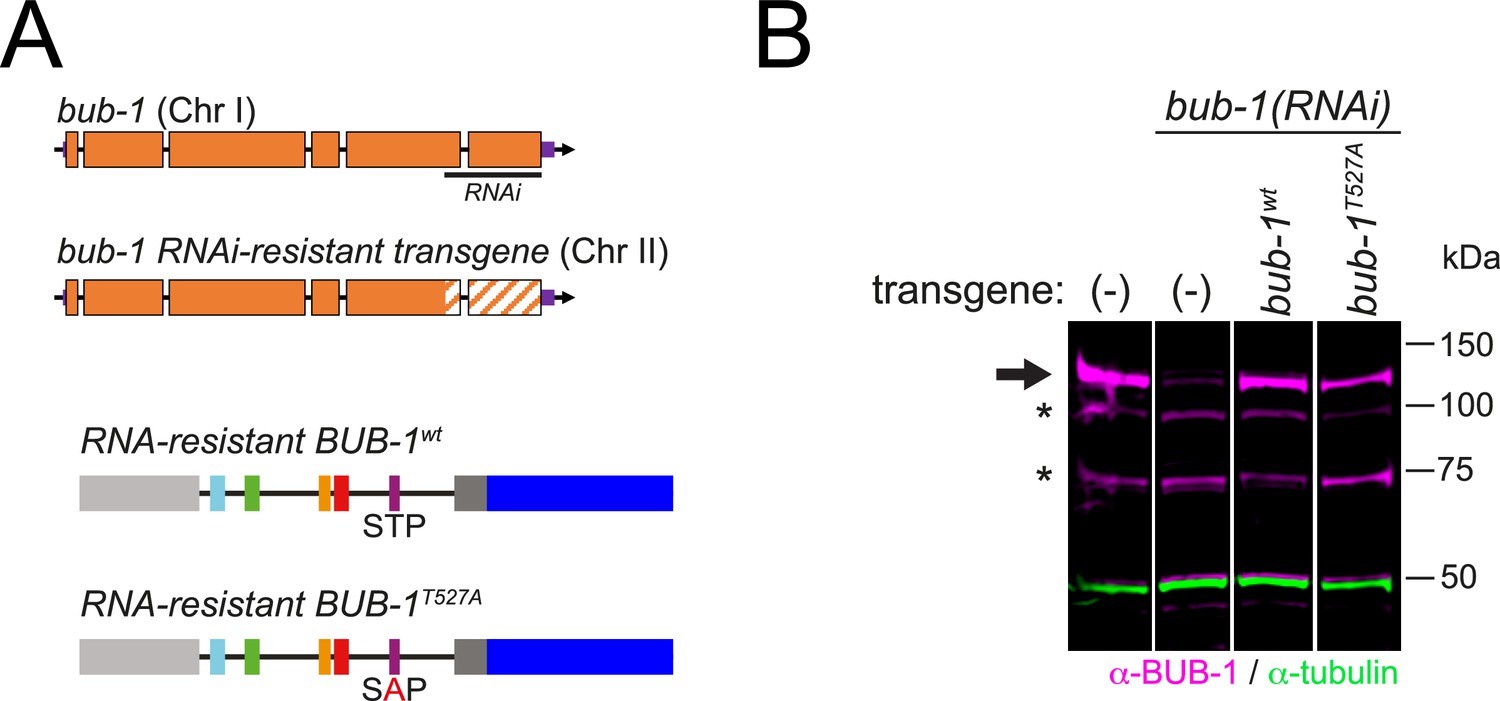
Strategy for the RNAi/rescue experiments using bub-1 transgenes.
(A) Schematics depicting the strategy for depletion of endogenous BUB-1 and expression of RNAi-resistant transgenes. (B) Western blot showing the levels of BUB-1 in the different conditions. All lanes come from the same blot, and the vertical white line indicates that the lanes were not contiguous in the original blot (available in Figure 9—figure supplement 1—source data 1).
-
Figure 9—figure supplement 1—source data 1
Gel scan images for data presented in Figure 9—figure supplement 1.
(A) Schematic of the endogenous and transgenic bub-1, highlighting the targeting regions of two different RNAi constructs. RNAi #2 is the one used for the experiments since it targets the region that has been re-encoded in the transgenes, which are therefore RNAi-resistant. (B) Full blot of the lanes presented in Figure 9—figure supplement 1. The lanes used in the figure are marked by a dotted white line.
- https://cdn.elifesciences.org/articles/84057/elife-84057-fig9-figsupp1-data1-v2.ai
Figure 9—figure supplement 2

Disruption of BUB-1- and CENP-CHCP-4 STP motifs leads to severe meiotic defects.
(A) This panel shows the full set of conditions analysed for the experiment shown in Figure 9A, fully validating the depletion/rescue strategy. Oocytes expressing sfGFP-tagged PLK-1 (and mCherry-tagged histone) were dissected and recorded throughout meiosis I. Images from oocytes in prometaphase I are shown. Cyan arrows points to the midbivalent, and yellow arrows point to chromosome arms. Scale bar, 2 µm. (B) This panel shows the full set of conditions analysed for the experiment shown in Figure 9B, fully validating the depletion/rescue strategy. Oocytes from the same conditions as in (A) but expressing GFP-tagged tubulin (and mCherry-tagged histone) were dissected and recorded throughout meiosis I. Scale bar, 2 µm. In the case of the double mutant hcp-4T163A/bub-1T527A, two oocytes are shown, one that achieved (defective) PBE ('oocyte #1’) and another in which PBE failed ('oocyte #2’).
Additional files
-
Supplementary file 1
List of C. elegans strains used in this study.
The table details the fluorescent markers and/or mutations, strain name, genotype, and source.
- https://cdn.elifesciences.org/articles/84057/elife-84057-supp1-v2.xlsx
-
MDAR checklist
- https://cdn.elifesciences.org/articles/84057/elife-84057-mdarchecklist1-v2.docx
Download links
A two-part list of links to download the article, or parts of the article, in various formats.
Downloads (link to download the article as PDF)
Open citations (links to open the citations from this article in various online reference manager services)
Cite this article (links to download the citations from this article in formats compatible with various reference manager tools)
BUB-1 and CENP-C recruit PLK-1 to control chromosome alignment and segregation during meiosis I in C. elegans oocytes
eLife 12:e84057.
https://doi.org/10.7554/eLife.84057


