Lifespan extension in female mice by early, transient exposure to adult female olfactory cues
- Department of Anatomy, School of Biomedical Sciences, University of Otago, New Zealand
- Department of Pathology and Geriatrics Center, University of Michigan, United States
- Center for Integrative Physiology and Molecular Medicine, Saarland University, Germany
- Department of Molecular and Integrative Physiology, University of Michigan, United States
Figures
Figure 1
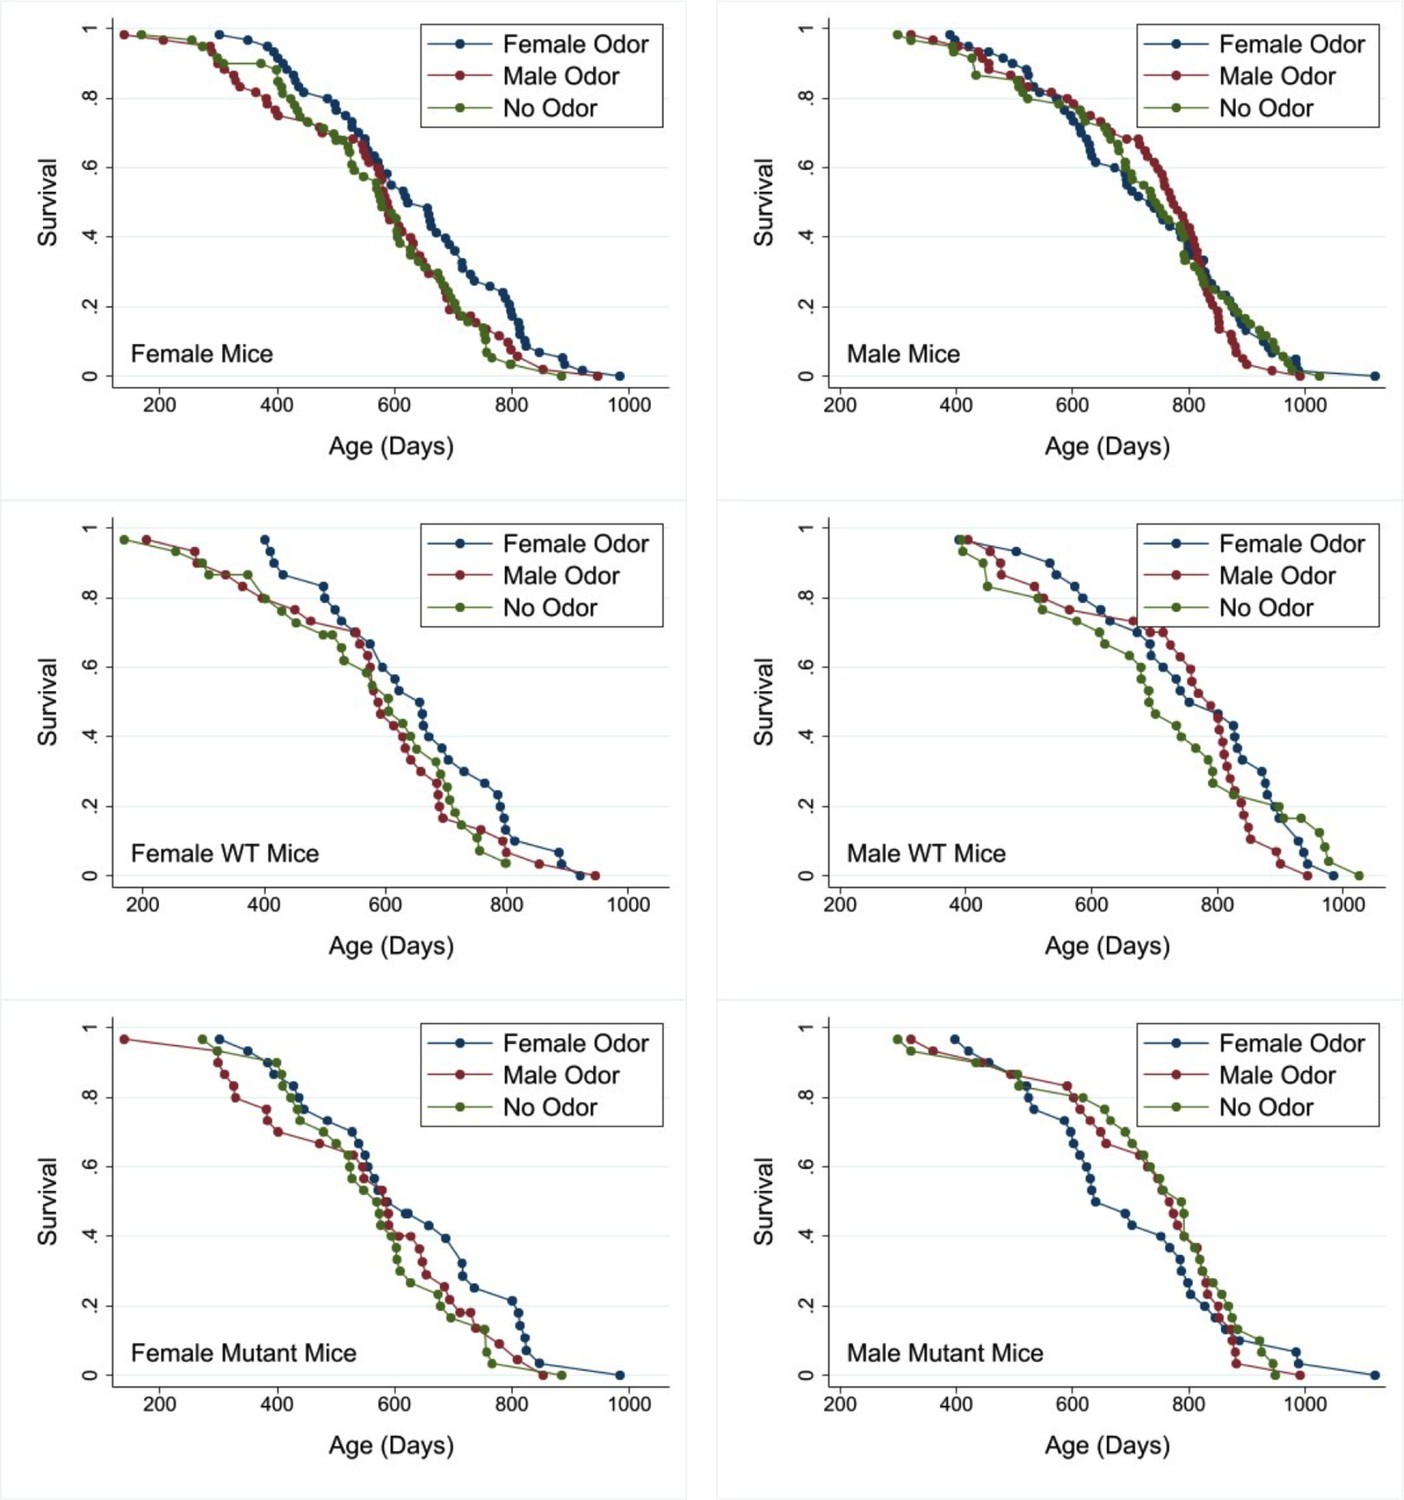
Survival curves for female (left panels) and male mice (right panels) exposed to male, female, or no odors daily from 2 to 60 days of age.
Top row: pooled across genotypes. Middle row: wild-type (WT) mice. Bottom row: mutant mice. Cox regression analysis (see Table 2) shows no significant interaction between genotype and odor treatment in either sex. See the Supplementary data for age at death of each mouse and its genotype, sex, and treatment group.
-
Figure 1—source data 1
Individual-level survival data in days.
- https://cdn.elifesciences.org/articles/84060/elife-84060-fig1-data1-v2.xlsx
Figure 2 with 1 supplement
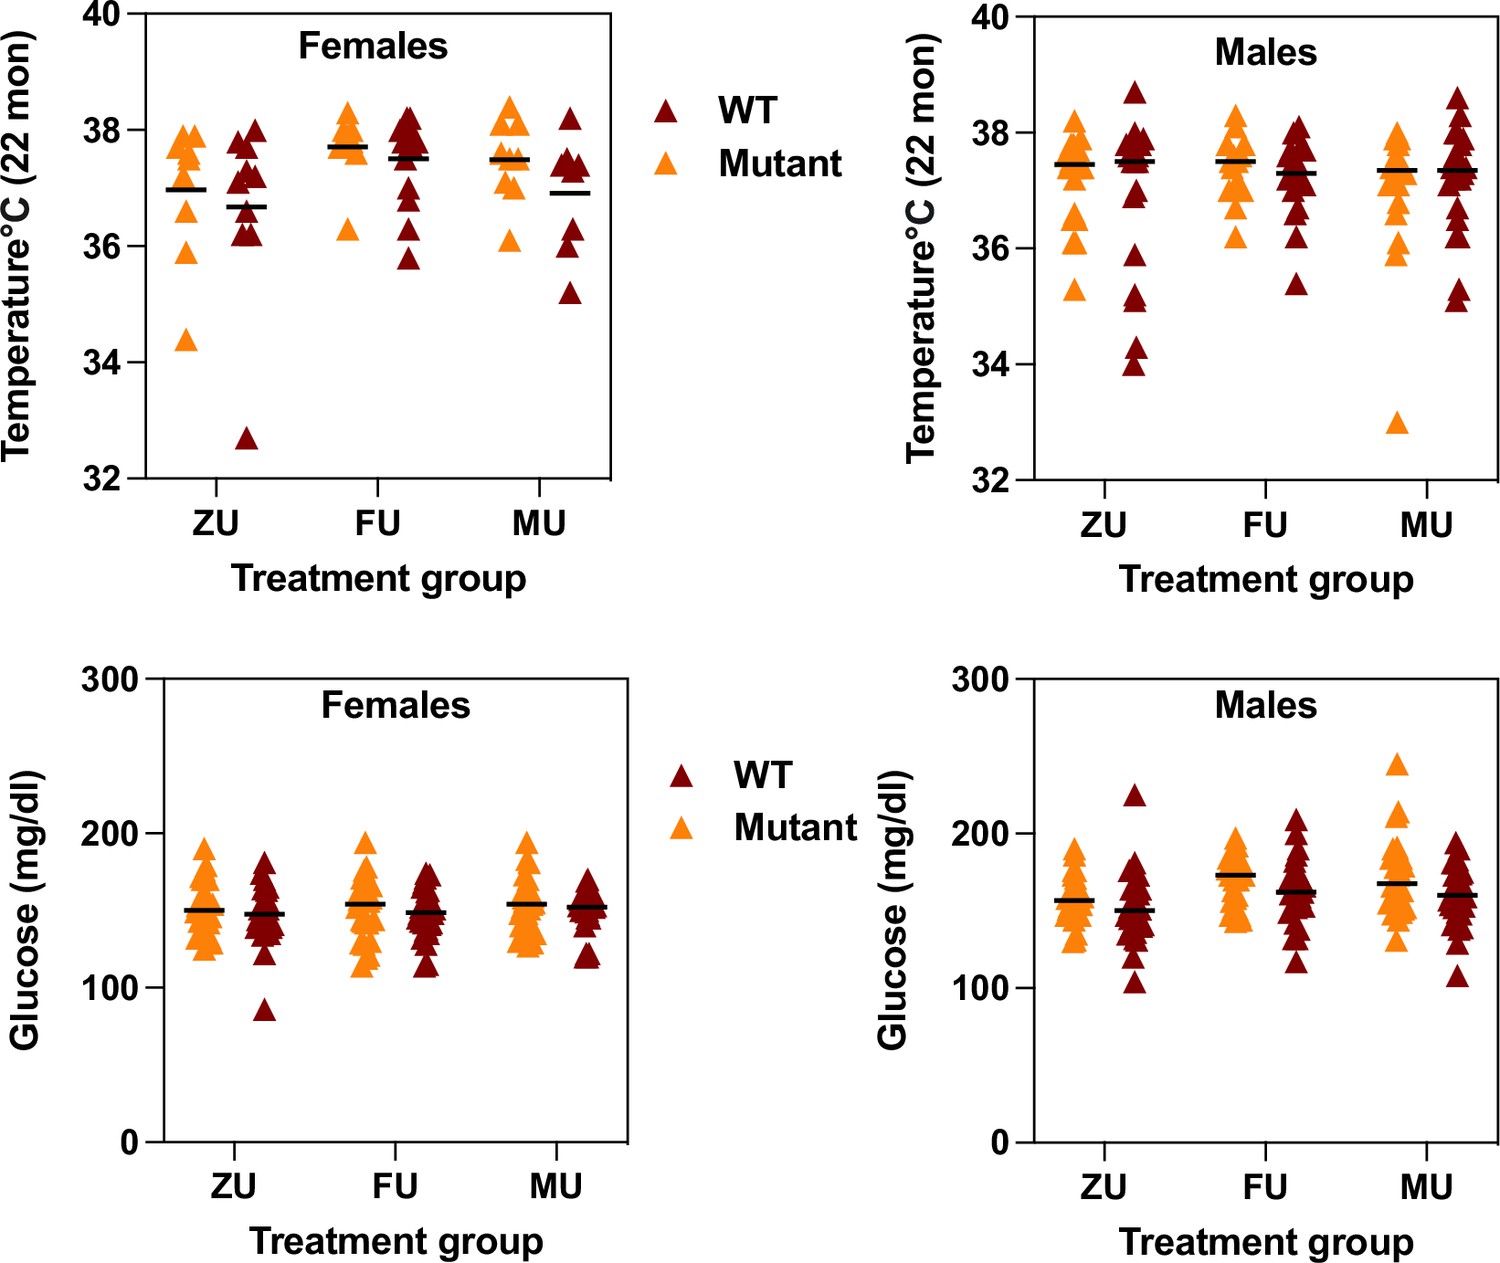
Measurement of core body temperature at 22 months (top row) and of plasma non-fasting glucose at 12 months (bottom row) in female (left) and male (right) mice of the indicated odor treatment groups.
Each symbol represents one mouse, with color indicating genotype. The black line indicates the mean of each group. ZU = control mice, FU = those exposed to female odors, MU those that were exposed to male odors. Full data matched to each genotype and treatment group is available in the Supplementary data.
-
Figure 2—source data 1
Individual data for temperature, grip strength, and rotarod function.
- https://cdn.elifesciences.org/articles/84060/elife-84060-fig2-data1-v2.xlsx
-
Figure 2—source data 2
Individual data for glucose levels.
- https://cdn.elifesciences.org/articles/84060/elife-84060-fig2-data2-v2.xlsx
Figure 2—figure supplement 1
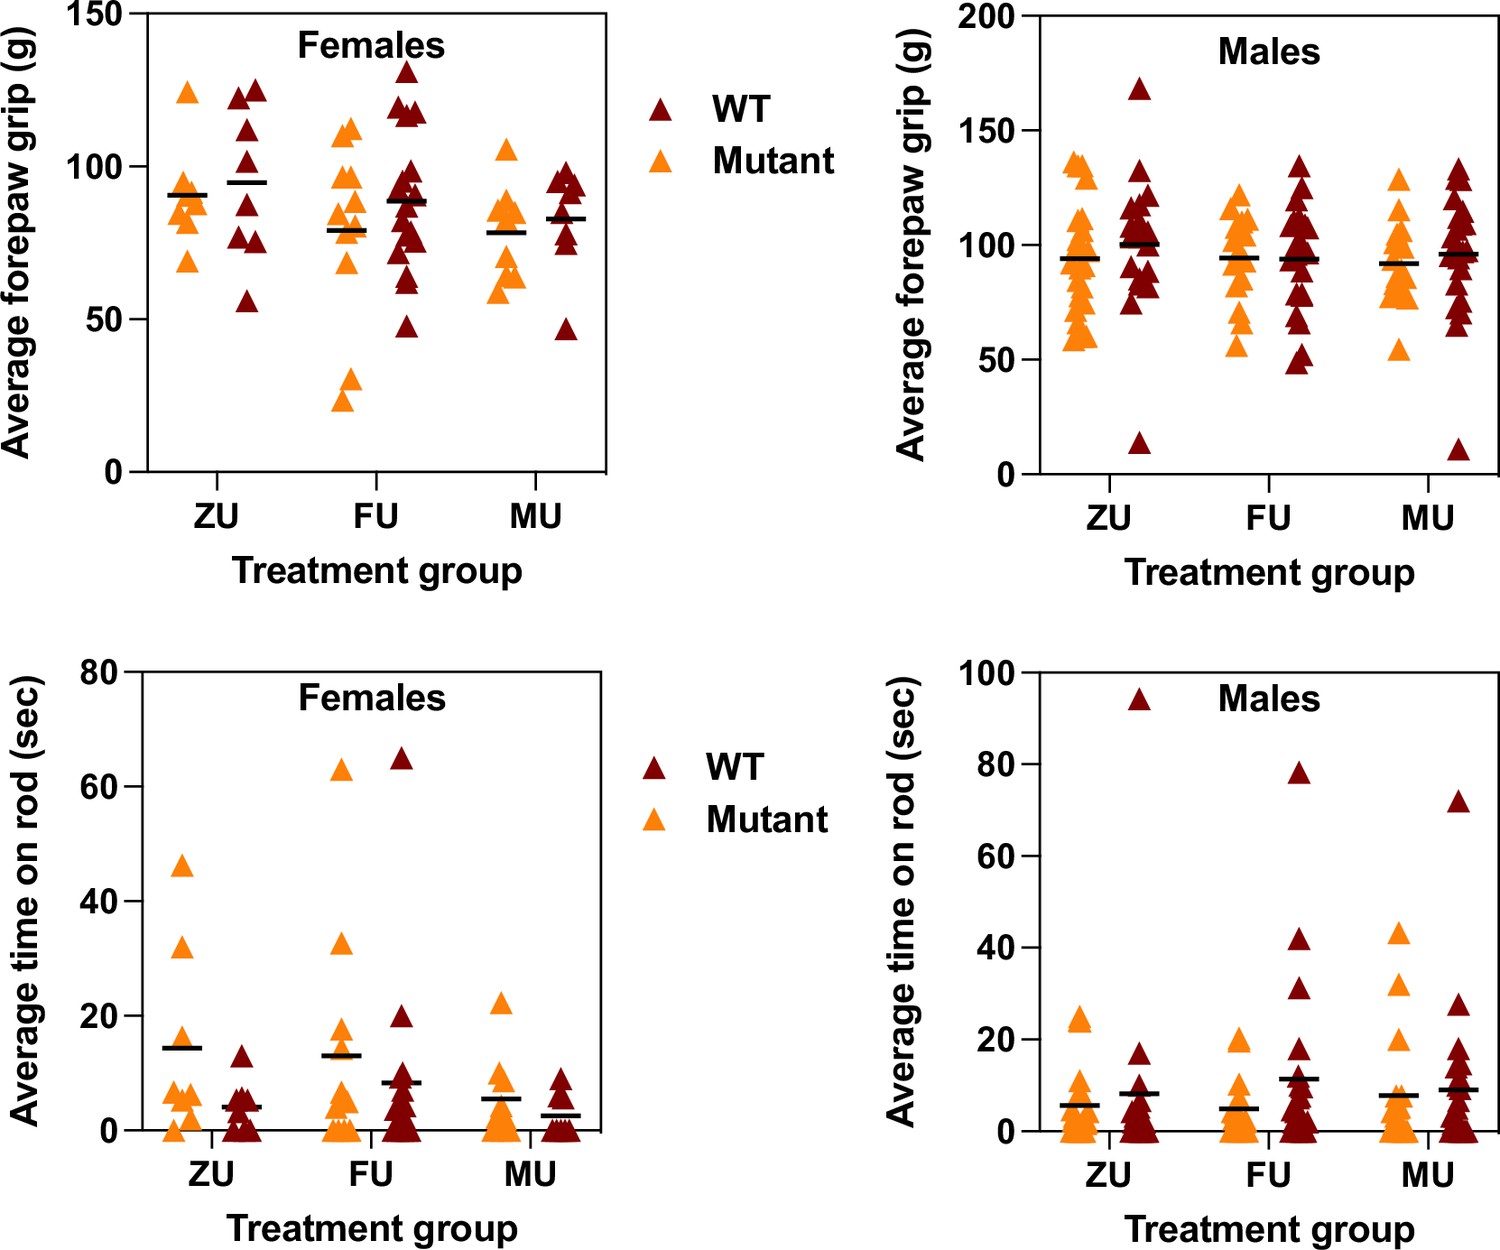
No effect of genotype or odor treatment on grip strength or rotarod balance capacity.
Each dot represents a value for an individual mouse. The black line indicates the mean of each group.
Figure 3 with 1 supplement
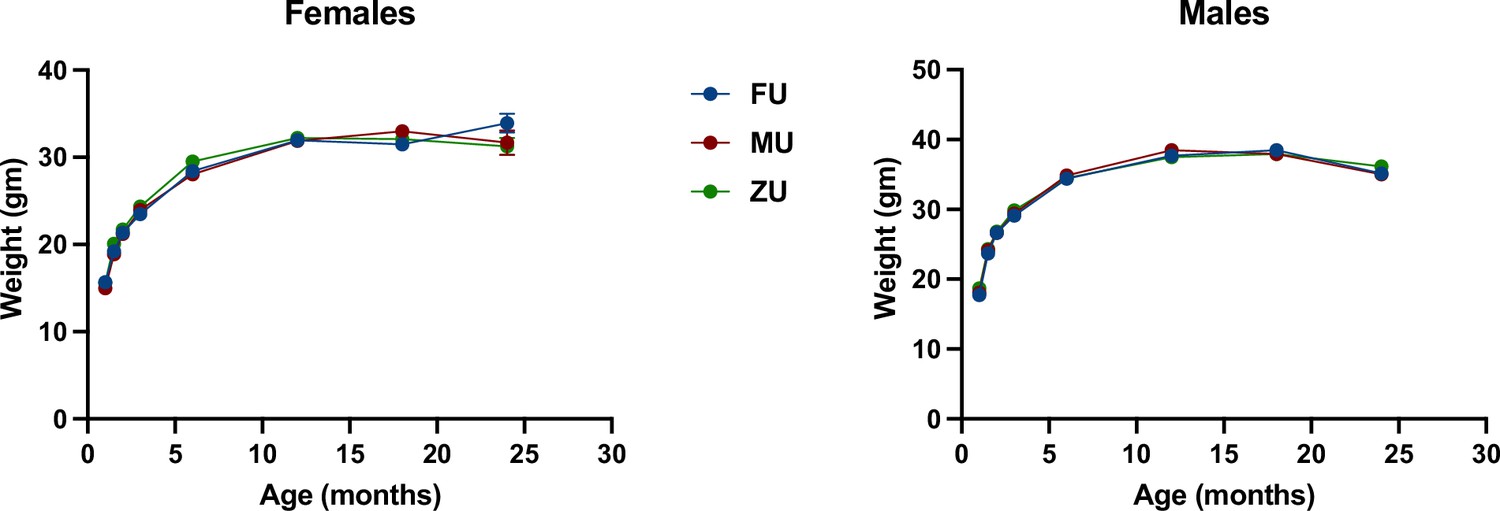
Weight as a function of age in female and male mice.
The genotypes are pooled in the figure with separate figures provided in Figure 3—figure supplement 1. N=60 in each group through month 3, and then diminished to 32–39 mice (females) or to 48–49 mice (males) by month 18. Standard error of the mean (SEM) values are plotted, but are in most cases too small to see; SEM was <0.3 g at younger ages and typically 0.7–1.3 g at 18 months.
-
Figure 3—source data 1
Individual level data for body weight at each time point.
- https://cdn.elifesciences.org/articles/84060/elife-84060-fig3-data1-v2.xlsx
Figure 3—figure supplement 1
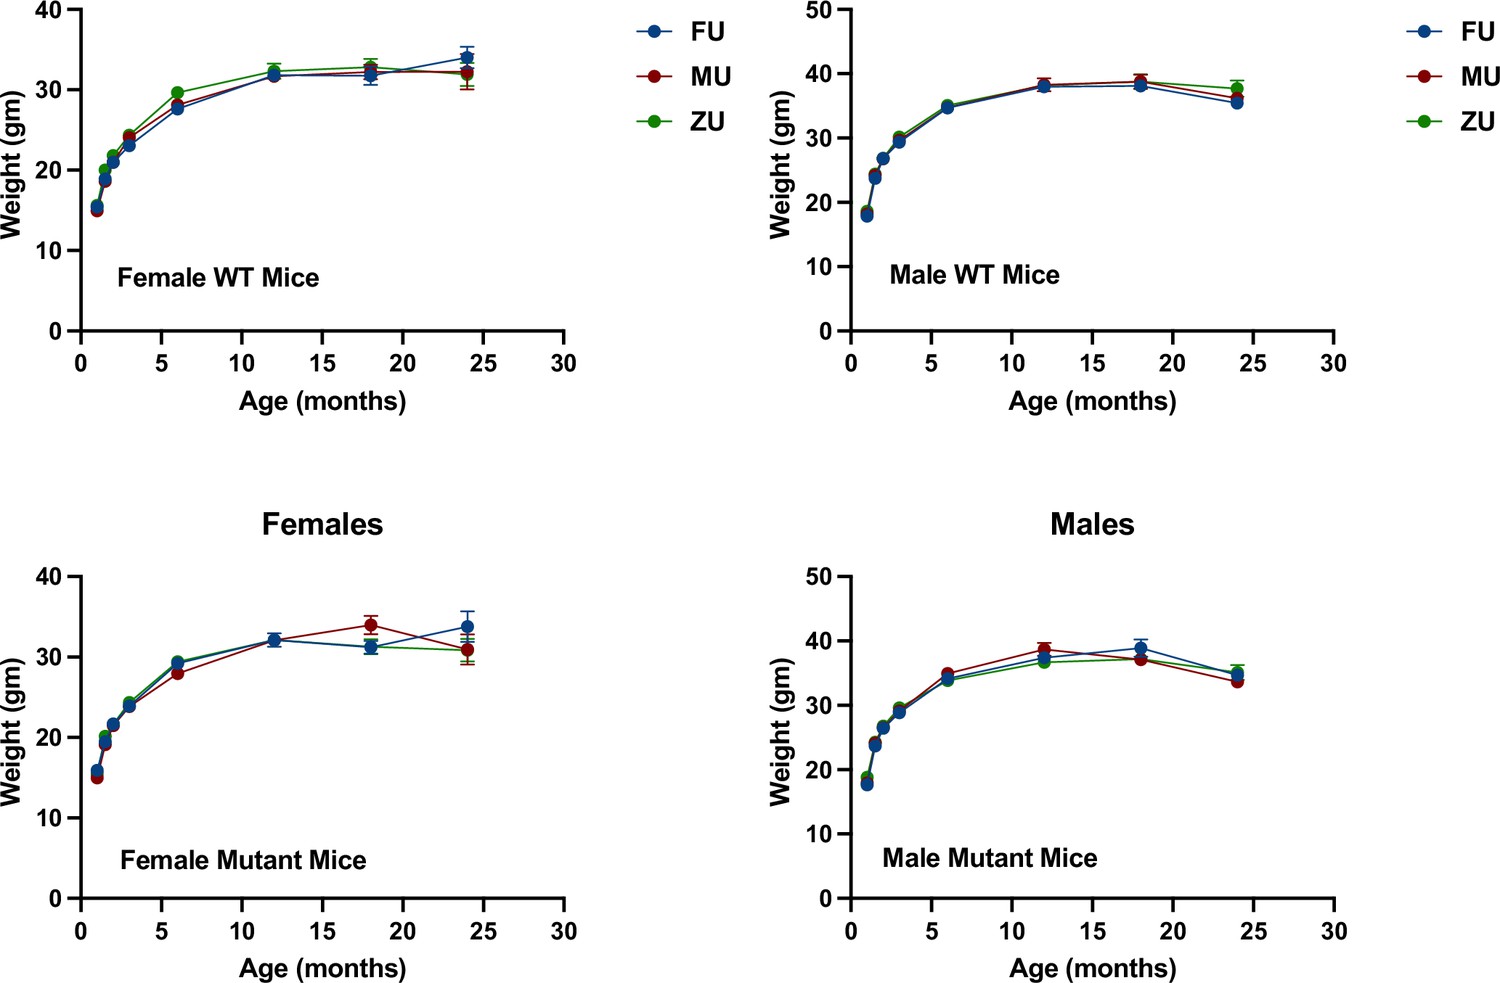
Weight as a function of age in female and male mice stratified by genotype.
The top panels show wild-type (WT) mice, the bottom panels are mutant mice. Standard error of the mean (SEM) values are plotted, but are in most cases too small to see. The full dataset showing weights for each individual mouse is provided as a supplementary dataset.
Figure 4

Changes in vaginal patency in response to odor treatments in UM-HET3 mice.
Each symbol represents the age at vaginal patency in an individual mouse. p Values are from a Sidak post hoc comparison test. Error bars shown the mean ± standard error of the mean (SEM). ZU = control mice, FU = those exposed to female odors, MU those that were exposed to male odors.
-
Figure 4—source data 1
Age at vaginal patency for each individual.
- https://cdn.elifesciences.org/articles/84060/elife-84060-fig4-data1-v2.xlsx
Tables
Table 1
Median and 90th percentile survival statistics for mice treated with same-sex or opposite-sex odors from 3 to 60 days of age.
| Female mice, pooled across genotype | |||||
|---|---|---|---|---|---|
| Treatment | Count | Median | % Change | p(90) | % Change |
| Female odor (FU) | 59 (30 WT) | 621 | 8 | 823 | 9 |
| Male odor (MU) | 58 (30 WT) | 585 | 2 | 792 | 5 |
| No odor (ZU) | 57 (27 WT) | 576 | (NA) | 754 | (NA) |
| Male mice, pooled across genotype | |||||
| Treatment | Count | Median | % Change | p(90) | % Change |
| Female odor (FU) | 60 (30 WT) | 737 | −1 | 932 | −1 |
| Male odor (MU) | 59 (29 WT) | 772 | 4 | 879 | −7 |
| No odor (ZU) | 59 (29 WT) | 741 | (NA) | 944 | (NA) |
Table 2
Significance tests for predictors in Cox regression, calculated separately for each sex.
| Sex of mouse | Treatment | Genotype | Interaction |
|---|---|---|---|
| Female | Χ2 = 6.5 p=0.039 | Χ2 = 0.4 p=0.5 | Χ2 = 0.12 p=0.9 |
| Male | Χ2 = 0.52 p=0.8 | Χ2 = 0.23 p=0.6 | Χ2 = 0.31 p=0.5 |
Additional files
Download links
A two-part list of links to download the article, or parts of the article, in various formats.
Downloads (link to download the article as PDF)
Open citations (links to open the citations from this article in various online reference manager services)
Cite this article (links to download the citations from this article in formats compatible with various reference manager tools)
Lifespan extension in female mice by early, transient exposure to adult female olfactory cues
eLife 11:e84060.
https://doi.org/10.7554/eLife.84060


