Kinetics of blood cell differentiation during hematopoiesis revealed by quantitative long-term live imaging
- Department of Cellular and Physiological Sciences, University of British Columbia, Canada
- School of Biomedical Engineering, University of British Columbia, Canada
- British Columbia Children’s Hospital, Canada
Figures
Figure 1 with 3 supplements
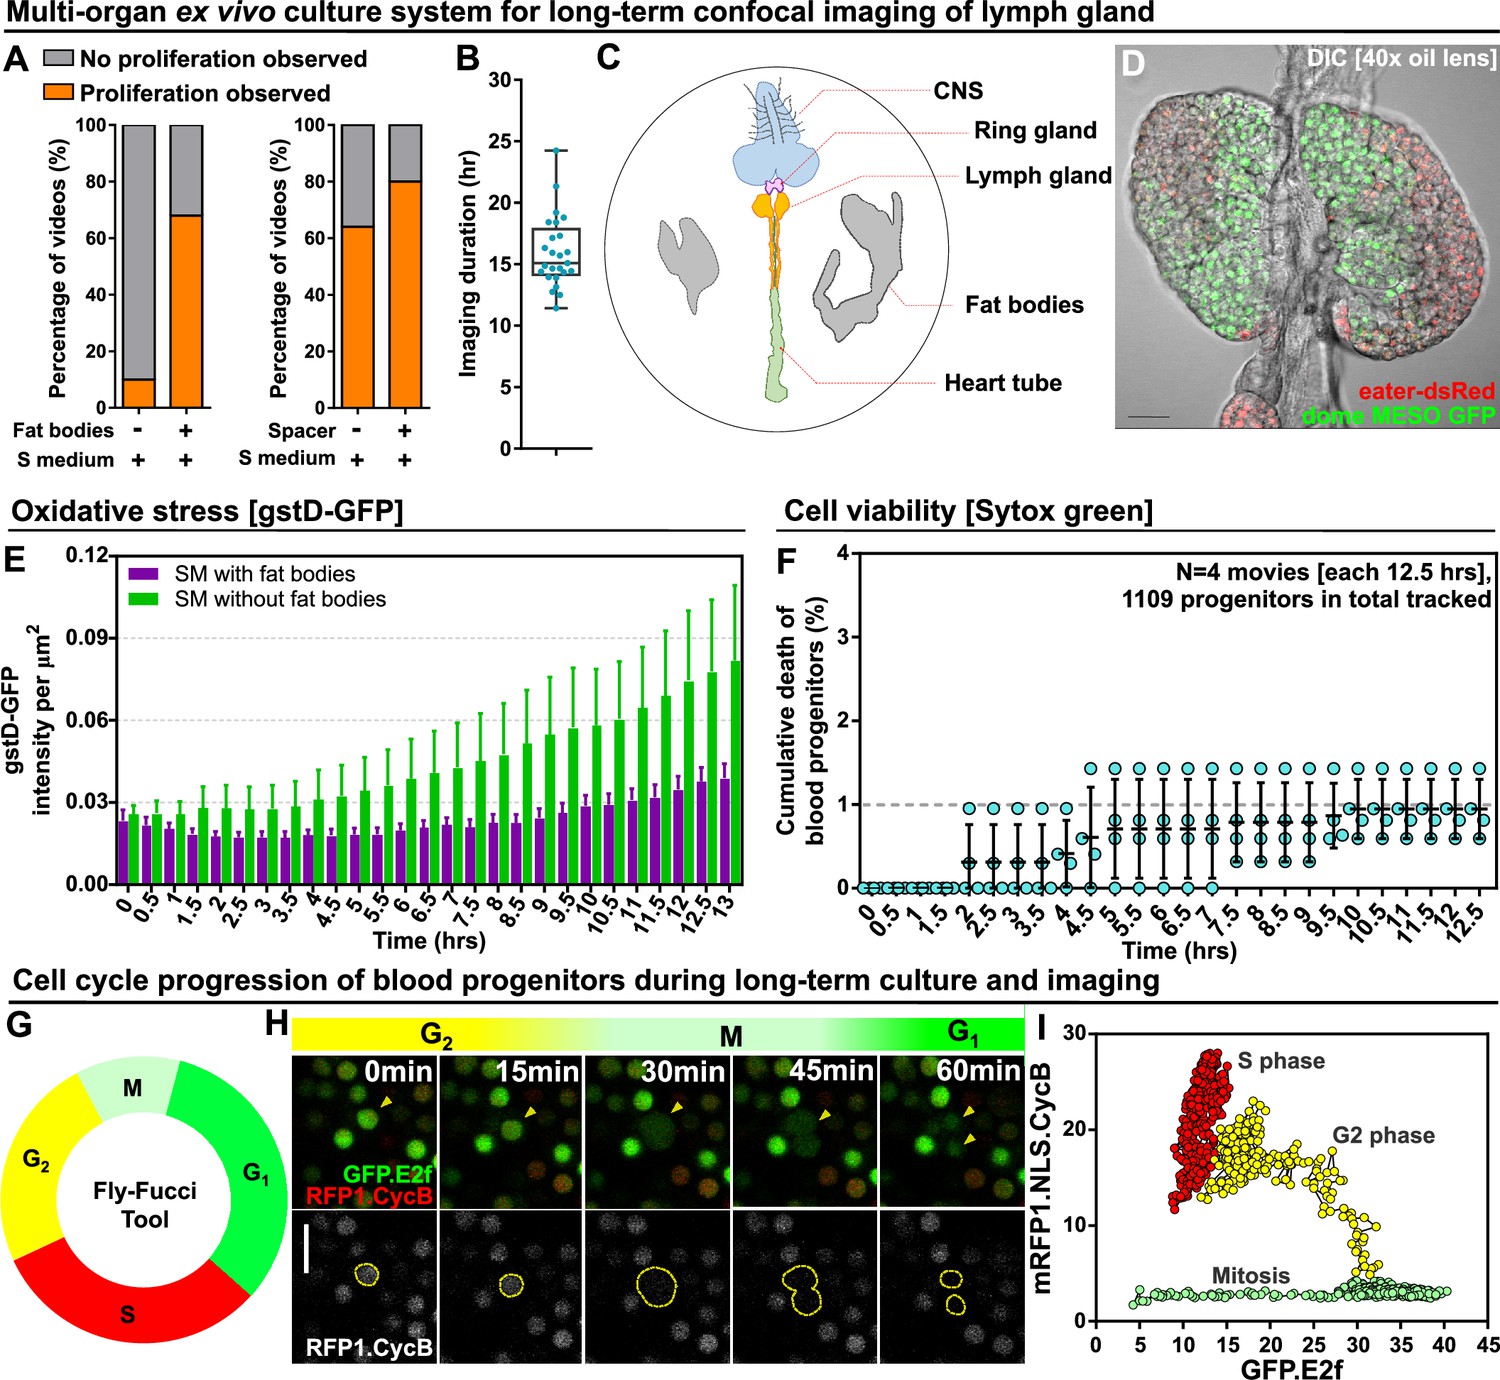
Long-term ex vivo culture system for extended imaging of developing Lgs.
(A) Quantification of the percentage of videos where proliferation was observed versus videos where no proliferation was observed under four different conditions: co-culture with or without the presence of fat bodies (percentage calculated from n=29 videos) and with or without placing a spacer (percentage calculated from n=19 videos). (B) Quantification of the duration of imaging (in hrs) for individual LG videos (n=25 videos, on average 15.96 hr per video; see Materials and methods). (C) Schematic showing the experimental setup for the multi-organ co-culture system in a glass bottom dish. Organs in the culture include the central nervous system (CNS), ring gland, LG, heart tube (or dorsal vessel), and fat bodies. (D) Representative DIC image of an ex vivo cultured LG (blood progenitors labelled with dome-MESO-GFP in green, mature hemocytes labelled with eater-dsRed in red). Genotype of the LG was dome-MESO-GFP; eater-dsRed. (E) Quantification of oxidative stress levels in whole LGs cultured overnight under two conditions: in Schneider’s medium (SM) with fat bodies (n=13 primary lobes tracked from 8 videos [each 13 hr]) and in SM without fat bodies (n=7 primary lobes tracked from 4 videos [each 13 hr]). Genotype of the LG was gstD-GFP. (F) Quantification of blood progenitor viability during long-term live imaging. In total n=1109 progenitors (marked by Tep4-Gal4 driven dsRed) were tracked from 4 videos (each 12.5 hr). Genotype of the LG was Tep4-Gal4>UAS-dsRed. (G) Schematic of the Fly-FUCCI system used to track the cell cycle progression using distinct fluorescent markers in combinations (see Materials and methods). (H) An example showing G2 to M to G1 transition of a blood progenitor over the course of approximately 60 min. (I) Quantification from an example, using Tep4-Gal4 driven FUCCI, to visualize an S to G2 to M progression of a blood progenitor. Each dot represents a time point; decrease in the intensity during mitosis was caused by nucleus breakdown. Genotype of the LG was Tep4-Gal4>UAS-FUCCI. Scale bars in (D) and (H) represent 50 and 10 μm, respectively. Error bars indicate S.D from the mean. S medium in (A) and SM in (E) denote Schneider’s medium supplied with 15% FBS and 0.2 mg/mL insulin (see Materials and methods). See also Videos 1–3.
-
Figure 1—source data 1
Raw data of Figure 1A, B, E, F, I.
- https://cdn.elifesciences.org/articles/84085/elife-84085-fig1-data1-v2.xlsx
Figure 1—figure supplement 1
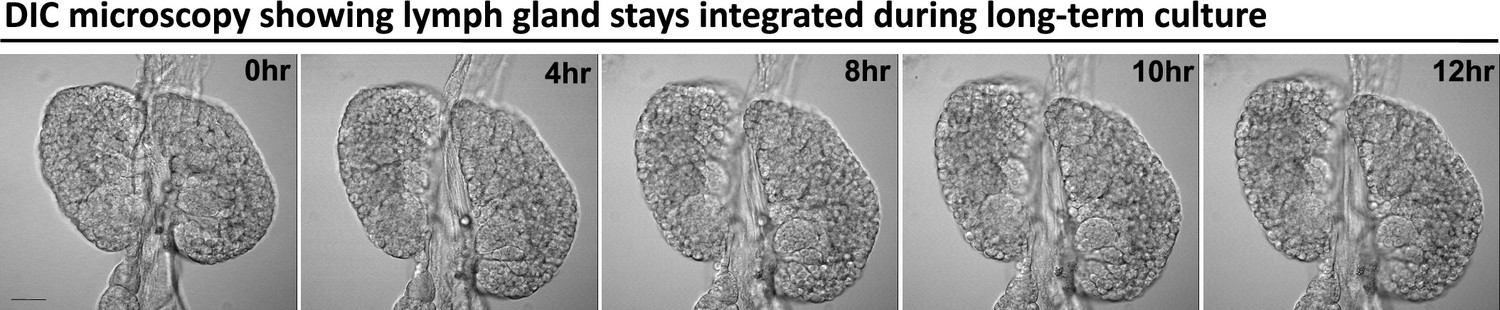
A LG stays integrated during long-term culture and imaging.
Time-lapse DIC images (0, 4, 8, 10, 12 hr) from a representative video (of Figure 1D) of an ex vivo cultured LG during long-term live imaging period. Scale bar in (A) represents 50 μm.
Figure 1—figure supplement 2
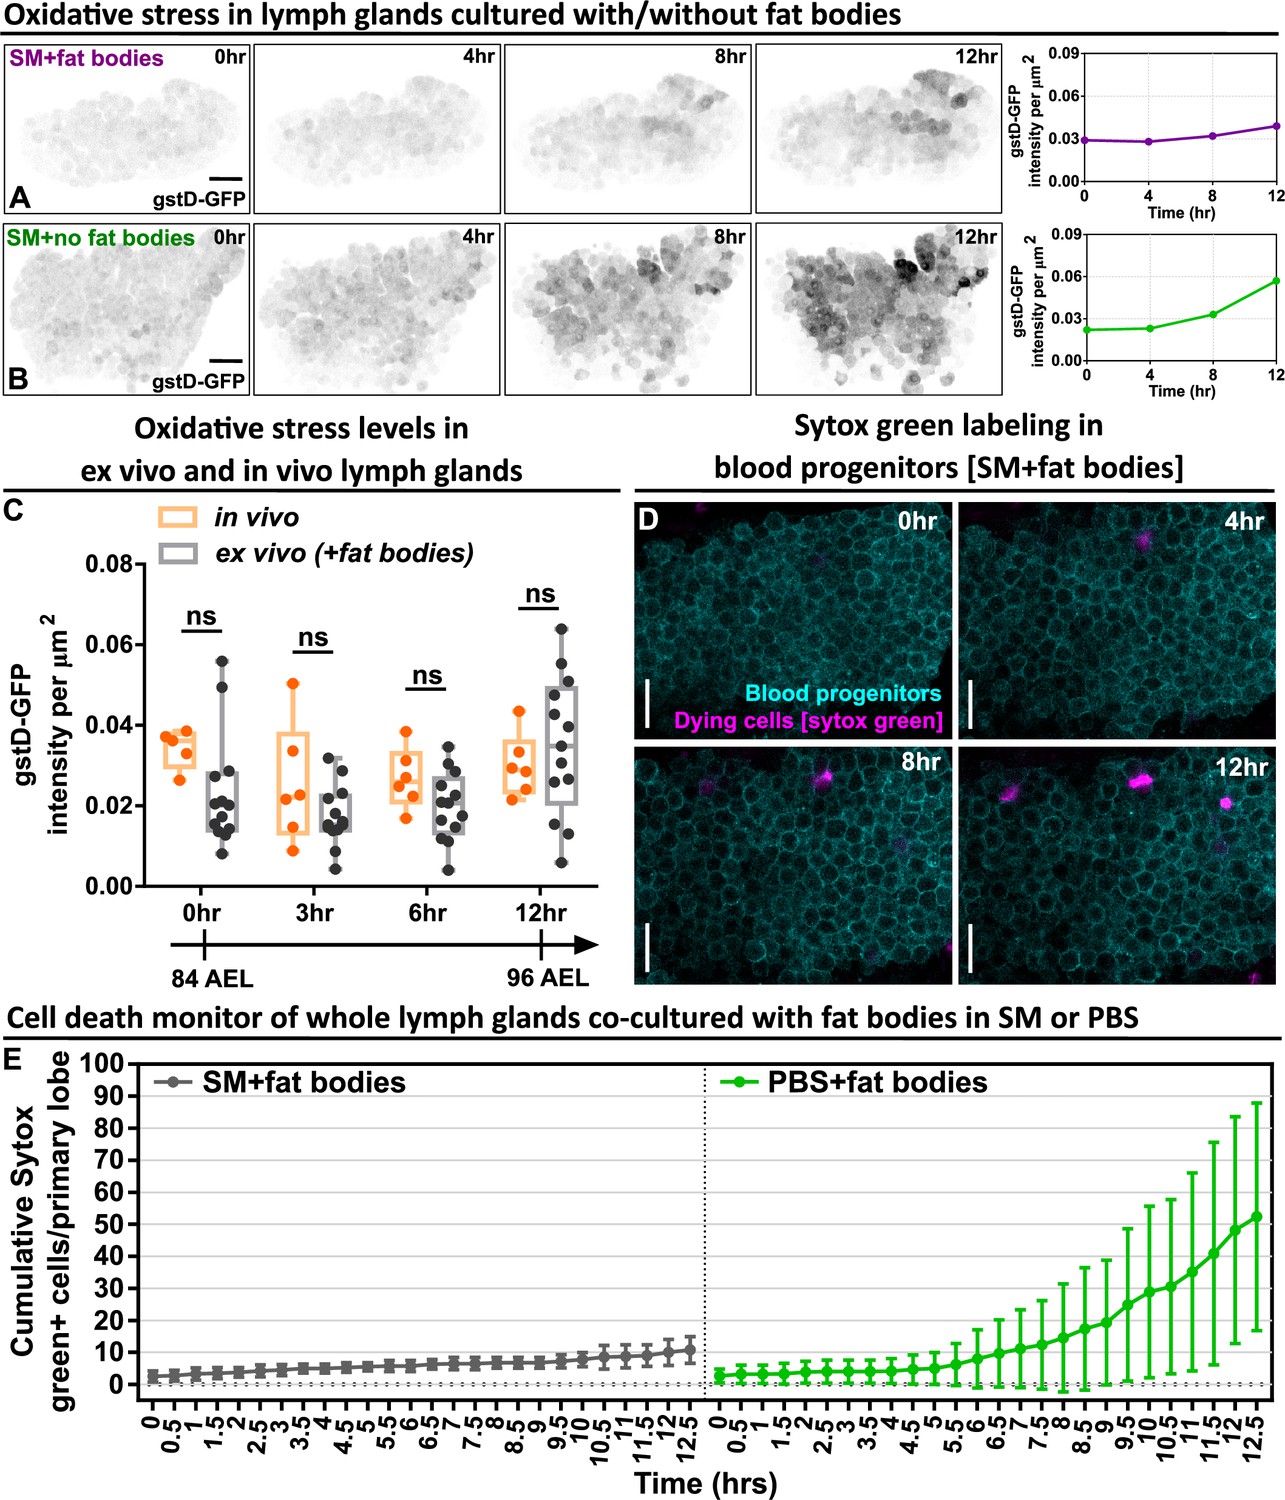
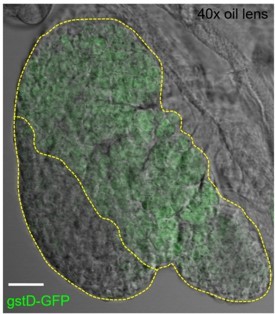
Long-term ex vivo cultured LGs exhibit low oxidative stress and high cell viability.
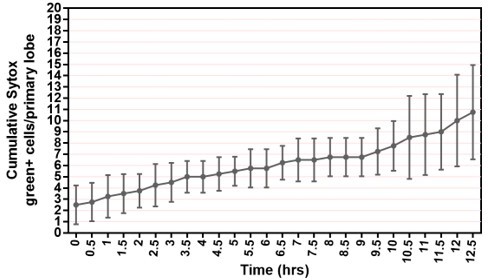
(A–B) Representative time-lapse images (0, 4, 8, 12 hr) and quantification showing the oxidative stress level over the course of 12 hr in whole LGs cultured in SM with fat bodies (A) and in SM without fat bodies (B). The images were representative examples selected from Figure 1E dataset. (C) Quantification of the oxidative stress levels (gstD-GFP intensities) in ex vivo cultured LGs and in vivo LGs that were all matched in their developmental stages. p Values were 0.306, 0.5489, 0.6687, and 0.8819 in 0 hr, 3 hr, 6 hr, and 12 hr groups, respectively. (D) Time-lapse images (0, 4, 8, 12 hr) from a representative video (of Figure 1F) showing the cell viability of blood progenitors during a long-term live imaging period. Blood progenitors labelled with Tep4-Gal4-driven membranous dsRed (cyan). Dying progenitors labelled with Sytox Green dye (magenta; see Materials and methods). (E) Quantification of the cell viability of whole LGs cultured in SM with fat bodies (n=4 videos [each 12.5 hr]) and LGs cultured in PBS with fat bodies (n=6 videos [each 12.5 hr]). Genotype of the LG in (A–C) was gstD-GFP. Genotype of the LG in (D–E) was Tep4-Gal4>UAS-dsRed. Scale bars in (A), (B), (D) represent 50, 50, 30 μm, respectively. Error bars indicate S.D from the mean. SM denotes Schneider’s medium supplied with 15% FBS and 0.2 mg/mL insulin (see Materials and methods). p Values in (C) were determined using two-way ANOVA with Sidak’s multiple comparisons test. ns indicates p>0.05.
-
Figure 1—figure supplement 2—source data 1
Raw data of Figure 1—figure supplement 2A, B, C, E.
- https://cdn.elifesciences.org/articles/84085/elife-84085-fig1-figsupp2-data1-v2.xlsx
Figure 1—figure supplement 3
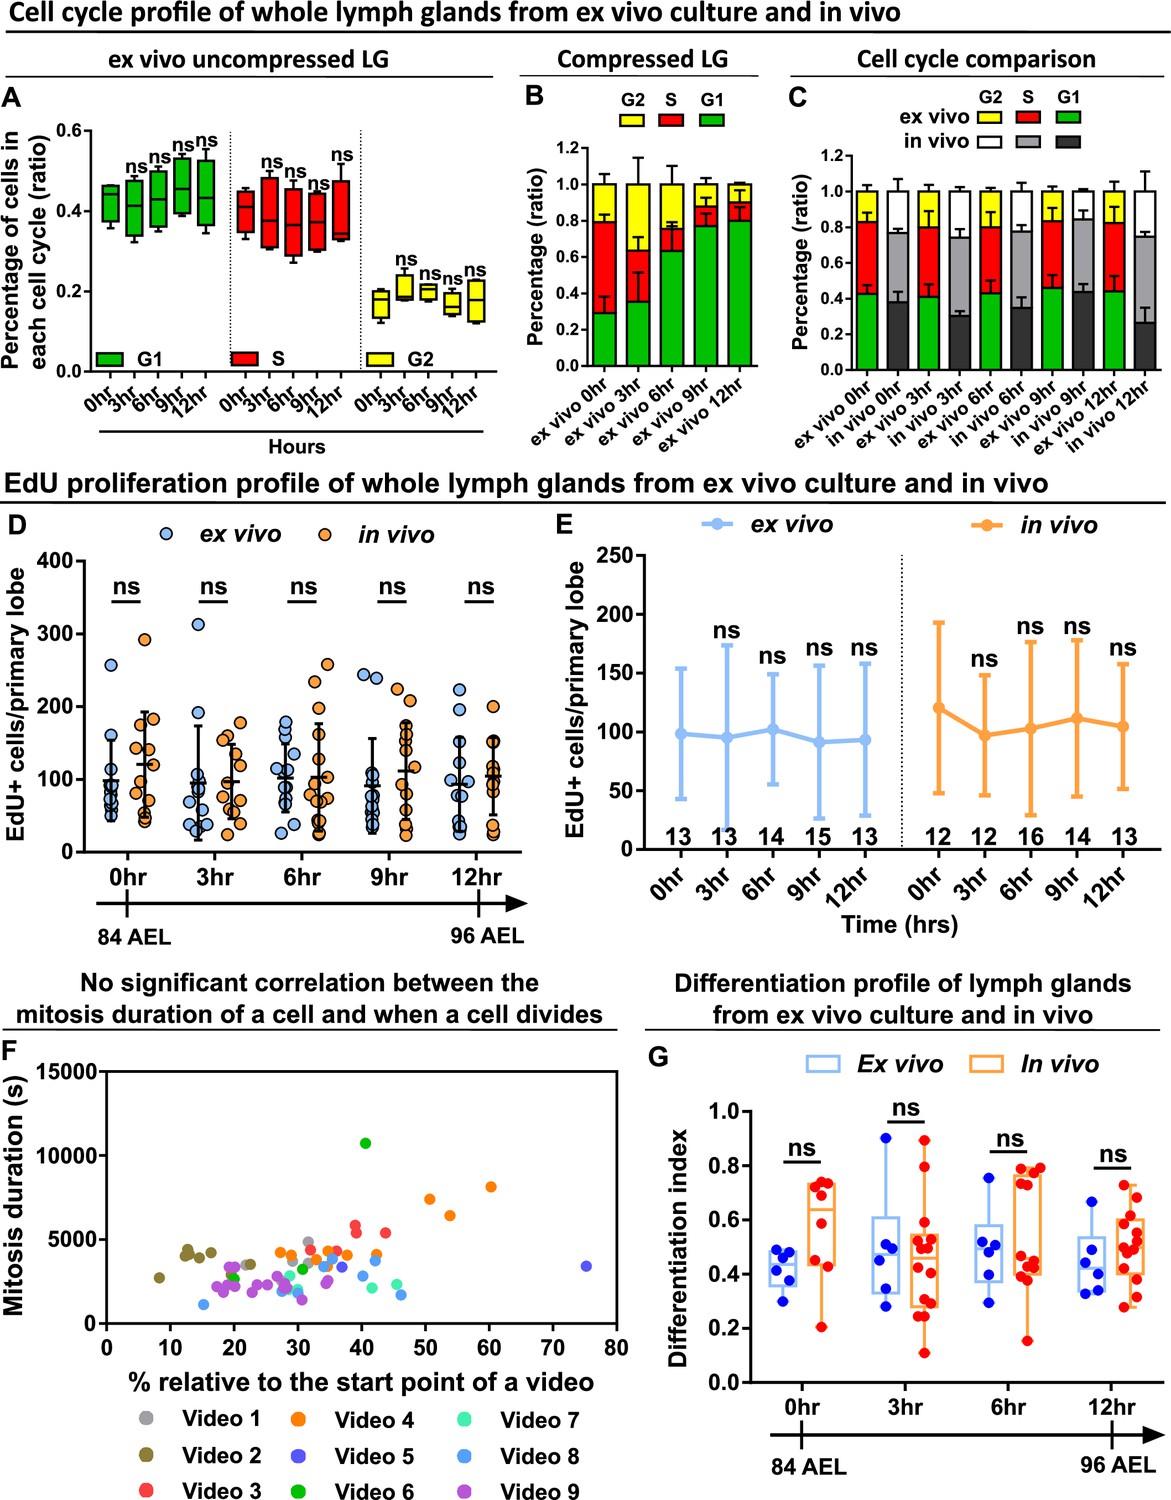
Ex vivo cultured LGs demonstrate comparable cell cycle, proliferation, and differentiation profiles to in vivo LGs.
(A–C) Quantification of cell cycle profile (shown as the percentage of cells staying in G1, S, G2 phases) in ex vivo cultured LGs that were uncompressed (A, n=4 videos [each 12 hrs]), ex vivo cultured LGs that were compressed (B, n=4 videos [each 12 hr]), and comparison of cell cycle profiles between ex vivo uncompressed LGs and in vivo LGs (C, n=4 lobes in each time point). Genotype of the LG was ubi-FUCCI. p Values in the G1 group of (A) were 0.9083, 0.9998, 0.5148, and 0.9462, respectively. p Values in the S group of (A) were 0.9661, 0.5493, 0.6408, and 0.8639, respectively. p Values in the G2 group of (A) were 0.6064, 0.6378, 0.999, and 0.9989, respectively. (D–E) Quantification of EdU incorporation in ex vivo cultured LGs and in vivo LGs that were all matched in their developmental stages. Sample sizes listed on the graph. Genotype of the LG was w1118. p Values in (D) were 0.915,>0.9999,>0.9999, 0.9186, and 0.9952 in 0 hr, 3 hr, 6 hr, 9 hr, and 12 hr groups, respectively. p Values in the ex vivo group of (E) were 0.9999, 0.9998, 0.997, and 0.9993, respectively. p Values in the in vivo group of (E) were 0.8422, 0.9212, 0.9939, and 0.9523, respectively. (F) Scatter plot demonstrating when individual progenitors divided relative to the start of each video (on x axis) against how long these progenitors spent in mitosis (on y axis) from multiple long-term videos (n=9 videos in total, video duration ranging from 14 to 17 hr). (G) Quantification of differentiation index (shown as a ratio of the number of eater+ cells/ the number of dome+ cells) in ex vivo cultured LGs and in vivo LGs that were all matched in their developmental stages. Genotype of the LG in (F–G): dome-MESO-GFP; eater-dsRed. p Values in (G) were 0.4177, 0.9784, 0.9688 and 0.9403 in 0 hr, 3 hr, 6 hr and 12 hr groups, respectively. Error bars indicate S.D from the mean. p Values in (A) were determined using two-way ANOVA with Dunnett’s multiple comparisons test. p Values in (D), (E), and (G) were determined using two-way ANOVA with Sidak’s multiple comparisons test. ns indicates p>0.05.
-
Figure 1—figure supplement 3—source data 1
Raw data of Figure 1—figure supplement 3A, B, C, D, E, F, G.
- https://cdn.elifesciences.org/articles/84085/elife-84085-fig1-figsupp3-data1-v2.xlsx
Figure 2 with 2 supplements
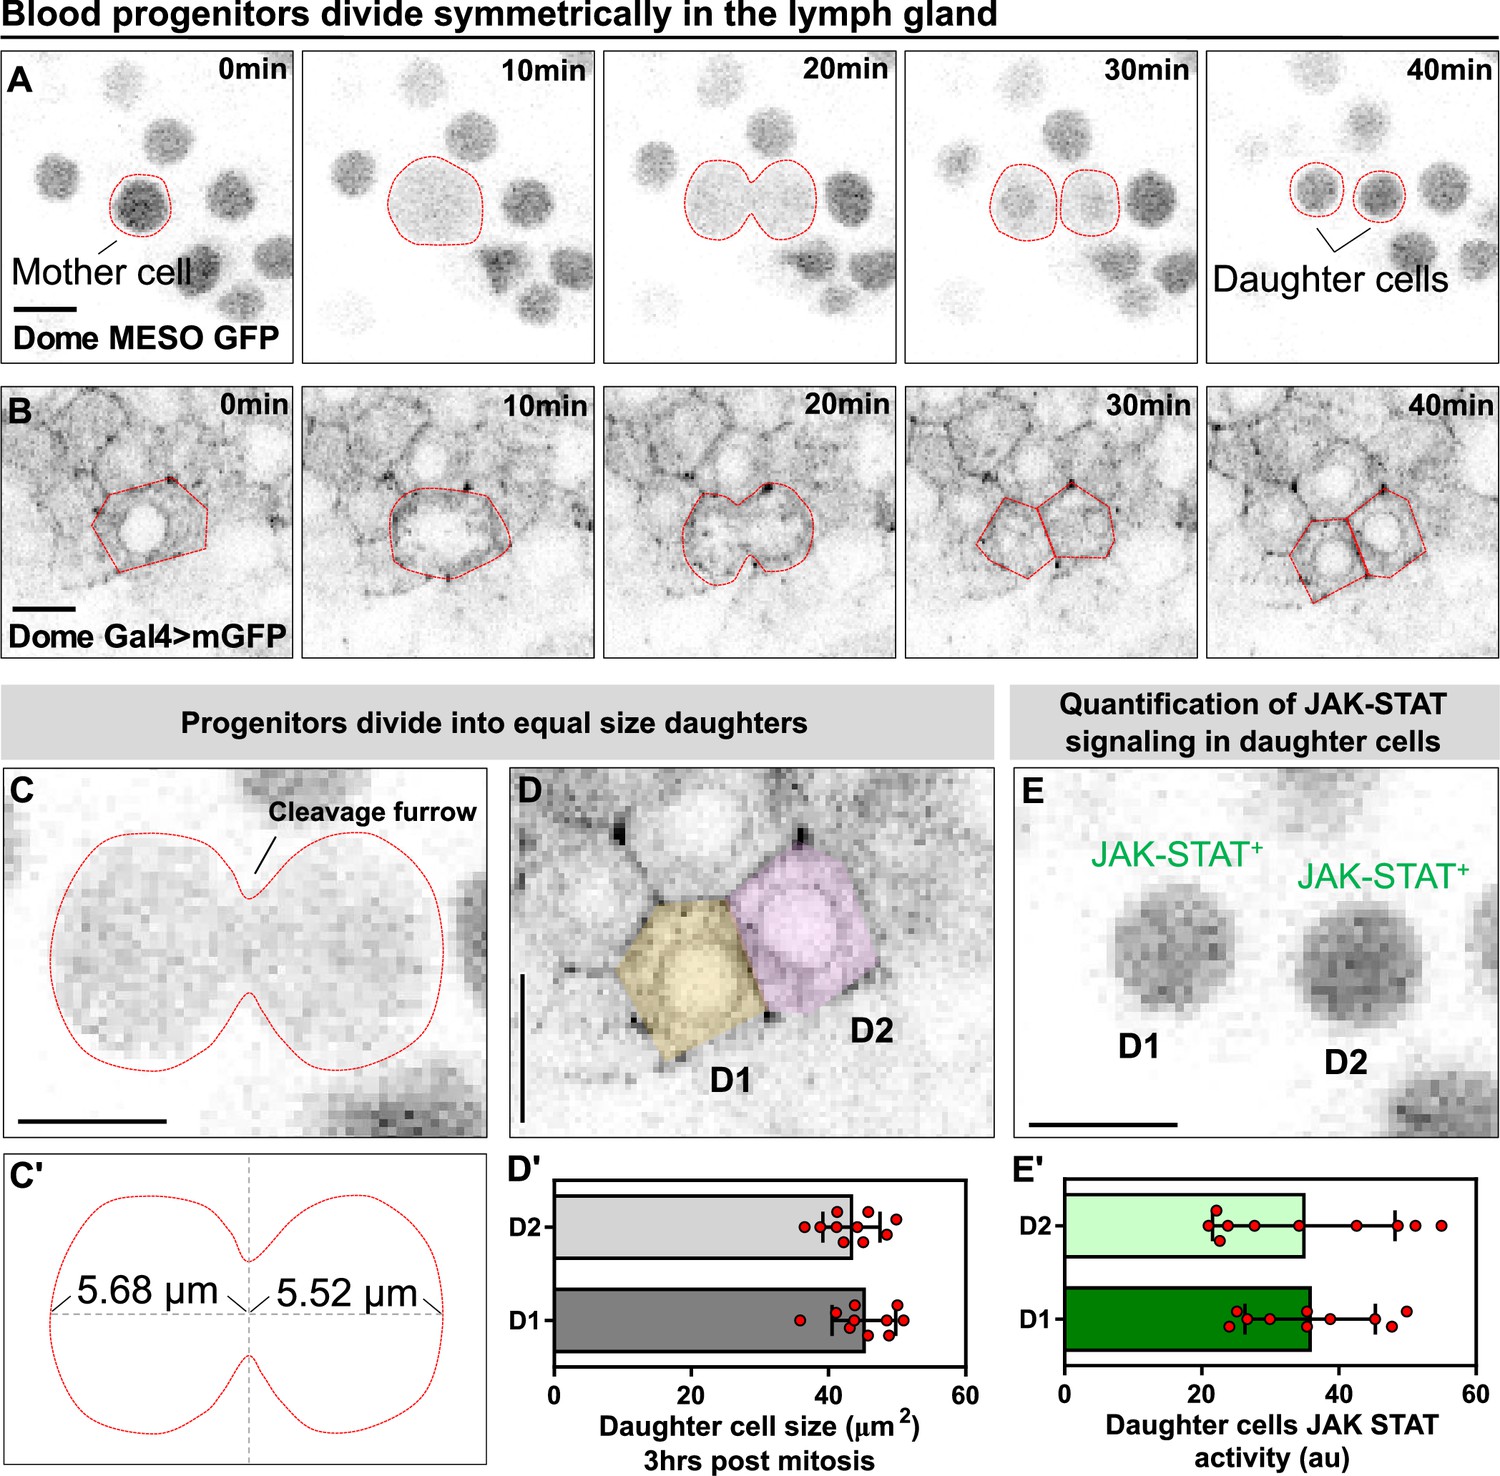
Blood progenitors undergo symmetric divisions in the LG.
(A, B) Time-lapse images from representative videos showing a blood progenitor (labelled as “mother cell”) undergoing symmetric division over the course of 40 min (progenies labelled as ‘daughter cells’). Blood progenitors were labelled with dome-MESO-GFP (grey) and highlighted with red outline (A) or labelled with dome-Gal4 driven membranous GFP (grey) and highlighted with red outline (B). (C-C’) Representative image of the contractile ring positioned at the cleavage furrow of a dividing blood progenitor (C) and a schematic illustrating the distance between the contractile ring to the two poles of the cell (C’, μm). (D-D’) Representative image (D) and quantification (D’) of the cell area (μm2) of the two daughter cells 3 hrs post mitosis (n=10 daughter cell pairs randomly pooled from 3 videos). (E-E’) A representative image (E) and quantification (E’) of the JAK-STAT signaling activity (a.u) of the daughter cells (n=10 daughter cell pairs randomly pooled from 7 videos). All scale bars represent 5 μm. The genotype of the LGs shown in (A), (C), (E) was dome-MESO-GFP; eater-dsRed and in (B), (D) was dome-Gal4 >UAS mGFP; eater-dsRed. Error bars indicate S.D from the mean. See also Video 4.
-
Figure 2—source data 1
Raw data of Figure 2D and E.
- https://cdn.elifesciences.org/articles/84085/elife-84085-fig2-data1-v2.xlsx
Figure 2—figure supplement 1
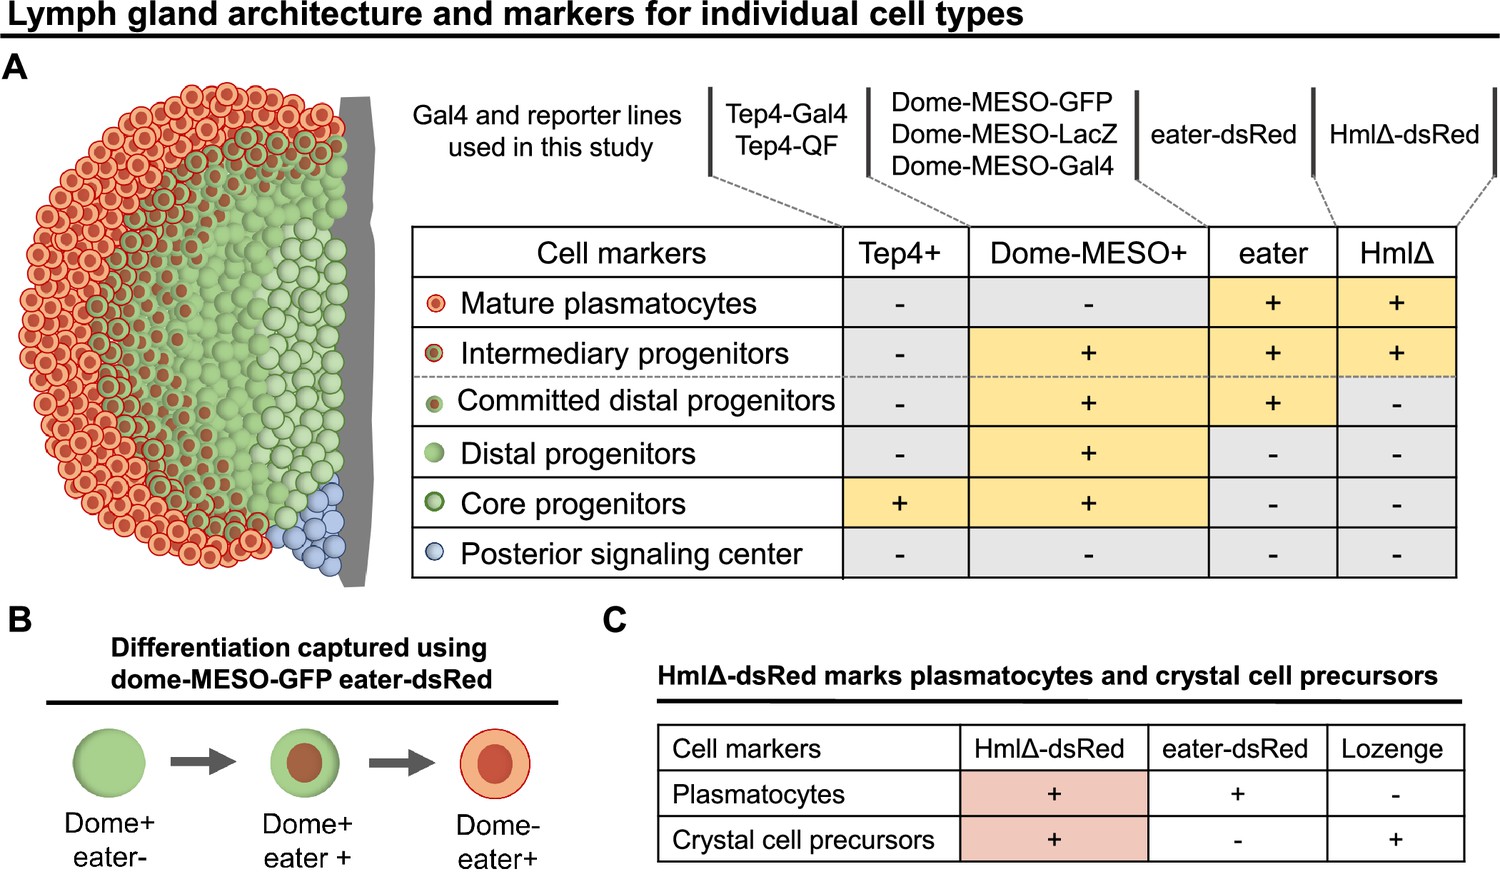
Genetic tools and markers to study blood progenitor cell fate transition during hematopoiesis.
(A) LG schematic and genetic tools including Gal4 and reporter lines that were used in different combinations in the current study to reveal different cell types and cell states in the LG. Cell types defined following Blanco-Obregon et al., 2020. ‘Committed distal progenitors’ represent distal progenitors that commit to a plasmatocyte cell fate. (B) Differentiation events were tracked using a combination of dome-MESO-GFP and eater-dsRed markers. (C) Table summarized from Blanco-Obregon et al., 2020 and Girard et al., 2021 showing eater-dsRed is a more specific marker than HmlΔ-dsRed to be used to track plasmatocyte differentiation. HmlΔ-dsRed: a marker for mature hemocytes including both plasmatocytes and crystal cells. Eater-dsRed: a marker that is expressed weakly in distal blood progenitors committed to a plasmaotcyte cell fate but is expresssed strongly in mature plasmatocytes. Lozenge: a crystal cell-specific marker.
Figure 2—figure supplement 2
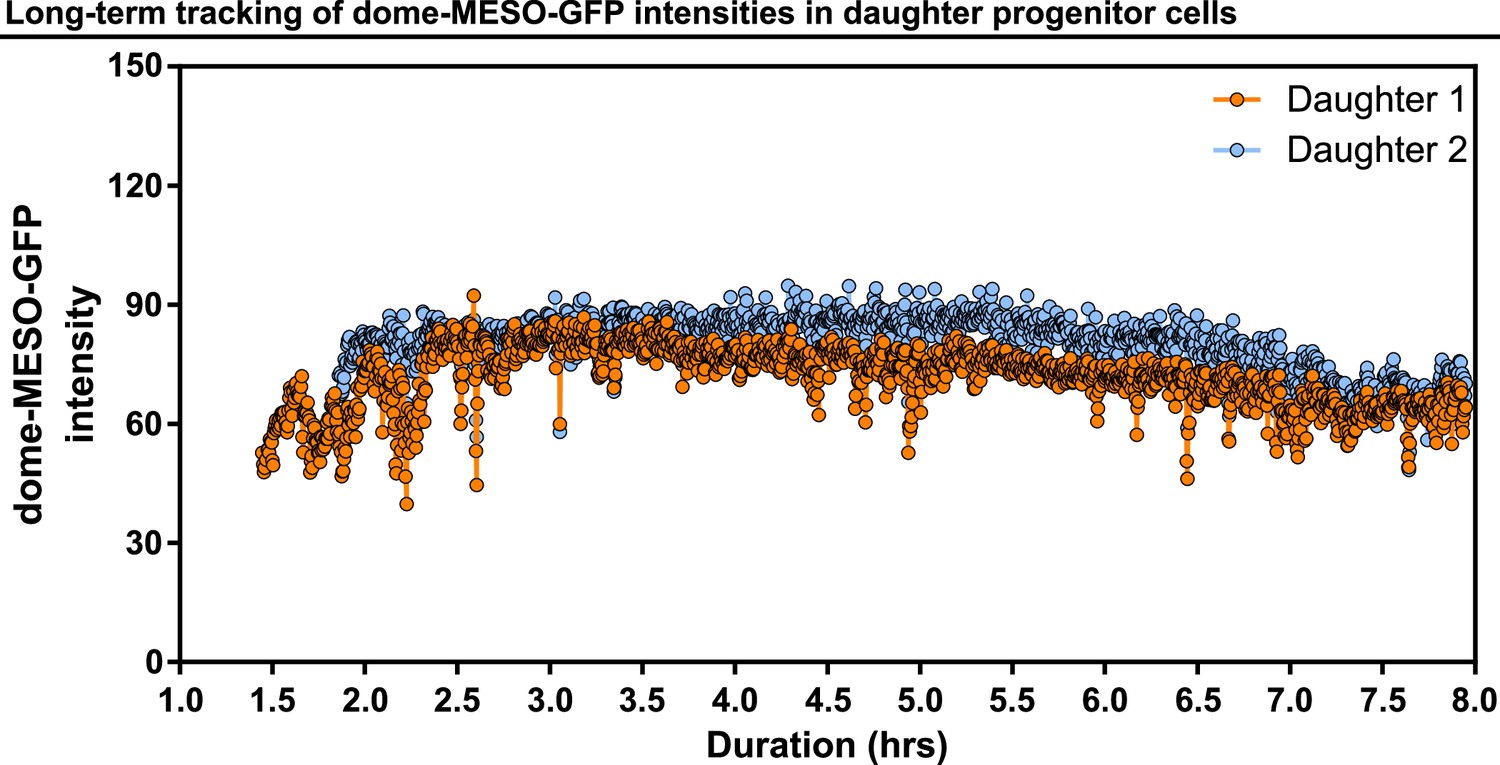
Long-term tracking of dome-MESO-GFP intensities in daughter progenitor cells.
Example showing real-time tracking of dome-MESO-GFP fluorescent intensities of two daughter cells over 8 hr. Each dot represents the level of dome-MESO-GFP intensity at a single time point.
-
Figure 2—figure supplement 2—source data 1
Raw data of Figure 2—figure supplement 2.
- https://cdn.elifesciences.org/articles/84085/elife-84085-fig2-figsupp2-data1-v2.xlsx
Figure 3 with 1 supplement
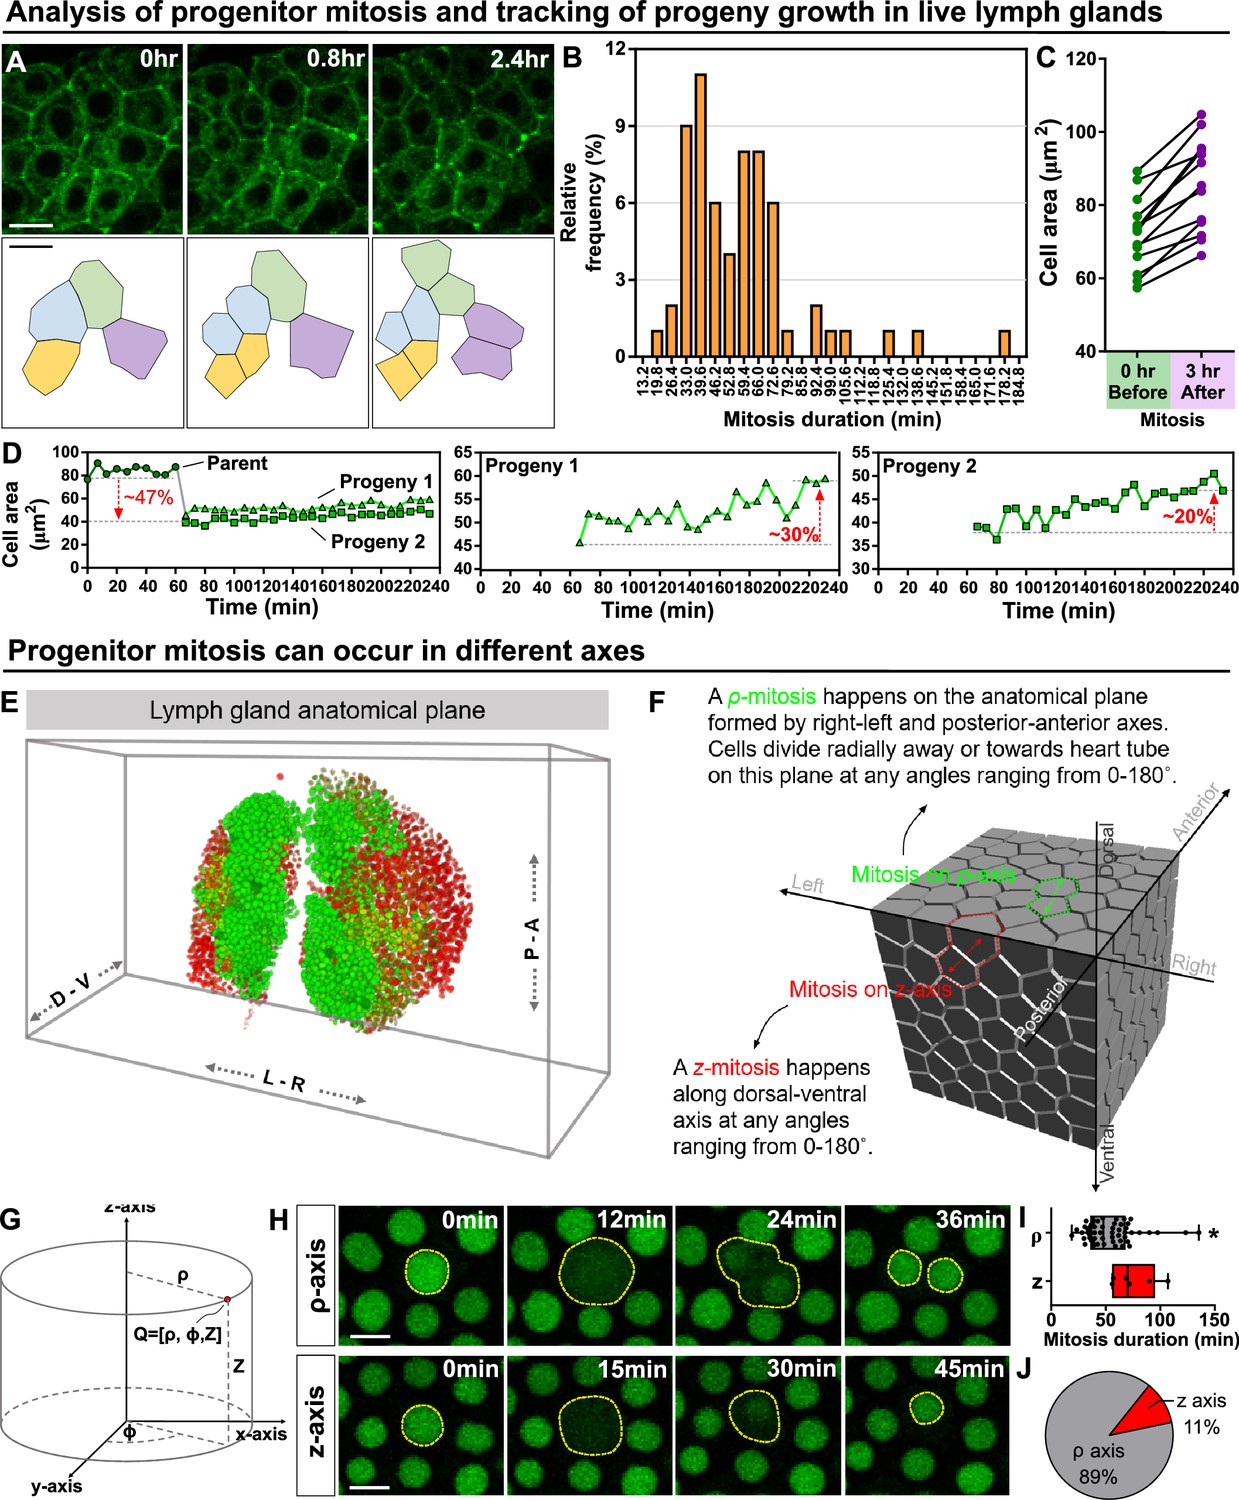
Kinetics of blood progenitor mitosis, progeny growth, and mitotic axes in the LG.
(A) Top panel: time-lapse images from a representative video showing multiple dividing blood progenitors over 2.4 hr. Blood progenitors labelled with dome-Gal4 driven membranous GFP (of genotype dome-Gal4 >mGFP; eater-dsRed). Bottom panel: schematic of four dividing blood progenitors and their progenies outlined based on the fluorescent images from the top panel. (B) Histogram showing the distribution of the duration of mitosis (in minutes) of blood progenitors (n=63 dividing blood progenitors collected from 10 videos). The majority of blood progenitors spent an average of 33–73 min in mitosis. (C) Quantification of the cell area (μm2) of mother blood progenitors 10 min before mitosis (data highlighted in the left panel, each data point represents a mother cell) and cell area summed up from two generated progenies 3 hr after mitosis (data highlighted in the right panel, each data point represents cell area summed up from two generated progenies; n=10 progenitors of genotype dome-Gal4 >UAS mGFP; eater-dsRed undergoing mitosis tracked over 3 hr). (D) Representative example selected from (C) showing the quantification of progeny growth (reflected by their cell area, μm2). Left panel: real-time measurement of the cell area of the parent (or mother) cell, progeny 1, and progeny 2. Middle and right panels: changes in the ell area of progeny 1 and 2 over time, respectively. (E) Schematic showing anatomical axes of a 3D LG (A: anterior, P: posterior, L: left, R: right, D: dorsal, V: ventral; blood progenitors marked by dome-MESO-GFP in green, mature hemocytes marked by eater-dsRed in red). The LG is shown following a convention established previously for a 3D representation of the fly CNS (Zheng et al., 2018). (F) Detailed schematic showing mitotic events happening on the ρ and z axes with respect to the anatomical axes. Concept of ρ and z axes is derived from the cylindrical coordinate system (as shown in G; see Methods). The 3D cell matrix was built using codes from Geogram Delaunay3D. (G) Diagram showing the cylindrical coordinate system (ρ-, ϕ-, z-axes) compared to a Cartesian coordinate systems (x-, y-, z-axes). (H) Time-lapse images from representative videos of progenitor mitotic events occurring along the ρ-axis over 36 min (top panel) or along the z-axis over the course of 45 min (bottom panel). Blood progenitors labelled with dome-MESO-GFP (green, LG genotype: dome-MESO-GFP; eater-dsRed). (I) Quantification of the durations (in minutes) of blood progenitor mitotic events occurring along the ρ-axis (n=54 progenitors) and z-axis (n=6 progenitors). p-value = 0.022 was determined using Mann-Whitney-Wilcoxon test. * indicates p<0.05. (J) Pie graph showing the percentage of recorded blood progenitor mitotic events occurring along the ρ-axis and z-axis. The data in Figure 2A, C, E and (F–H) came from the same live imaging experiments but different cells were analysed and presented. The data in Figure 2B, D and (A–D) came from the same live imaging experiments but different cells were analysed and presented. All scale bars represent 5 μm. Error bars indicate S.D from the mean. See also Video 4.
-
Figure 3—source data 1
Raw data of Figure 3B, C, D, I, J.
- https://cdn.elifesciences.org/articles/84085/elife-84085-fig3-data1-v2.xlsx
Figure 3—figure supplement 1
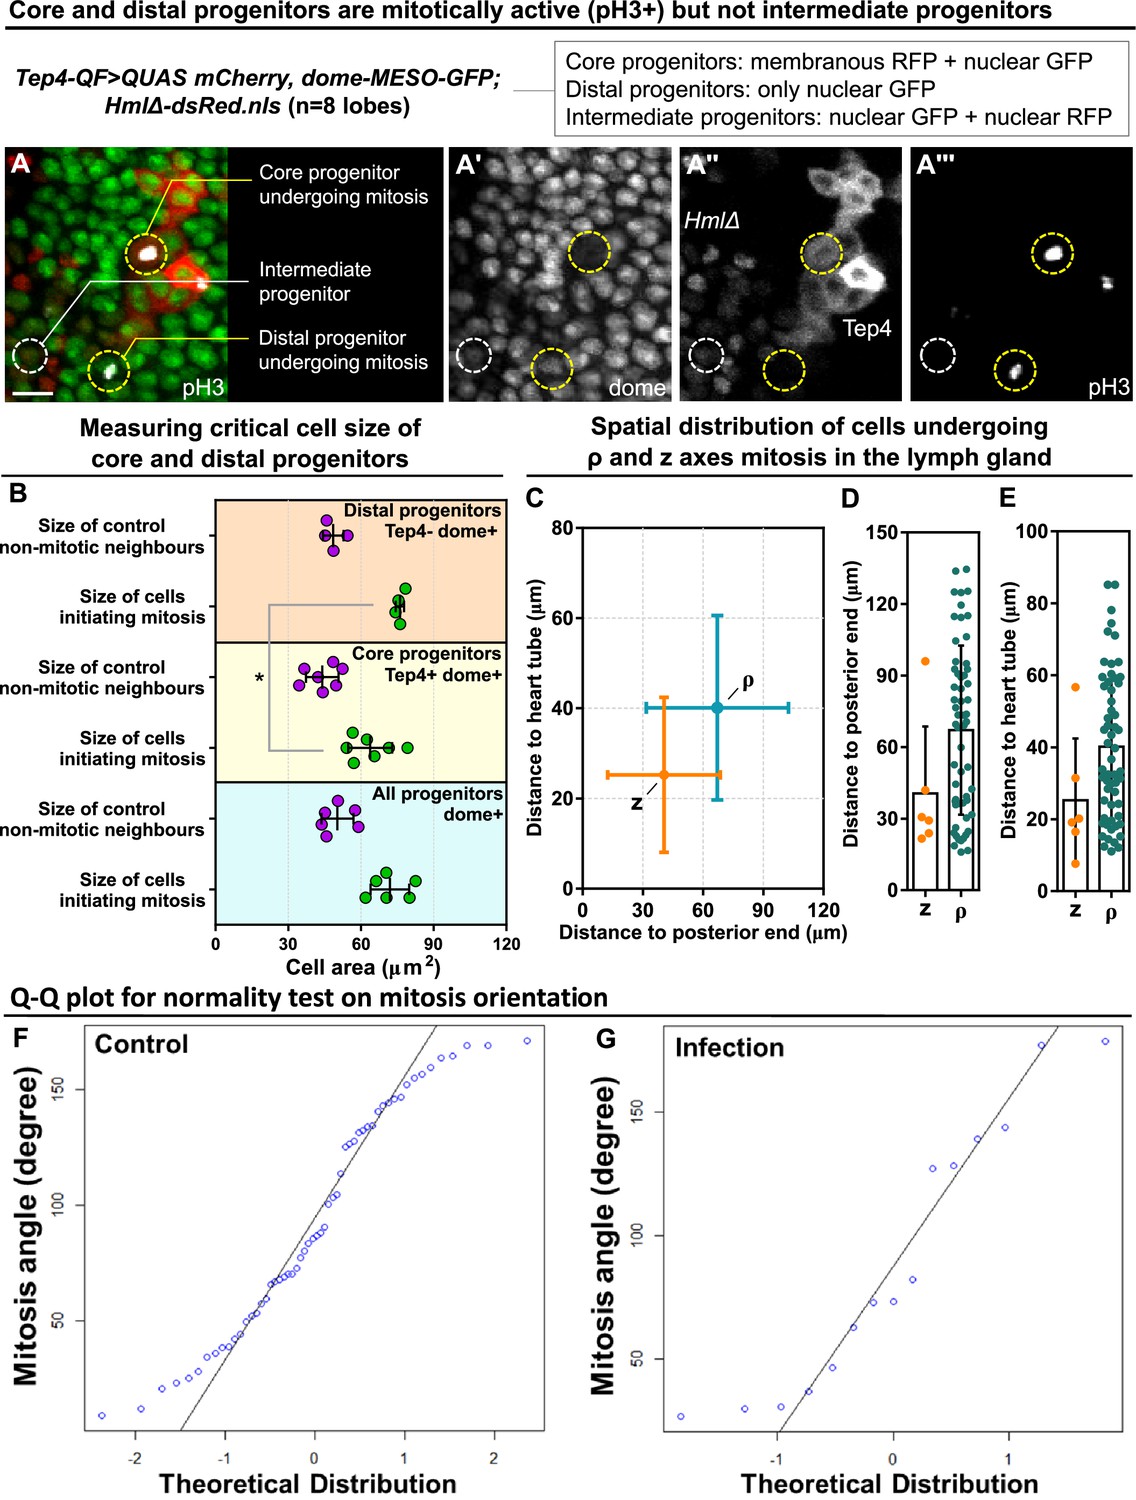
Critical cell size and spatial distribution of blood progenitor divisions.
(A-A’’’) Representative images showing core and distal progenitors are mitotically active revealed by pH3 staining (n=8 lobes analyzed). Core progenitors labelled by both Tep4-Cherry and dome-MESO-GFP (membranous RFP+ nuclear GFP+). Distal progenitors labelled by only dome-MESO-GFP (only nuclear GFP+). Intermediary progenitors labelled by both dome-MESO-GFP and HmlΔ-dsRed (nuclear GFP+ nuclear RFP+). Genotype of the LG was Tep4-QF/dome-MESO-GFP; QUAS-mCherry/HmlΔ-dsRed. (B) Quantification of cell size of mitotic distal progenitors (Tep4- dome+, n=4 cells pooled from 3 videos), neighbor non-mitotic distal progenitors (n=4 cells pooled from 3 videos), mitotic core progenitors (Tep4+ dome+, n=6 cells pooled from 4 videos), neighbor non-mitotic core progenitors (n=6 cells pooled from 4 videos), mitotic dome+ progenitors (all dome+, n=6 cells pooled from 3 videos), and neighbor non-mitotic dome+ progenitors (n=6 cells pooled from 3 videos). p-value = 0.0111 determined using two-tailed unpaired Student t-test with Welch’s correction. * indicates p<0.05. (C–E) Quantification of distances from the progenitors undergoing ρ or z-mitosis to the posterior end of the lymph gland where the PSC is located (C, D) and to the heart tube (C, E). (F–G) Q-Q plots of mitosis orientations of blood progenitors from the LGs of wild-type control (F) and infected larvae (G; data from Figure 4L; see Methods). Scale bar in (A) represents 15 μm. Error bars indicate S.D from the mean.
-
Figure 3—figure supplement 1—source data 1
Raw data of Figure 3—figure supplement 1B, C, D, E, F, G.
- https://cdn.elifesciences.org/articles/84085/elife-84085-fig3-figsupp1-data1-v2.xlsx
Figure 4 with 2 supplements
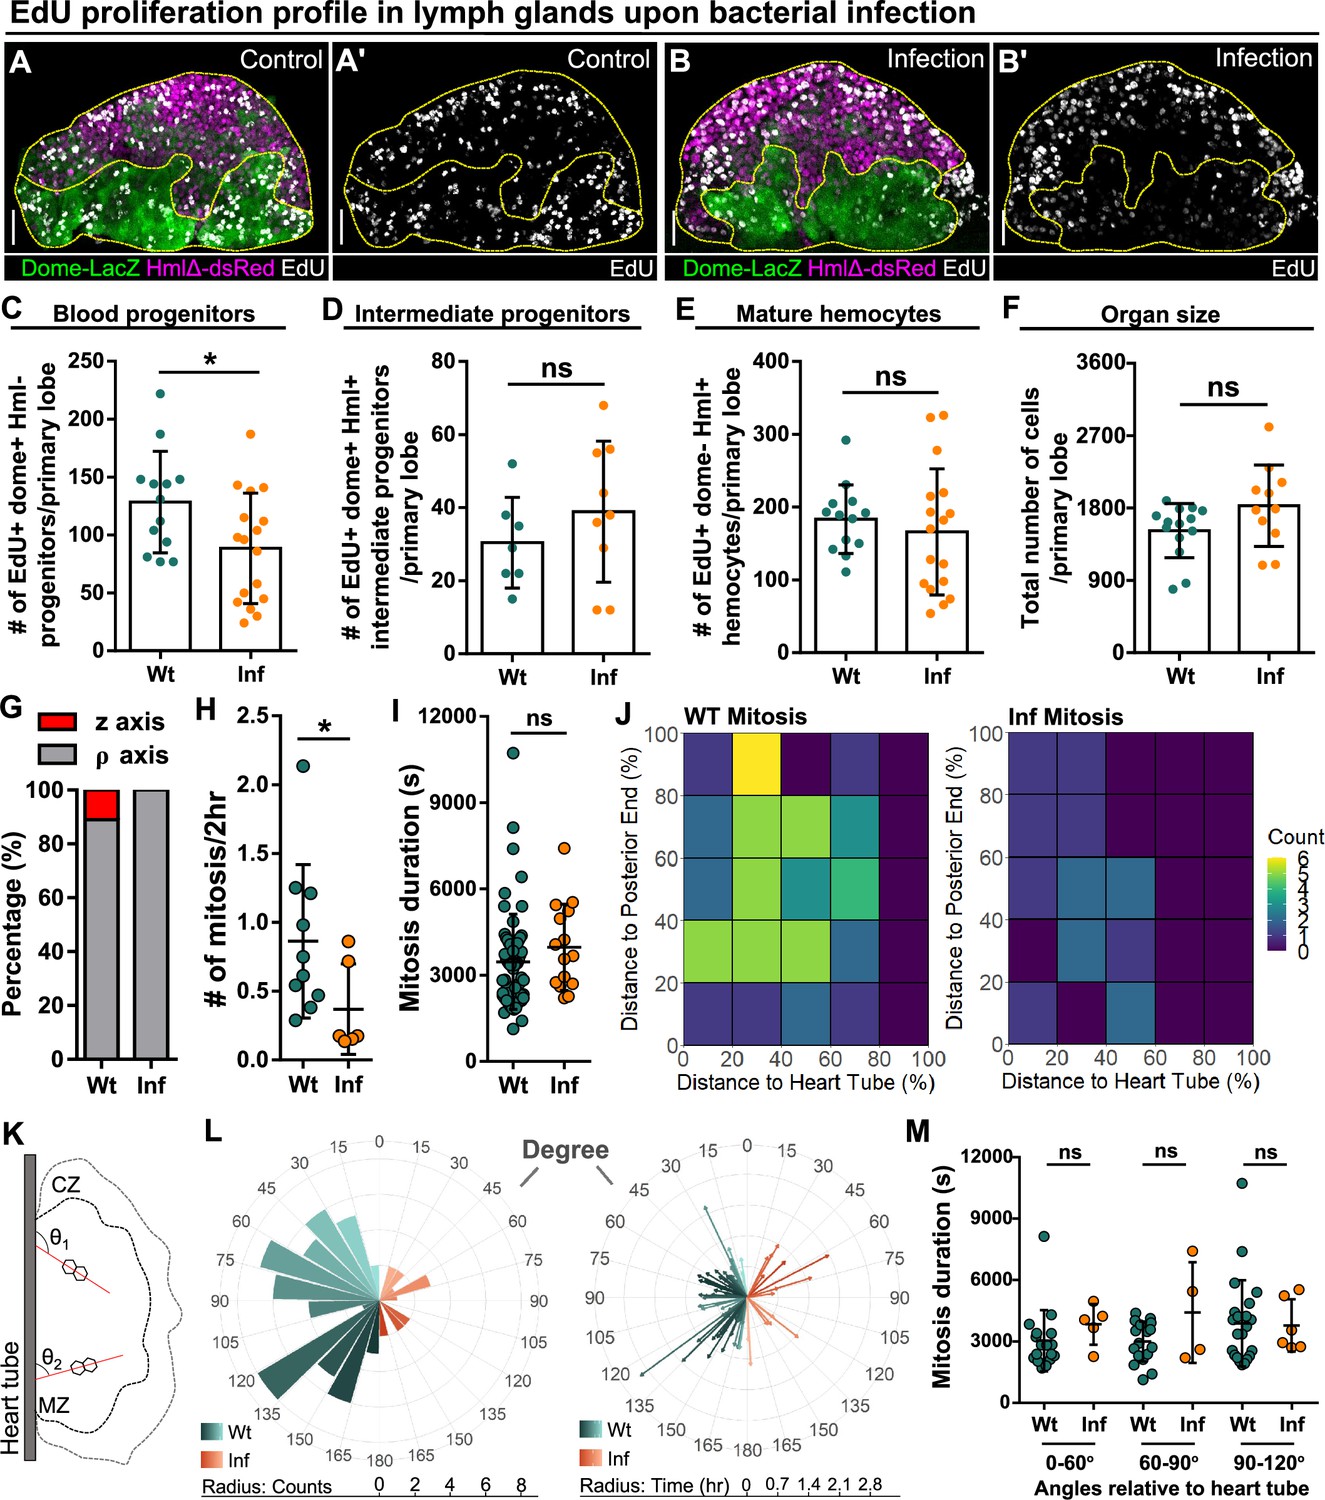
Reduction of blood progenitor proliferation upon infection.
(A–E) Representative images (A–B) and quantification of EdU incorporation in blood progenitors (C, dome+ Hml-, n=13 lobes in wild-type control, n=17 lobes in infection group, P-value = 0.032), intermediate progenitors (D, dome+ Hml+, n=13 lobes in wild-type control, n=17 lobes in infection group, p-value = 0.336), and mature hemocytes (E, dome- Hml+, n=7 lobes in wild-type control, n=9 lobes in infection group, p-value = 0.3465) in LGs from wild-type control and E. coli infected larvae. Proliferating cells (or cells actively synthesizing DNA) labelled with EdU (white). Progenitors labelled with dome-MESO-LacZ (green). Mature hemocytes labelled with HmlΔ-dsRed (magenta). Genotype of the LG was dome-MESO-LacZ; HmlΔ-dsRed. (F) Quantification of the total number of cells per primary lobe from wild-type control (n=14 lobes) and E. coli infected larvae (n=11 lobes). p-value = 0.0872. (G) Quantification of the percentage of mitotic events occurring in blood progenitors along either the z-axis or the ρ-axis in LGs from wild-type control and E. coli infected larvae. (H) Quantification of the number of mitotic events in blood progenitors in LGs from wild-type control (n=10 videos) and E. coli infected larvae (n=6 videos). p-value = 0.0397. (I) Quantification of the duration of mitotic events in LGs from wild-type control (n=63 dividing progenitors) and E. coli infected larvae (n=15 dividing progenitors). p-value = 0.1365. (J) Heat maps summarising data from long-term imaging experiments showing the number of mitotic events recorded in distinct regions of LGs from wild-type control and E. coli infected larvae (see Materials and methods). (K) Schematic illustrating the orientation (θ1 and θ2) of the ρ-mitosis with respect to the heart tube. CZ: cortical zone, MZ: medullary zone. (L) Left panel: rose diagram showing the distribution of the orientation of mitotic events (in degree) in LGs from wild-type control and E. coli infected larvae. Radius corresponding to the number of mitotic events recorded. Right panel: rose diagram showing the duration (in hrs) of each mitotic event occurring at different orientations from wild-type control and E. coli infected larvae. Radius corresponding to the duration of mitotic events. (M) Quantification of the duration of progenitor mitotic events occurring at different angles relative to the heart tube (0°–60°, 60°–90°, and 90°–120°) in LGs from wild-type control and E. coli infected larvae (p-value = 0.0824, 0.4342, and 0.6331 in 0°–60°, 60°–90°, and 90°–120° groups, respectively). Mitotic progenitors analysed in (G–M) were all dome+ progenitors from LGs having the following genotype: dome-MESO-GFP; eater-dsRed. Scale bars in (A-A’ and B-B’) represent 40 μm. Error bars indicate S.D from the mean. p Values were determined using Mann-Whitney-Wilcoxon test. ns indicates non-significant, p>0.05. * indicates p<0.05.
-
Figure 4—source data 1
Raw data of Figure 4C, D, E, F, G, H, I, L, M.
- https://cdn.elifesciences.org/articles/84085/elife-84085-fig4-data1-v2.xlsx
Figure 4—figure supplement 1
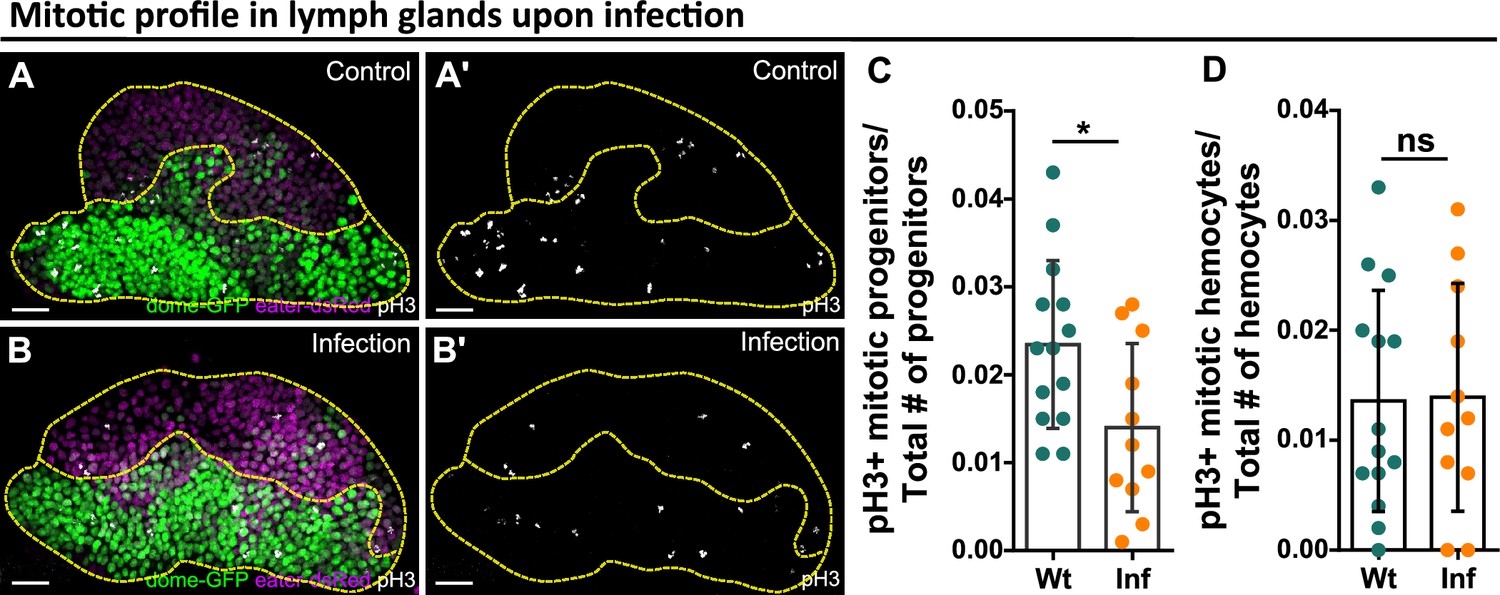
Reduction of blood progenitor divisions upon infection.
(A–D) Representative images (A–B) and quantification of the number of mitotically active blood progenitors (C, dome+ eater-, p-value = 0.023) and mitotically active mature hemocytes (D, dome- eater+, p-value = 0.9355) in LGs from wild-type control (n=14 lobes) and E. coli infected larvae (n=11 lobes). Blood progenitors labelled by dome-MESO-GFP (green). Mature hemocytes labelled by eater-dsRed (magenta). Mitotic cells labelled by pH3 staining (white). Genotype of the LG was dome-MESO-GFP; eater-dsRed. Scale bars in (A) and (B) represent 20 μm. Error bars indicate S.D from the mean. Statistical significance was determined using two-tailed unpaired Student t-test with Welch’s correction. * indicates p<0.05. ns indicates p>0.05.
-
Figure 4—figure supplement 1—source data 1
Raw data of Figure 4—figure supplement 1C, D.
- https://cdn.elifesciences.org/articles/84085/elife-84085-fig4-figsupp1-data1-v2.xlsx
Figure 4—figure supplement 2
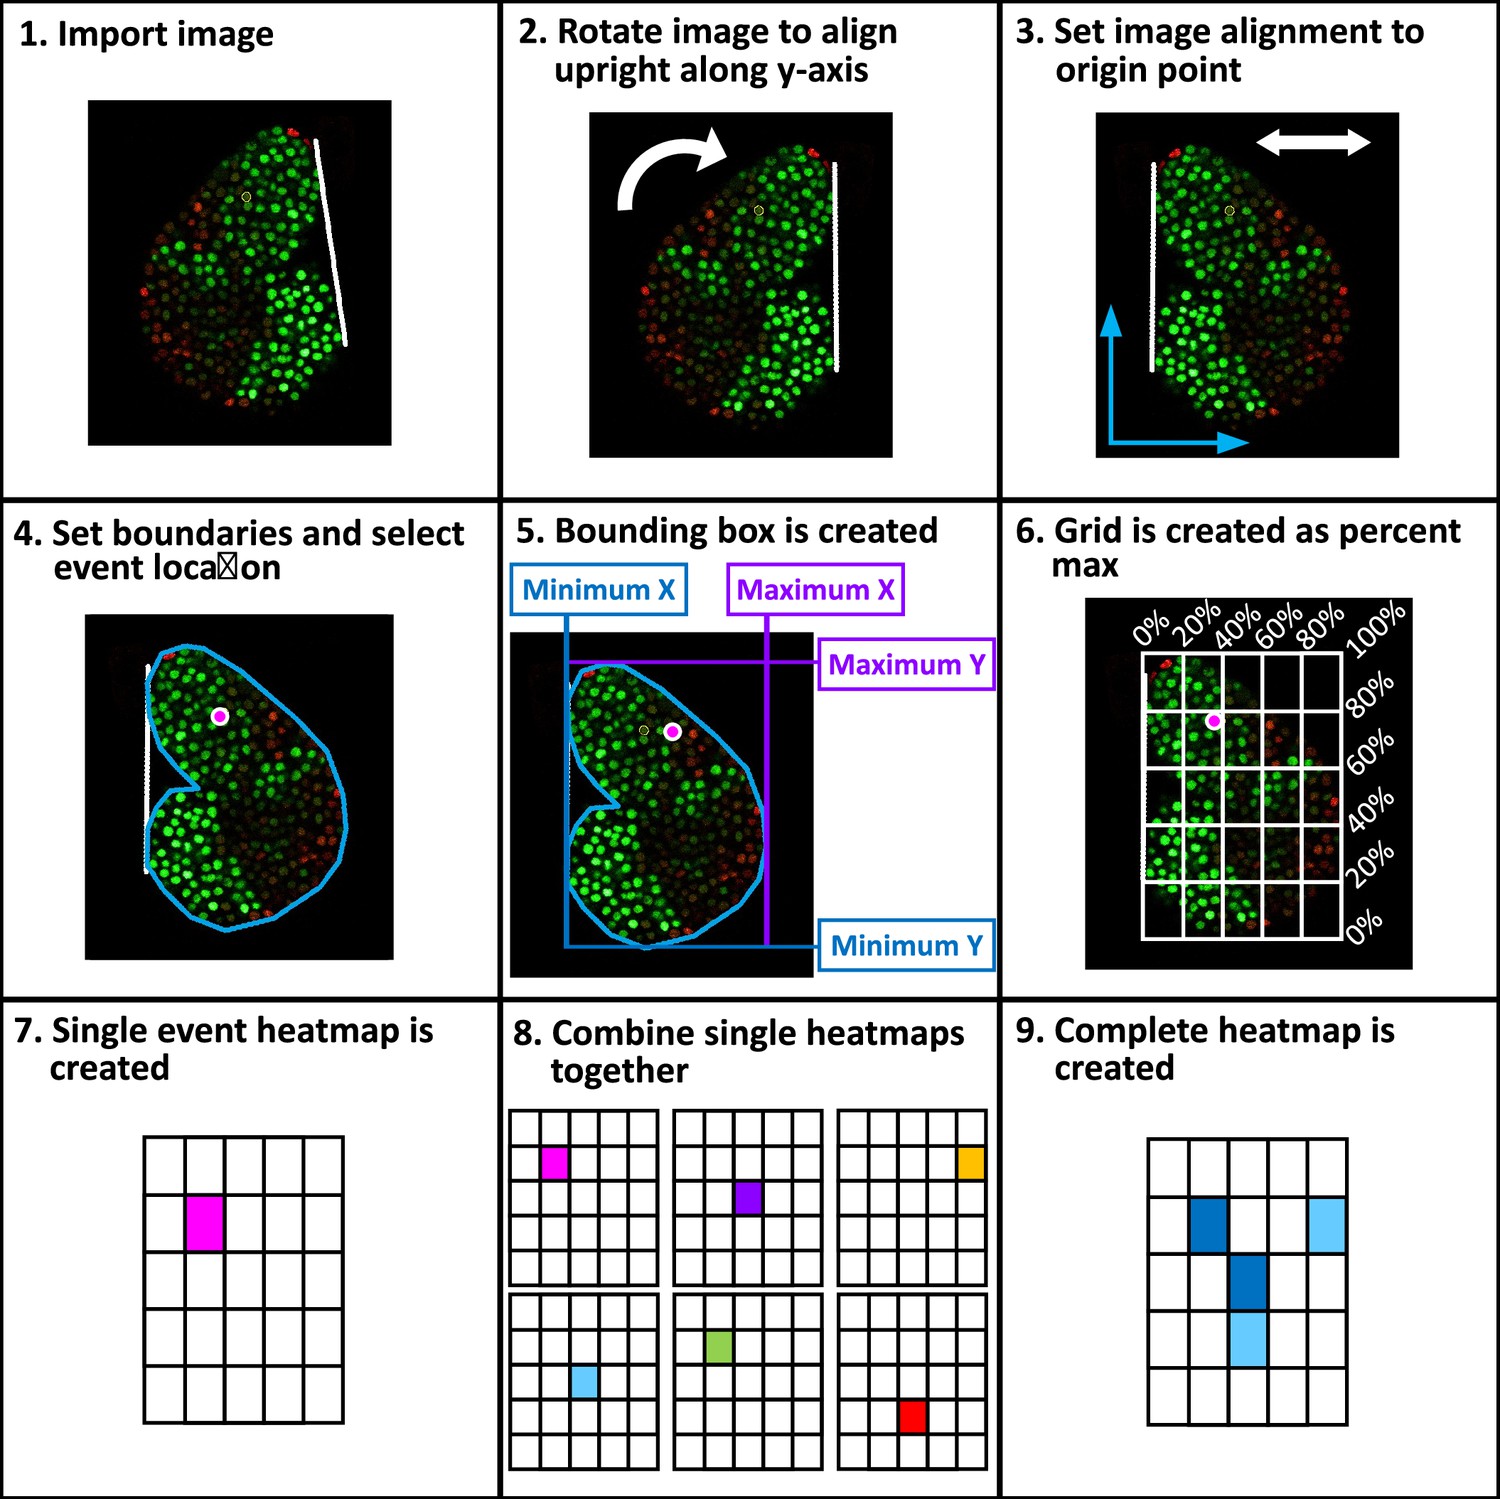
Workflow of spatial analysis on cell divisions and differentiations.
A step-by-step schematic introducing the methodology applied to extract spatial information of cellular events (including mitosis and differentiation) from long-term LG live imaging videos (detailed in the Methods). 9 steps in total are included: 1. Image import, 2. Image rotation, 3. Image alignment, 4. Boundaries set, 5. Bounding box created, 6. Grid applied, 7. Single cellular event created, 8. Combination of heatmaps, and 9. Final heatmap construction.
Figure 5 with 1 supplement
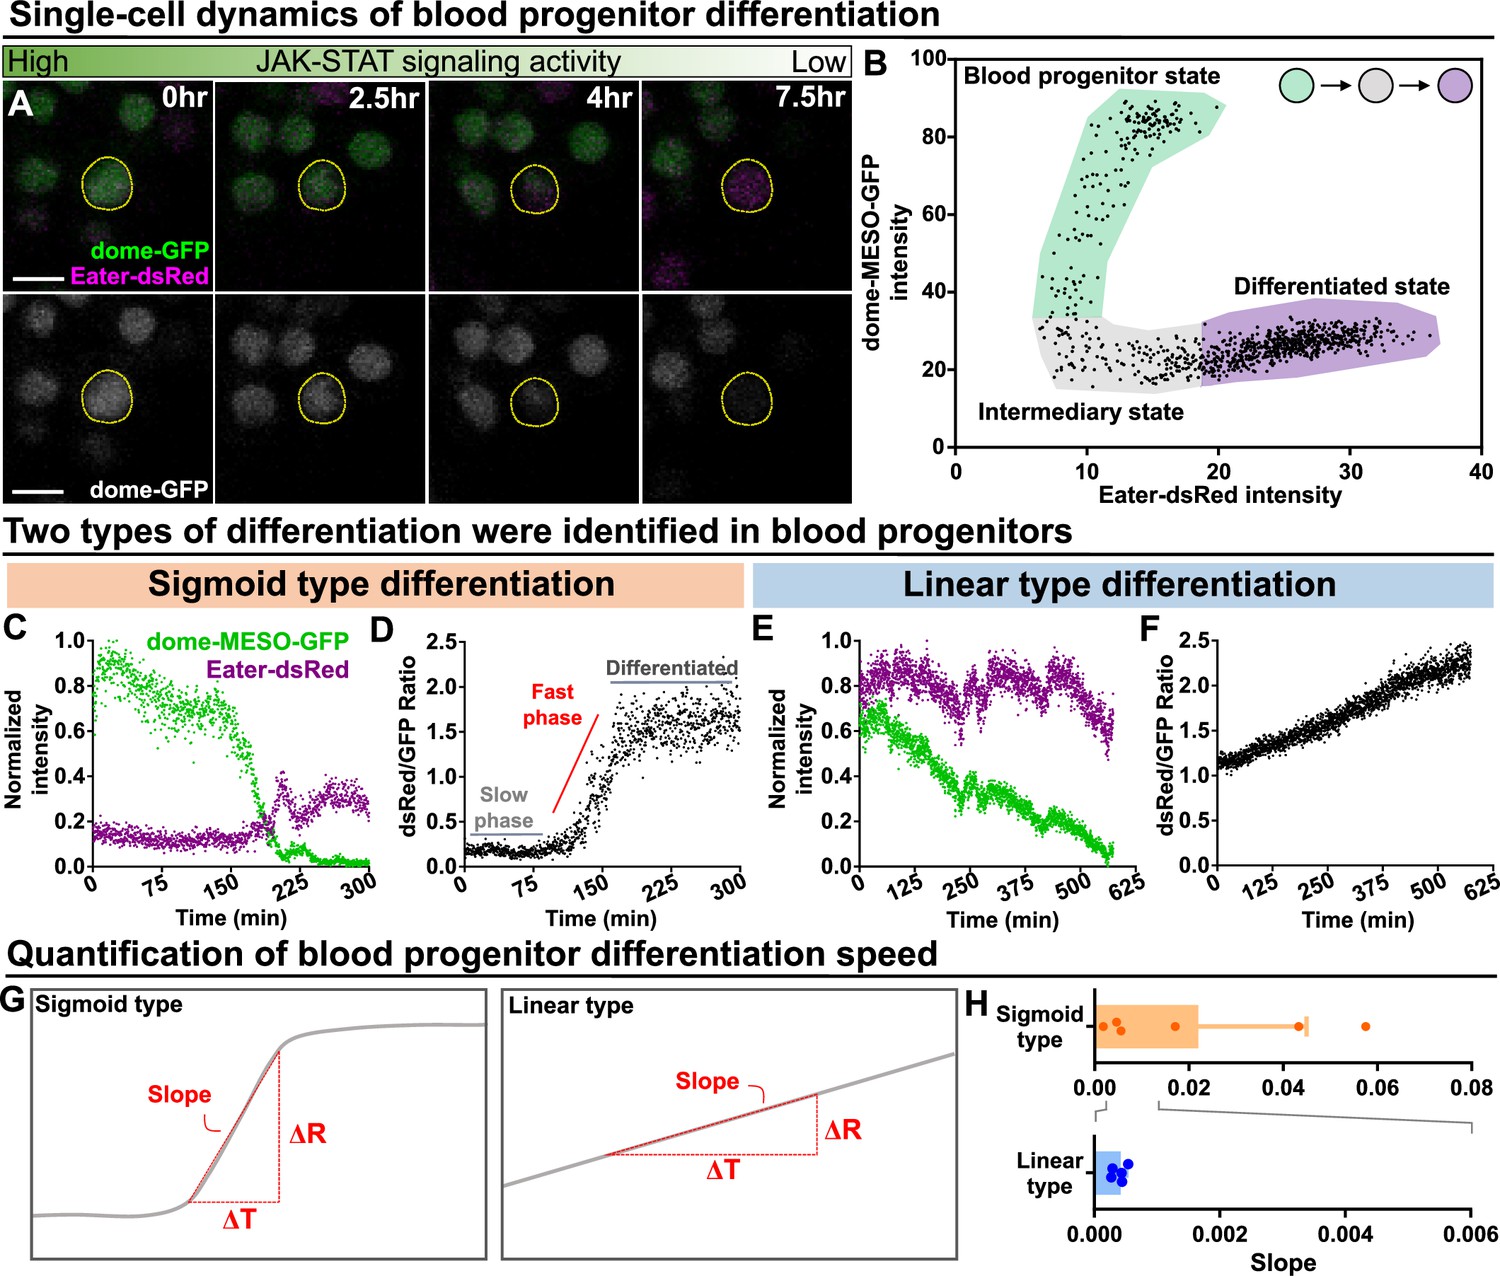
Long-term imaging identifies distinct dynamics of blood progenitor differentiation.
(A) Time-lapse images of blood progenitor differentiation over the course of 7.5 hrs. Blood progenitors labelled with dome-MESO-GFP (green in top panel, white in below panel). Mature hemocytes labelled with eater-dsRed (magenta). (B) Example showing real-time tracking of dome-MESO-GFP and eater-dsRed fluorescent intensities of a progenitor over time. Each dot represents a single time point. (C–D) Examples showing normalized intensities of dome-MESO-GFP and eater-dsRed (C) and dsRed/GFP ratio (D) in blood progenitors undergoing sigmoid type differentiation over the course of roughly 300 min. Each dot represents the fluorescent intensity (C) or ratio (D) of dome-MESO-GFP or eater-dsRed at that time point. (E–F) Examples showing normalized intensities of dome-MESO-GFP and eater-dsRed (E) and dsRed/GFP ratio (F) in blood progenitors undergoing linear type differentiation over the course of roughly 560 min. Each dot represents the fluorescent intensity (E) or ratio (F) of dome-MESO-GFP or eater-dsRed at that time point. (G) Schematic illustrating the method used to quantify the rate of differentiation in both types (left panel: sigmoid type, right panel: linear type). Changes of dsRed/GFP ratio (ΔR) over a period of time (ΔT) were used to calculate the slope (see Materials and methods). (H) Quantification of differentiation rate (or slope) of the sigmoid type (n=6 blood progenitors collected from 8 videos) and the linear type differentiation (n=5 blood progenitors collected from 8 videos) in wild-type LGs. Genotype of the LG was dome-MESO-GFP; eater-dsRed. Error bars indicate S.D from the mean. See also Video 6 and Video 7.
-
Figure 5—source data 1
Raw data of Figure 5B, C, D, E, F and H.
- https://cdn.elifesciences.org/articles/84085/elife-84085-fig5-data1-v2.xlsx
Figure 5—figure supplement 1
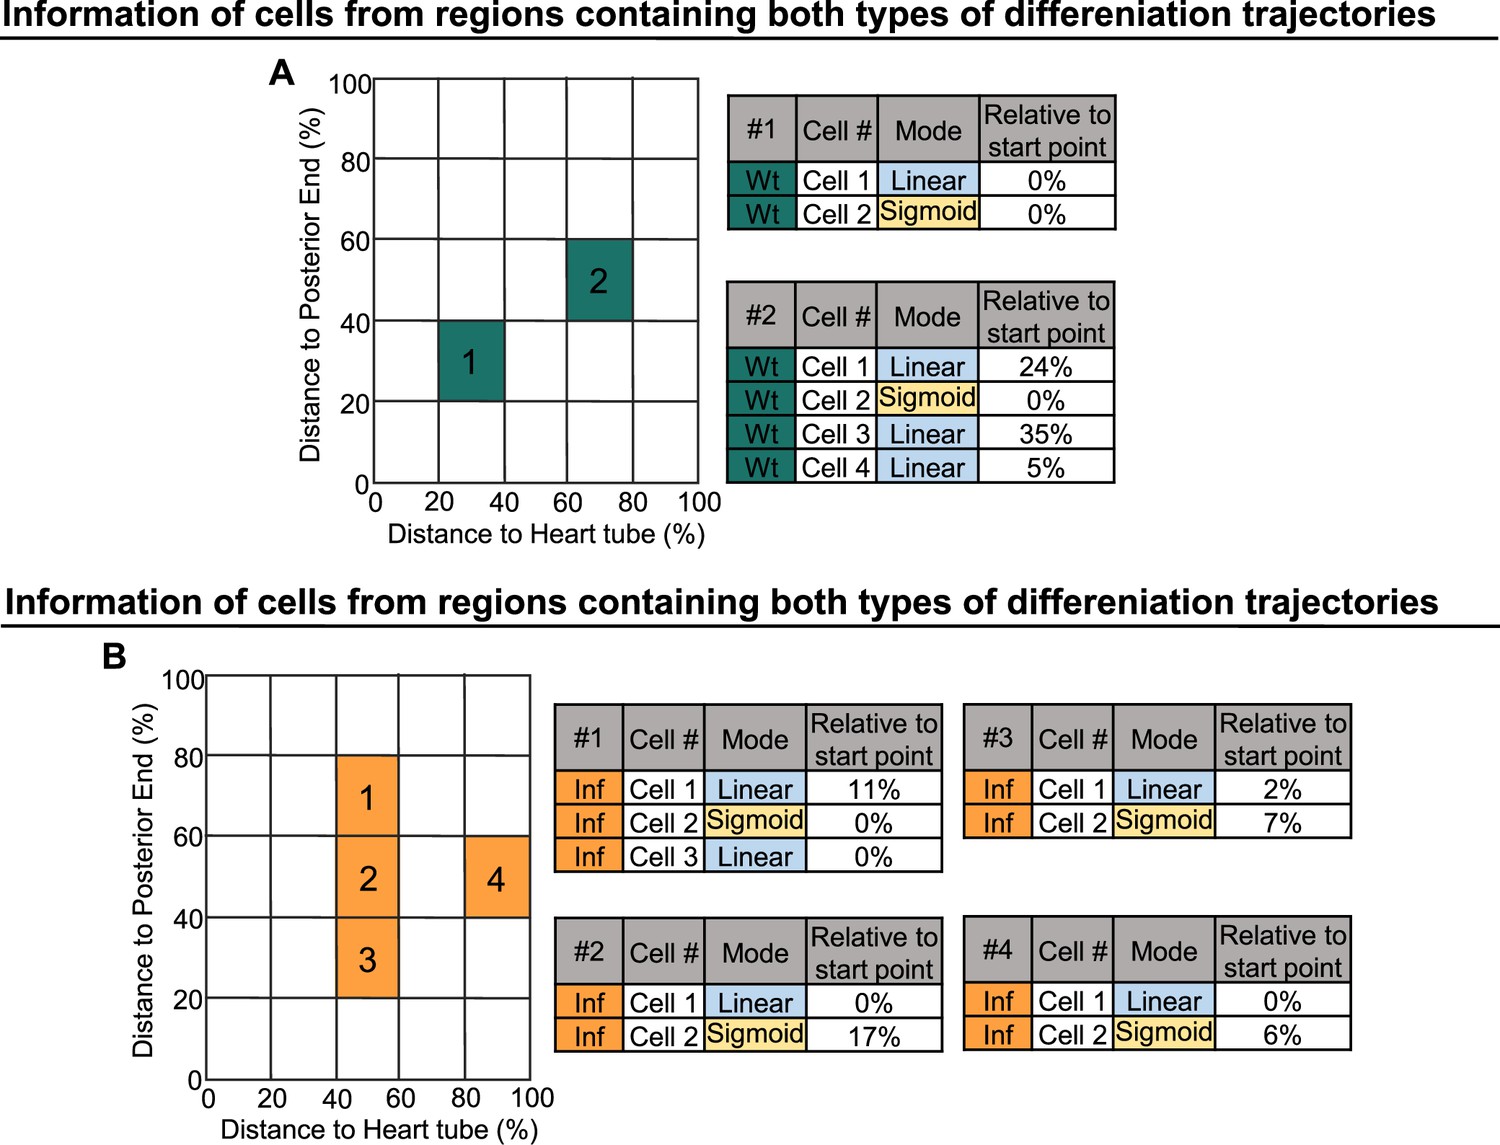
Linear and sigmoid type differentiation can occur in parallel or at distinct time points.
(A) Information derived from cells collected in regions containing cells undergoing sigmoid or linear type of differentiation in wild-type LGs. (B) Information derived from cells of collected in regions containing cells undergoing sigmoid or linear type of differentiation following infection.
Figure 6 with 1 supplement
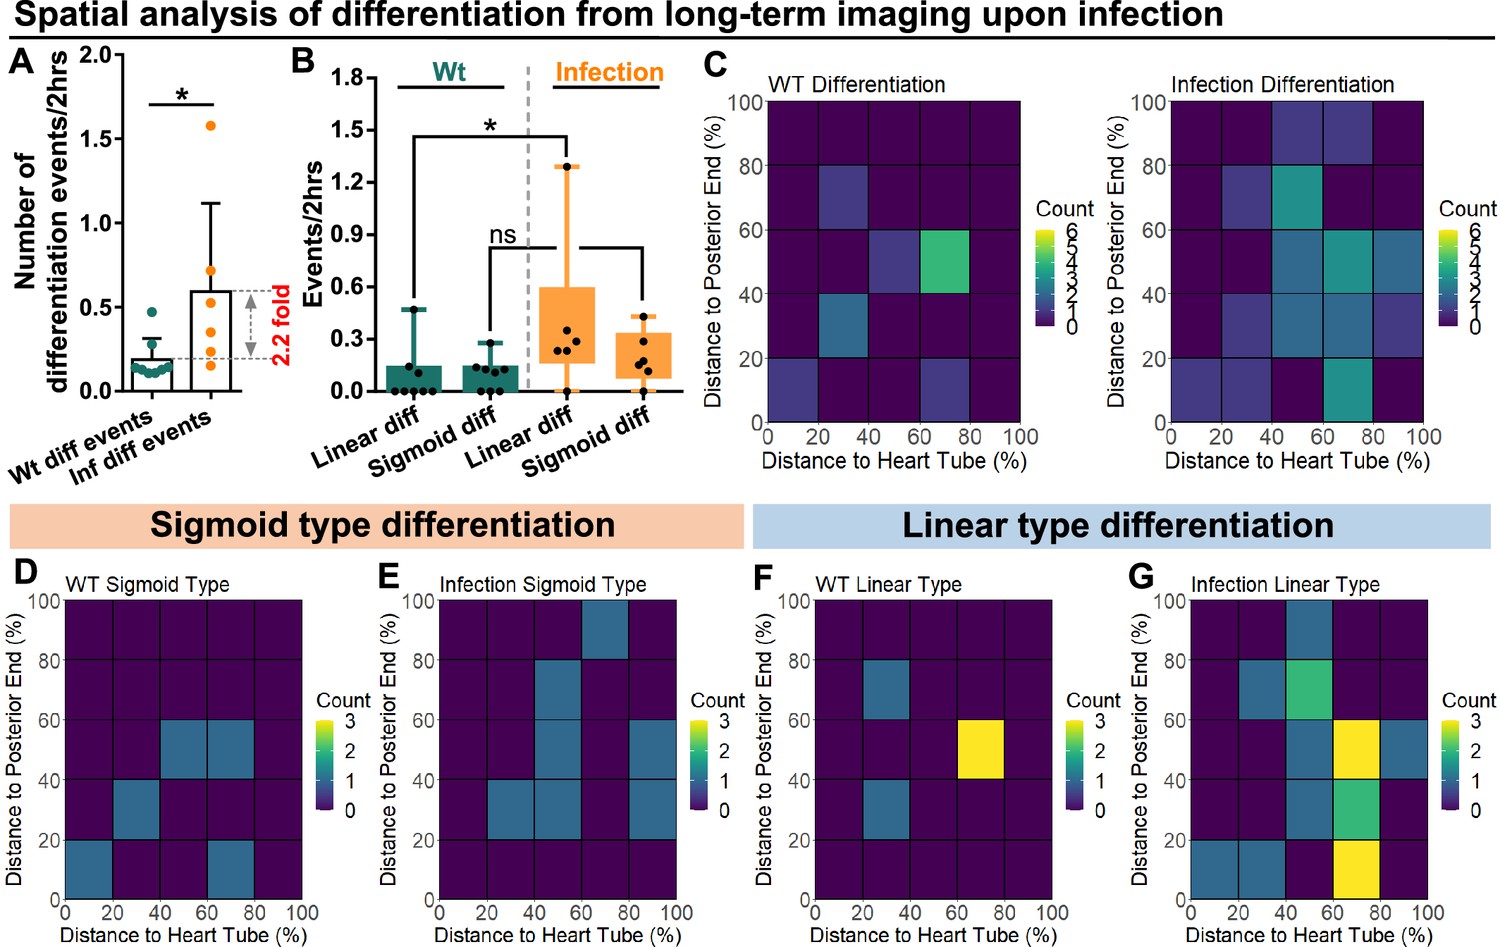
Spatial distribution of sigmoid and linear type differentiations upon immune activation.
(A) Quantification of the number of blood progenitor differentiation events recorded in LGs from wild-type control (n=8 videos that capture 11 differentiation events in total) and E. coli infected larvae (n=6 videos that capture 25 differentiation events in total). p-Value = 0.0117, determined using Mann-Whitney-Wilcoxon test. (B) Quantification of linear and sigmoid differentiations events in LGs from wild-type control (n=8 videos) and E. coli infected larvae (n=6 videos). p-Values = 0.0426 and 0.1592, determined using Kolmogorov Smirnov test. (C–G) Heat maps collating data from long-term videos that show the number of total differentiation events (C), sigmoid type differentiation events (D, E), and linear type differentiation events (F, G) recorded in specific regions of LGs from wild-type control (C left panel, D, F) and E. coli infected larvae (C right panel, E, G). Genotype of the LG was dome-MESO-GFP; eater-dsRed. * indicates p<0.05. ns indicates non-significant, p>0.05.
-
Figure 6—source data 1
Raw data of Figure 6A and B.
- https://cdn.elifesciences.org/articles/84085/elife-84085-fig6-data1-v2.xlsx
Figure 6—figure supplement 1
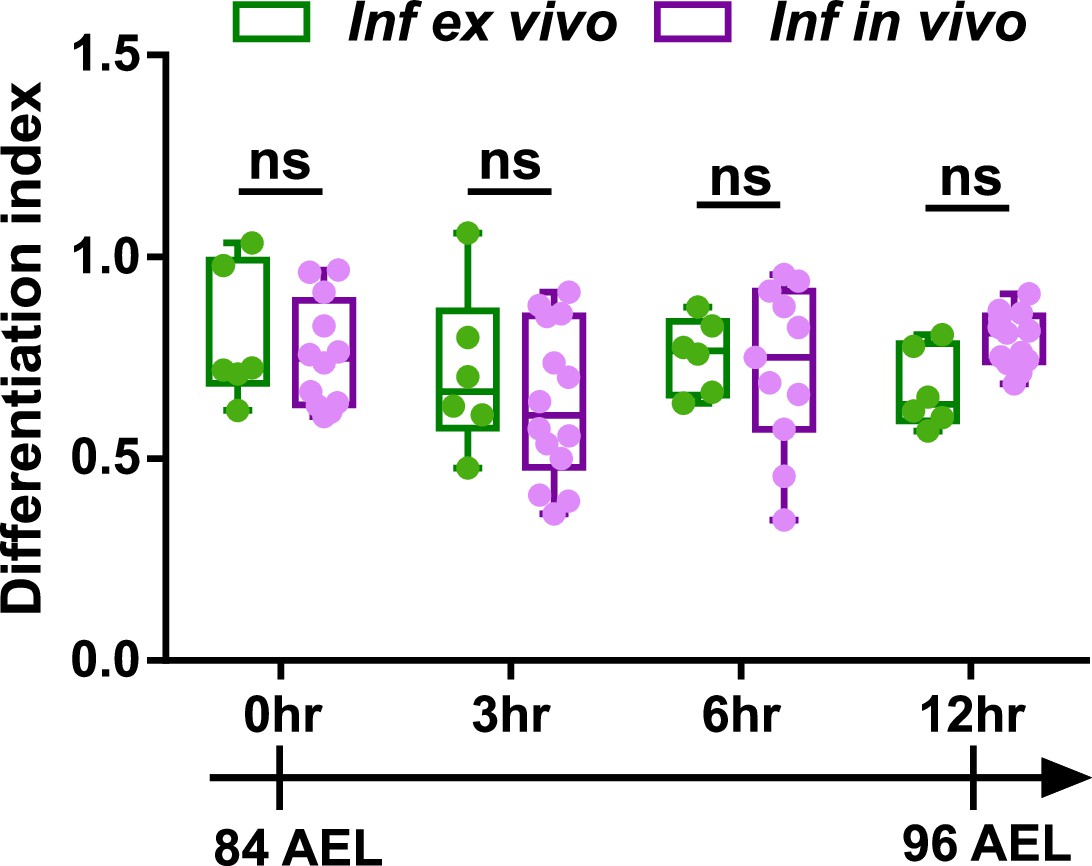
Ex vivo cultured LGs demonstrate comparable differentiation trends to in vivo LGs following infection.
Quantification of differentiation index (shown as a ratio of the number of eater+ cells/ the number of dome+ cells) following infection in ex vivo cultured LGs and in vivo LGs that were all matched in their developmental stages. Genotype of the LG: dome-MESO-GFP; eater-dsRed. p Values were 0.9747, 0.781, 0.9914, and 0.3669 in 0 hr, 3 hr, 6 hr, and 12 hr groups, respectively. Error bars indicate S.D from the mean. p Values were determined using two-way ANOVA with Sidak’s multiple comparisons test. ns indicates p>0.05.
-
Figure 6—figure supplement 1—source data 1
Raw data of Figure 6—figure supplement 1.
- https://cdn.elifesciences.org/articles/84085/elife-84085-fig6-figsupp1-data1-v2.xlsx
Figure 7 with 2 supplements

Temporal control of sigmoid and linear type differentiations upon bacterial infection.
(A–B) Representative sigmoid differentiation trajectories in blood progenitors from LGs of wild-type control (A-A’’’) or E. coli infected larvae (B-B’’’) over the course of 5–6 hr. (C–D) Representative linear differentiation trajectories in blood progenitors from LGs of wild-type control (C-C’’) and E. coli infected larvae (D-D’’) over the course of 7–8 hr. Dome-MESO-GFP and eater-dsRed fluorescent intensities are used to visualize differentiation kinetics. Each dot represents a single time point. Blood progenitors are labelled with dome-MESO-GFP. Mature hemocytes are labelled with eater-dsRed. (E–G) Quantification of the duration of the fast differentiation phase in progenitors undergoing the sigmoid differentiation trajectory (E, n=6 and 8 progenitors from LGs of wild-type control and E. coli infected larvae; p-value = 0.0226), the differentiation rate measured in progenitors undergoing sigmoid type differentiation trajectory (F, n=6 and 8 progenitors from LGs of wild-type control and E. coli infected larvae, respectively; p-value = 0.2731), and the differentiation rate measured in progenitors undergoing a linear type differentiation trajectory (G, n=6 and 15 progenitors from LGs of wild-type control and E. coli infected larvae, respectively; p-value = 0.6613). (H) Quantification of the percentage of sigmoid or linear type differentiation trajectories observed in LGs from wild-type control and E. coli infected larvae. (I–J) Representative image (I) and scatterplot (J) of wild-type control LGs (n=2500 cells in total analyzed from 6 primary lobes of 3 LGs, see Materials and methods). (K–L) Representative image (K) and scatterplot (L) of LGs from E. coli infected larvae (n=2500 cells in total analyzed from 6 primary lobes of 3 LGs, see Materials and methods). (M) Schematic illustrating the two observed differentiation trajectories (sigmoid and linear). Based on their fluorescent intensities of GFP (progenitor fate marker) and dsRed (differentiated state marker), cells in the LG are categorized into 4 groups: GFPhigh RFPlow, GFPhigh RFPhigh, GFPlow RFPhigh, GFPlow RFPlow. P: blood progenitors. (N) Quantification of the total number of cells in each quadrant of (J) and (L) from the LGs of wild-type control and E. coli infected larvae. p Values in (E–G) were determined using Kolmogorov Smirnov test. * indicates p<0.05. ns indicates non-significant, p>0.05. Scale bars in (I) and (K) represent 50 μm. Error bars indicate S.D from the mean. Genotype of the LG was dome-MESO-GFP; eater-dsRed. See also Videos 6–9.
Figure 7—figure supplement 1
Tracking differentiation events at single cell resolution in real time following infection.
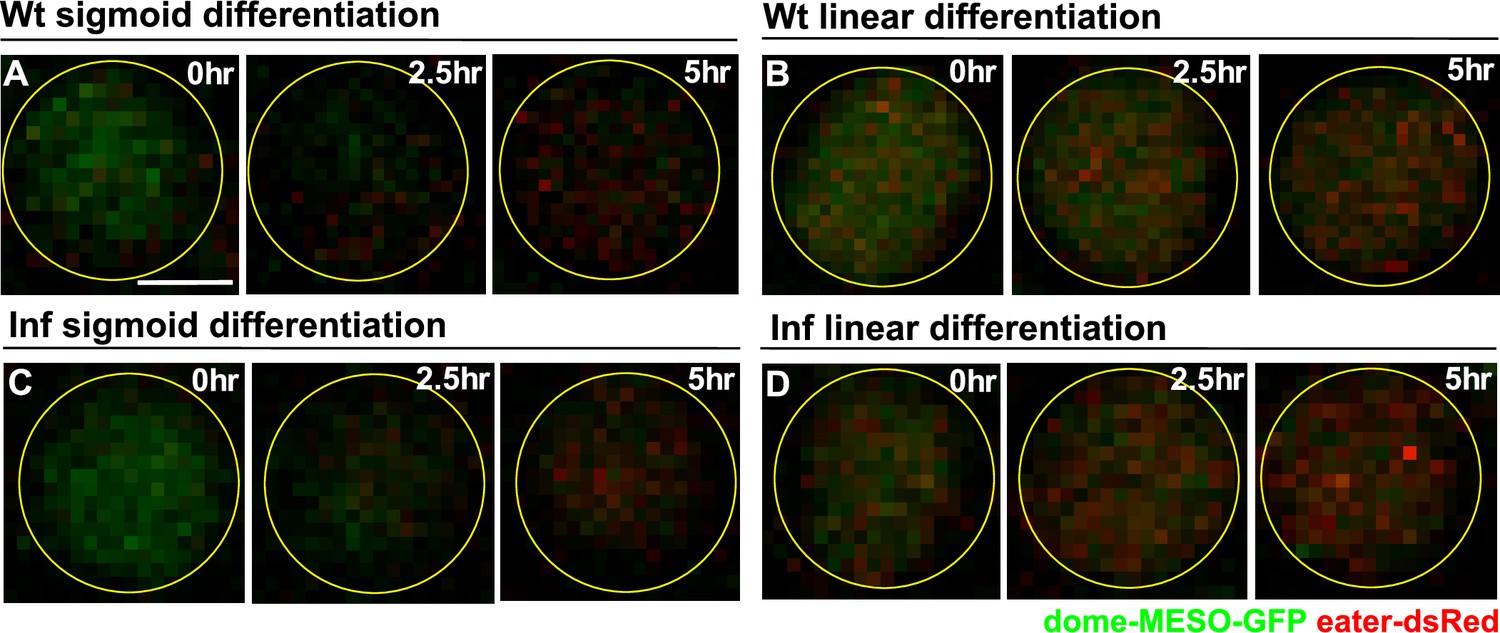
(A–B) Time-lapse images of a blood progenitor from a wild-type LG undergoing sigmoid (A) or linear type differentiation (B). (C–D) Time-lapse images of a blood progenitor from a LG upon infection undergoing sigmoid (C) or linear type differentiation (D). Genotype of the LG was dome-MESO-GFP; eater-dsRed. Scale bars in (A) represent 2.5 μm. Time-lapse images were from the same cells of Figure 7A–D.
Figure 7—figure supplement 2
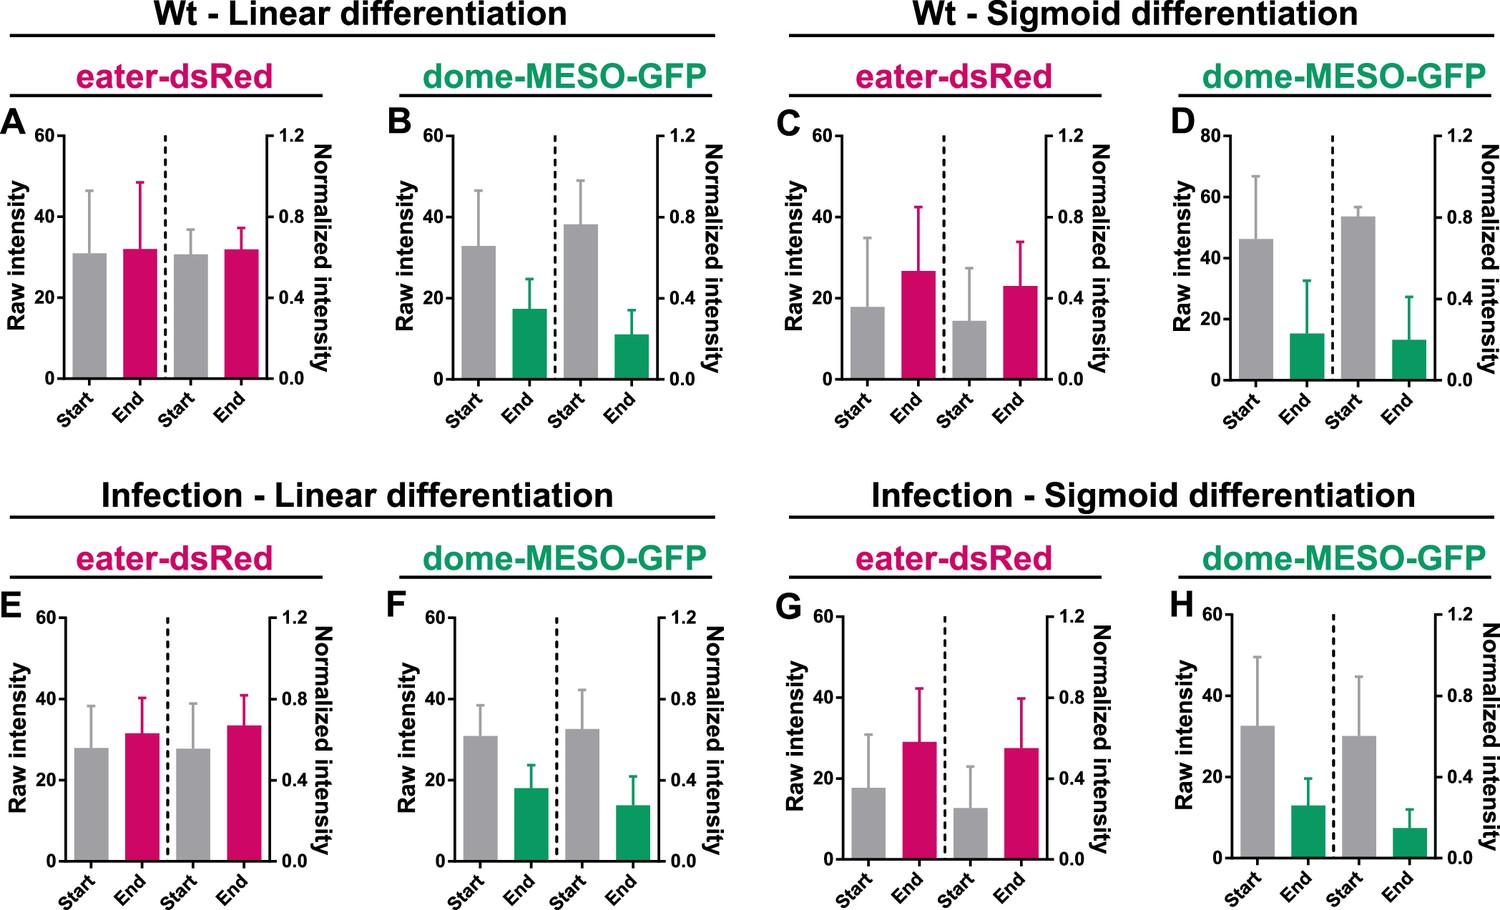
The normalization method preserves the original trend of cell fate markers during differentiation in wild-type condition and upon infection.
(A–D) Quantification of the raw intensities and normalized intensities of eater-dsRed and dome-MESO-GFP at the start and end of linear differentiation (A–B) and sigmoid differentiation (C–D) in LGs from wild-type larvae. (E–H) Quantification of the raw intensities and normalized intensities of eater-dsRed and dome-MESO-GFP at the start and end of linear differentiation (E–F) and sigmoid differentiation (G–H) in LGs from infected larvae. Genotype: dome-MESO-GFP; eater-dsRed. Error bars indicate S.D from the mean.
-
Figure 7—figure supplement 2—source data 1
Raw data of Figure 7—figure supplement 1A, B, C, D, E, F, G, H.
- https://cdn.elifesciences.org/articles/84085/elife-84085-fig7-figsupp2-data1-v2.xlsx
Author response image 1
Author response image 2
Videos
Video 1
Long-term imaging of an ex vivo wild-type LG at single cell resolution.
Representative long-term live imaging video of a primary lobe from an ex vivo LG showing blood progenitor divisions (highlighted by yellow ROIs in the video) over a cultured period of 13 hr. Blood progenitors were marked by dome-Gal4-driven membranous GFP (green). Mature hemocytes were marked by eater-dsRed (red). Part of the ring gland (labelled as RG in the video) was also captured. The LG was obtained from an early 3rd instar larva (of genotype dome-Gal4 >UAS-mCD8-GFP, eater-dsRed) raised at 25 °C, dissected, immediately mounted and imaged. Scale bar: 10 µm.
Video 2
Long-term monitoring of blood progenitor viability during overnight ex vivo culture.
Representative video showing only three blood progenitors undergoing cell death in a live LG cultured ex vivo over a period of 12 hr. The blood progenitors were marked by Tep4-Gal4-driven dsRed (red). Dying cells were marked by Sytox green dye (green). The LG was obtained from an early 3rd instar larva (of genotype Tep4-Gal4>UAS-dsRed) raised at 25 °C, dissected, immediately mounted and imaged. Scale Bar: 15 µm.
Video 3
Long-term tracking of cell cycle progression of blood progenitors in a wild-type LG.
Representative video showing cell cycle progression of a blood progenitor (highlighted in a yellow ROI) in wild-type LG over a period of 1 hr. The cell cycle indicator FUCCI construct was expressed in blood progenitors using Tep4-Gal4. The video tracked a G2-M transition (G2 phase: have both GFP.E2f and RFP.CycB expressed) of a blood progenitor and the subsequent G1 progenies (G1: only have GFP.E2f expressed). The green and red channels were separately presented in the right side of the video to visualize GFP.E2f and RFP.CycB levels in individual blood progenitors over time. The LG was obtained from an early 3rd instar larva (of genotype Tep4-Gal4>UAS-FUCCI) raised at 25 °C, dissected, immediately mounted and imaged. Scale Bar: 10 µm.
Video 4
Blood progenitors divide symmetrically in a wild-type LG.
Representative video showing an example of a blood progenitor undergoing symmetric cell division over a period of 50 min (see also Video 1). The blood progenitors were marked by JAK-STAT signaling activity reporter dome-MESO-GFP (green). The daughter cells were marked by yellow ROIs. The LG was obtained from an early 3rd instar larva (of genotype dome-MESO-GFP) raised at 25 °C, dissected, immediately mounted and imaged. Scale Bar: 10 µm.
Video 5
Long-term tracking of blood progenitor differentiation in a wild-type LG.
Representative video of a differentiating blood progenitor (the cell was green at the beginning) turning into a differentiated mature blood cell (the cell became red in the end) in a live intact LG. Blood progenitors were marked by dome-MESO-GFP (green). Mature hemocytes were marked by eater-dsRed (red). The tracked progenitor was highlighted using a pink ROI by TrackMate throughout the recording. The LG was obtained from an early 3rd instar larva (of genotype dome-MESO-GFP, eater-dsRed) raised at 25 °C, dissected, immediately mounted and imaged. Scale Bar: 10 µm.
Video 6
Dynamics of sigmoid type differentiation in a wild-type blood progenitor.
Real-time tracking of dome-MESO-GFP and eater-dsRed intensities in a wild-type blood progenitor undergoing sigmoid type differentiation over the course of 5~6 hr. Each dot represents a single time point. The LG was obtained from an early 3rd instar larva (of genotype dome-MESO-GFP, eater-dsRed) raised at 25 °C, dissected, immediately mounted and imaged.
Video 7
Dynamics of linear type differentiation in a wild-type blood progenitor.
Real-time tracking of dome-MESO-GFP and eater-dsRed intensities in a wild-type blood progenitor undergoing linear type differentiation over the course of 7~8 hr. Each dot represents a single time point. The LG was obtained from an early 3rd instar larva (of genotype dome-MESO-GFP, eater-dsRed) raised at 25 °C, dissected, immediately mounted and imaged.
Video 8
Dynamics of sigmoid type differentiation in a blood progenitor upon E. coli infection.
Real-time tracking of dome-MESO-GFP and eater-dsRed intensities in a blood progenitor undergoing sigmoid type differentiation in the LG derived from an E. coli infected larva over the course of 5~6 hr. Each dot represents a single time point. The LG was obtained from an early 3rd instar larva (of genotype dome-MESO-GFP, eater-dsRed) raised at 25 °C, dissected, immediately mounted and imaged.
Video 9
Dynamics of linear type differentiation in a blood progenitor upon E. coli infection.
Real-time tracking of dome-MESO-GFP and eater-dsRed intensity in a blood progenitor undergoing linear type differentiation in the LG derived from an E. coli infected larva over the course of 7~8 hr. Each dot represents a single time point. The LG was obtained from an early 3rd instar larva (of genotype dome-MESO-GFP, eater-dsRed) raised at 25 °C, dissected, immediately mounted and imaged.
Tables
Key resources table
| Reagent type (species) or resource | Designation | Source or reference | Identifiers | Additional information |
|---|---|---|---|---|
| Genetic reagent (Drosophila melanogaster) | Tep4-Gal4 | Avet-Rochex et al., 2010 | Flybase ID: FBti0037434 | Gift from Dr. Lucas Waltzer, Université Clermont Auvergne, France |
| Genetic reagent (Drosophila melanogaster) | dome-MESO-Gal4 | Hombría et al., 2005 | Flybase ID: FBtp0146166 | Gift from Dr. Lucas Waltzer, Université Clermont Auvergne, France |
| Genetic reagent (Drosophila melanogaster) | eater-dsRed | Kroeger et al., 2012 Tokusumi et al., 2009 | Flybase ID: FBtp0084524 | Gift from Dr. Elio Sucena, Instituto Gulbenkian de Ciência, Portugal |
| Genetic reagent (Drosophila melanogaster) | dome-MESO-GFP.nls | Oyallon et al., 2016 | Flybase ID: FBtp0142446 | Gift from Dr. Michele Crozatier, Université de Toulouse, France |
| Genetic reagent (Drosophila melanogaster) | gstD-GFP | Sykiotis and Bohmann, 2008 | Flybase ID: FBtp0069371 | Gift from Dr. Dirk Bohmann, University of Rochester Medical Center, USA |
| Genetic reagent (Drosophila melanogaster) | dome-MESO-LacZ | Hombría et al., 2005 | Flybase ID: FBtp0022619 | Gift from Dr. Nancy Fossett, University of Maryland, Baltimore, USA |
| Genetic reagent (Drosophila melanogaster) | HmlΔ-dsRed.nls | Makhijani et al., 2011 | Flybase ID: FBtp0150011 | Gift from Dr. Katja Brüeckner, University of California, San Francisco, USA |
| Genetic reagent (Drosophila melanogaster) | Tep4-QF>QUAS-mCherry | Girard et al., 2021 | N/A | Gift from Dr. Utpal Banerjee, University of California, Los Angeles, USA |
| Genetic reagent (Drosophila melanogaster) | Ubi-FUCCI | Bloomington Drosophila Stock Center | RRID: BDSC_55124 | |
| Genetic reagent (Drosophila melanogaster) | UAS-FUCCI | Bloomington Drosophila Stock Center | RRID: BDSC_55117 | |
| Genetic reagent (Drosophila melanogaster) | w1118 | Bloomington Drosophila Stock Center | RRID: BDSC_3605 | |
| Antibody | Mouse monoclonal anti-phospho-Histone H3 | Invitrogen | Cat# MA3-064, RRID: AB_2633021 | Used in 1:1000 |
| Antibody | Mouse monoclonal anti-LacZ | Developmental State Hybridoma Bank | Cat# 40–1 a, RRID: AB_2314509 | Used in 1:100 |
| Antibody | Donkey polyclonal anti-mouse Cy5 | Jackson Immunoresearch laboratories Inc | Code: 715-175-151, RRID: AB_2340820 | Used in 1:400 |
| Chemical compound, drug | VECTASHIELD with DAPI | Vector Laboratories | Cat# H-1200, RRID:AB_2336790 | |
| Chemical compound, drug | 16% Paraformaldehyde | ThermoFisher Scientific | Cat#28908 | Used in 4% |
| Chemical compound, drug | Triton X | ThermoFisher Scientific | Cat#BP151100 | Used in 0.1% |
| Chemical compound, drug | Normal Goat Serum | Abcam | Cat# ab7481; RRID:AB_2716553 | Used in 16% |
| Chemical compound, drug | Schneider’s Drosophila medium | ThermoFisher Scientific | Cat# 21720001 | |
| Chemical compound, drug | Fetal Bovine Serum | ThermoFisher Scientific | Cat# 12483–020 | Used in 15% |
| Chemical compound, drug | Insulin solution from bovine pancreas | Sigma Aldrich | Cat# I0516 | Used in 0.2 mg/mL |
| Chemical compound, drug | Sytox Green | ThermoFisher Scientific | Cat# S7020 | Used in 2 μM |
| Commercial assay or kit | Click-iT EdU kit | Life technologies | Cat# C10337 | See detail protocol in the Methods |
| Software, algorithm | MATLAB | Commercial | https://www.mathworks.com/products/matlab.html | |
| Software, algorithm | FIJI | Source of the software Schindelin et al., 2012 | https://fiji.sc/ | |
| Software, algorithm | MATLAB script used to create heat maps | Codes deposited in the Tanentzapf lab GitHub (https://github.com/Tanentzapf-Lab/LiveImaging_HematopiesisKinetics_Infection_Ho_Carr; Ho et al., 2023) | This study | See the Tanentzapf lab GitHub |
| Software, algorithm | MATLAB scripts used to calculate the number of progenitors, plasmatocyte differentiation, and total number of cells in a LG | Scripts deposited in the study Khadilkar et al., 2017 | N/A | Khadilkar et al., 2017 |
| Other | Glass bottom mounting dishes | MatTek Corporation | Cat# P35G-0–14 C | See Immunohistochemistry and antibodies section in the Materials and methods. |
| Other | Incubation system | TOKAI HIT | Cat# INU-ONICS F1 | Temperature set at 25οC. See Long-term ex vivo organ culture and confocal imaging section in the Methods. |
Additional files
Download links
A two-part list of links to download the article, or parts of the article, in various formats.
Downloads (link to download the article as PDF)
Open citations (links to open the citations from this article in various online reference manager services)
Cite this article (links to download the citations from this article in formats compatible with various reference manager tools)
Kinetics of blood cell differentiation during hematopoiesis revealed by quantitative long-term live imaging
eLife 12:e84085.
https://doi.org/10.7554/eLife.84085


