Dissecting the chain of information processing and its interplay with neurochemicals and fluid intelligence across development
- Wellcome Centre for Integrative Neuroimaging, Department of Experimental Psychology, University of Oxford, United Kingdom
- School of Psychology, Swansea University, United Kingdom
- Centre for Mathematical Cognition, Loughborough University, United Kingdom
- School of Health Sciences, College of Health and Human Sciences, Purdue University, United States
- School of Psychology, University of Surrey, United Kingdom
Figures
Figure 1 with 2 supplements
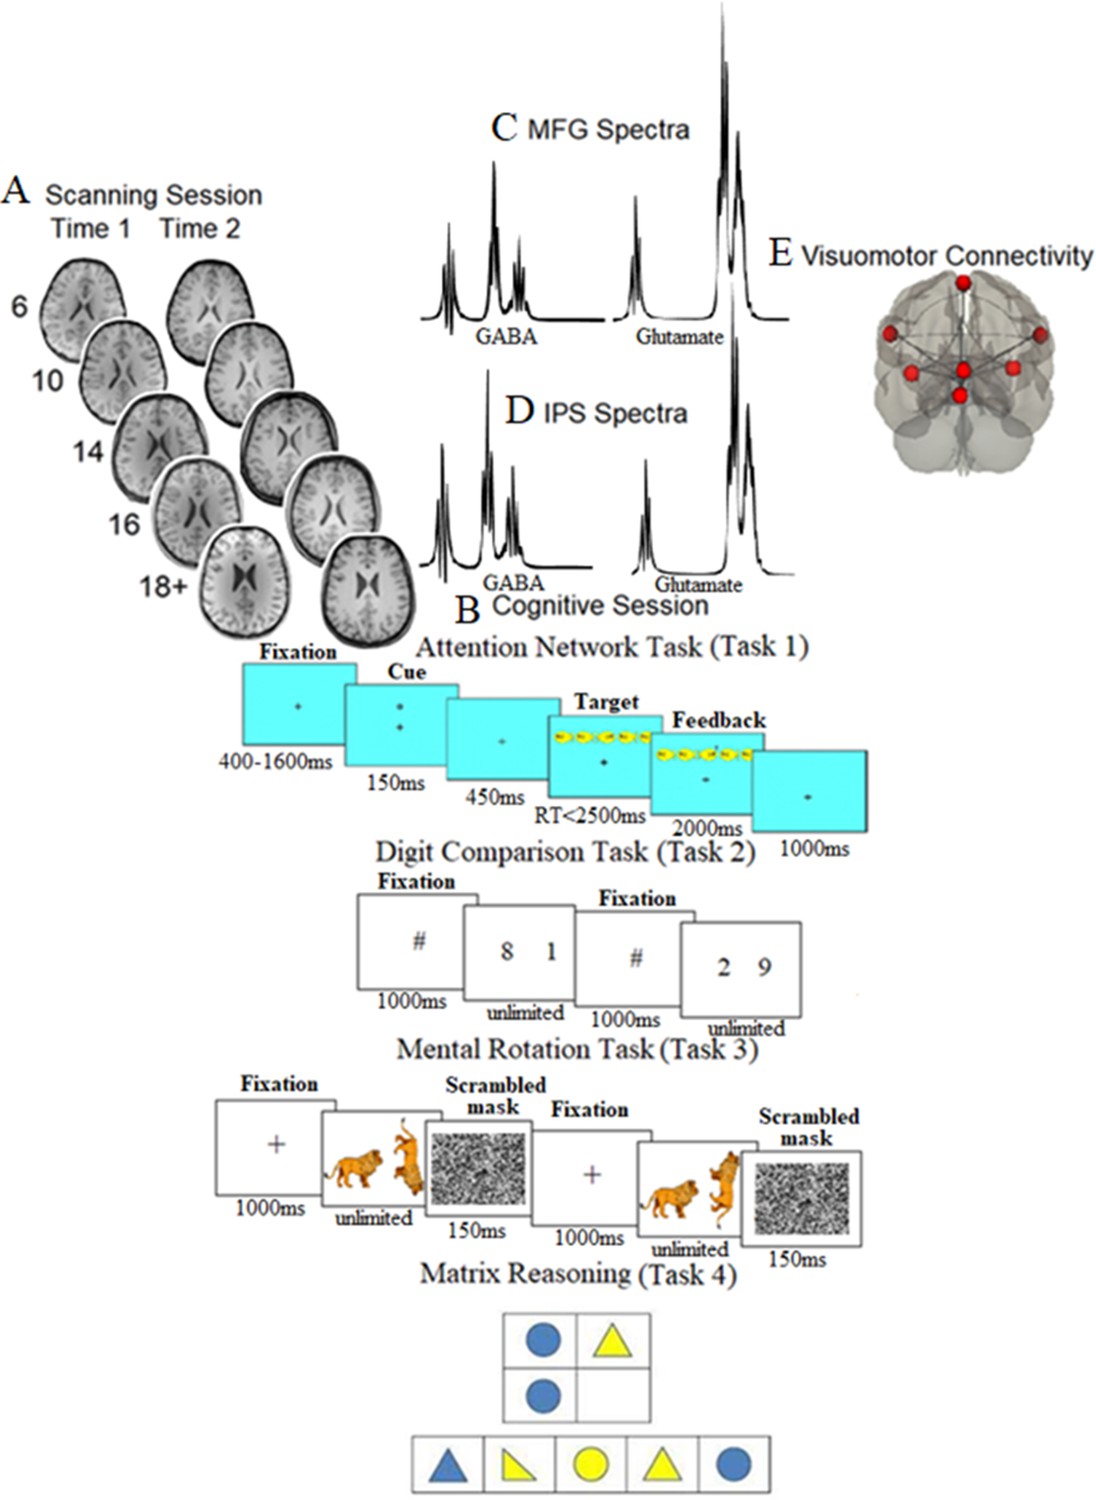
Scanning, cognitive session, neurochemical spectra plots, and visuomotor network connectivity.
(A) Examples of T1-weighted images collected during the first assessment (A1) and the second assessment (A2, ~ 21 mo later) in each of the five age groups (at A1: 6-year-olds, 10-year-olds, 14-year-olds, 16-year-olds, and 18+-year-olds). (B) Cognitive session: top panel: the Attention Network task, where after a variable period, one of the possible cue types was presented for 150 ms; after a pause of 450 ms, one of the possible target types was presented, which required participants to indicate the direction of the middle fish arrow by pressing the corresponding key; top middle panel: the Digit Comparison task, where participants chose the larger value between two single-digit Arabic numbers. The numbers remained on the screen until the participant responded. Between each trial, a central fixation hashtag appeared for 1000 ms. Bottom middle panel: the Mental Rotation task, where participants decided whether a rotated target figure (a giraffe, a zebra, or a racoon in the actual task) presented on the right side of the screen was the same (i.e., non-mirrored) or different (i.e., mirrored) compared to the upright figure presented on the left side of the screen. Each trial began with a black fixation cross in the center of the white screen for 1000 ms. Bottom panel: matrix reasoning, which is a 30-item (of increasing difficulty) assessment tool that requires identifying a logical pattern in a sequence of visuospatial stimuli (this panel presents an example for illustration purposes only and does not show a trial from WASI II; Wechsler, 2011). (C, D) The mean spectra from our sample for the middle frontal gyrus (MFG) (C) and intraparietal sulcus (IPS) (D). The thickness corresponds to ±1 SD from the mean (i.e., a chemical shift expressed in parts per million, ppm, on the x-axis). (E) Brain regions consisting of the resting-state visuomotor functional connectivity network.
Figure 1—figure supplement 1
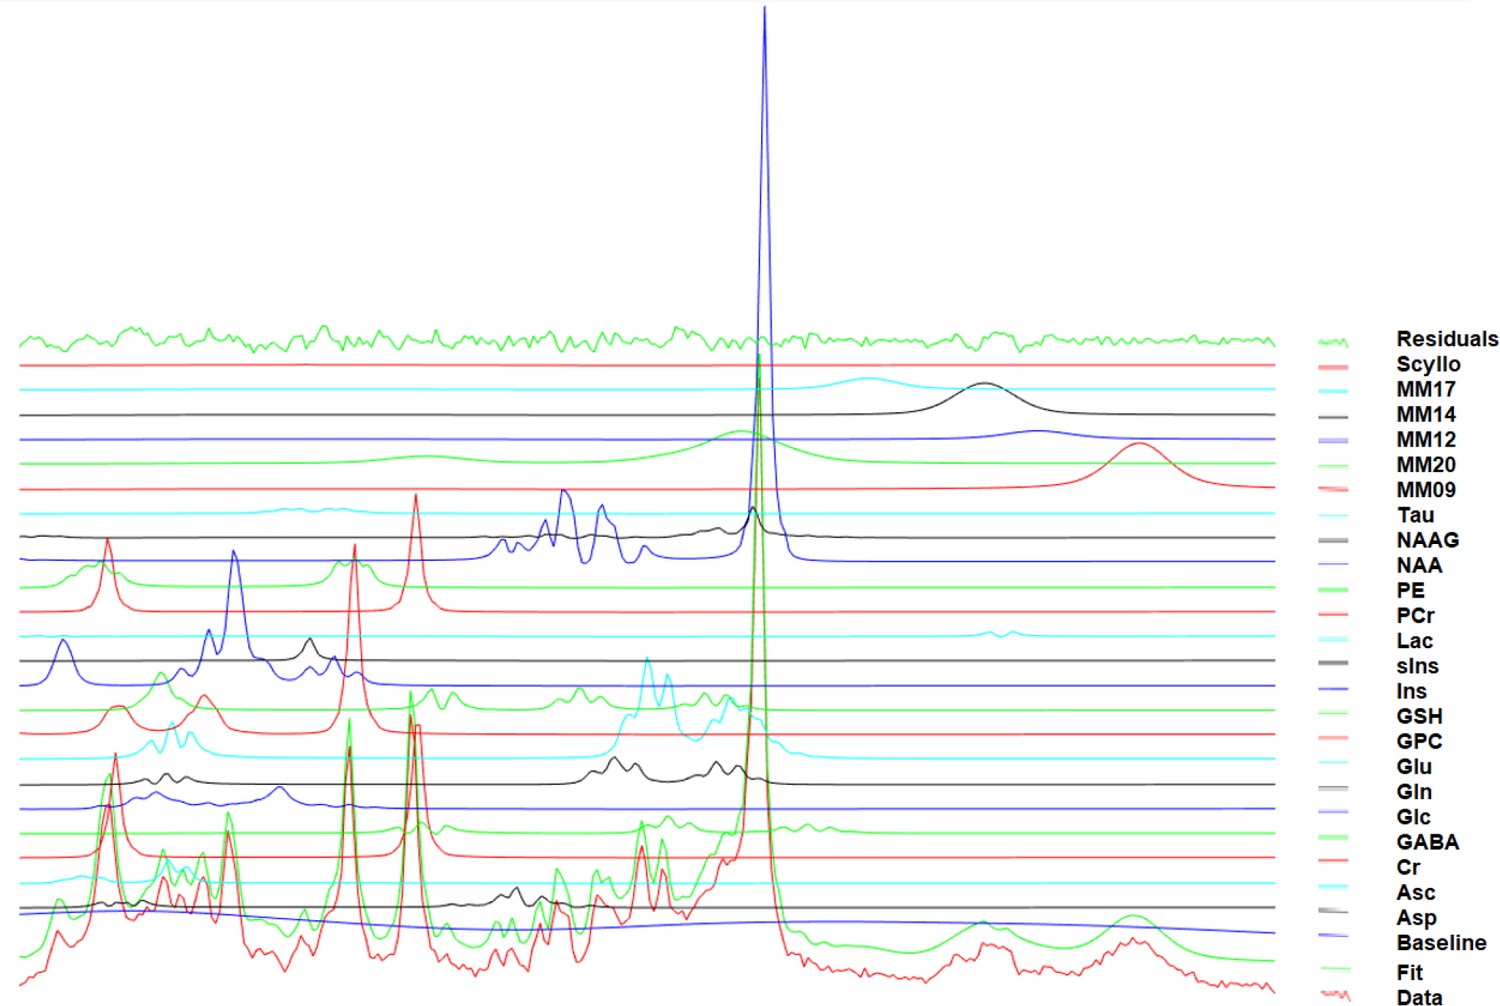
A stacked plot depicting the spectrum, the fit, the residual, the baseline estimation, and the individual contributions from all basis functions.
Figure 1—figure supplement 2
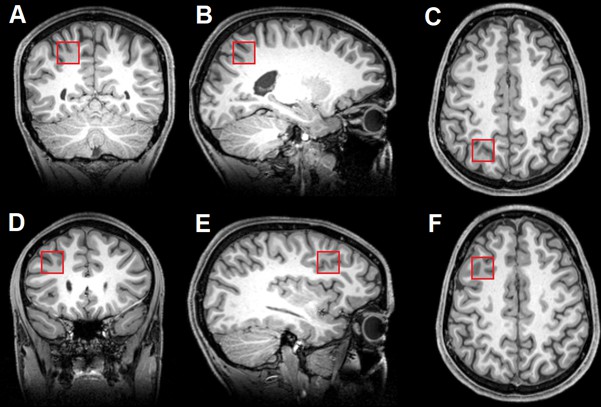
The positions displayed in a T1-weighted image for the intraparietal sulcus (IPS) and the middle frontal gyrus (MFG) on coronal, sagittal, and axial slices.
(A) IPS coronal, (B) IPS sagittal, (C) IPS axial, (D) MFG coronal, (E) MFG sagittal, and (F) MFG axial.
Figure 2 with 2 supplements

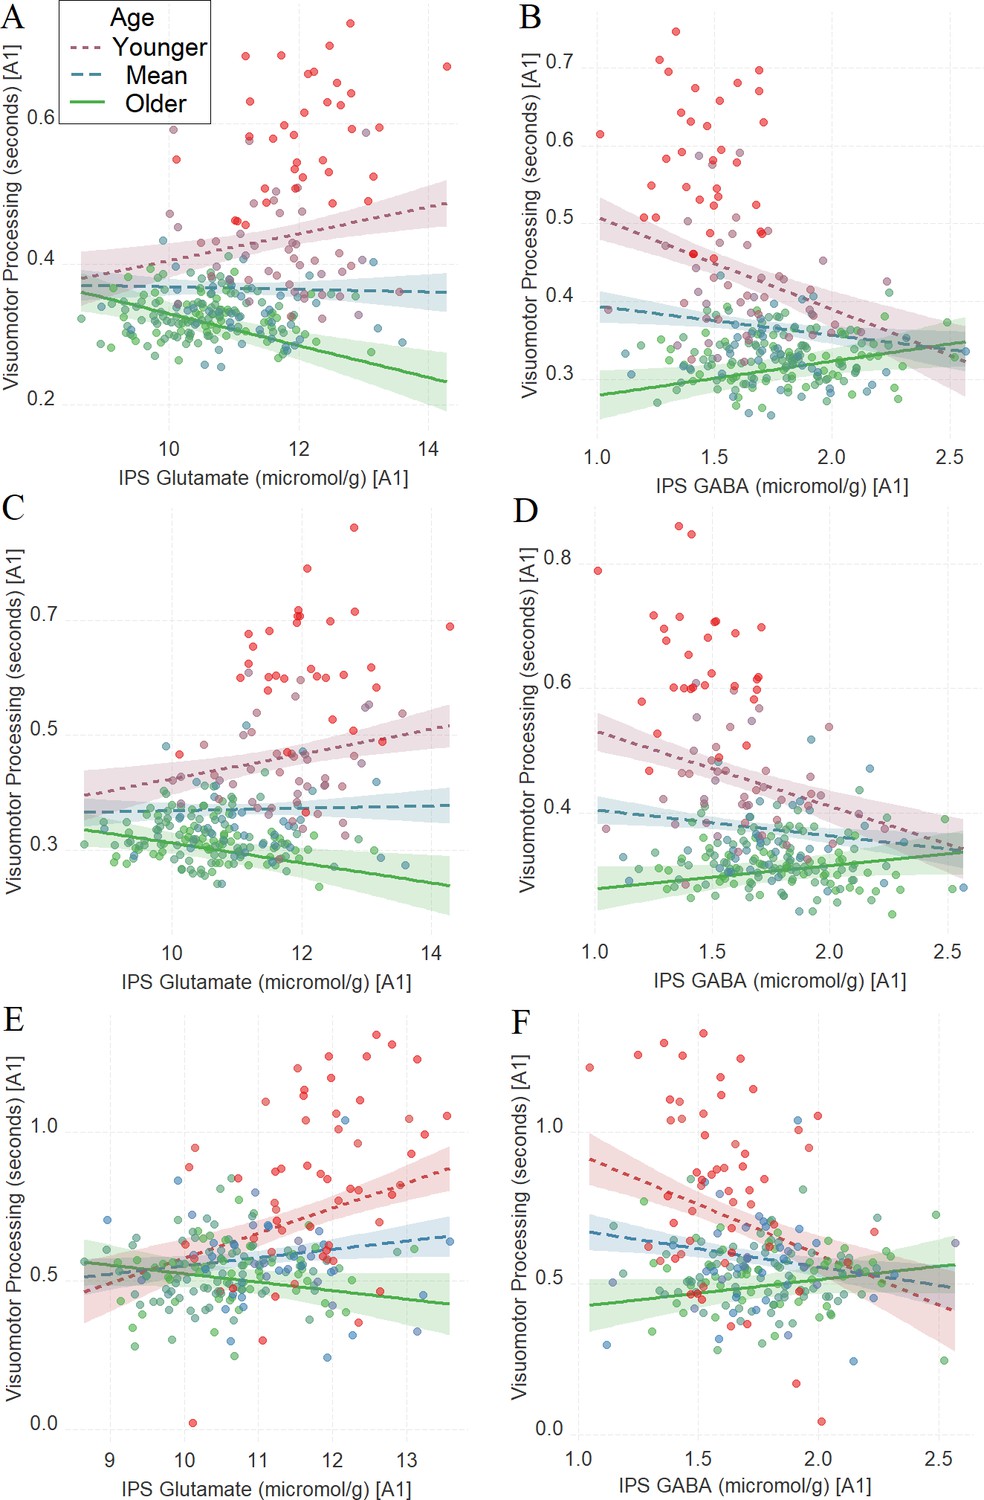
The moderating role of age in the relation between neurotransmitter concentration and visuomotor processing at A1 (A, B) and A2 (C, D) in Task 1.
(A) Intraparietal sulcus (IPS) glutamate * age and (B) IPS GABA * age at A1; (C) IPS glutamate * age and (D) IPS GABA * age at A2. We utilized a standard practice for examining interactions with continuous variables using three levels of a moderator (Aiken et al., 1991). Specifically, to depict the interaction between the continuous variables (age and neurotransmitter concentration), we plotted the regression lines for younger and older participants (i.e., ±1 SD) from the mean age (Aiken et al., 1991). Green colors represent +1 SD above the mean (older participants), red colors represent –1 SD below the mean (younger participants), and blue colors represent the mean. Since our cohort was based on a developmental sample spanning from early childhood to early adulthood, ‘younger participants’ refer predominantly to early and late childhood and ‘older participants’ refer predominantly to late adolescence and early adulthood. To make the visual comparison across figures more comparable, we did not control for boundary separation and mean drift rate when plotting these panels. We additionally plotted the moderating role of age in the relation between neurotransmitter concentration and visuomotor processing after controlling for boundary separation and mean drift rate in Figure 2—figure supplement 1. Lower scores in visuomotor processing indicate better performance. The shaded area represents 95% confidence intervals. In these multiple regression analyses, the sample sizes were 258, 180, 258, and 181, for panels A, B, C and D respectively, and the significance level was set to 0.05 (5%).
Figure 2—figure supplement 1
Plotting the moderating role of age in the relation between neurotransmitter concentration and visuomotor processing after controlling for boundary separation and mean drift rate in Task 1 (glutamate: A; GABA: B), Task 2 (glutamate: C; GABA: D), and Task 3 (glutamate: E; GABA: F).
The shaded area represents 95% confidence intervals. In these multiple regression analyses, the sample sizes were 258, 258, 246, 246, 228 and 230, for panels A, B, C, D, E and F respectively, and the significance level was set to 0.05 (5%).
Figure 2—figure supplement 2

Scatterplots depicting that age moderated the relationship between the (z-scored) diffusion parameter (A: mean drift rate, B: boundary separation, C: visuomotor processing) and fluid intelligence.
We utilised a standard practice for examining interactions with continuous variables using three levels of a moderator (Aiken et al., 1991). Specifically, to depict the interaction between the continuous variables (age and neurotransmitter concentration), we plotted the regression lines for younger and older participants (i.e., ± 1 standard deviation) from the mean age (Aiken et al., 1991). Color-coded chronological age increases gradationally from red to purple to blue to green. Red colors represent -1 SD below the mean (younger participants), blue colors represent the mean, and green colors represent +1 SD above the mean (older participants). Since our cohort was based on a developmental sample spanning from early childhood to early adulthood, “younger participants” refer predominantly to early and late childhood and “older participants” refer predominantly to late adolescence and early adulthood. In these analyses, we did not control for the other two diffusion parameters. The shaded area represents 95% confidence intervals. In these multiple regression analyses, the sample sizes were 242, 240 and 240, for panels A, B and C respectively, and the significance level was set to 0.05 (5%).
Figure 3

The moderating role of age in the relation between neurotransmitter concentration and visuomotor processing at A1 (A, B) and A2 (C, D) in Task 2.
(A) Intraparietal sulcus (IPS) glutamate * age and (B). IPS GABA * age at A1; (C) IPS glutamate * age and (D) IPS GABA * age at A2. We utilized a standard practice for examining interactions with continuous variables using three levels of a moderator (Aiken et al., 1991). Specifically, to depict the interaction between the continuous variables (age and neurotransmitter concentration), we plotted the regression lines for younger and older participants (i.e., ±1 SD) from the mean age (Aiken et al., 1991). Green colors represent +1 SD above the mean (older participants), red colors represent –1 SD below the mean (younger participants), and blue colors represent the mean. Since our cohort was based on a developmental sample spanning from early childhood to early adulthood, ‘younger participants’ refer predominantly to early and late childhood and ‘older participants’ refer predominantly to late adolescence and early adulthood. To make the visual comparison across figures more comparable, we did not control for boundary separation and mean drift rate when plotting these panels. Lower scores in visuomotor processing indicate better performance. The shaded area represents 95% confidence intervals. In these multiple regression analyses, the sample sizes were 246, 176, 246, and 174, for panels A, B, C and D respectively, and the significance level was set to 0.05 (5%).
Figure 4

The moderating role of age in the relation between neurotransmitter concentration and visuomotor processing at A1 (A, B) and A2 (C, D) in Task 3.
(A) Intraparietal sulcus (IPS) glutamate * age and (B) IPS GABA * age at A1; (C) IPS glutamate * age and (D) IPS GABA * age at A2. We utilized a standard practice for examining interactions with continuous variables using three levels of a moderator (Aiken et al., 1991). Specifically, to depict the interaction between the continuous variables (age and neurotransmitter concentration), we plotted the regression lines for younger and older participants (i.e., ±1 SD) from the mean age (Aiken et al., 1991). Green colors represent +1 SD above the mean (older participants), red colors represent –1 SD below the mean (younger participants), and blue colors represent the mean. Since our cohort was based on a developmental sample spanning from early childhood to early adulthood, ‘younger participants’ refer predominantly to early and late childhood and ‘older participants’ refer predominantly to late adolescence and early adulthood. To make the visual comparison across figures more comparable, we did not control for boundary separation and mean drift rate when plotting these panels. Lower scores in visuomotor processing indicate better performance. The shaded area represents 95% confidence intervals. In these multiple regression analyses, the sample sizes were 228, 170, 230, and 172, for panels A, B, C and D respectively, and the significance level was set to 0.05 (5%).
Figure 5

The moderating role of age in the relation between neurochemical concentration and visuomotor connectivity in intraparietal sulcus (IPS) glutamate (A) and GABA (B), and the moderating role of age in the relation between visuomotor connectivity and the composite visuomotor processing score (C).
We utilized a standard practice for examining interactions with continuous variables using three levels of a moderator (Aiken et al., 1991). Specifically, to depict the interaction between the continuous variables (age and neurotransmitter concentration), we plotted the regression lines for younger and older participants (i.e., ±1 SD) from the mean age (Aiken et al., 1991). Green colors represent +1 SD above the mean (older participants), red colors represent –1 SD below the mean (younger participants), and blue colors represent the mean. Since our cohort was based on a developmental sample spanning from early childhood to early adulthood, ‘younger participants’ refer predominantly to early and late childhood and ‘older participants’ refer predominantly to late adolescence and early adulthood. Lower scores in visuomotor processing indicate better performance. The shaded area represents 95% confidence intervals. In these multiple regression analyses, the sample sizes were 246, 247, and 219, for panels A, B, and C respectively, and the significance level was set to 0.05 (5%).
Figure 6

The moderating role of age in the relation between neurotransmitter concentration and intelligence at A1 (A, B) and A2 (C, D) in Task 4.
(A) Intraparietal sulcus (IPS) glutamate * age and (B) IPS GABA * age at A1; (C) IPS glutamate * age and (D) IPS GABA * age at A2. We utilized a standard practice for examining interactions with continuous variables using three levels of a moderator (Aiken et al., 1991). Specifically, to depict the interaction between the continuous variables (age and neurotransmitter concentration), we plotted the regression lines for younger and older participants (i.e., ±1 SD) from the mean age (Aiken et al., 1991). Green colors represent +1 SD above the mean (older participants), red colors represent –1 SD below the mean (younger participants), and blue colors represent the mean. Since our cohort was based on a developmental sample spanning from early childhood to early adulthood, ‘younger participants’ refer predominantly to early and late childhood and ‘older participants’ refer predominantly to late adolescence and early adulthood. The shaded area represents 95% confidence intervals. In these multiple regression analyses, the sample sizes were 260, 182, 261, and 182, for panels A, B, C and D respectively, and the significance level was set to 0.05 (5%).
Figure 7
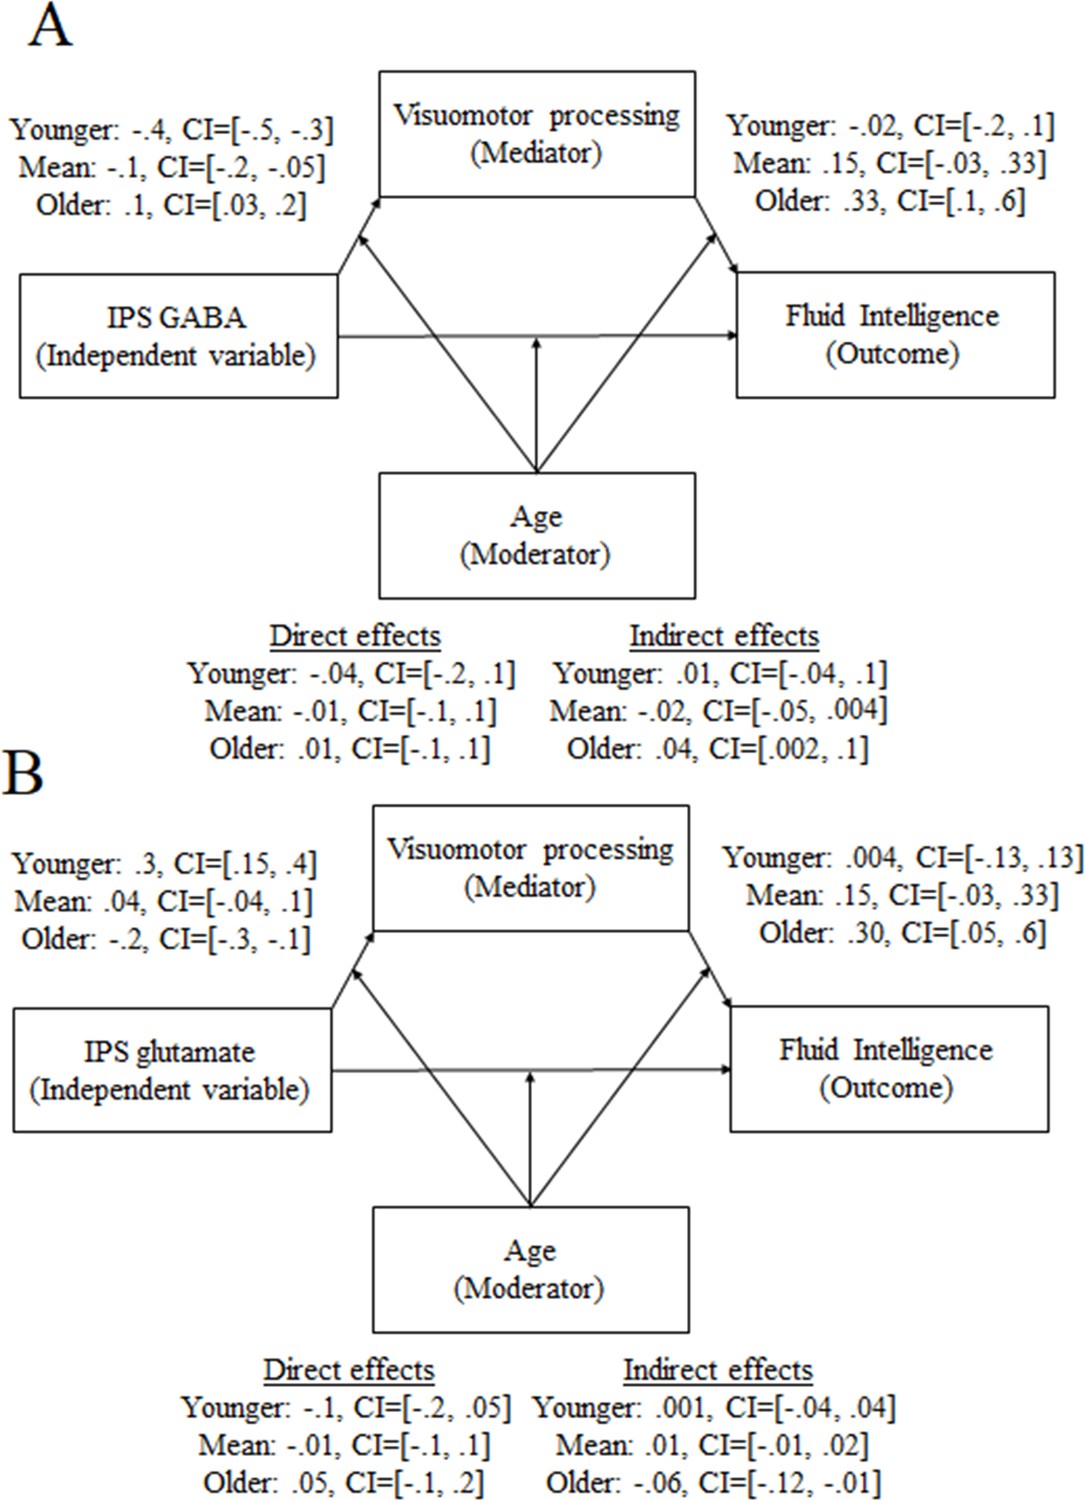
Moderated mediation results on the role of visuomotor processing in the relation between fluid intelligence and intraparietal sulcus (IPS) GABA (A) or IPS glutamate (B) only for the older participants.
Author response image 1
Author response image 2

Author response image 3

Author response image 4

Author response image 5

Author response image 6

Author response image 7

Author response image 8

Tables
Author response table 1
| Concentration | SNR | CRLB | |
|---|---|---|---|
| T1 MFG GABA tc | 0 | 8 | 10 |
| T1 MFG glutamate tc | 1 | 8 | 2 |
| T1 IPS GABA tc | 1 | 3 | 2 |
| T1 IPS glutamate tc | 1 | 3 | 0 |
| T1 MFG GABA t2c | 2 | 8 | 10 |
| T1 MFG glutamate t2c | 4 | 8 | 2 |
| T1 IPS GABA t2c | 1 | 3 | 2 |
| T1 IPS glutamate t2c | 1 | 3 | 0 |
| T2 MFG GABA tc | 0 | 5 | 7 |
| T2 MFG glutamate tc | 2 | 5 | 2 |
| T2 IPS GABA tc | 0 | 2 | 2 |
| T2 IPS glutamate tc | 0 | 2 | 2 |
| T2 MFG GABA t2c | 0 | 5 | 7 |
| T2 MFG glutamate t2c | 2 | 5 | 2 |
| T2 IPS GABA t2c | 0 | 2 | 2 |
| T2 IPS glutamate t2c | 0 | 2 | 2 |
Author response table 2
| DF | β | T | CI_L | CI_U | P value | |
|---|---|---|---|---|---|---|
| Exp1 IPS MeanDriftRate | 223 | 0.012292 | 0.251672 | -0.0731 | 0.0965 | 0.788716 |
| Exp1 IPS glutamate BoundarySeparation | 221 | -0.02617 | -0.60067 | -0.1256 | 0.0694 | 0.611227 |
| Exp1 IPS glutamate NonDecisionTime | 218 | -0.08893 | -2.21777 | -0.2108 | 0.0407 | 0.166475 |
| Exp2 IPS glutamate MeanDriftRate | 223 | 0.045953 | 1.069436 | -0.0455 | 0.1327 | 0.316705 |
| Exp2 IPS glutamate BoundarySeparation | 220 | -0.05899 | -1.25181 | -0.1886 | 0.0705 | 0.378585 |
| Exp2 IPS glutamate NonDecisionTime | 217 | -0.07223 | -2.06421 | -0.1608 | 0.0178 | 0.112948 |
| Exp3 IPS glutamate MeanDriftRate | 222 | 0.02705 | 0.587266 | -0.0512 | 0.1152 | 0.534832 |
| Exp3 IPS glutamate BoundarySeparation | 219 | 0.034256 | 0.626466 | -0.0935 | 0.1566 | 0.603508 |
| Exp3 IPS glutamate NonDecisionTime | 216 | -0.14387 | -2.54742 | -0.3079 | 0.035 | 0.099783 |
| Exp1 IPS GABA MeanDriftRate | 224 | -0.00284 | -0.05867 | -0.0989 | 0.0833 | 0.955603 |
| Exp1 IPS GABA BoundarySeparation | 221 | 0.019515 | 0.458234 | -0.0483 | 0.1022 | 0.623926 |
| Exp1 IPS GABA NonDecisionTime | 218 | 0.09984 | 2.522437 | -0.0058 | 0.1951 | 0.050963 |
| Exp2 IPS GABA MeanDriftRate | 224 | -0.0121 | -0.28504 | -0.0843 | 0.0683 | 0.768743 |
| Exp2 IPS GABA BoundarySeparation | 221 | 0.003692 | 0.077367 | -0.1085 | 0.1183 | 0.953672 |
| Exp2 IPS GABA NonDecisionTime | 218 | 0.093119 | 2.767306 | 0.0057 | 0.169 | 0.025182 |
| Exp3 IPS GABA MeanDriftRate | 223 | -0.03727 | -0.82348 | -0.1272 | 0.0674 | 0.461595 |
| Exp3 IPS GABA BoundarySeparation | 221 | 0.124429 | 2.382694 | 0.0053 | 0.2423 | 0.039292 |
| Exp3 IPS GABA NonDecisionTime | 218 | 0.056507 | 0.915952 | -0.1465 | 0.2371 | 0.575368 |
Author response table 3
| Spearman's Rho | P | se | CI_L | CI_U | |
|---|---|---|---|---|---|
| IPS_SNR | -0.222 | <.001 | 0.059 | -0.334 | -0.103 |
| MFG_SNR | -0.329 | <.001 | 0.055 | -0.434 | -0.215 |
| IPS_lw | 0.338 | <.001 | 0.054 | 0.227 | 0.439 |
| MFG_lw | 0.403 | <.001 | 0.05 | 0.299 | 0.495 |
| IPS_GABA_CRLB | -0.12 | 0.058 | 0.064 | -0.244 | 0.008 |
| IPS_Glutamate_CRLB | 0.506 | <.001 | 0.046 | 0.413 | 0.592 |
| MFG_GABA_CRLB | -0.02 | 0.757 | 0.064 | -0.144 | 0.105 |
| MFG_Glutamate_CRLB | 0.486 | <.001 | 0.047 | 0.391 | 0.575 |
Author response table 4
| G1 | G2 | G3 | G4 | G5 | |
|---|---|---|---|---|---|
| IPS GABA | 11.48 | 14.08 | 16.25 | 13.43 | 16.83 |
| IPS glutamate | 6.74 | 7.13 | 8.34 | 7.54 | 8.14 |
| MFG GABA | 18.32 | 17.28 | 17.05 | 20.22 | 18.68 |
| MFG glutamate | 6.46 | 7.25 | 8.48 | 8.00 | 8.33 |
Additional files
-
Supplementary file 1
Gender and mean age (standard deviation in parentheses) during the first (A1, top half) and the second (A2, bottom half) assessment.
- https://cdn.elifesciences.org/articles/84086/elife-84086-supp1-v1.docx
-
Supplementary file 2
Scatterplots depicting the association between chronological age (x-axis) and the diffusion parameters (y-axis) either during the first assessment (A1) or during the second assessment (A2) with a linear (yellow), quadratic (purple) and a cubic (green) fit, in the Attention Network Task (ANT), the Digit Comparison Task (DC), and the Mental Rotation Task (MRT).
1. Mean Drift Rate calculated across all the trials. 2. Boundary separation calculated across all the trials. 3. Non-decision time calculated across all the trials. 4. The three parameters of the alerting network (Task 1). The alerting network was calculated by subtracting the diffusion parameter during the double-cue condition from the same diffusion parameter in the no-cue condition. 5. The three parameters of the orienting network (Task 1). The orienting network was calculated by subtracting the diffusion parameter during the spatial cue condition from the same diffusion parameter in the central cue condition. 6. The three parameters of the executive network (Task 1). The executive network was calculated by subtracting the diffusion parameter during the congruent condition from the same diffusion parameter in the incongruent condition. 7. The three diffusion parameters of the distance effect obtained from contrasting “far” trials vs. “near” trials (Task 2). 8. The three diffusion parameters of the distance effect obtained from contrasting 135 degrees trials vs. 45 degrees trials (Task 3). 9. The three diffusion parameters of the SNARC effect obtained from contrasting low SNARC trials vs high SNARC trials (Task 2).
- https://cdn.elifesciences.org/articles/84086/elife-84086-supp2-v1.docx
-
Supplementary file 3
Multiple linear regressions with bootstrapping predicting overall visuomotor processing (A1: first assessment, A2: second assessment, β=the regression coefficient of the variable listed in the “Effect” column, df=degrees of freedom, T=t-statistic, PB=Bootstrapped P-value, CI_L=lower bound of the confidence intervals obtained from bootstrapping, CI_U=upper bound of the confidence intervals obtained from bootstrapping) for Task 1 (Attention network task, top third), Task 2 (Digit comparison task, middle third), and Task 3 (Mental rotation task, bottom third).
- https://cdn.elifesciences.org/articles/84086/elife-84086-supp3-v1.docx
-
Supplementary file 4
Additional data regarding linear, quadratic, and cubic fits between diffusion parameters and chronological age (Task 1=Attention Network Task, Task 2=Digit Comparison Task, Task 3=Mental Rotation Task, v= mean drift rate, a=boundary separation, Ter=non-decision time, DF= degrees of freedom, rP=Pearson r, pP=p-value of rP, Spearman’s rho=rS, pS=p-value of rS, l.aR2=adjusted R2 of the model featuring the intercept and the linear fit, q.aR2=adjusted R2 of the model featuring the intercept, the linear fit, and the quadratic fit, c.aR2=adjusted R2 of the model featuring the intercept, the linear fit the quadratic and the cubit fit).
Regarding the column “Ord”, here we run three models (i) M1 which featured the intercept and the linear fit, (ii) M2 which featured the intercept, the linear fit and the quadratic fit and (iii) M3 which featured the intercept, the linear fit, the quadratic fit and the cubic fit. Following that, we assigned three p-values, (i) the p-value of the linear fit from M1, (ii) the p-value of the quadratic fit from M2, and (iii) the p-value of the cubic fit from M3. If none of these p-values was less than .05, the “Ord” value is N/A. If only the p-value of the linear fit from M1 is significant then “Ord” is 1, if the p-value of the quadratic fit from M2 is significant but the p-value of the cubic fit from M3 is not significant then “Ord” is 2, and if the p-value of the cubic fit from M3 is significant then “Ord” is 3. Essentially, the “Ord” column indicates the highest order fit that significantly contributes to the data above and beyond the less higher order fit/s. The variables (both for the first and the second assessment) are sorted based on the Pearson’s p-value of the first assessment.
- https://cdn.elifesciences.org/articles/84086/elife-84086-supp4-v1.docx
-
Supplementary file 5
Statistical results of neurochemicals in tracking behavioural performance.
The first column denotes the task (i.e., Task 1, Task 2, or Task 3), the second column denotes the assessment where “A1” concerns the first assessment analyses corresponding to Equation 3, “A2” concerns the second assessment analyses corresponding to Equation 4, and “Prediction” concerns predicting behaviour during the second assessment based on neurochemicals during the first assessment corresponding to Equation 5. The third column has three names separated by underscores, the first name corresponds to the region and the neurochemical used where IPS=intraparietal sulcus and MFG=middle frontal gyrus, and GLU=glutamate, GABA=gamma-Aminobutyric acid and NAA=N-acetylaspartate, the third name corresponds to the diffusion parameter that was used as the dependent variable, and the second name corresponds to the way each diffusion parameter was calculated where overall=the diffusion parameter was calculated across all the trials, AL=alerting network, OR=orienting network, EX=executive network, DISTANCE=the effect of distance, SNARC=the effect of SNARC. For the rest of the columns (df=degrees of freedom, β=standardized coefficient, PBO=bootstrapped P-value), where β (column 5) and PBO (column 6) correspond to the neurochemical*age interaction and β (column 7) and PBO (column 8) correspond to the main effect of the neurochemical. The column “max_VIF” shows the maximum variance inflation factor assessing multicollinearity, and the column “SW” and “SW_P” shows the Shapiro-Wilk statistic and Shapiro-Wilk P-value, respectively, assessing the normality of the residuals in each model. The column “int_R2” is the adjusted R-squared of the model, and the column “non_int_R2” is the adjusted R-squared of the same model, but when omitting the interaction predictor and the column “delta_R2” is the difference between “int_R2” and “non_int_R2”. Of note, the variance inflation factor in the “Prediction” analyses was calculated, including all predictors apart from the predictor “age during the second assessment”, as this predictor is bound to be positively correlated to the predictor “age during the first assessment”.
- https://cdn.elifesciences.org/articles/84086/elife-84086-supp5-v1.docx
-
Supplementary file 6
Statistical results of SF6-eq1 (see below).
To assess whether behaviour during the second assessment (i.e., A2) was predicted by neuroimaging measures during the first assessment (i.e., A1) while controlling for behaviour during the first assessment (i.e., A1), we employed SF6-eq1 as can be seen below which is a variant of (Equation 5) that additionally includes behaviour during the first assessment as can be seen below highlighted in bold. The first column denotes the task (i.e., Task 1, Task 2 or Task 3), the second column (i.e., “Prediction”) concerns predicting behaviour during the second assessment based on neurochemicals during the first assessment. The third column has three names separated by underscores, the first name corresponds to the region and the neurochemical used where IPS=intraparietal sulcus and MFG=middle frontal gyrus, and GLU=glutamate, GABA=gamma-Aminobutyric acid and NAA=N-acetylaspartate, the third name corresponds to the diffusion parameter that was used as the dependent variable, and the second name corresponds to the way each diffusion parameter was calculated where overall=the diffusion parameter was calculated across all trials, AL=alerting network, OR=orienting network, EX=executive network, DISTANCE=the effect of distance, SNARC=the effect of SNARC. For the rest of the columns (df=degrees of freedom, β=standardized coefficient, PBO=bootstrapped P-value), where β (column 5) and PBO (column 6) correspond to the neurochemical*age interaction and β (column 7) and PBO (column 8) correspond to the main effect of the neurochemical. The column “int_R2” is the adjusted R-squared of the model, and the column “non_int_R2” is the adjusted R-squared of the same model, but when omitting the interaction predictor and the column “delta_R2” is the difference between “int_R2” and “non_int_R2”.
- https://cdn.elifesciences.org/articles/84086/elife-84086-supp6-v1.docx
-
Supplementary file 7
Moderated mediation results.
At the start of each entry, the dependent variable (Y), the independent variable (X), the mediator (M), and the moderator (W) are defined and highlighted in bold. 1. IPS GABA moderated mediation model with visuomotor connectivity as the mediator. 2. IPS glutamate moderated mediation model with visuomotor connectivity as the mediator. 3. IPS GABA moderated mediation model with visuomotor processing as the mediator. 4. IPS glutamate moderated mediation model with visuomotor processing as the mediator.
- https://cdn.elifesciences.org/articles/84086/elife-84086-supp7-v1.docx
-
Supplementary file 8
Age moderated the relationship between diffusion parameters and fluid intelligence (CI_L= 95% lower bound confidence interval, CI_U= 95% upper bound confidence interval). We did not control for the other two diffusion parameters in these analyses.
- https://cdn.elifesciences.org/articles/84086/elife-84086-supp8-v1.docx
-
Supplementary file 9
Mean accuracy, mean reaction time (RT) and associated standard deviations (SD) in each of the three tasks (indicated in the first column).
- https://cdn.elifesciences.org/articles/84086/elife-84086-supp9-v1.docx
-
Supplementary file 10
Correlations between the diffusion parameters (v=mean drift rate, a=boundary separation, Ter=non-decision time) within and between tasks.
As expected, positive correlations of the three diffusion parameters were obtained across the three different tasks assessing attention (Task 1, ANT), digit comparison (Task 2, DC) and mental rotation (Task 3, MRT).
- https://cdn.elifesciences.org/articles/84086/elife-84086-supp10-v1.docx
-
Supplementary file 11
Statistical results using the same statistical model as in Supplementary file 3 (multiple linear regressions with bootstrapping predicting overall visuomotor processing during the first and the second assessment) but using the raw neurochemical concentration values (A1: first assessment, A2: second assessment, β=the regression coefficient of the variable listed in the “Effect” column, df=degrees of freedom, T=t-statistic, PB=Bootstrapped P-value, CI_L=lower bound of the confidence intervals obtained from bootstrapping, CI_U=upper bound of the confidence intervals obtained from bootstrapping) for Task 1 (Attention network task, top third), Task 2 (Digit comparison task, middle third), and Task 3 (Mental rotation task, bottom third).
- https://cdn.elifesciences.org/articles/84086/elife-84086-supp11-v1.docx
-
Supplementary file 12
Statistical results using the same statistical model as in Supplementary file 3 (multiple linear regressions with bootstrapping predicting overall visuomotor processing during the first and the second assessment) but using the relative to total creatine neurochemical concentration values (A1: first assessment, A2: second assessment, β=the regression coefficient of the variable listed in the “Effect” column, df=degrees of freedom, T=t-statistic, PB=Bootstrapped P-value, CI_L=lower bound of the confidence intervals obtained from bootstrapping, CI_U=upper bound of the confidence intervals obtained from bootstrapping) for Task 1 (Attention network task, top third), Task 2 (Digit comparison task, middle third), and Task 3 (Mental rotation task, bottom third).
- https://cdn.elifesciences.org/articles/84086/elife-84086-supp12-v1.docx
-
Supplementary file 13
Statistical results using the same statistical model as in Supplementary file 3 (multiple linear regressions with bootstrapping predicting overall visuomotor processing during the first and the second assessment) but using the T2 corrected (Equation 2) neurochemical concentration values (A1: first assessment, A2: second assessment, β=the regression coefficient of the variable listed in the “Effect” column, df=degrees of freedom, T=t-statistic, PB=Bootstrapped P-value, CI_L=lower bound of the confidence intervals obtained from bootstrapping, CI_U=upper bound of the confidence intervals obtained from bootstrapping) for Task 1 (Attention network task, top third), Task 2 (Digit comparison task, middle third), and Task 3 (Mental rotation task, bottom third).
- https://cdn.elifesciences.org/articles/84086/elife-84086-supp13-v1.docx
-
Supplementary file 14
Complementary factor analysis results.
We conducted exploratory factor analyses by adding as input the non-decision time parameters of the three tasks (i.e., three variables as input) after controlling for age, and only one factor was extracted (i.e., eigenvalue>1). As can be seen in the table below, this factor (extraction method: Principal Component Analysis, rotation method: none) was consistently positively related to the non-decision time (Ter) of each of the three tasks.
- https://cdn.elifesciences.org/articles/84086/elife-84086-supp14-v1.docx
-
Supplementary file 15
Statistical results of multiple linear regressions with bootstrapping during the first assessment (β=the regression coefficient of the variable listed in the “Effect” column, PB=Bootstrapped P-value, CI_L=lower bound of the confidence intervals obtained from bootstrapping, CI_U=upper bound of the confidence intervals obtained from bootstrapping).
These additional analyses support that both predictors (i.e., IPS glutamate*age and IPS GABA*age) were independently significant in tracking task performance (non-decision time in Task 1, Task 2 and when Task 1-3 were combined) even when both were added in the same multiple regression model.
- https://cdn.elifesciences.org/articles/84086/elife-84086-supp15-v1.docx
-
Supplementary file 16
To address the possibility that non-linear effects of age could impact the main analyses reported in the main text, we conducted additional analyses where we compared the model in SF16-eq1 to the model in SF16-eq2 using an R-change ANOVA test, which was significant.
- https://cdn.elifesciences.org/articles/84086/elife-84086-supp16-v1.docx
-
MDAR checklist
- https://cdn.elifesciences.org/articles/84086/elife-84086-mdarchecklist1-v1.docx
-
Source data 1
MRS, resting fMRI and behavioural data.
- https://cdn.elifesciences.org/articles/84086/elife-84086-data1-v1.zip
Download links
A two-part list of links to download the article, or parts of the article, in various formats.
Downloads (link to download the article as PDF)
Open citations (links to open the citations from this article in various online reference manager services)
Cite this article (links to download the citations from this article in formats compatible with various reference manager tools)
Dissecting the chain of information processing and its interplay with neurochemicals and fluid intelligence across development
eLife 12:e84086.
https://doi.org/10.7554/eLife.84086


