Myofibroblast senescence promotes arrhythmogenic remodeling in the aged infarcted rabbit heart
- Brown University, United States
- Cardiovascular Research Center, Rhode Island Hospital, United States
- Department of Pharmacology, Institute of Graduate Studies in Health Sciences, Istanbul University, Turkey
- School of Medicine, University of California, Los Angeles, United States
- School of Biosciences and Medicine, University of Surrey, United Kingdom
- Department of Hematology, Rhode Island Hospital, United States
- Medical University of South Carolina, United States
Figures
Figure 1
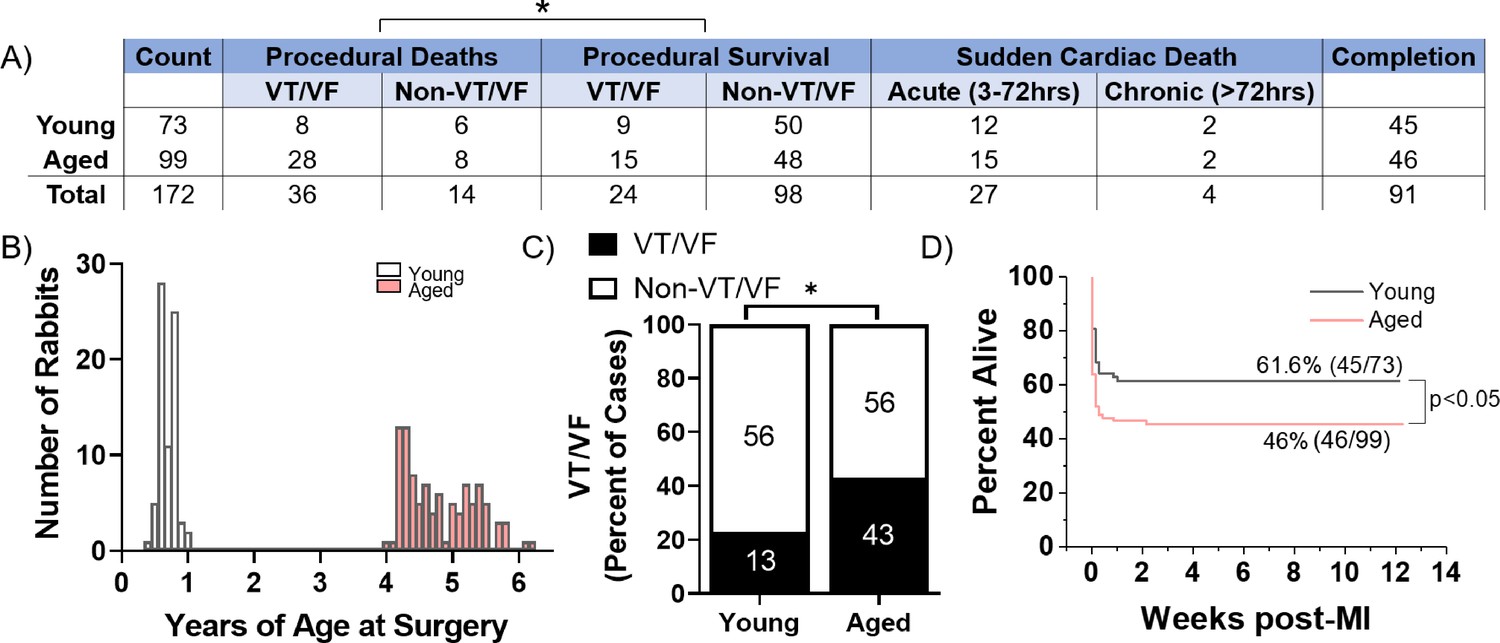
Aged rabbits exhibit increased incidence of peri-procedural arrhythmias.
(A) Survival table of young and aged infarcted rabbits. Procedural deaths were defined as death occurring within the first 3 hr of surgery. (B) Histogram of rabbits included in the study by age at the time of surgery. (C) Incidence of procedural ventricular tachycardia/ventricular fibrillation (VT/VF) in young and aged infarcted rabbits. Numbers inside bars are number of rabbits. *p<0.05, two-tailed exact test. (D) Survival curves of young and aged rabbits post-MI (p<0.05, log rank test).
-
Figure 1—source data 1
Raw data pertaining to rabbits used in the study that was used to create Figure 1.
- https://cdn.elifesciences.org/articles/84088/elife-84088-fig1-data1-v3.xlsx
Figure 2
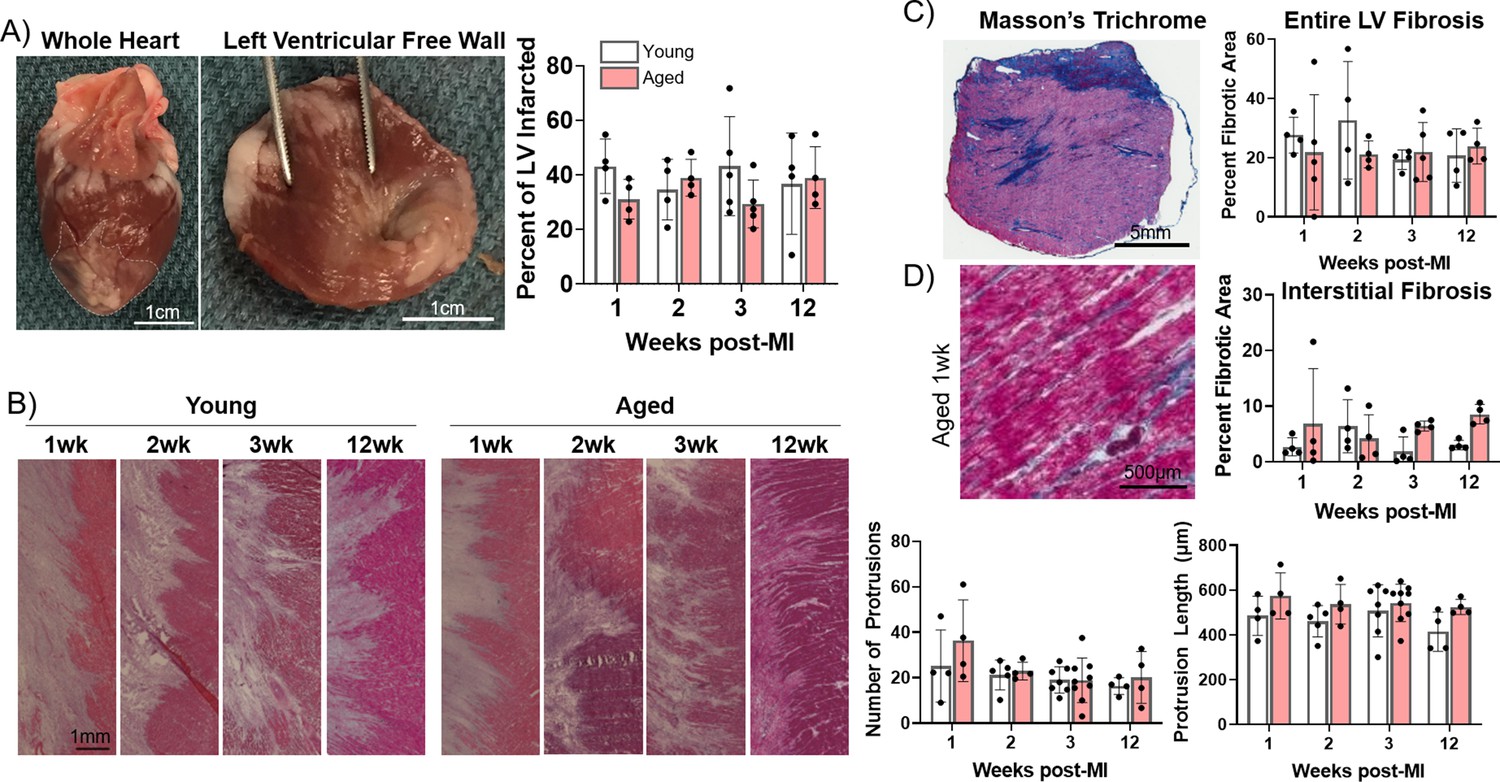
Progression of infarct size, infarct border zone (IBZ) geometry, and fibrosis is consistent between young and aged rabbits.
(A) Left: Whole rabbit heart, with infarct zone outlined. Middle: Dissected left ventricular free wall. Right: Quantification of percent infarcted area of the left ventricular free wall. (B) Left: Representative hematoxylin and eosin (H&E)-stained images of IBZ (left portion of images) protrusions into surviving myocardia (right portion of images). Right: Quantification of number (left) and length (right) of protrusions. (C) Left: Representative Masson’s trichrome-stained left ventricular section. Right: Quantification of percent fibrotic area. (D) Left: Representative Masson’s trichrome-stained remote zone images showing interstitial fibrosis. Right: Quantification of % fibrotic interstitial area. Dots represent average data for each rabbit, error bars SEM.
-
Figure 2—source data 1
Raw data used to create Figure 2.
Each tab contains raw data for the corresponding panel of Figure 2.
- https://cdn.elifesciences.org/articles/84088/elife-84088-fig2-data1-v3.xlsx
Figure 3
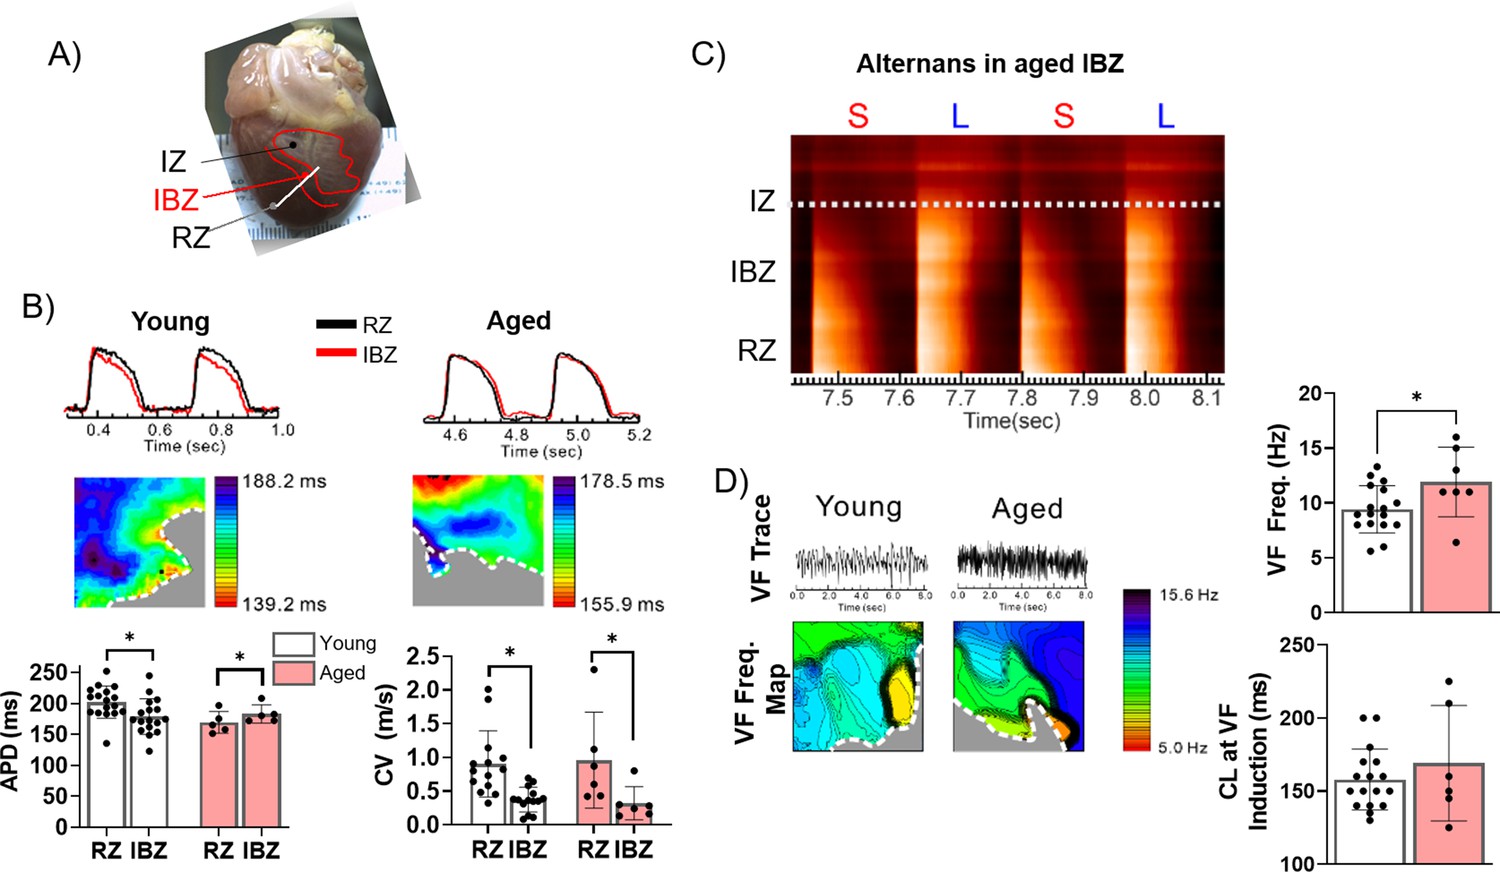
The border zone of aged rabbits shows action potential duration (APD) prolongation, APD alternans, and faster ventricular fibrillation (VF) frequency.
(A) Photograph of a rabbit heart showing the infarct zone (IZ), infarct border zone (IBZ), and remote zone (RZ). White line indicates a representative plane along which alternans images in (C) were recorded. (B) Top: Representative action potential (AP) traces from the RZ and IBZ of young and aged rabbits. Middle: Representative APD maps from young and aged rabbits, showing APD at different points along the border zone. Bottom: Quantification of APD and conduction velocity in the RZ and IBZ of young and aged rabbits. *p<0.05, two-tailed exact test. (C) Representative AP trace of an aged infarcted rabbit at 3 weeks post-MI showing alternans in the IBZ. (D) Top: Representative traces showing VF in young and aged rabbits after electrical induction. Bottom: Representative VF frequency maps of IBZ of young and aged rabbits. Right: Quantification of VF frequency and cycle length at which VF was induced from young and aged rabbits. *p<0.05, two-tailed exact test. Dots represent average data for each rabbit. Error bars: SEM.
-
Figure 3—source data 1
Raw data used to create Figure 3.
Tabs contain raw data corresponding to panel B and panel D.
- https://cdn.elifesciences.org/articles/84088/elife-84088-fig3-data1-v3.xlsx
Figure 4 with 1 supplement
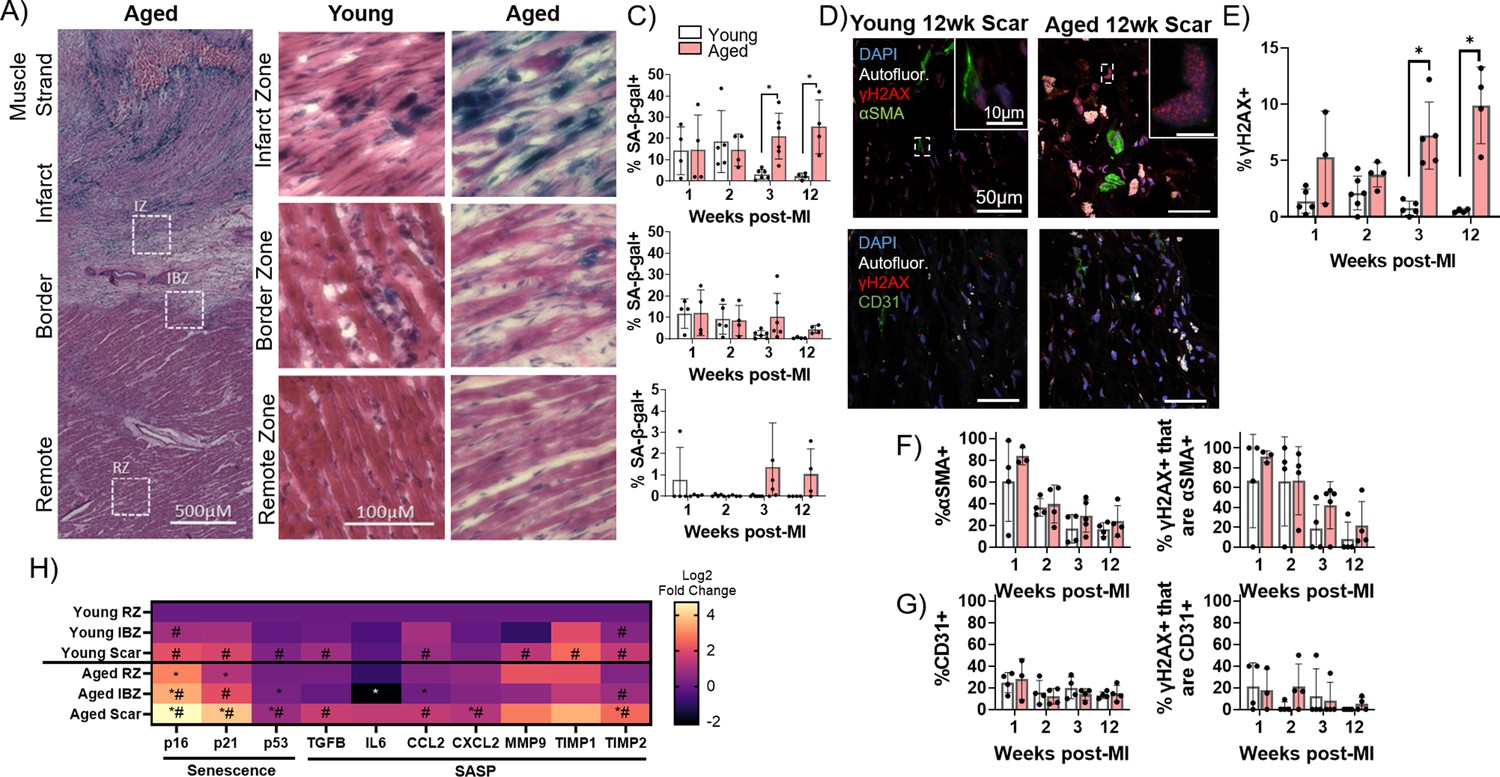
Senescence of myofibroblasts is elevated and persistent in the aged rabbit heart post-MI and correlates with increased inflammation.
(A) Representative senescence-associated β-galactosidase (SA-β-gal)-stained image showing examples of infarct zone, border zone, and remote zone (RZ). (B) Representative SA-β-gal-stained images showing infarct zone, border zone, and RZ from young and aged rabbits at 3 weeks post-MI. (C) Quantification of percent SA-β-gal+ cells from the scar (top), infarct border zone (IBZ) (middle), and RZ (bottom) in young and aged rabbits at 1, 2, 3, and 12 weeks post-MI. (D) Representative confocal images of αSMA/γH2AX double immunofluorescence staining (top row) and CD31/γH2AX double immunofluorescence staining (bottom row) from young (left) and aged (right) in the infarct zone of rabbits at 12 weeks post-MI. White indicates autofluorescence and was used to avoid false positive fluorescence signal. (E) Quantification of % of nuclei with three or more γH2AX foci. (F) Quantification of percent αSMA+ cells (left) and the percent of γH2AX+ cells that are αSMA+ (right). (G) Quantification of percent CD31+ cells (left) and the percent of γH2AX+ cells that are CD31+ (right). (H) Quantification of expression of senescence and senescence-associated secretory phenotype (SASP) genes via RT-qPCR from young and aged rabbits 3 weeks post-MI. N=3 rabbits per condition. Dots represent average data for each rabbit, error bars SEM. Two-tailed exact test: *p<0.05 compared to young, # p<0.05 compared to respective RZ.
-
Figure 4—source data 1
Raw data used to create Figure 4.
Tabs contain data corresponding to panel A, panels E and F, panels E and G, and panel H, respectively.
- https://cdn.elifesciences.org/articles/84088/elife-84088-fig4-data1-v3.xlsx
Figure 4—figure supplement 1
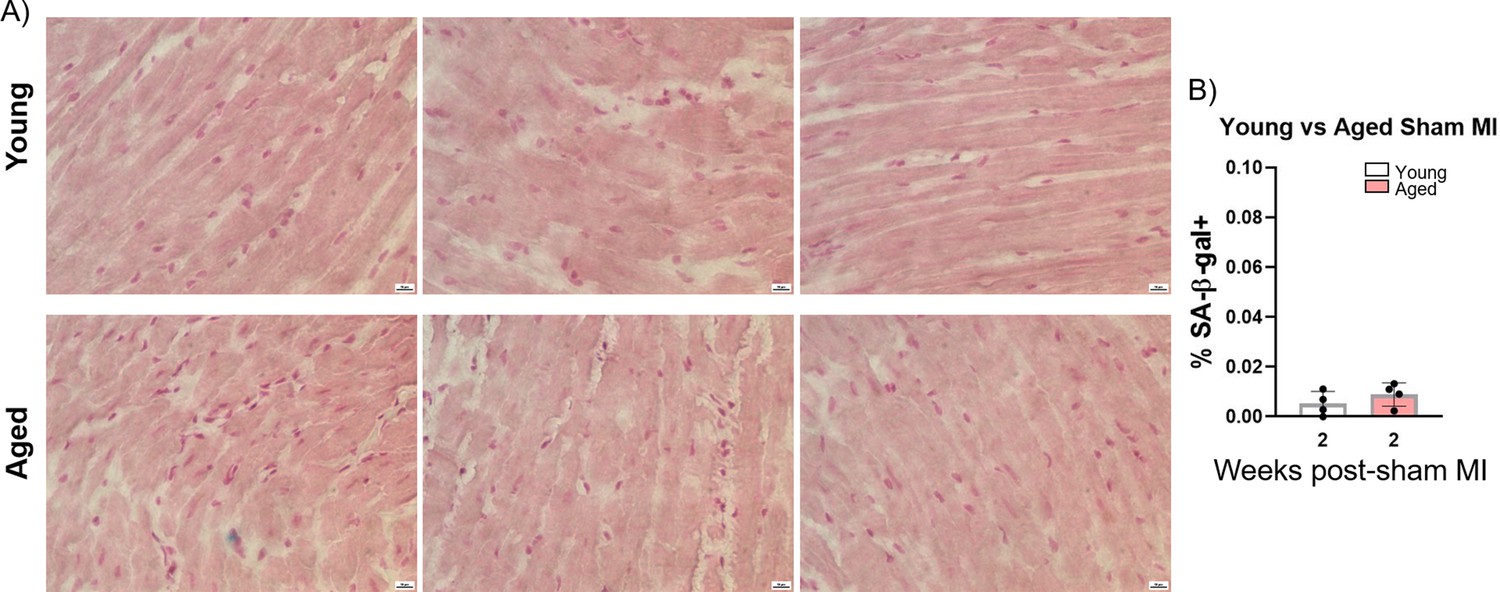
Senescence assessment of young and aged sham-infarcted rabbits.
(A): Representative senescence-associated β-galactosidase (SA-β-gal)-stained images showing examples of myocardial histology in young and aged rabbits 2 weeks after sham infarction. (B) Quantification of percent SA-β-gal+ cells from (A). Dots represent average data for each rabbit, error bars SEM.
-
Figure 4—figure supplement 1—source data 1
Raw data used to create Figure 4—figure supplement 1.
Data corresponds to panel B.
- https://cdn.elifesciences.org/articles/84088/elife-84088-fig4-figsupp1-data1-v3.xlsx
Figure 5 with 1 supplement
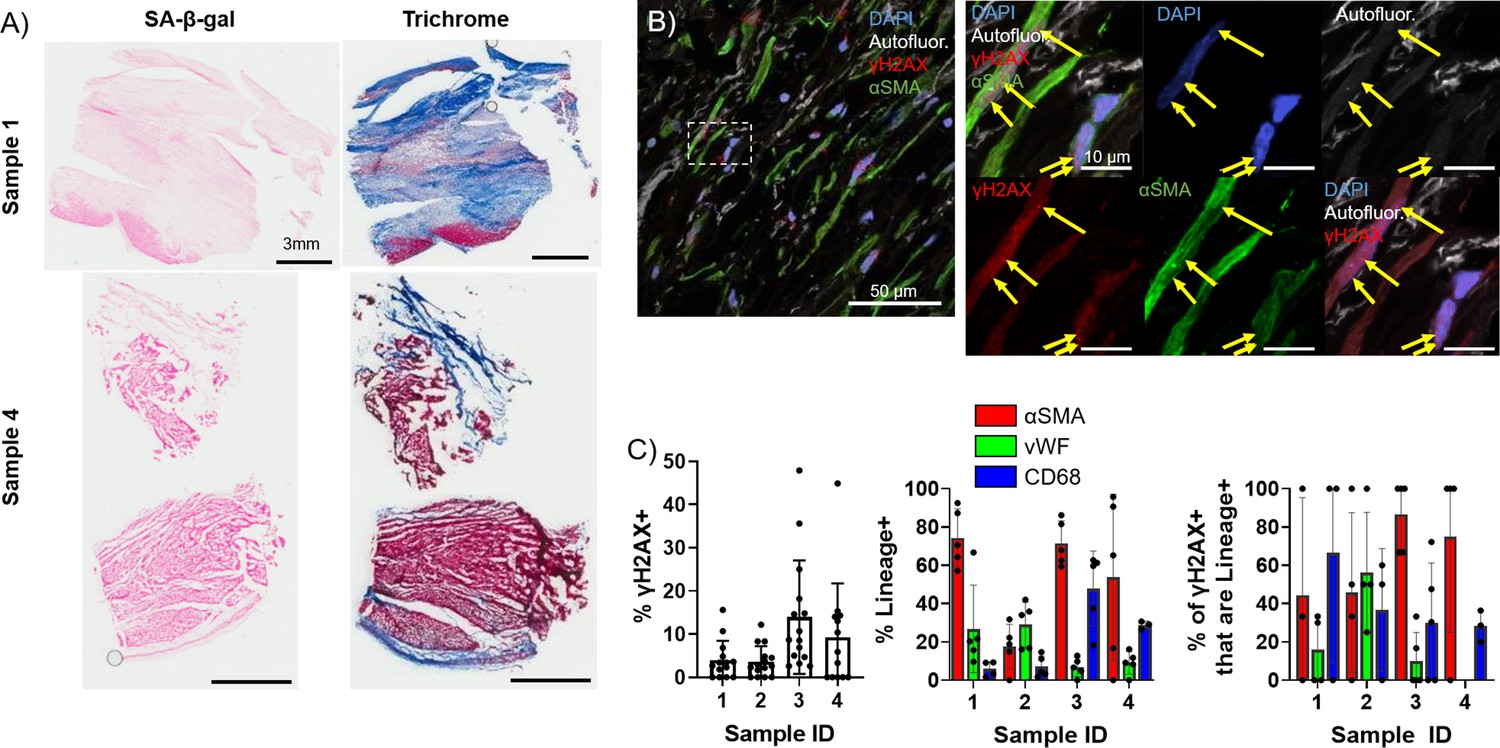
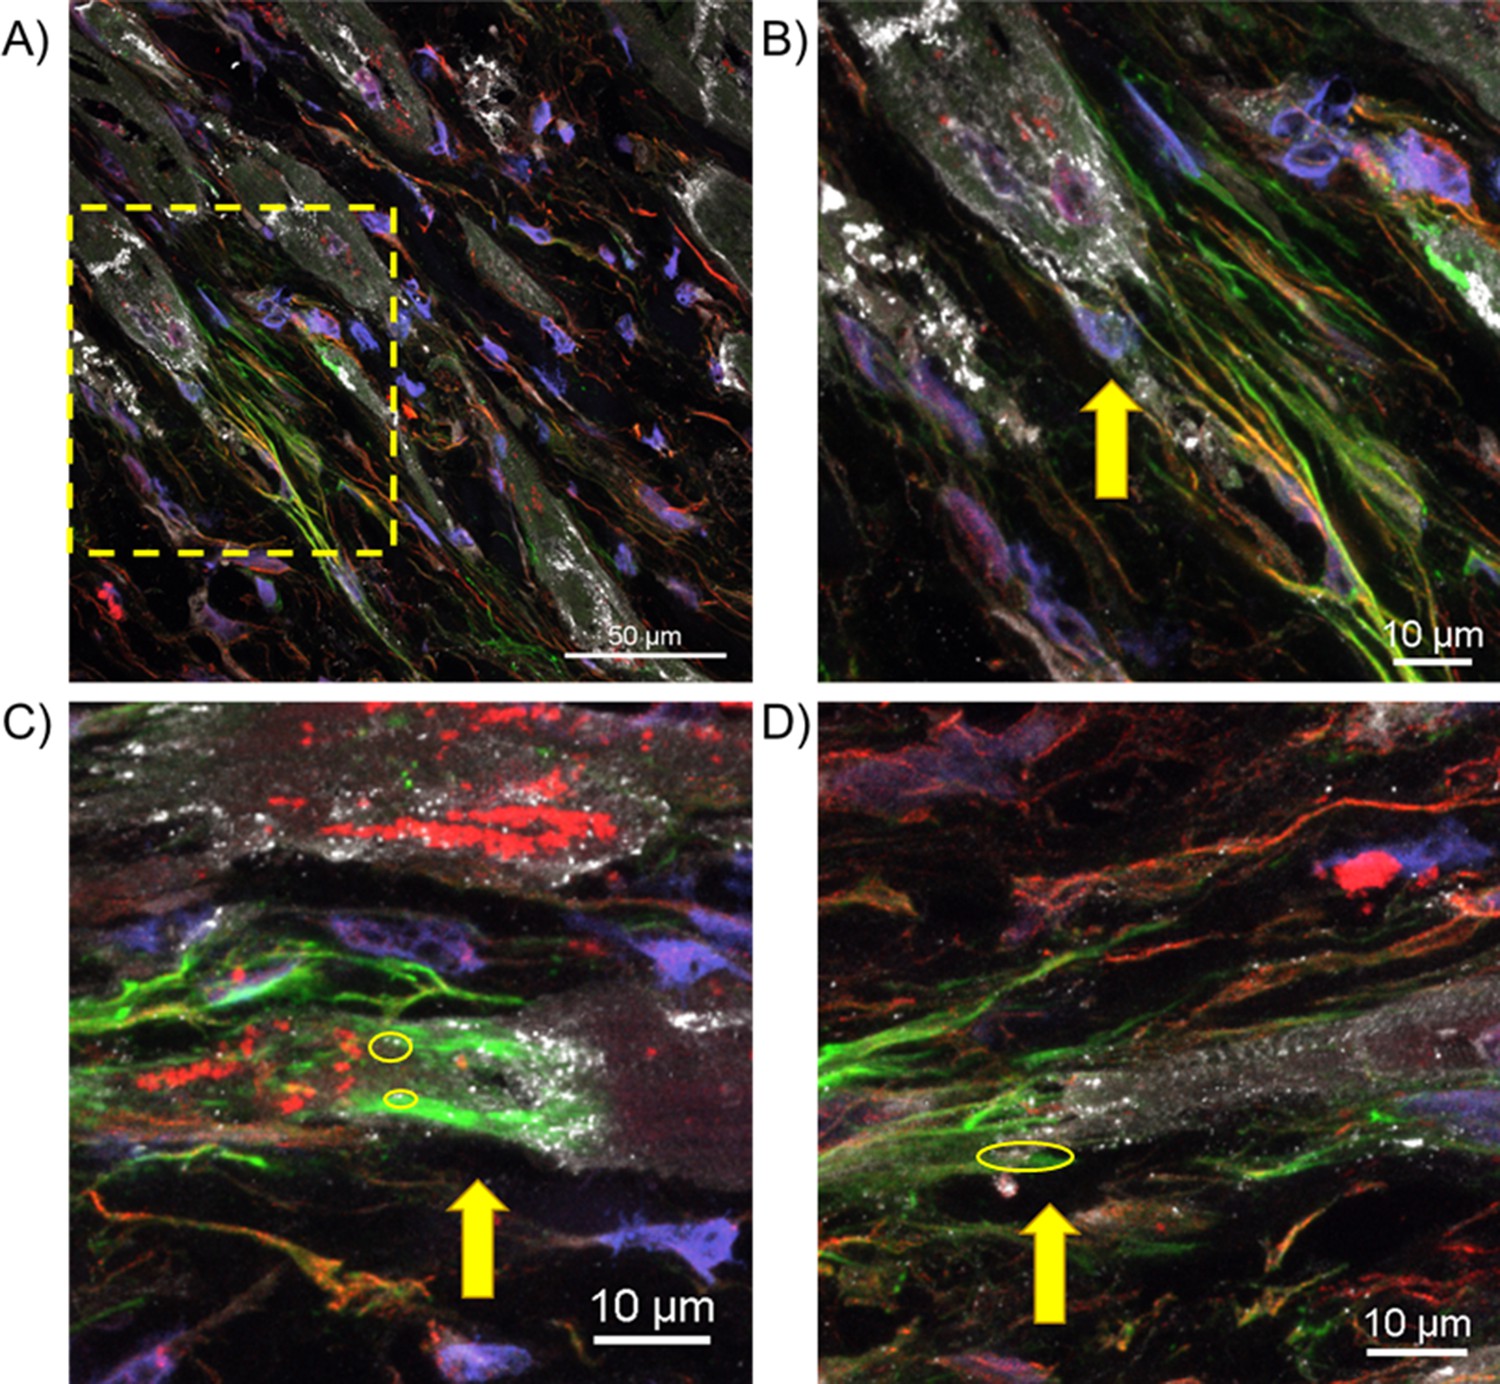
Presence of senescent myofibroblasts in aged infarcted human ventricular tissue.
(A) Representative images of senescence-associated β-galactosidase (SA-β-gal) (left) and trichrome (right)-stained frozen sections. (B) Representative confocal images of γH2AX/αSMA double immunostained frozen sections. Yellow arrows indicate nuclear γH2AX foci. (C) Quantification of % γH2AX+ cells (left), cell identity markers (middle), and % of γH2AX+ positive for cell identity markers (right) from (B). Dots represent average data for multiple scans imaged, error bars SEM.
-
Figure 5—source data 1
Raw data used to create Figure 5, panel C.
- https://cdn.elifesciences.org/articles/84088/elife-84088-fig5-data1-v3.xlsx
Figure 5—figure supplement 1
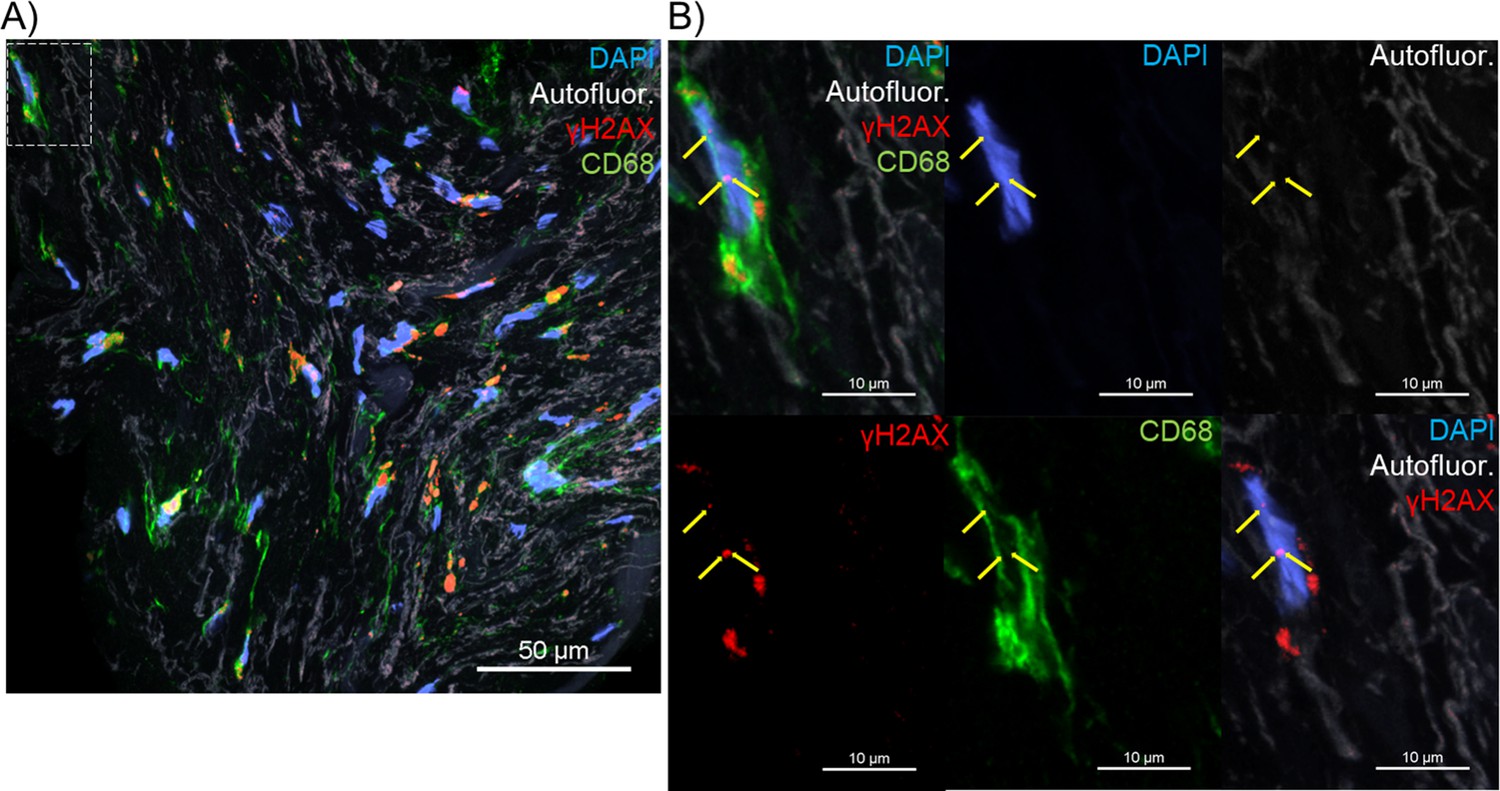
Presence of senescent macrophages in aged infarcted human ventricular tissue.
(A) Representative confocal image of γH2AX/CD68 double immunostained frozen section. (B) Inset of (A). Yellow arrows indicate nuclear γH2AX foci.
Figure 6 with 1 supplement
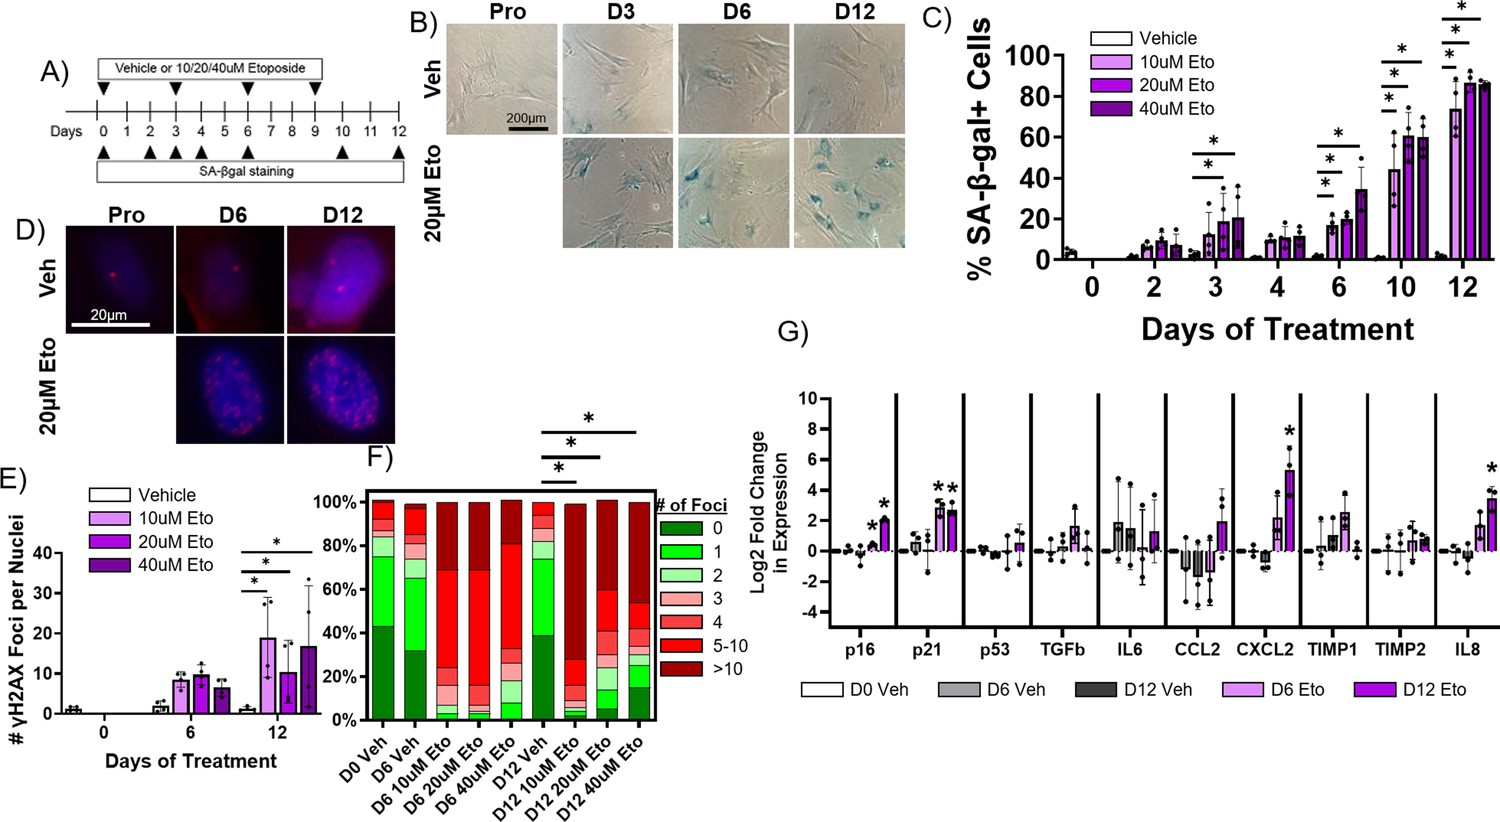
Etoposide induces senescence in adult rabbit cardiac fibroblasts.
(A) Experimental design. (B) Representative senescence-associated β-galactosidase (SA-β-gal)-stained images of treated fibroblasts. (C) Quantification of % SA-β-gal+ cells from (B). (D) Representative nuclear γH2AX-stained images of treated fibroblasts. (I) Quantification of # γH2AX foci from (D). (F) Quantification of distribution of γH2AX foci from (D). (G) Quantification of RT-qPCR of treated fibroblasts. Dots represent average data for experimental replicates, error bars SEM. * p<0.05, one-way ANOVA compared to Vehicle.
-
Figure 6—source data 1
Raw data used to create Figure 6C.
- https://cdn.elifesciences.org/articles/84088/elife-84088-fig6-data1-v3.zip
-
Figure 6—source data 2
Raw data used to create Figure 6F.
- https://cdn.elifesciences.org/articles/84088/elife-84088-fig6-data2-v3.zip
-
Figure 6—source data 3
Raw data used to create Figure 6G.
- https://cdn.elifesciences.org/articles/84088/elife-84088-fig6-data3-v3.xls
Figure 6—figure supplement 1
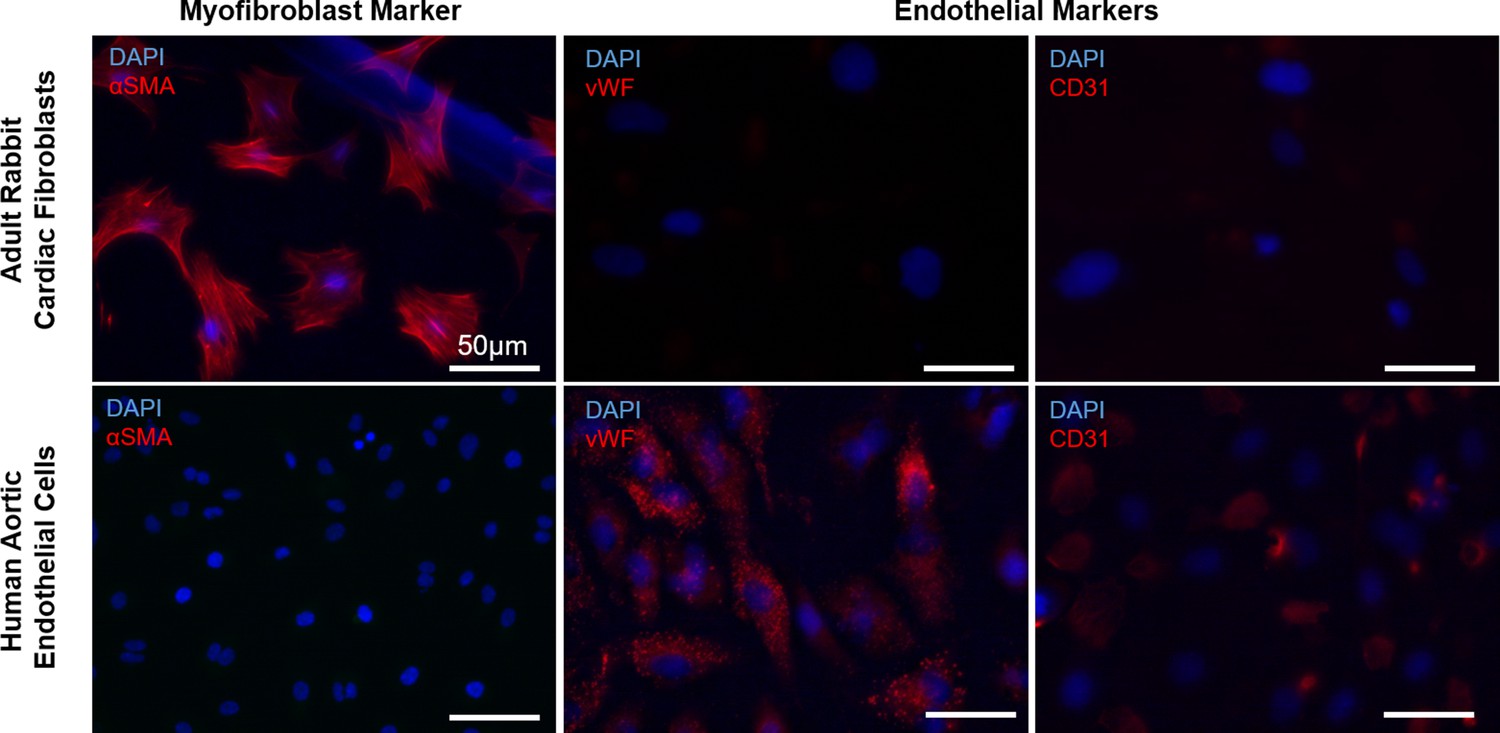
Verification of adult rabbit cardiac fibroblast identity.
Representative images from immunofluorescent staining of adult rabbit cardiac fibroblasts (top) and human aortic endothelial cells (bottom) with myofibroblast and endothelial cell markers.
Figure 7 with 1 supplement
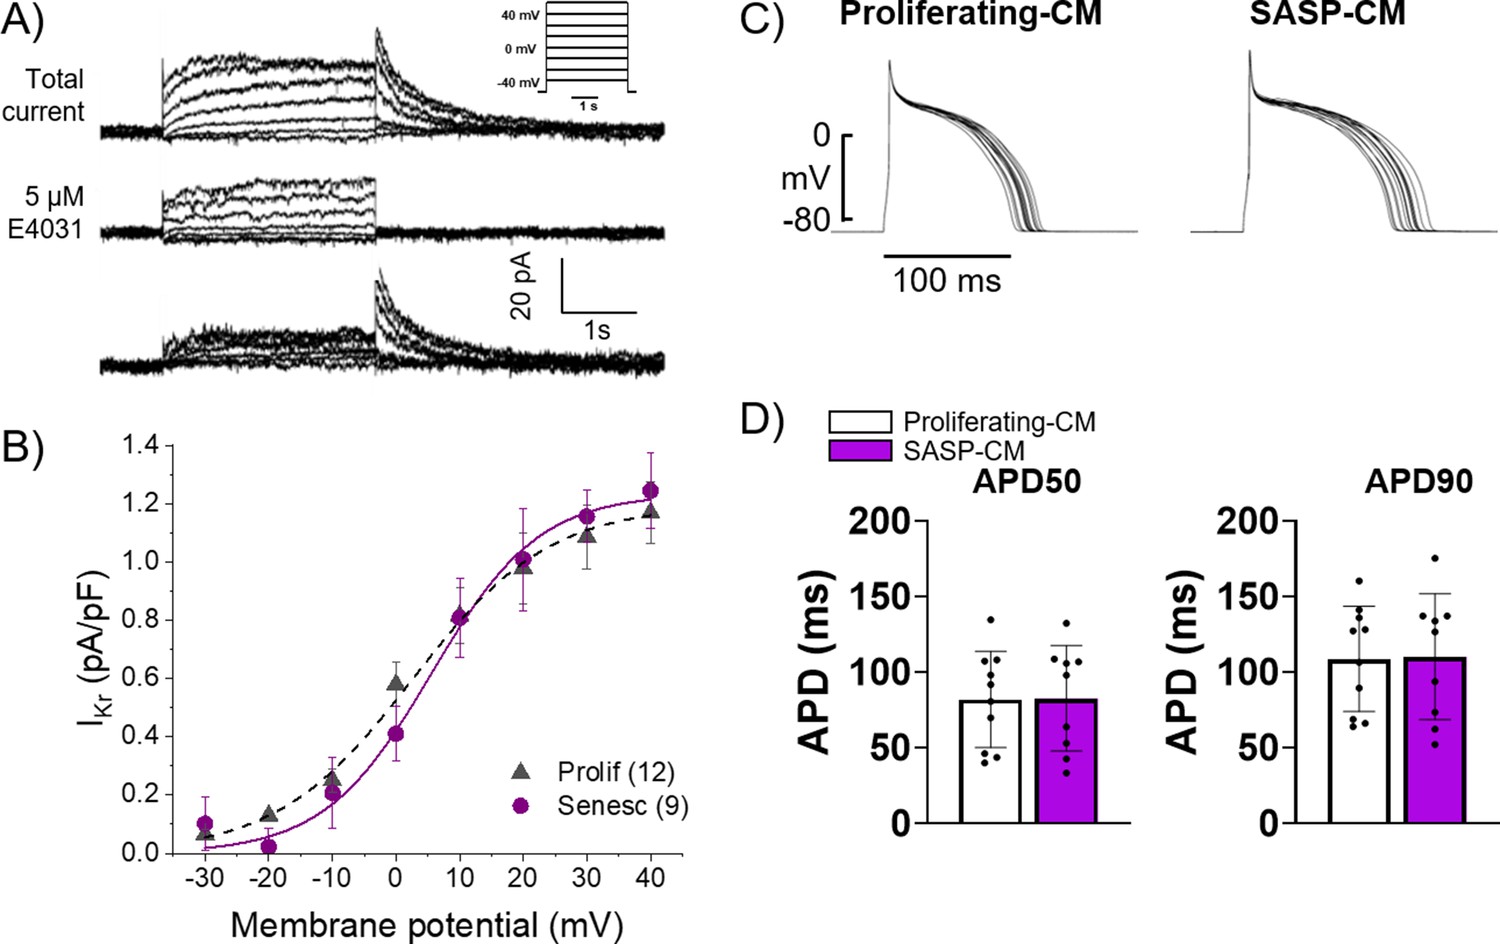
Conditioned media from senescent adult rabbit cardiac fibroblasts does not affect action potential duration (APD) or Ikr.
(A) Representative current traces showing total current, current after application of 5 μM E4031, and their difference that reveals IKr of primary 3-week-old rabbit myocytes treated with conditioned media from adult rabbit cardiac fibroblast. Peak of the tail of IKr was measured at different potentials. Inset shows voltage protocol. (B) Cumulative data of IKr current. Numbers in parenthesis are number of cells analyzed. (C) Representative APD traces from primary 3-week-old rabbit myocytes treated with conditioned media from adult rabbit cardiac fibroblasts. (D) Quantification of (C). Error bars SEM.
-
Figure 7—source data 1
Contains raw data used to create Figure 7B.
- https://cdn.elifesciences.org/articles/84088/elife-84088-fig7-data1-v3.xlsx
-
Figure 7—source data 2
Raw data used to create Figure 7D.
- https://cdn.elifesciences.org/articles/84088/elife-84088-fig7-data2-v3.xlsx
Figure 7—figure supplement 1
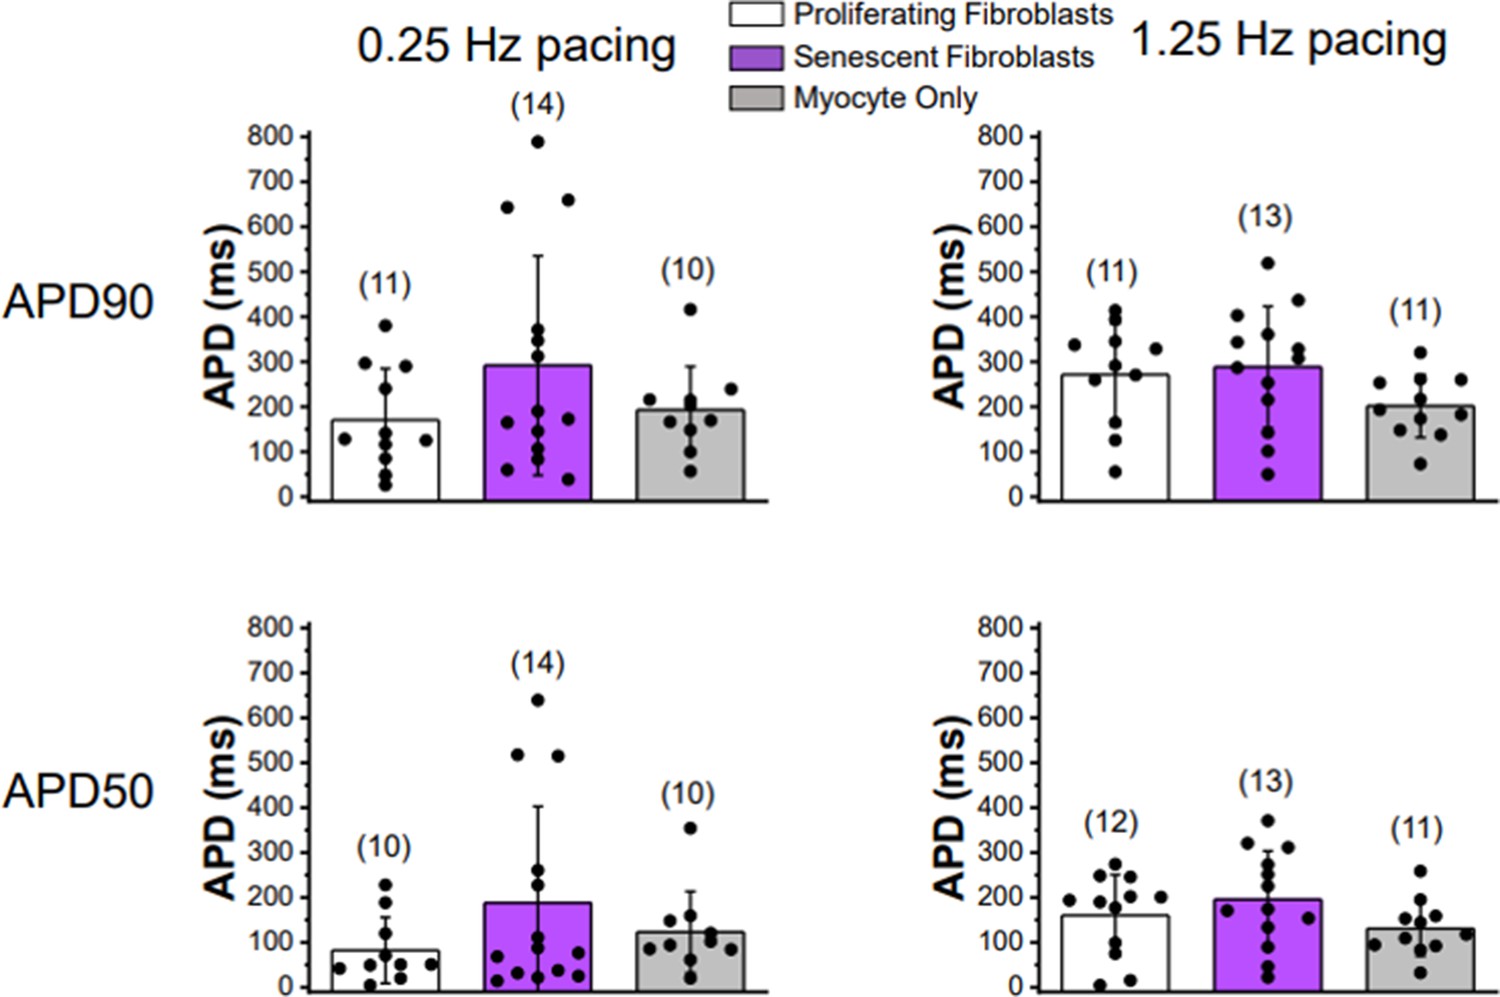
Twenty-four to 30 hr co-culturing of ventricular cardiomyocytes with senescent or proliferating fibroblasts does not significantly affect action potential duration.
Plots of APD at 90% repolarization (top row) or 50% repolarization (bottom row) during 0.25 Hz pacing (left column) and 1.25 Hz pacing (right column). Quantification was performed on primary 3-week-old rabbit myocytes either alone, co-cultured with proliferating adult rabbit cardiac fibroblasts, or senescent adult rabbit cardiac fibroblasts. Numbers in parentheses represent number of cells for five rabbits for co-culture experiments and four rabbits for myocytes only recordings. Error bars SEM.
-
Figure 7—figure supplement 1—source data 1
Raw data used to create Figure 7—figure supplement 1.
- https://cdn.elifesciences.org/articles/84088/elife-84088-fig7-figsupp1-data1-v3.xlsx
Figure 8 with 1 supplement
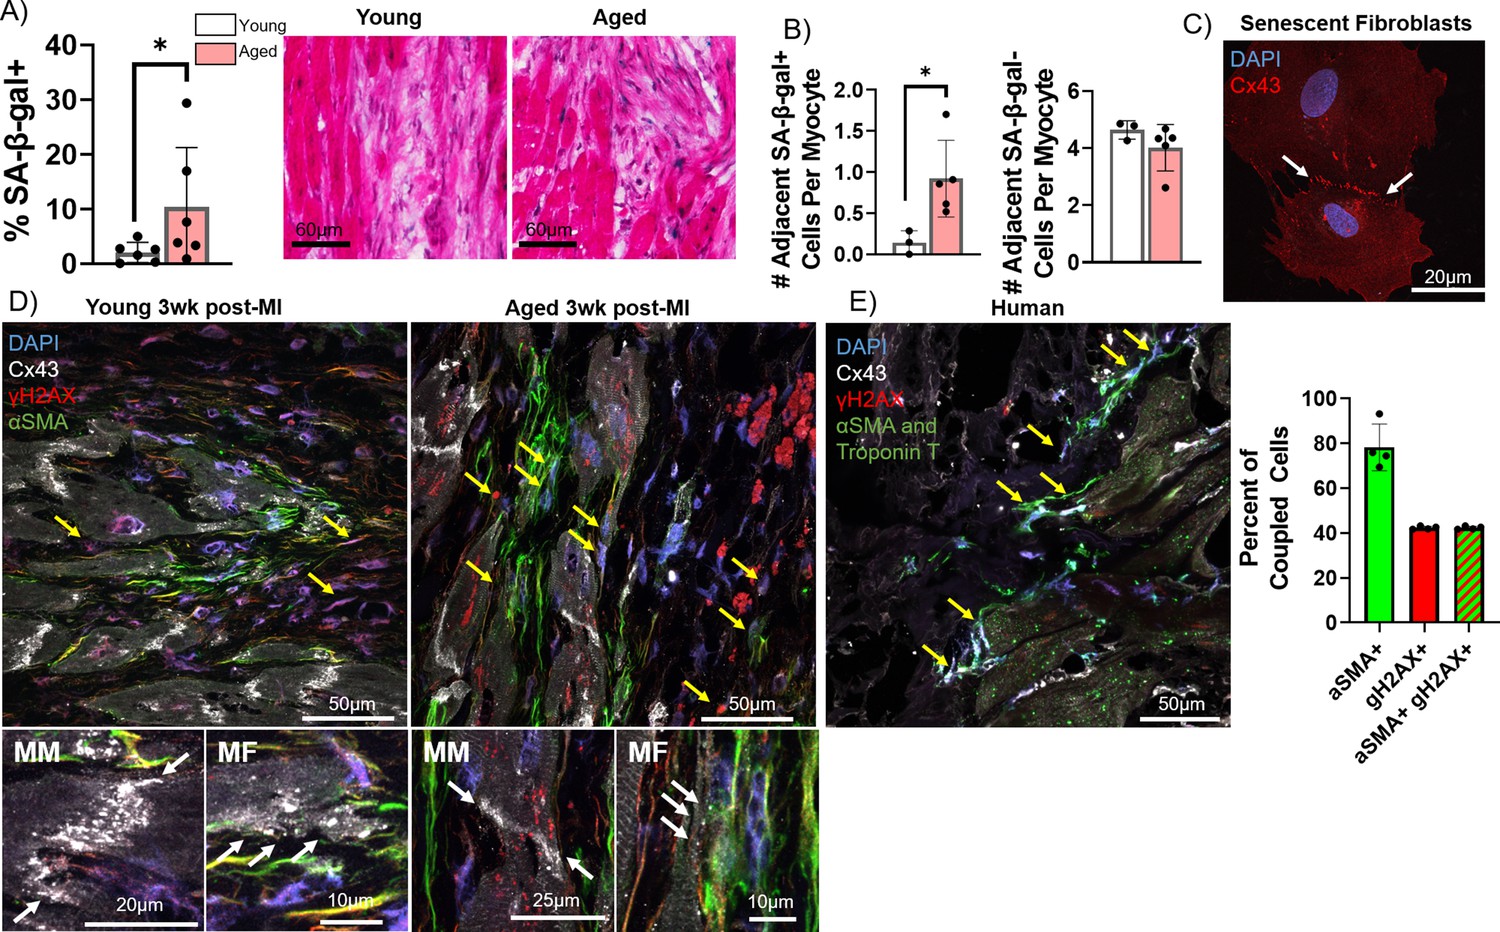
Pro-arrhythmic effect of myocytes coupled to senescent fibroblasts compared to non-senescent fibroblasts.
(A) Quantification of the percent of senescence-associated β-galactosidase (SA-β-gal+) cells adjacent to myocytes (left) and representative SA-β-gal-stained images of the infarct border zone (IBZ) from young and aged rabbits 3 weeks post-MI. (B) Quantification of the number of adjacent SA-β-gal+ cells per myocyte (left) and the number of adjacent SA-β-gal- cells per myocyte (right) from the young and aged rabbit IBZ 3 weeks post-MI. (C) Representative confocal image of senescent adult rabbit cardiac fibroblast immunofluorescent staining against Cx43. Line of Cx43 between cells indicated with white arrows. (D) Representative confocal images of immunofluorescent staining against Cx43, γH2AX, and αSMA of the IBZ of young and aged rabbits 3 weeks post-MI. Yellow arrows indicate nuclei with three or more nuclear γH2AX foci. (E) Representative confocal image (left) of immunofluorescent staining against Cx43, γH2AX, αSMA, and troponin T of the IBZ of aged human IBZ samples and quantification of % of coupled cells (right). Yellow arrows indicate nuclei with three or more nuclear γH2AX foci. αSMA and troponin T staining used the same spectral channel secondary antibody (and are therefore both pseudo-colored green) to avoid autofluorescence, as each marker is specific to myofibroblasts and cardiomyocytes, respectively. Dots represent average data for each rabbit, error bars SEM. * p<0.05, two-tailed exact test.
-
Figure 8—source data 1
Raw data used to create Figure 8.
Tabs contain data used to create panels A and B, and panel E, respectively.
- https://cdn.elifesciences.org/articles/84088/elife-84088-fig8-data1-v3.xlsx
Figure 8—figure supplement 1
Additional representative images of potential cardiomyocyte-myofibroblast couplings mediated by Cx43.
(A) Image of another aged rabbit infarct border zone (IBZ) 3 weeks post-MI, with staining and imaging parameters identical to those presented in Figure 8D. (B) Inset of (A). (C) and (D) Additional images taken from two separate aged rabbit IBZs at 3 weeks post-MI. Yellow circles indicate Cx43 between adjacent cardiomyocytes and myofibroblasts.
Figure 9 with 1 supplement
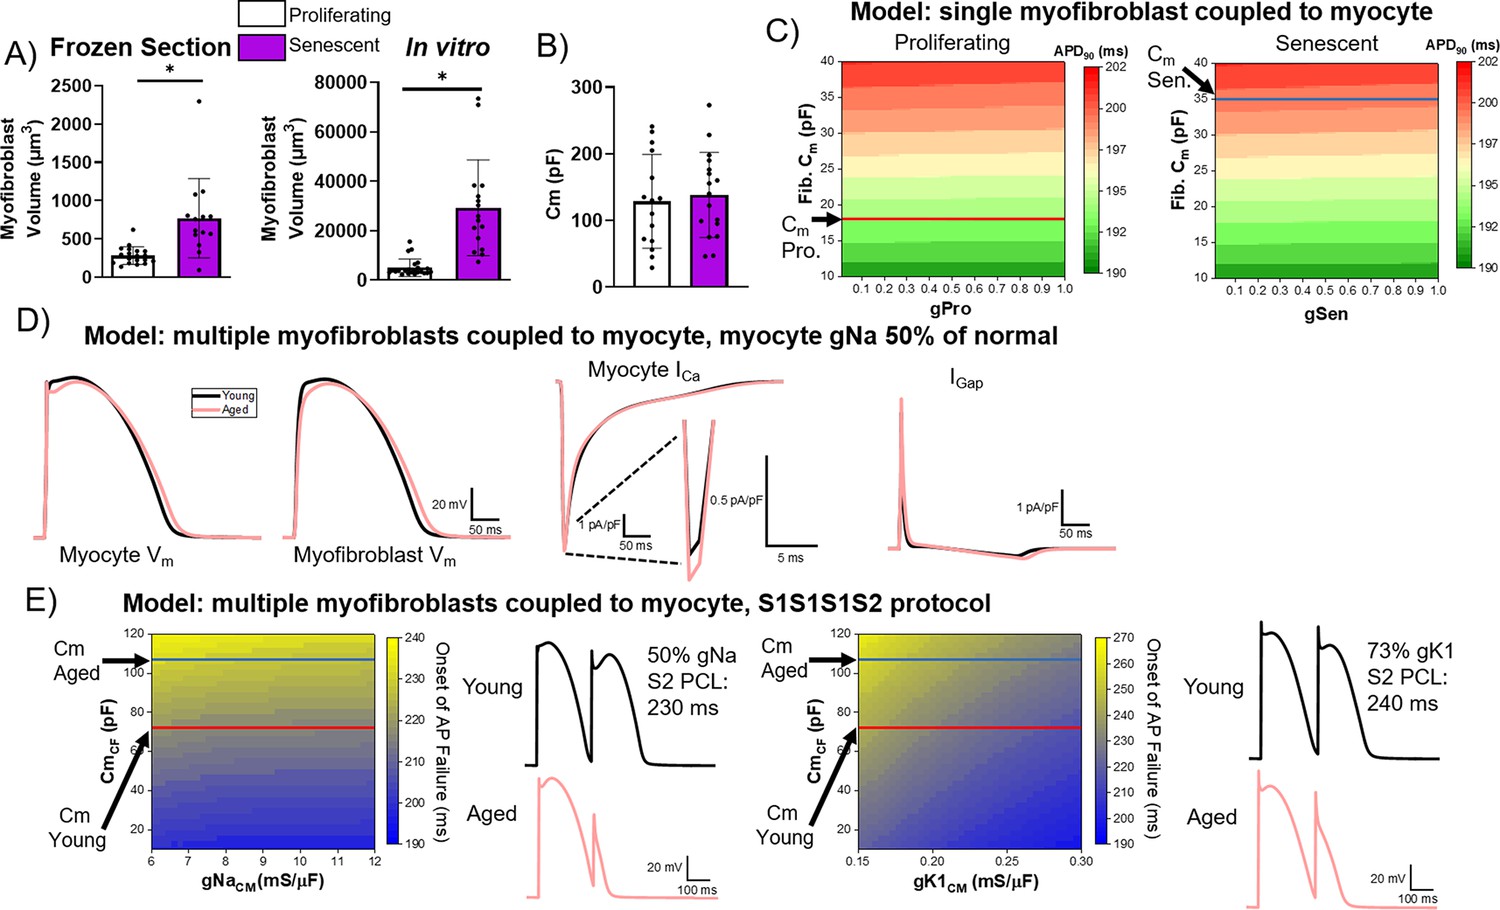
Computational modeling of myocyte-myofibroblast interactions.
(A) Quantification of proliferating and senescent myofibroblast volume from immunofluorescent staining against WGA and γH2AX of frozen tissue sections (left) and adult rabbit cardiac fibroblasts in vitro. (B) Quantification of capacitance of patch clamped proliferating and senescent adult rabbit cardiac myofibroblasts. (C) Modeling of action potential duration (APD)90 from a single myocyte coupled to a single proliferating or senescent fibroblast with gradients of myofibroblast conductance (gPro and gSen) and myofibroblast capacitance. (D) Modeling of myocyte (first panel) and myofibroblast (second panel) action potential traces, as well as ICa and IGap traces from young and aged modeling conditions. (E) S1S2 modeling of young and aged conditions showing onset of action potential failure with gradients of Na channel conductance (gNa) and myofibroblast capacitance, with representative action potential traces (left) and onset of action potential failure with gradients of myocyte inward rectifier channel conductance (gK1) and myofibroblast capacitance, with representative action potential traces (right). Dots represent average data for each cell, error bars SEM. * p<0.05, two-tailed exact test.
-
Figure 9—source data 1
Raw data used to create Figure 9.
- https://cdn.elifesciences.org/articles/84088/elife-84088-fig9-data1-v3.xlsx
Figure 9—figure supplement 1
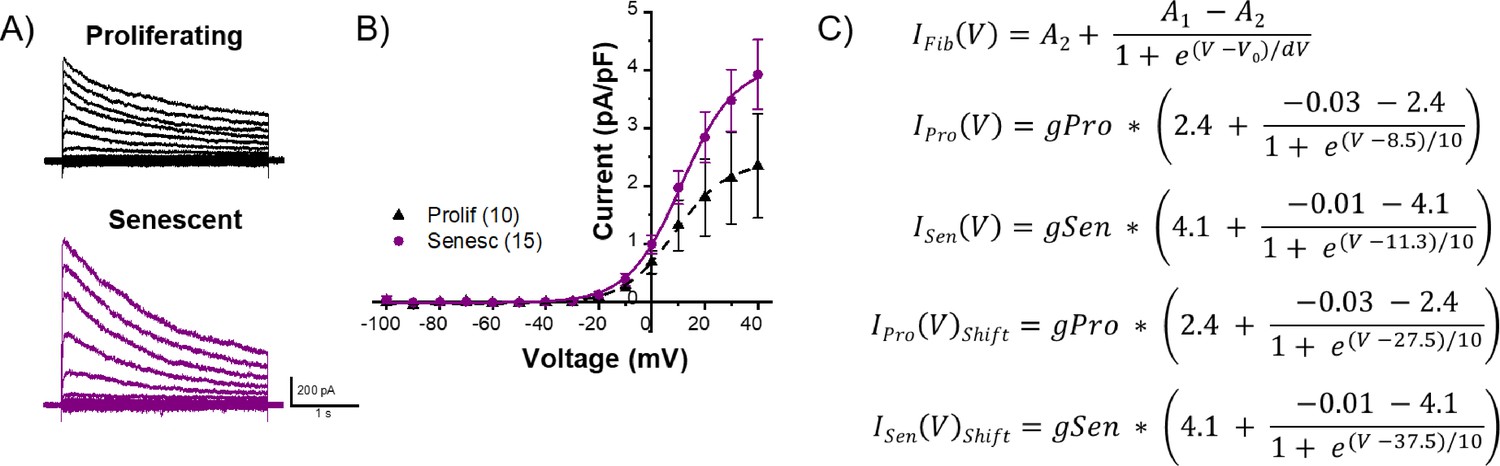
Additional parameters for myocyte-myofibroblast modeling.
(A) Representative current traces of proliferating and senescent adult rabbit cardiac myofibroblasts at various membrane potentials. (B) I-V curves of cumulative data from proliferating and senescent when the currents shown in (A) were measured at the end of corresponding test pulses. (C) Boltzmann equation parameters used for modeling.
Additional files
-
Supplementary file 1
Antibodies used for immunofluorescence staining.
- https://cdn.elifesciences.org/articles/84088/elife-84088-supp1-v3.xlsx
-
Supplementary file 2
Rabbit-specific primers used for qPCR.
- https://cdn.elifesciences.org/articles/84088/elife-84088-supp2-v3.xlsx
-
MDAR checklist
- https://cdn.elifesciences.org/articles/84088/elife-84088-mdarchecklist1-v3.docx
Download links
A two-part list of links to download the article, or parts of the article, in various formats.
Downloads (link to download the article as PDF)
Open citations (links to open the citations from this article in various online reference manager services)
Cite this article (links to download the citations from this article in formats compatible with various reference manager tools)
Myofibroblast senescence promotes arrhythmogenic remodeling in the aged infarcted rabbit heart
eLife 12:e84088.
https://doi.org/10.7554/eLife.84088


