Lmx1a is a master regulator of the cortical hem
- Department of Anatomy and Neurobiology, University of Tennessee Health Science Center, United States
- Department of Developmental Neurobiology, St. Jude Children's Research Hospital, United States
Figures
Figure 1 with 3 supplements
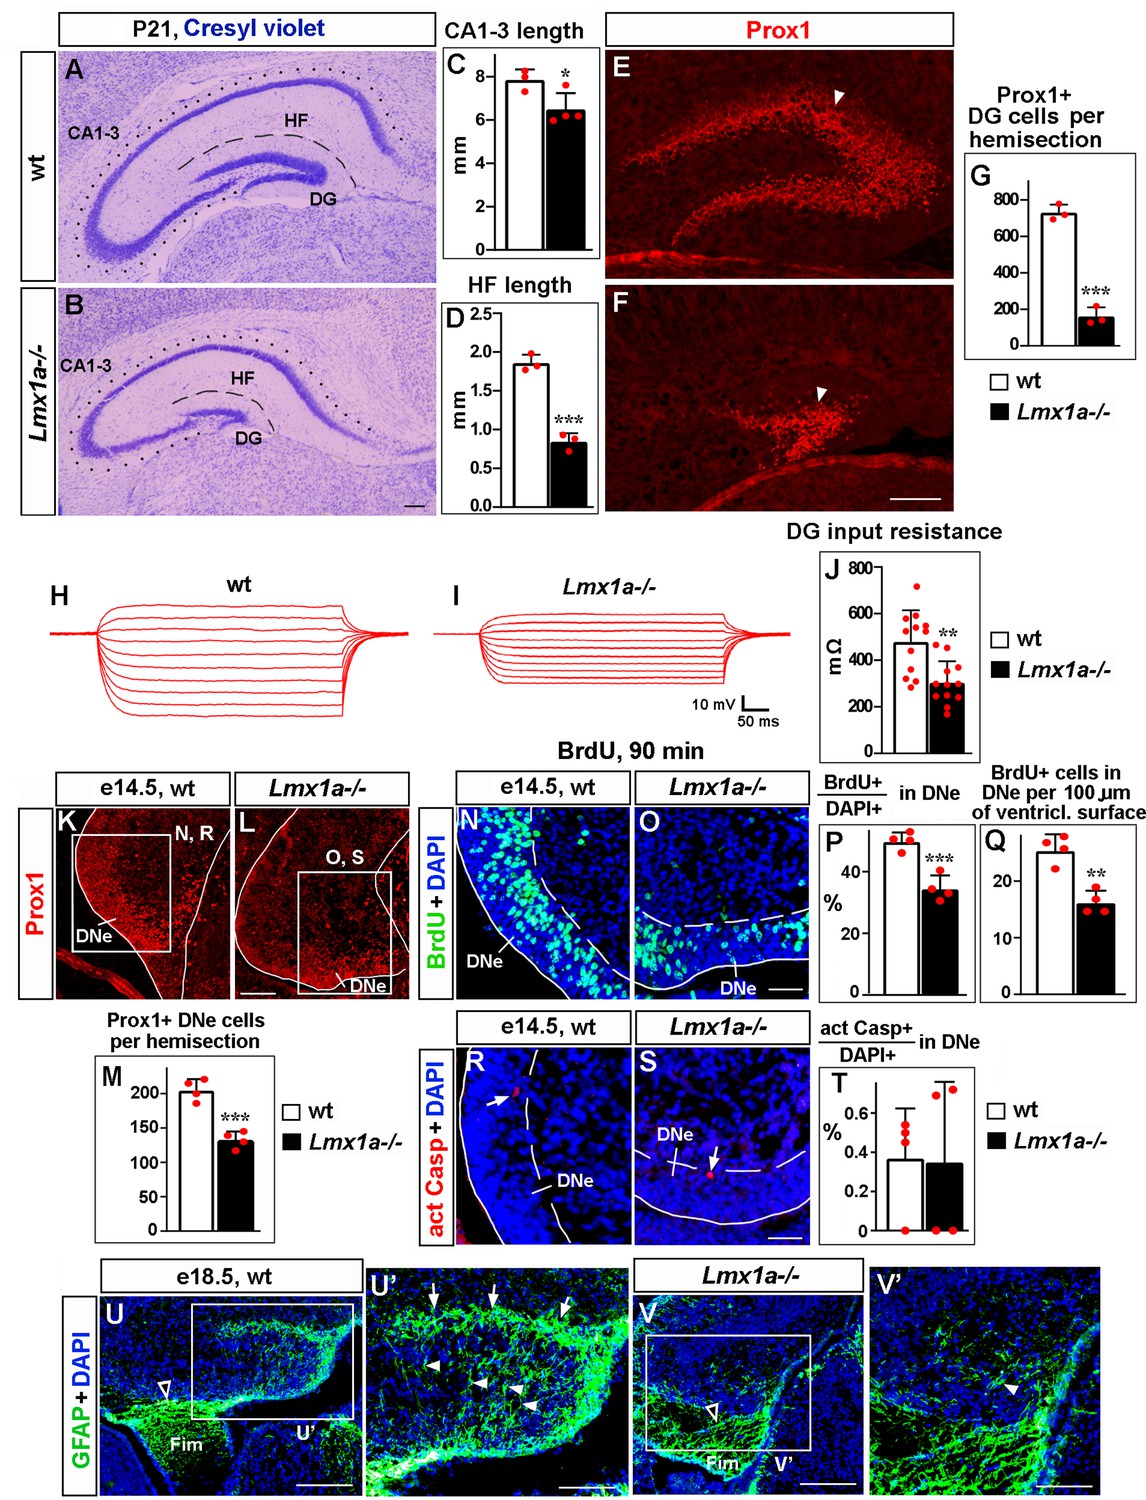
Loss of Lmx1a compromises dentate gyrus (DG) development.
In this and other figures, panels show coronal sections immunostained with indicated antibodies (unless noted otherwise). High-magnification images show regions boxed in adjacent panels or diagrams. wt, wild-type controls. (A–G) In P21 Lmx1a-/- mice, length of the CA1-CA3 hippocampal fields (dotted line in A, B), length of the hippocampal fissure (HF) that overlays the DG (dashed line in A, B), and the number of Prox1+ DG neurons (arrowhead in E, F) were reduced (C, D, G). *p<0.05, ***p<0.001, two-tailed t-test, n = 3–4 animals per genotype. (H–J) Current–voltage curves (H, I) and a bar graph (J) showing a reduced input resistance of DG granule neurons in P21 Lmx1a-/- mice. **p<0.01, two-tailed t-test, N = 12 DG neurons from n = 5 mice per genotype. (K–M) Identification of the dentate neuroepithelium (DNe) by Prox1 immunostaining. Fewer (Prox1+) DNe cells were detected in Lmx1a-/- mutants at e14.5. ***p<0.001, two-tailed t-test, n = 4 embryos per genotype. (N–Q) Proliferation (% of BrdU+ cells among DAPI+ cells after a 90 min BrdU pulse [P] or the number of BrdU+ cells per 100 μm of the ventricular surface [Q]) was reduced in the DNe (identified by Prox1 immunostaining) of e14.5 Lmx1a-/- embryos. **p<0.01, ***p<0.001, two-tailed t-test, n = 4 embryos per genotype. (R–T) Arrows indicate activated Caspase 3+ (apoptotic) cells. Apoptosis (% of apoptotic cells among DAPI+ cells) was not different in the DNe of e14.5 Lmx1a-/- and wild-type embryos. p>0.05, two-tailed t-test, n = 4 embryos per genotype. (U–V’) By late embryogenesis, cortical hem (CH) transforms into fimbria (Fim). The GFAP+ fimbrial scaffold (open arrowheads) was still present (U, V), but the transhilar scaffold was severely diminished in Lmx1a-/- mice (U’, V’). Arrowheads and arrows indicate GFAP+ glial fibers that cross the hilus and enrich at the HF, respectively. Scale bars: 250 μm (A, B, E, F, U, V); 100 μm (K, L, U’, V’); 60 μm (N, O, R, S).
-
Figure 1—source data 1
Data points for Figure 1C, D, G, J, M, P, Q and T.
- https://cdn.elifesciences.org/articles/84095/elife-84095-fig1-data1-v1.xlsx
Figure 1—figure supplement 1
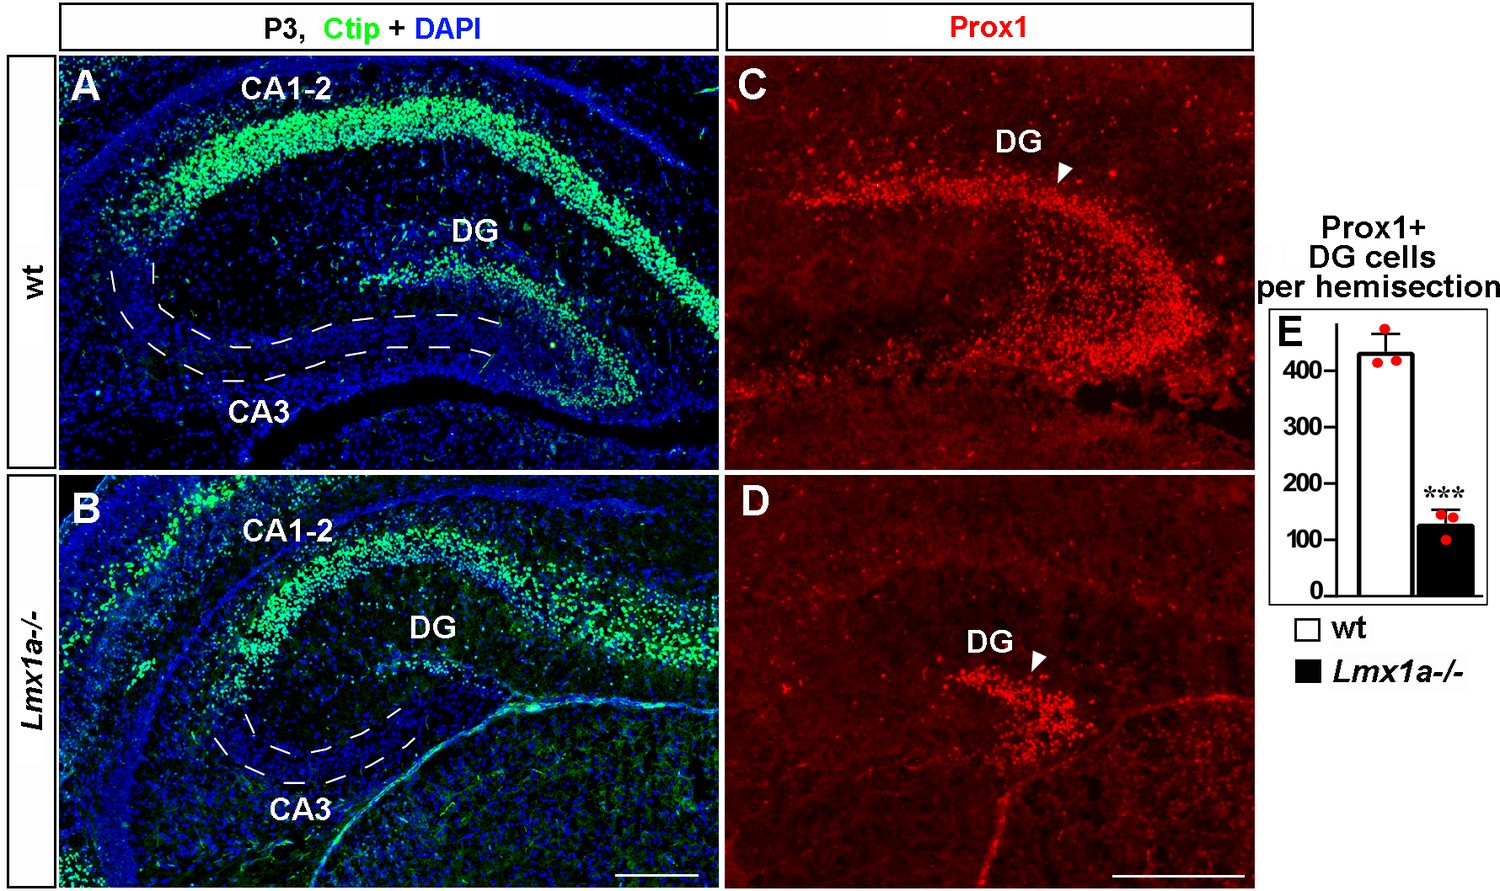
Normal hippocampal patterning but a reduced number of dentate gyrus (DG) neurons in Lmx1a-/- mice at P3.
(A, B) Ctip2 immunohistochemistry revealed normal relative location of the DG, CA3, and CA1-2 hippocampal regions in Lmx1a-/- mice. (C–E) The number of Prox1+ DG neurons (arrowhead) was reduced in P3 Lmx1a-/- mice. ***p<0.01, two-tailed t-test, n = 3 mice per genotype. Scale bars: 200 μm.
-
Figure 1—figure supplement 1—source data 1
Data points for Figure 1—figure supplement 1E.
- https://cdn.elifesciences.org/articles/84095/elife-84095-fig1-figsupp1-data1-v1.xlsx
Figure 1—figure supplement 2
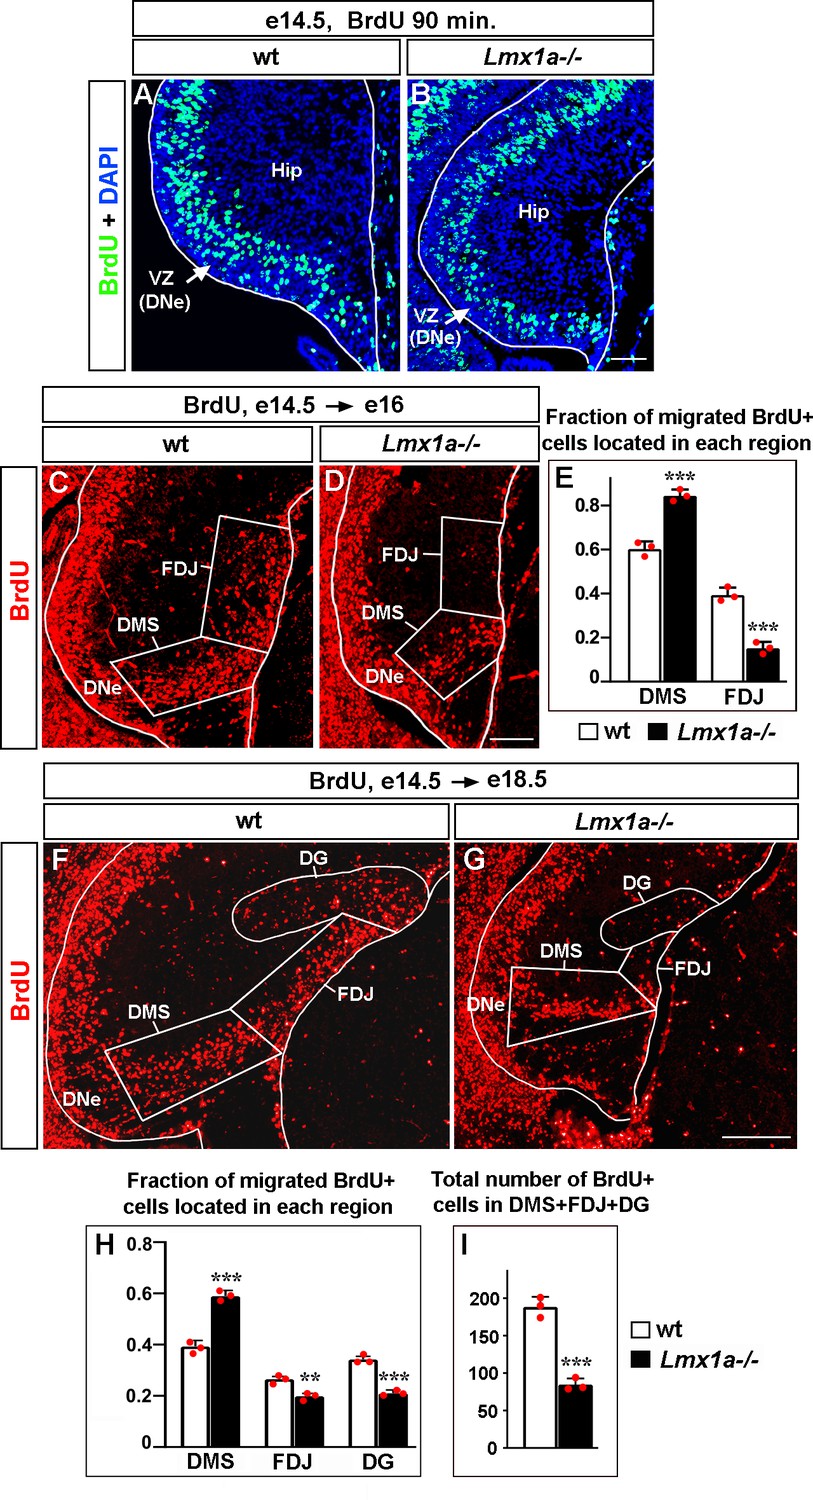
Abnormal distribution of cells migrated from the dentate neuroepithelium (DNe) in Lmx1a-/- mice.
Mice were injected with BrdU at e14.5 to label DNe progenitors and analyzed using immunohistochemistry with antibodies specific for BrdU 90 min after BrdU injection to identify initially labeled cells (A, B), or at e16 (C–E), and e18.5 (F–I) to study the location of BrdU+ migrated cells in the developing hippocampus. (A, B) In both wild type and Lmx1a-/- e14.5 hippocampal primordium (Hip), BrdU injection labeled progenitors located in the ventricular zone, VZ (DNe). (C–E) By e16, in wild type mice, BrdU+ cells migrate radially from the DNe into the dorsal migratory stream (DMS) and tangentially along the outer surface of the hippocampal primordium (fimbria-dentate junction region, FDJ). At e16, BrdU+ cells do not populate the dentate gyrus (DG) region as the DG is not yet formed at this developmental stage (C). In Lmx1a-/- mutants, a larger fraction of migrated BrdU+ cells were located in the DMS region and a smaller fraction of them reached the FDJ, compared to wild-type littermates. ***p<0.001, n = 3 embryos per genotype, two-tailed t-test. (F–I) By e18.5, when DG formation is underway, Lmx1a-/- mutants exhibited a larger fraction of migrated BrdU+ cells located in the DMS (***p<0.001) and smaller fractions of migrated BrdU+ cells that reached the FDJ (**p<0.01) and DG (***p<0.001), compared to wild-type littermates (F–H). n = 3 embryos per genotype, two-tailed t-test. The total number of migrated BrdU+ cells (located in the DMS + FDJ + DG regions) was reduced in Lmx1a-/- embryos relative to wild-type embryos (I). ***p<0.001, n = 3 embryos per genotype, two-tailed t-test. Scale bars: 50 μm (A, B); 100 μm (C, D); 200 μm (F, G).
-
Figure 1—figure supplement 2—source data 1
Data points for Figure 1—figure supplement 2E, H and I.
- https://cdn.elifesciences.org/articles/84095/elife-84095-fig1-figsupp2-data1-v1.xlsx
Figure 1—figure supplement 3
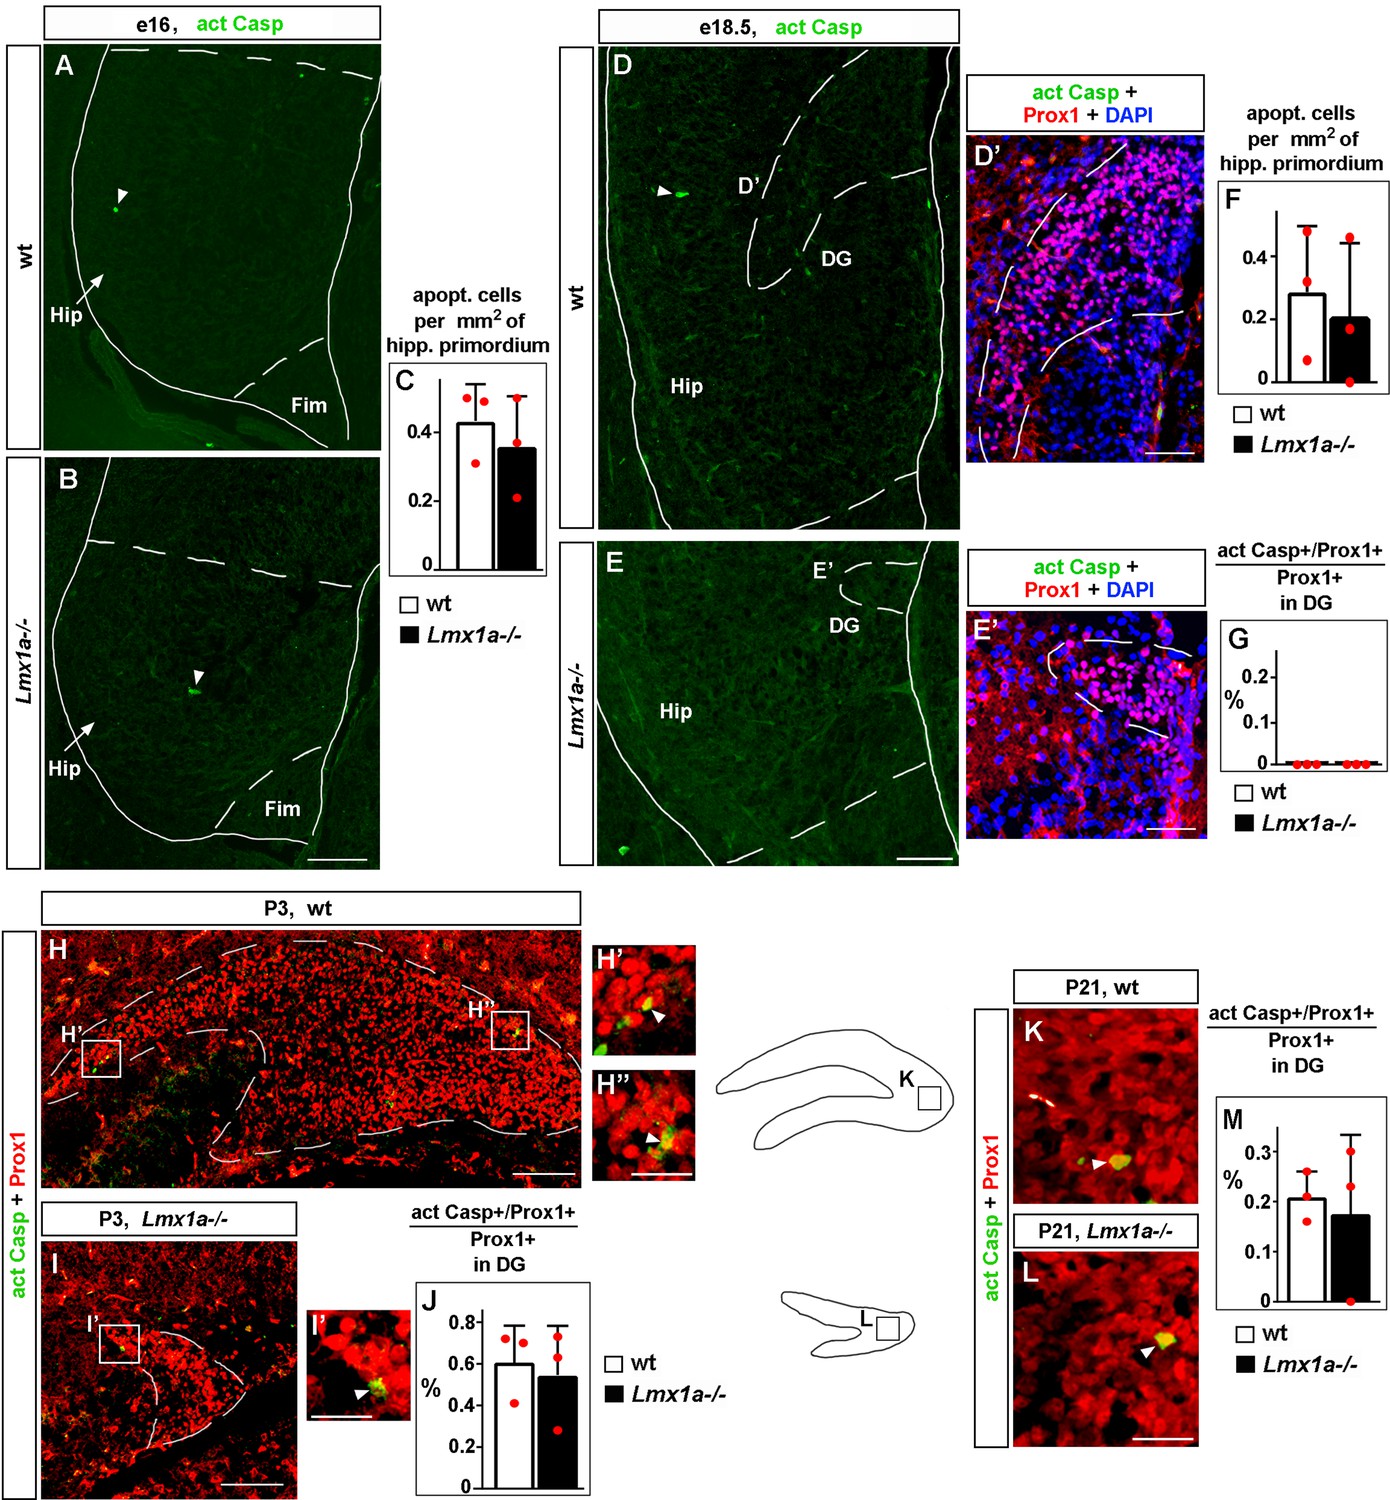
Normal apoptosis in the developing hippocampus in Lmx1a-/- mice.
(A–G) Representative images of the hippocampal primordium (Hip; the region, located between the fimbria and hippocampal fissure [HF] that is demarcated in the images by dashed lines) in e16 (A, B) and e18.5 (D, E) embryos, immunostained with antibodies specific for activated Caspase 3. Arrowheads indicate apoptotic (activated Casp3+) cells. No difference in the number of apoptotic cells per mm2 of hippocampal primordium was detected between control and Lmx1a-/- embryos at any stage (C, F); p>0.05, two-tailed t-test, n = 3 embryos per genotype. (D’, E’) High-magnification images of the dentate gyrus (DG) co-labeled with anti-Prox1 and anti-activated Caspase 3 antibodies at e18.5. We detected no apoptotic Prox1+ DG cells in the DG of control or Lmx1a-/- embryos at e18.5 (G) (no difference between the genotypes), p>0.05, two-tailed t-test, n = 3 embryos per genotype. Fim, fimbria. (H–M) Representative images of the DG in P3 (H–I’) and P21 (K, L) mice co-labeled with antibodies specific for Prox1 and activated Caspase 3. Arrowheads indicate apoptotic (activated Casp3+/Prox1+) DG cells. Similar fractions of apoptotic cells were detected in the DG of control and Lmx1a-/- mice at both P3 (J) and P21 (M); p>0.05 between the genotypes, two-tailed t-test, n = 3 embryos per genotype per stage. Scale bars: 100 μm (A, B, D, E, H, I); 50 μm (D’, E’); 25 μm (H’, H’’, I’, K, L).
-
Figure 1—figure supplement 3—source data 1
Data points for Figure 1—figure supplement 3C, F, G, J and M.
- https://cdn.elifesciences.org/articles/84095/elife-84095-fig1-figsupp3-data1-v1.xlsx
Figure 2 with 4 supplements
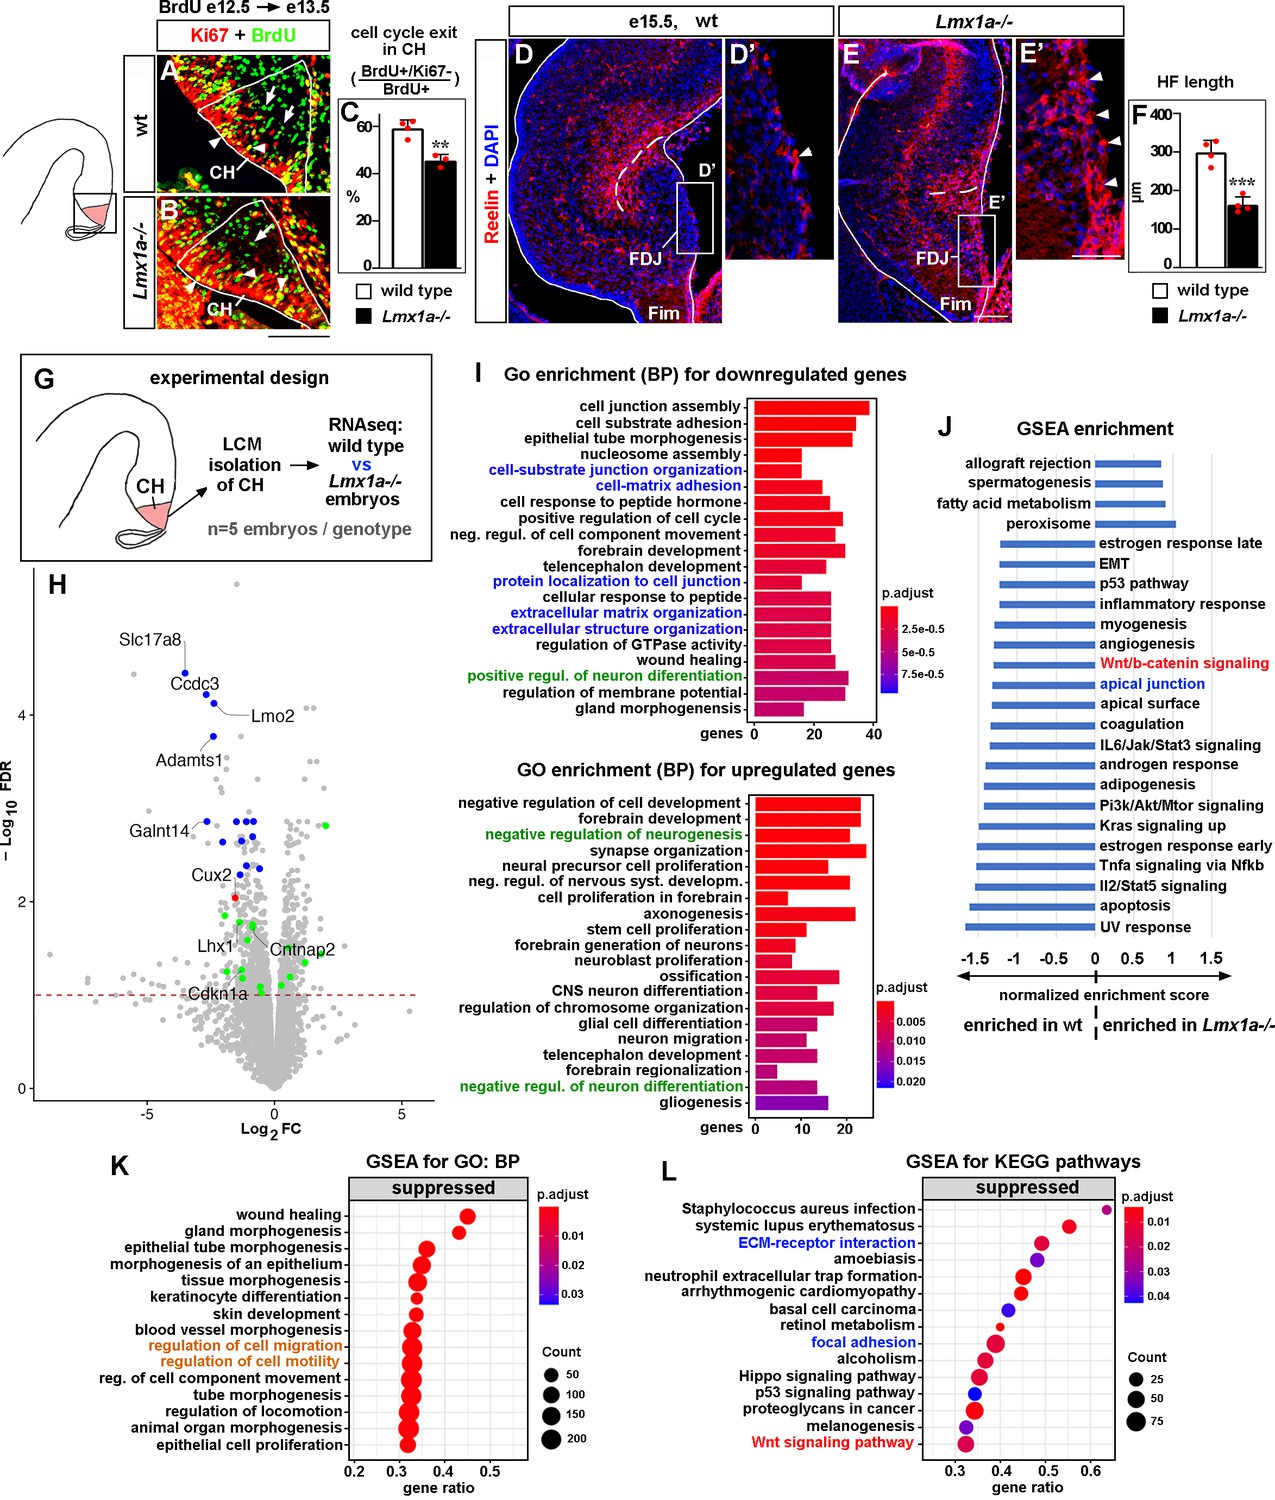
Developmental processes compromised in the cortical hem (CH) of Lmx1a-/- mice.
(A–C) A reduced fraction (%) of progenitors exited the cell cycle in the CH of Lmx1a-/- embryos. 24 hr after BrdU injection, progenitors that exited the cell cycle were BrdU+/Ki67- (green, arrows); progenitors that re-entered the cell cycle were BrdU+/Ki67+ (yellow, arrowheads). **p<0.01, two-tailed t-test, n = 3–4 embryos per genotype. (D–F) By e15.5, in wild-type embryos, many Cajal–Retzius (CR) cells have already migrated into the hippocampal fissure (HF) area, and few CR cells remain at the fimbria-dentate junction (FDJ) surface (D, D’, arrowhead). In contrast, many CR cells were still located at the FDJ surface in Lmx1a-/- littermates (E, E’, arrowheads), which was associated with a reduced HF length (dashed line in D–F). ***p<0.001, two-tailed t-test, n = 4 embryos per genotype. (G) Experimental design for RNAseq analysis. (H) Volcano plot of transcripts detected by RNAseq. Transcripts above the dashed line (false discovery rate [FDR] = 0.1) were considered differentially expressed in Lmx1a-/- CH. CH markers, identified among the 100 most misregulated genes, are shown in blue (also see Figure 2—figure supplement 3); genes associated with CR cells (Franzén et al., 2019; Li et al., 2021) are shown in green; the only previously identified Lmx1a target in the CH, Cux2 (Fregoso et al., 2019), is shown in red. (I) GO (biological process, BP) enrichment analysis for the genes differentially expressed in Lmx1a-/- CH. (J) Pathways enriched in wild-type and Lmx1a-/- CH based on Gene Set Enrichment Analysis (GSEA) of RNAseq data. (K, L) Top 15 pathways/processes suppressed in the Lmx1a-/- CH based on GSEA for GO (BP) and GSEA for Kyoto Encyclopedia of Genes and Genomes (KEGG) analyses. Processes/pathways related to neuronal differentiation, cell migration, Wnt signaling, and tissue integrity are highlighted in green, orange, red, and blue, respectively. Scale bars: 100 μm (A, B, D, E); 50 μm (D’, E’).
-
Figure 2—source data 1
Data points for Figure 2C and F.
- https://cdn.elifesciences.org/articles/84095/elife-84095-fig2-data1-v1.xlsx
Figure 2—figure supplement 1

Normal proliferation and apoptosis in the cortical hem (CH) of Lmx1a-/- embryos at e12.5.
(A–C) Proliferation (% of BrdU+ cells in the CH after a 90 min BrdU pulse) was similar in wild-type and Lmx1a-/- embryos. p>0.05, two-tailed t-test, n = 3 embryos per genotype. Lmx1a immunohistochemistry was used to identify the CH (outlined by dashed line). (Note that in our Lmx1a-/- mice, Lmx1a is inactivated by a point mutation in the drJ allele [Chizhikov et al., 2006; Deng et al., 2011], which leads to the production of inactive Lmx1a protein detectable by immunohistochemistry.) (D–F) The number of apoptotic (activated Caspase 3+) cells in the CH was similar in Lmx1a-/- and wild-type embryos. p>0.05, two-tailed t-test, n = 3 embryos per genotype. Scale bars: 100 μm.
-
Figure 2—figure supplement 1—source data 1
Data points for Figure 2—figure supplement 1C and F.
- https://cdn.elifesciences.org/articles/84095/elife-84095-fig2-figsupp1-data1-v1.xlsx
Figure 2—figure supplement 2
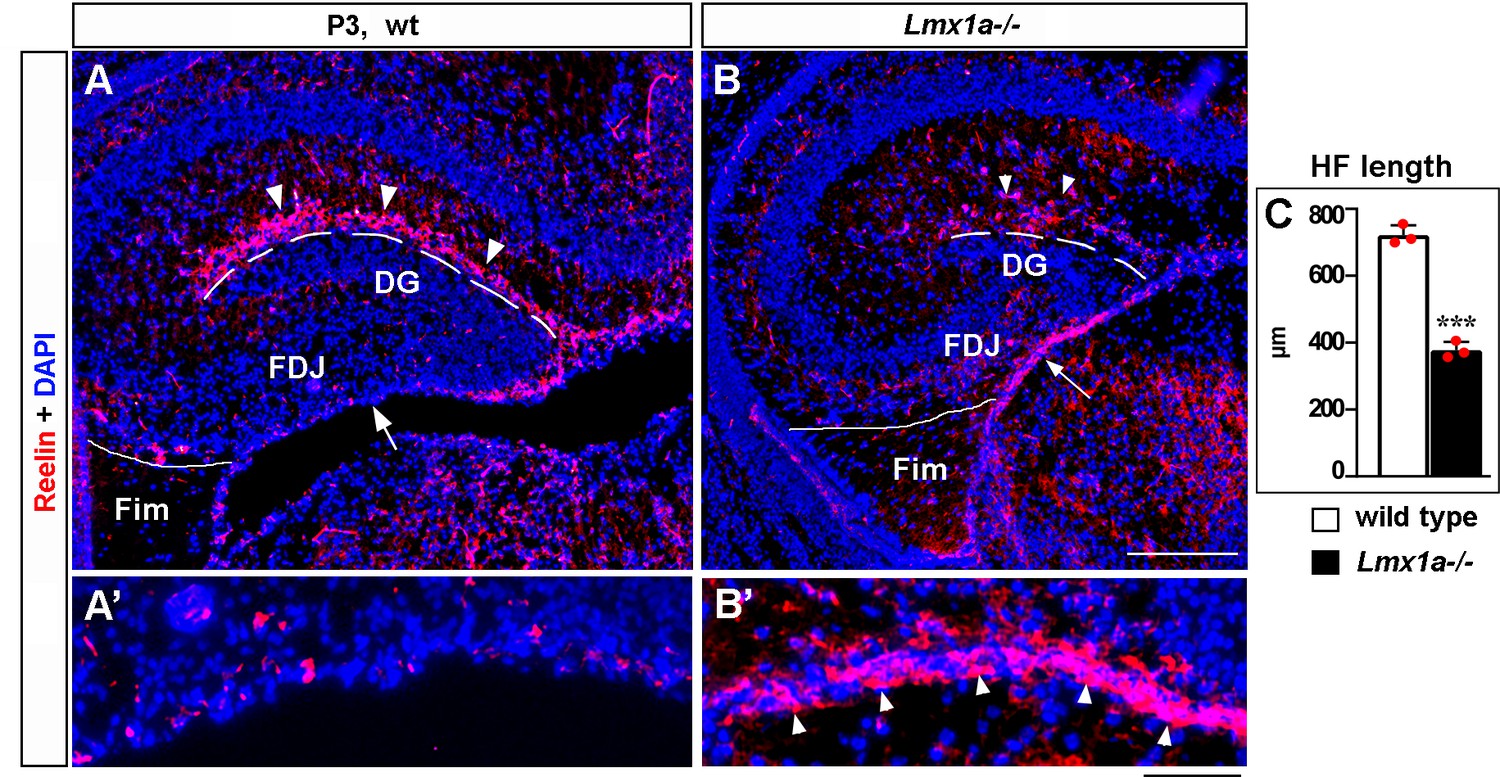
Abnormal distribution of Cajal–Retzius (CR) cells in P3 Lmx1a-/- mice.
(A–B’) In P3 wild-type mice, many CR cells populate the hippocampal fissure (HF) and virtually none of them remain at the fimbria-dentate junction (FDJ) surface (A, A’). In contrast, many CR cells were still located at the FDJ surface in Lmx1a-/- littermates (B, B’), which was associated with a reduced HF length (dashed line in A–C). ***p<0.001, two-tailed t-test, n = 3 mice per genotype. Fim, fimbria. The FDJ surface is indicated by an arrow in (A, B) and is shown at higher magnification in (A’, B’). Arrowheads indicate (Reelin+) CR cells. Scale bars: 200 μm (A, B); 50 μm (A’, B’).
-
Figure 2—figure supplement 2—source data 1
Data points for Figure 2—figure supplement 2C.
- https://cdn.elifesciences.org/articles/84095/elife-84095-fig2-figsupp2-data1-v1.xlsx
Figure 2—figure supplement 3
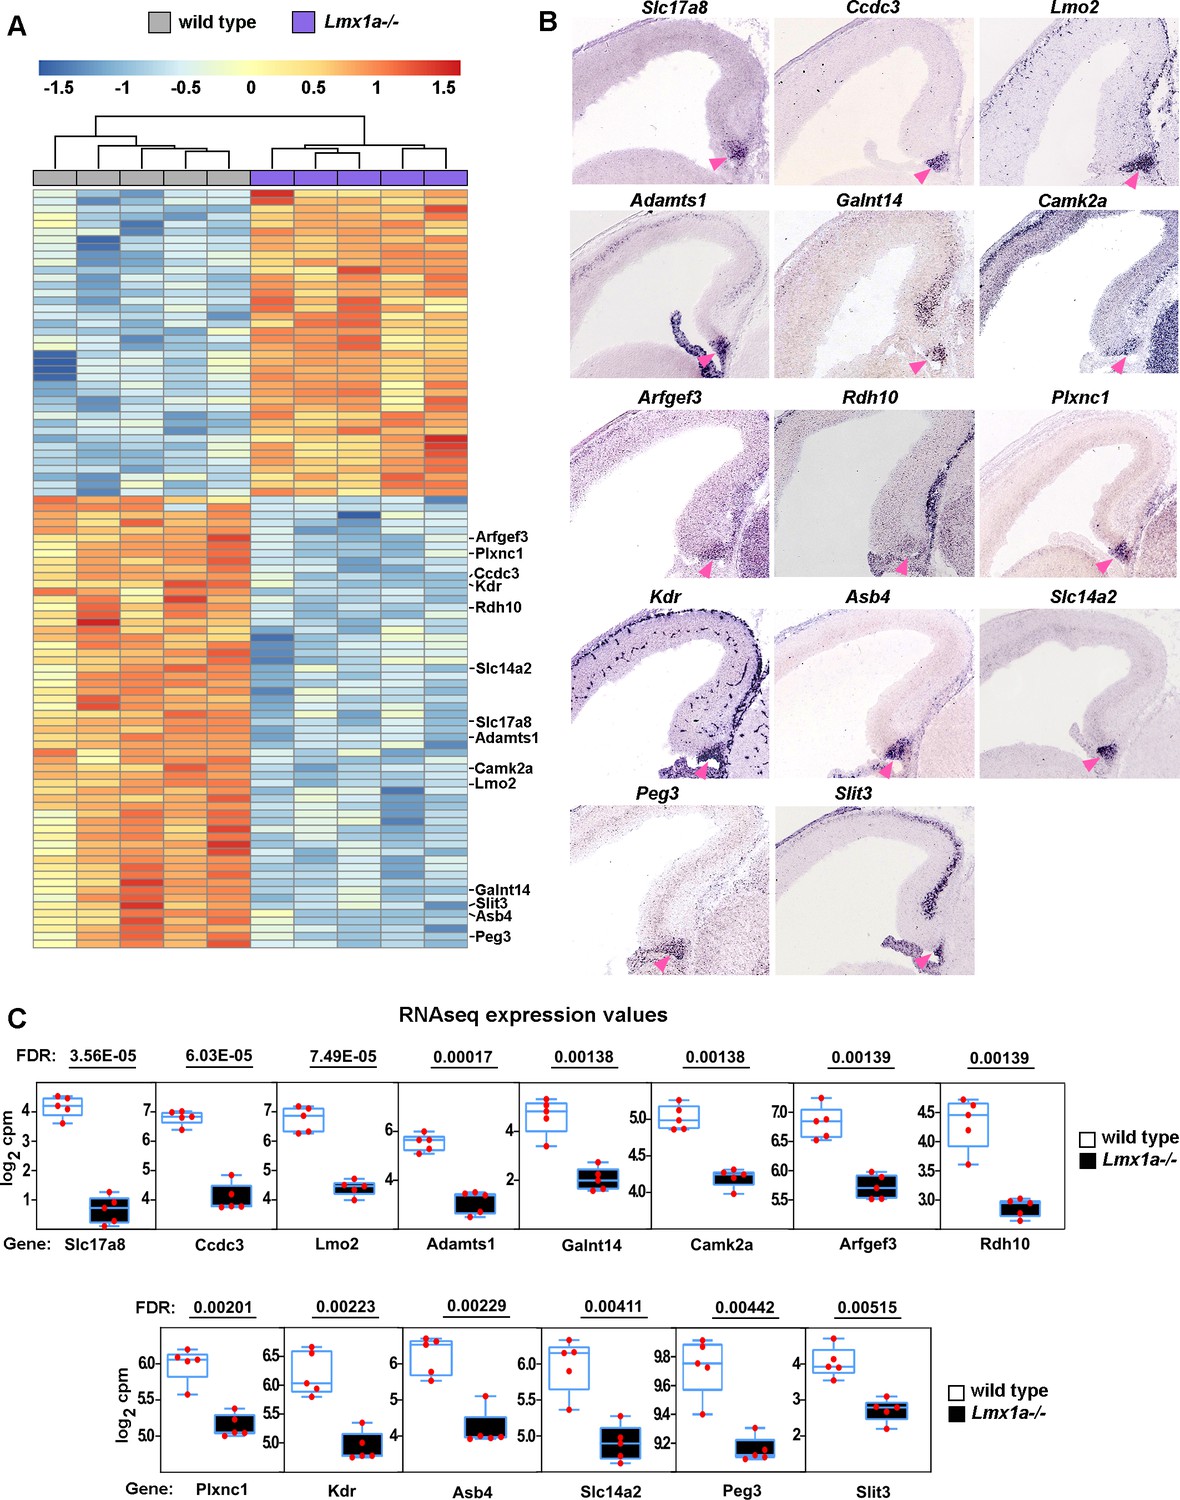
Reduced expression of cortical hem (CH) markers in Lmx1a-/- embryos.
(A) Hierarchical clustering heatmap of 100 transcripts whose expression is most significantly misregulated in the CH of e13.5 Lmx1a-/- embryos relative to wild-type littermates. A search of publicly accessible in situ hybridization databases identified 14 of these transcripts as specifically or predominantly expressed in the CH (listed on the right). (B) In situ hybridization images showing predominant CH expression of these 14 genes in e14.5 wild-type embryos. The CH is indicated by the pink arrowhead. All the images are from the Gene Paint database (Visel et al., 2004; https://gp3.mpg.de/). (C) Normalized read counts from the RNAseq experiment (Figure 2G and H) for the above genes. Genes are listed from most to least significantly misregulated in the CH of Lmx1a-/- embryos. False discovery rate (FDR) values are shown above the genes.
Figure 2—figure supplement 4
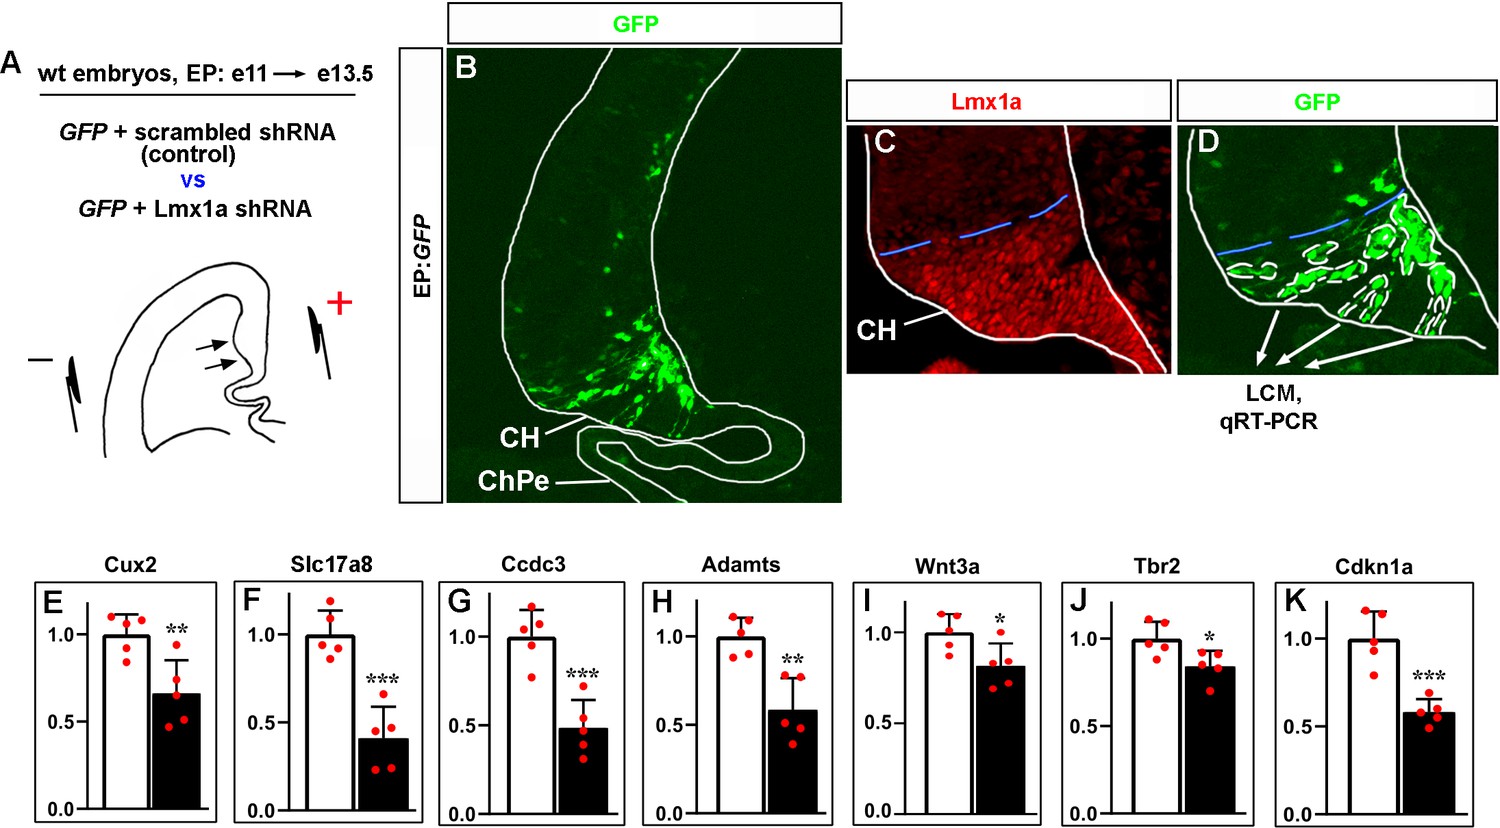
Lmx1a downregulation specifically in the cortical hem (CH) reduces the expression of CH markers and key CH developmental genes.
(A–D) Experimental design. The CH area of wild-type e11 embryos was in utero electroporated with plasmids encoding GFP+ scrambled shRNA (controls) or GFP+ previously validated Lmx1a shRNA (Fregoso et al., 2019) (experimental embryos), by placing electrodes as shown in the schematic (A). Negatively charged DNA moves toward the positive electrode (arrows) entering the CH. Embryos were collected at e13.5, serially coronally sectioned, and those demonstrating GFP expression in the CH but not in the choroid plexus epithelium (ChPe) (the only telencephalic structure beyond the CH that expresses Lmx1a) were used for analysis (see an example in panel B). All GFP+ cells in the CH (outlined by white dashed lines in panel D) from five sections per embryo were isolated by laser capture microdissection (LCM) and used for qRT-PCR analysis. The blue dashed line shows the dorsal boundary of the CH, which was determined using adjacent Lmx1a-immunostained sections (C). Panel (D) shows a higher magnification of the CH area of the section shown in panel (B). (E–K) qRT-PCR analysis revealed that targeting of Lmx1a in the CH reduces expression of key CH markers and CH developmental genes. p-Values are shown above each gene, ***p<0.001, **p<0.01, *p<0.05, two-tailed t-test, n = 5 embryos per condition. A direct Lmx1a downstream target Cux2 (Fregoso et al., 2019) was used as a positive control to confirm the disruption of Lmx1a function in these experiments (E).
-
Figure 2—figure supplement 4—source data 1
Data points for Figure 2—figure supplement 4E–K.
- https://cdn.elifesciences.org/articles/84095/elife-84095-fig2-figsupp4-data1-v1.xlsx
Figure 3 with 1 supplement

Lmx1a regulates dentate gyrus (DG) development by modulating expression of Wnt3a.
(A–C) The intensity of Wnt3a in situ hybridization signal (white) in the cortical hem (CH) was reduced in e14 Lmx1a-/- embryos. **p<0.01, two-tailed t-test, n = 3 embryos per genotype. (D, E) Analysis of Wnt3a expression in the CH by qRT-PCR. Experimental design (D): CH of e14 embryos of different genotypes was isolated by laser capture microdissection (LCM) and analyzed by qRT-PCR (E). Wnt3a expression was significantly reduced in the CH of Lmx1a-/- and Lmx1a+/-;Wnt3a+/- double heterozygotes, but not Lmx1a+/- or Wnt3a-/- single heterozygote embryos compared to wild-type controls. ***p<0.001, **p<0.01, one-way ANOVA with Tukey’s post hoc test, n = 4 embryos per genotype. (F–J) The number of Prox1+ DG neurons (arrowhead) was reduced in Lmx1a+/-;Wnt3a+/- double heterozygotes, but not single-gene heterozygotes, compared to wild-type controls at P3. ***p<0.001, one-way ANOVA with Tukey’s post hoc test, n = 3 mice per genotype. (K, L) Current–voltage curves (K) and a bar graph (L) showing a reduced input resistance of DG granule neurons in Lmx1a+/-;Wnt3a+/- double heterozygotes, but not single-gene heterozygotes, compared to wild-type controls at P21. ***p<0.001, one-way ANOVA with Tukey’s post hoc test, N = 9–10 DG neurons from n = 4–5 mice per genotype. (M–O) The number of GFAP+ transhilar glial fibers was reduced in Lmx1a+/-;Wnt3a+/- double heterozygotes, but not single-gene heterozygotes, compared to wild-type controls. ***p<0.001, one-way ANOVA with Tukey’s post hoc test, n = 3–4 mice per genotype. Arrowheads and arrows indicate fibers that cross the hilus and enrich at the hippocampal fissure (HF), respectively. (P–R) Proliferation (% of BrdU+ cells after a 90 min BrdU pulse) in dentate neuroepithelium (DNe) was reduced in Lmx1a+/-;Wnt3a+/- double heterozygotes, but not single-gene heterozygotes, compared to wild-type controls. ***p<0.001, one-way ANOVA with Tukey’s post hoc test, n = 3–4 mice per genotype. Scale bars: 100 μm (A, B, M, N); 200 μm (F–I); 50 μm (P, Q).
-
Figure 3—source data 1
Data points for Figure 3C, E, J, L, O and R.
- https://cdn.elifesciences.org/articles/84095/elife-84095-fig3-data1-v1.xlsx
Figure 3—figure supplement 1

Canonical Wnts misregulated in the cortical hem (CH) of Lmx1a-/- embryos based on RNAseq analysis.
(A) In situ hybridization images showing that in the telencephalon, Wnt2b, Wnt9a, and Wnt3a are specifically expressed in the CH (pink arrowhead). All images show wild-type e14.5 embryos from the Gene Paint database (Visel et al., 2004; https://gp3.mpg.de/). (B) Normalized read counts from the RNAseq experiment (Figure 2G and H) for the above Wnts. FDR values are shown above the genes.
Figure 4 with 3 supplements
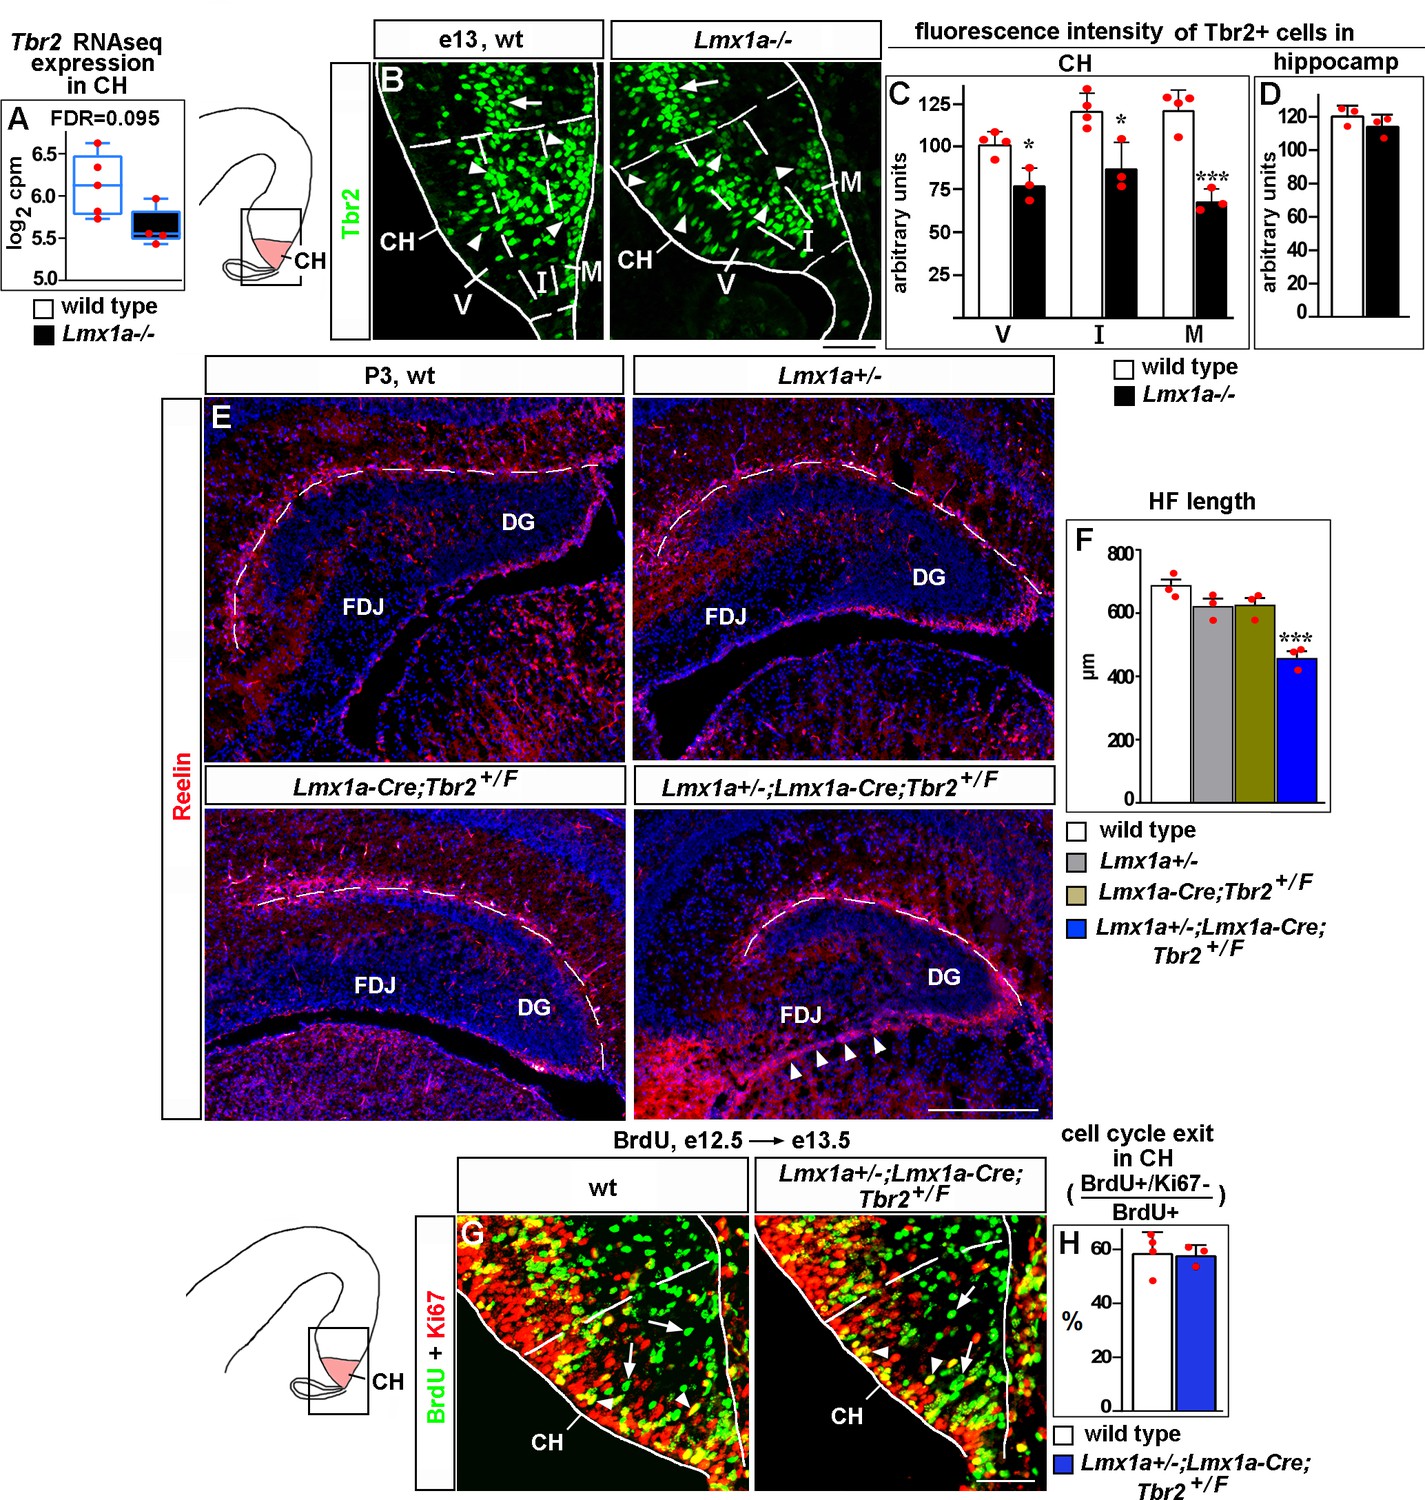
Lmx1a regulates Cajal–Retzius (CR) cell migration and hippocampal fissure (HF) formation by modulating expression of Tbr2.
(A) Normalized read counts for Tbr2 from the RNAseq experiment (Figure 2G and H). (B–D) Arrowheads indicate Tbr2+ cells in the CH (B). For quantification of intensity of Tbr2 immunostaining, the CH was divided into three equally sized bins along the radial axis: ventricular zone (V), intermediate zone (I), and marginal zone (M). In Lmx1a-/- mutants, Tbr2 staining intensity was reduced in all three zones of the CH, but most significantly in the marginal zone (B, C). In contrast, Tbr2+ cells in the hippocampal primordium (hippocampal intermediate progenitors, Hodge et al., 2013) (arrow in B) had similar Tbr2 immunofluorescence intensity in control and Lmx1a-/- embryos (B, D), suggesting that Lmx1a loss reduces Tbr2 expression specifically in cells arising in the CH. (Dashed lines demarcate the CH boundaries, identified by Lmx1a immunostaining of adjacent sections, as described in the ‘Materials and methods.’) ***p<0.001, *p<0.05, two-tailed t-test, n = 3–4 embryos per genotype. (E, F) Reduced HF length (dashed line) and aberrant accumulation of CR cells at the fimbria-dentate junction (FDJ) surface (arrowheads) in Lmx1a/Tbr2 double heterozygotes (Lmx1a+/-;Lmx1a-Cre;Tbr2+/F mice – Lmx1a+/- mice in which one copy of Tbr2 was deleted specifically in the CH), but not single-gene heterozygotes, compared to wild-type controls at P3. ***p<0.001, one-way ANOVA with Tukey’s post hoc test, n = 3 mice per genotype. (G, H) Normal cell cycle exit of progenitors in the CH of Lmx1a/Tbr2 double heterozygous embryos. 24 hr after BrdU injection, progenitors that exited the cell cycle were BrdU+/Ki67- (green, arrows); progenitors that re-entered the cell cycle were BrdU+/Ki67+ (yellow, arrowheads). p>0.05, two-tailed t-test, n = 3–4 mice per genotype. Scale bars: 50 μm (B, G); 200 μm (E).
-
Figure 4—source data 1
Data points for Figure 4C, D, F and H.
- https://cdn.elifesciences.org/articles/84095/elife-84095-fig4-data1-v1.xlsx
Figure 4—figure supplement 1
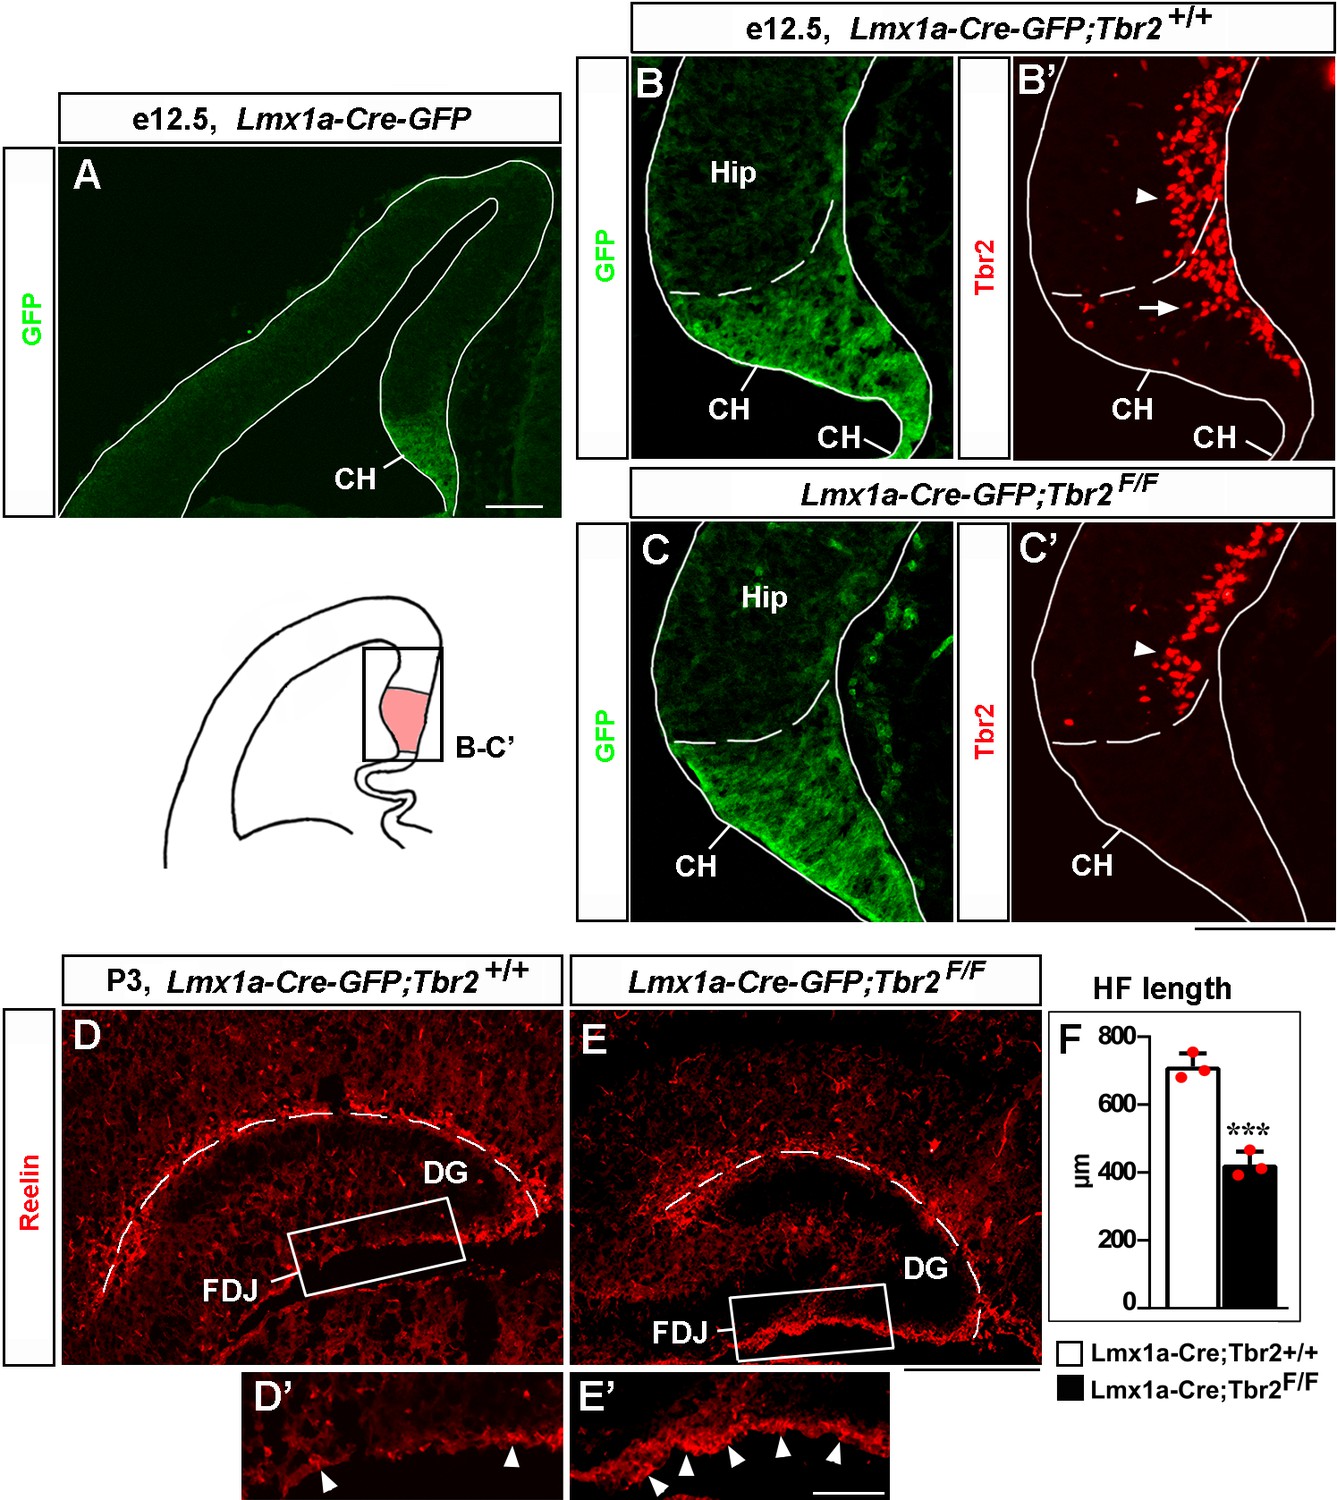
Loss of Tbr2 in the cortical hem (CH) compromises migration of Cajal–Retzius (CR) cells and hippocampal fissure (HF) formation.
(A) In the telencephalic neuroepithelium of Lmx1a-Cre-GFP mice, Cre-GFP expression is limited to the CH (Chizhikov et al., 2010). (B–C’) Specific deletion of Tbr2 in the CH. Panels (B) and (B’) and panels (C) and (C’) show the same sections imaged for different antibodies. Dashed line demarcates the CH from the hippocampal primordium (Hip). Arrow points to Tbr2-expressing cells in the CH of control (Lmx1a-Cre-GFP;Tbr2+/+) embryos (B’). Tbr2 expression is lost in the CH of Lmx1a-Cre-GFP;Tbr2F/F embryos (C’). Tbr2 expression is still present in hippocampal intermediate progenitors (Hodge et al., 2013) in both control and Lmx1a-Cre-GFP;Tbr2F/F embryos (arrowhead in B’, C’). (D–F) In P3 Lmx1a-Cre-GFP;Tbr2F/F mice, excessive Reelin+ CR cells accumulate at the fimbria-dentate junction (FDJ) surface (D’, E’, arrowheads), which was associated with a reduced HF length (dashed line in D–F). ***p<0.001, two-tailed t-test, n = 3 mice per genotype. Scale bars: 100 μm (A–C’); 200 μm (D, E); 50 μm (D’, E’).
-
Figure 4—figure supplement 1—source data 1
Data points for Figure 4—figure supplement 1F.
- https://cdn.elifesciences.org/articles/84095/elife-84095-fig4-figsupp1-data1-v1.xlsx
Figure 4—figure supplement 2
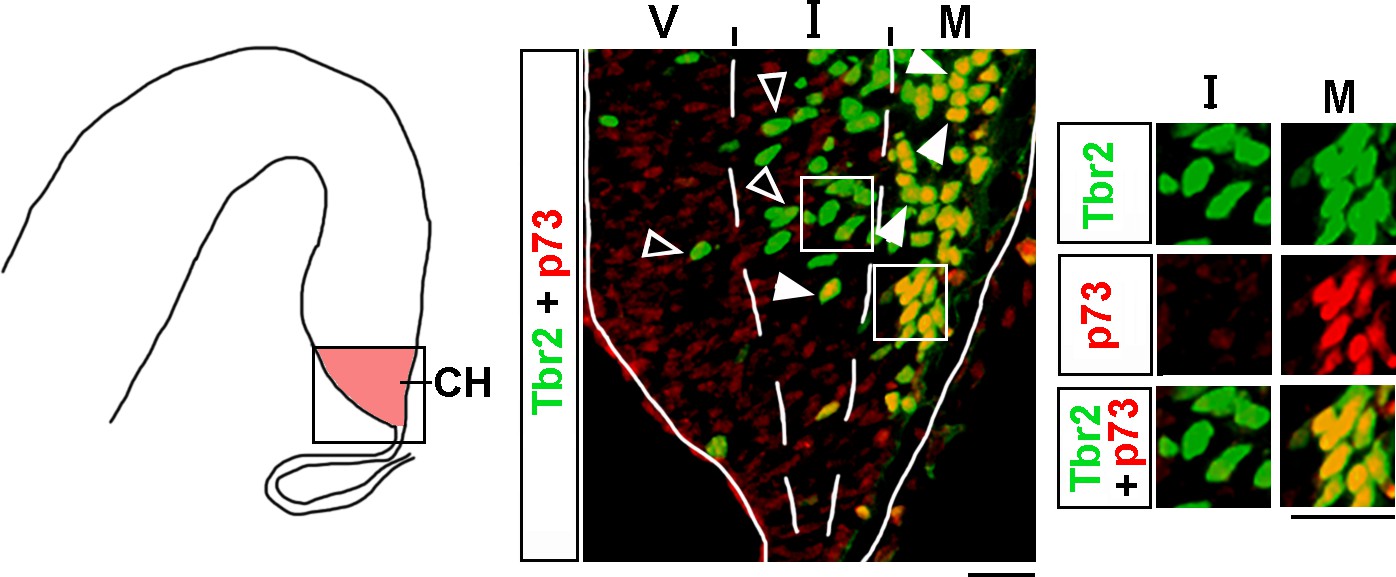
Analysis of Tbr2 and p73 co-expression in the cortical hem (CH).
The CH of e13 wild-type embryos was co-immunostained with antibodies specific for Tbr2 and p73 (a marker of Cajal–Retzius [CR] cells). The CH (identified based on Lmx1a immunostaining in adjacent sections as described in ‘Materials and methods’) was divided into three equally sized bins along the radial axis, namely the ventricular (V), intermediate (I), and marginal (M) zones. Arrowheads indicate Tbr2+/p73+ cells, while open arrowheads indicate Tbr2+/p73- cells. Insets show higher magnification of single channel images of the boxed regions. In the M zone, virtually all Tbr2+ cells co-expressed p73, indicating that they are already specified CR cells. In contrast, in the V and I zones, the majority of Tbr2+ cells were p73-negative. Scale bars: 25 μm.
Figure 4—figure supplement 3
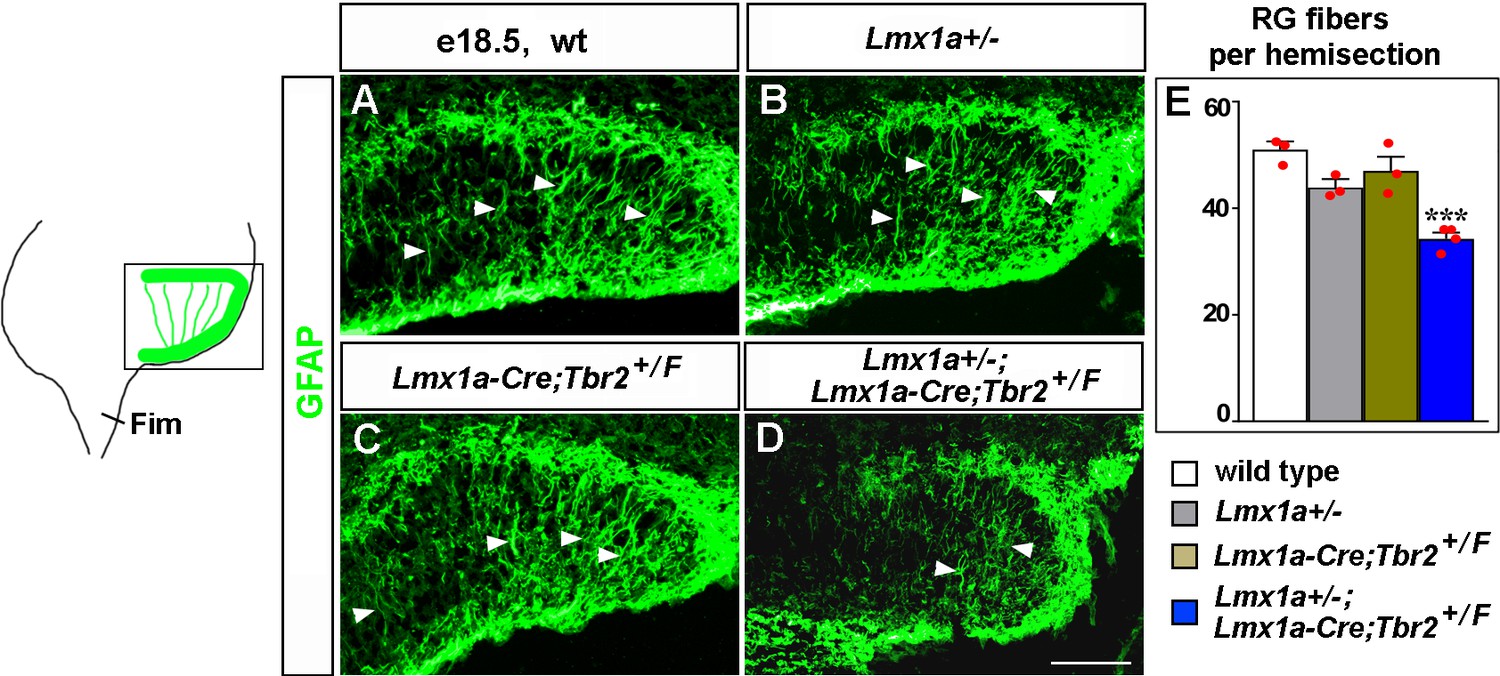
Transhilar glial scaffold abnormalities in Lmx1a/Tbr2 double heterozygous mice.
(A–E) The number of GFAP+ transhilar glial fibers at e18.5 was reduced in Lmx1a/Tbr2 double heterozygotes (Lmx1a+/-;Lmx1a-Cre;Tbr2+/F mice, which are Lmx1a+/- mice in which one copy of Tbr2 was deleted specifically in cortical hem [CH]), but not single-gene heterozygotes, relative to wild-type controls. ***p<0.001, one-way ANOVA with Tukey’s post hoc test, n = 3–4 mice per genotype. Arrowheads indicate GFAP+ glial fibers that cross the hilus. Fim, fimbria. Scale bars: 100 μm.
-
Figure 4—figure supplement 3—source data 1
Data points for Figure 4—figure supplement 3E.
- https://cdn.elifesciences.org/articles/84095/elife-84095-fig4-figsupp3-data1-v1.xlsx
Figure 5 with 1 supplement
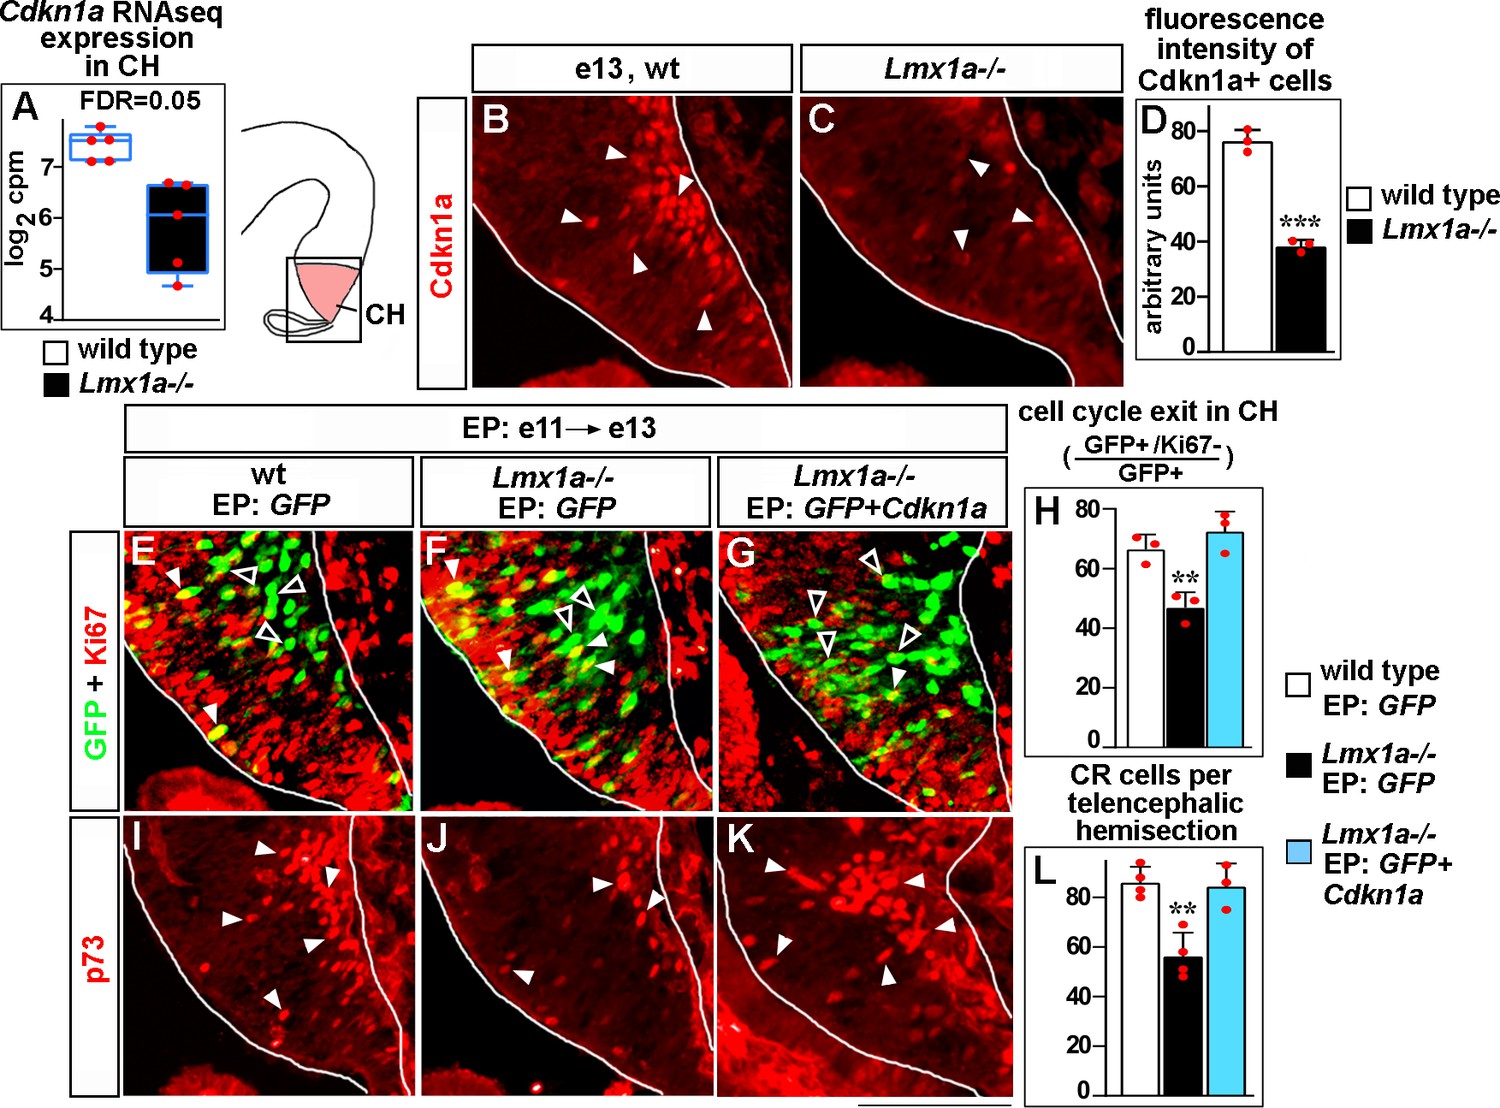
Lmx1a regulates exit of progenitors from the cell cycle and Cajal–Retzius (CR) cell differentiation in the cortical hem (CH) via Cdkn1a.
(A) Normalized read counts for Cdkn1a from the RNAseq experiment (Figure 2G and H). (B–D) Arrowheads indicate Cdkn1a+ cells in the CH (B, C), which exhibited lower immunofluorescence intensity in e13 Lmx1a-/- embryos (B–D). ***p<0.001, two-tailed t-test, n = 3 embryos per genotype. (E–L) Embryos were in utero electroporated (EP) with indicated genes at e11 and analyzed at e13. Sections in panels (E), (F), and (G) are adjacent to those in panels (I), (J), and (K), respectively. (E–G) Arrowheads indicate electroporated cells that re-entered the cell cycle (GFP+/Ki67+ cells, yellow); open arrowheads indicate electroporated cells that exited the cell cycle (GFP+/Ki67- cells, green). The reduced exit of progenitors from the cell cycle in Lmx1a-/- CH was rescued by electroporation of Cdkn1a (H). **p<0.01 versus GFP electroporated wild-type and Cdkn1a+GFP electroporated Lmx1a-/- embryos, one-way ANOVA with Tukey’s post hoc test, n = 3 embryos per condition. (I–L) Arrowheads indicate p73+ CR cells. The reduced number of CR cells in Lmx1a-/- mutants was rescued by electroporation of Cdkn1a (L). **p<0.01 versus GFP electroporated wild-type and Cdkn1a+GFP electroporated Lmx1a-/- embryos, one-way ANOVA with Tukey’s post hoc test, n = 3–4 embryos per condition. Scale bar: 100 μm.
-
Figure 5—source data 1
Data points for Figure 5D, H and L.
- https://cdn.elifesciences.org/articles/84095/elife-84095-fig5-data1-v1.xlsx
Figure 5—figure supplement 1
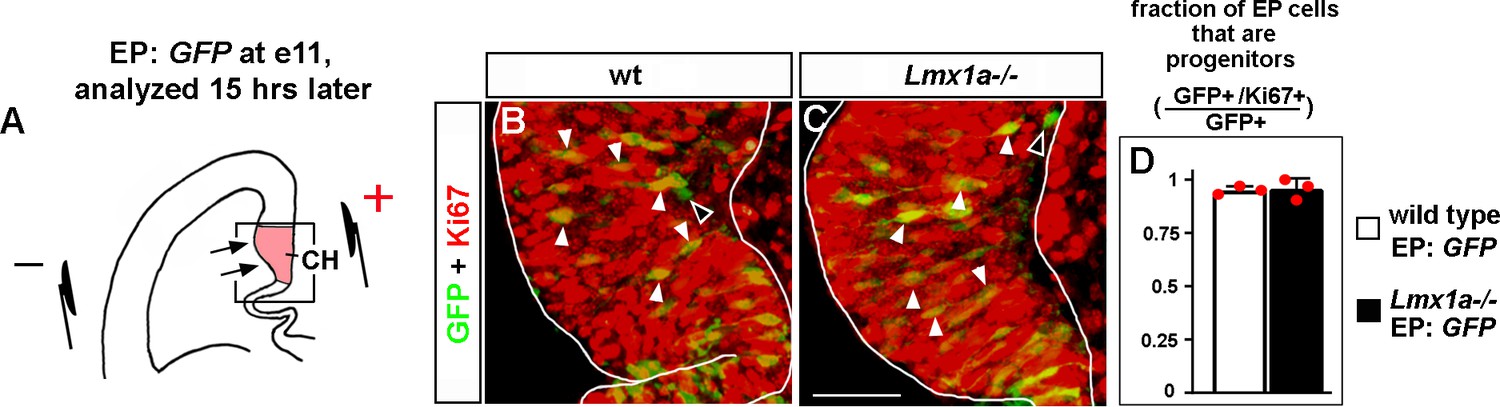
In utero electroporation targets progenitors in the cortical hem (CH) in e11 embryos.
(A) Experimental design: a GFP-encoding plasmid was in utero electroporated into the medial telencephalon of e11 embryos, by placing electrodes as shown in the diagram. Negatively charged DNA moves toward the positive electrode (arrows) entering the CH. To determine the identity of electroporated cells (progenitors vs. differentiated cells), embryos were allowed to develop for 15 hr after electroporation, a period that we consider to be sufficient for GFP production but short enough to avoid differentiation of progenitors that received the plasmid. (B–D) GFP/Ki67 co-labeling in the CH. (The CH was identified based on Lmx1a immunostaining in adjacent sections as described in ‘Materials and methods.’) Arrowheads indicate numerous GFP+/Ki67+ progenitors, while open arrowheads indicate very rare GFP+/Ki67- differentiated cells (B, C). (D) Quantification revealed that in both wild-type controls and Lmx1a-/- mutants, virtually all (~95%) GFP+ cells in the CH were Ki67+ (progenitors). We detected no difference in the fraction of GFP+/Ki67+ cells among GFP+ cells between wild-type and Lmx1a-/- embryos; p>0.05, two-tailed t-test, n = 3 embryos per genotype. Scale bar: 50 μm.
-
Figure 5—figure supplement 1—source data 1
Data points for Figure 5—figure supplement 1D.
- https://cdn.elifesciences.org/articles/84095/elife-84095-fig5-figsupp1-data1-v1.xlsx
Figure 6 with 2 supplements
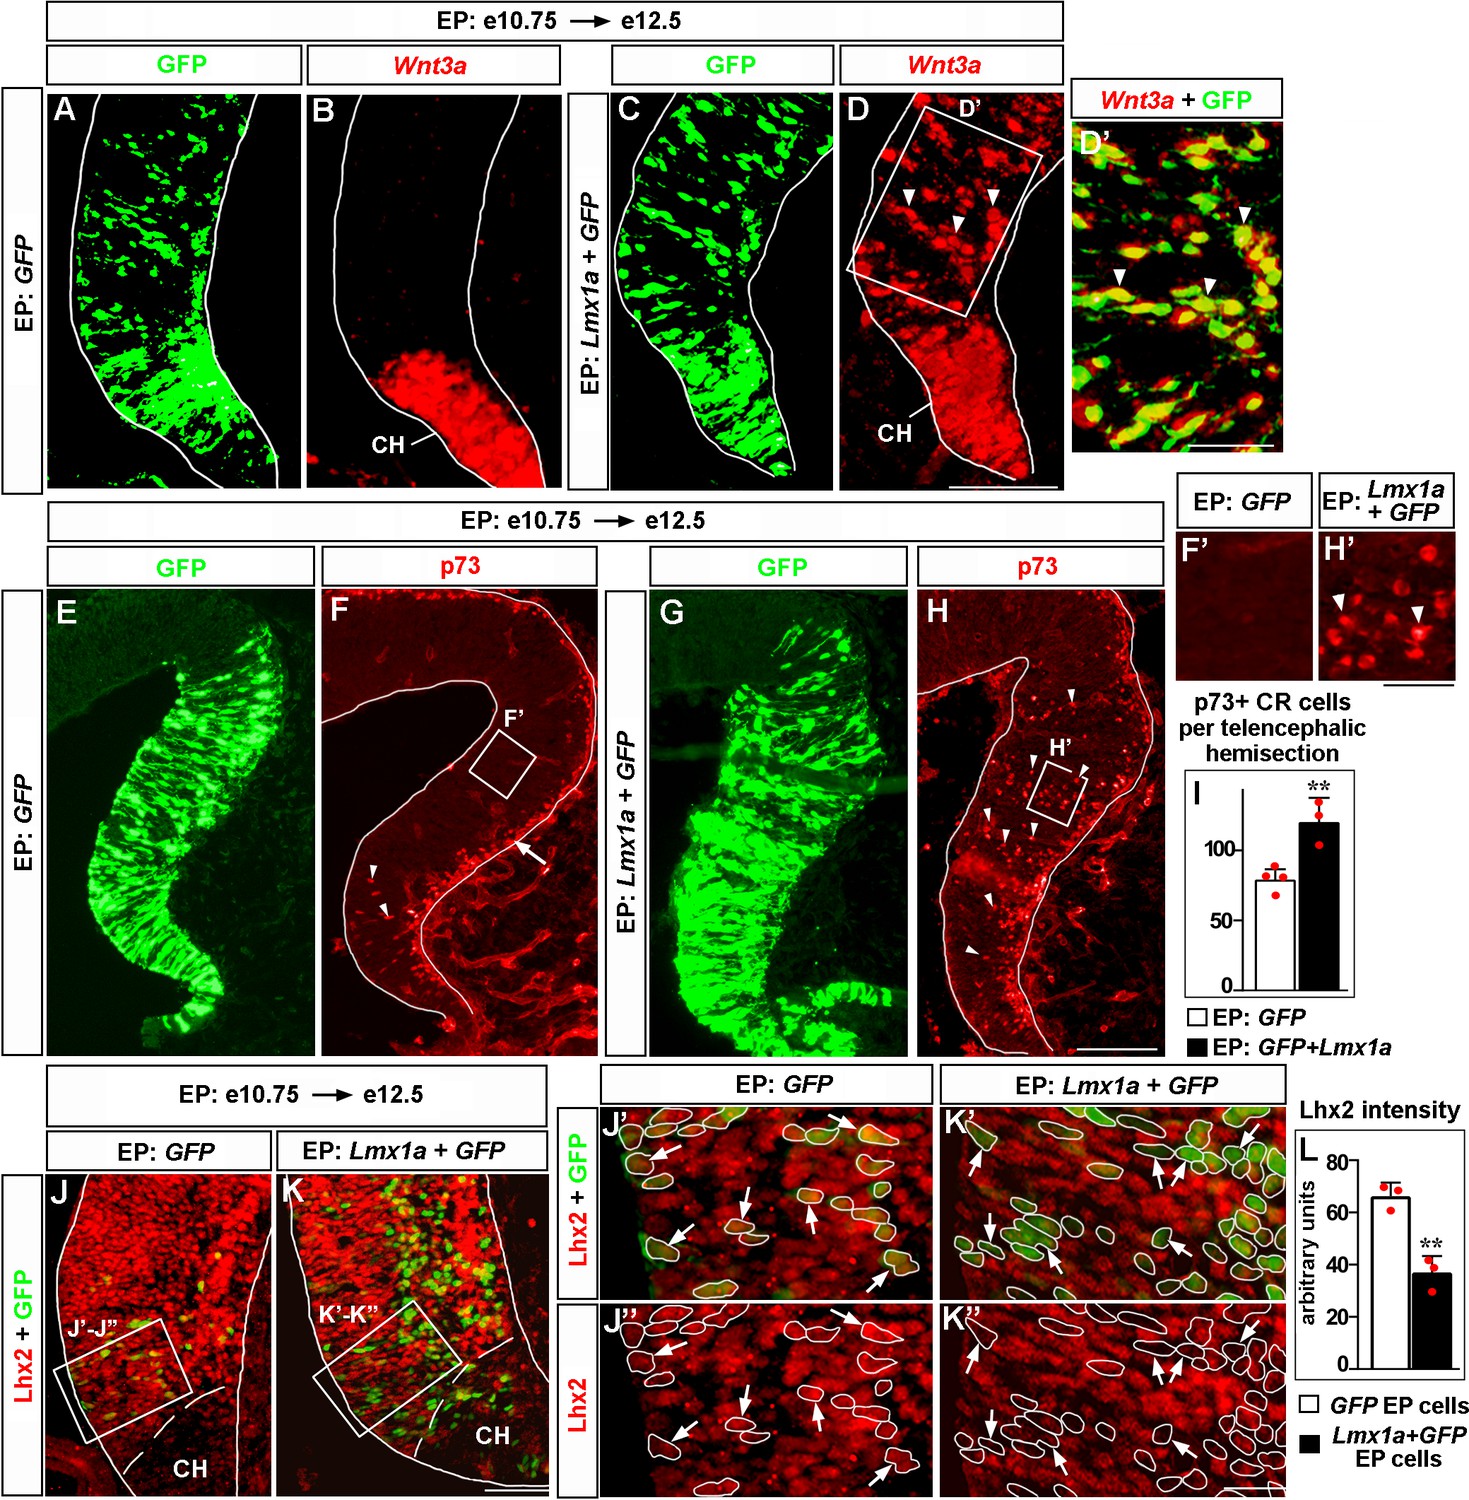
Lmx1a is sufficient to induce key features of the cortical hem (CH).
Panels (A) and (B), (C) and (D), (J’) and (J’’), (K’) and (K’’) show the same sections imaged for different markers. Panels (E–H) show adjacent sections. wild-type embryos were in utero electroporated (EP) into the medial telencephalon (by placing electrodes as shown in Figure 6—figure supplement 1, top diagram) at e10.75 and analyzed at e12.5. (A–D’) In contrast to control (GFP-electroporated) embryos, in which Wnt3a expression was limited to the CH (A, B), in Lmx1a-electroporated embryos, ectopic Wnt3a expression was detected in the hippocampal field (arrowheads), clearly beyond the CH (C, D). Extensive overlap between GFP fluorescence and Wnt3a in situ hybridization signal (D’, arrowheads) suggests cell-autonomous induction of Wnt3a by Lmx1a. (E–I) In GFP-electroporated controls (F, F’), p73+ Cajal–Retzius (CR) cells were deeply located (arrowheads) only in the CH (where p73+ CR cells arise, Siegenthaler and Miller, 2008), while migrating superficially located p73+ CR cells (arrow) were found also in the cortical neuroepithelium. In Lmx1a-electroporated embryos, p73+ cells were found deeply located (arrowheads) throughout the medial telencephalic neuroepithelium (H, H’). The total number of p73+ CR cells increased in Lmx1a-electroporated embryos (I), **p<0.01, two-tailed t-test, n = 3–4 embryos per condition, further supporting induction of CR cells by Lmx1a. (J–L) Lhx2 is expressed in the hippocampal primordium but not in the CH (J, K). Arrows indicate cells in the hippocampal primordium electroporated with GFP (controls) (J’, J’’) or Lmx1a+GFP (K’, K’’). The intensity of Lhx2 immunofluorescence was reduced in Lmx1a-electroporated cells (J’–L), indicating that Lmx1a is sufficient to repress Lhx2 expression. **p<0.01, two-tailed t-test, n = 3 embryos per condition. Scale bars: 100 μm (A–D, E–H); 50 μm (D’, J, K); 30 μm (F’, H’); 15 μm (J”–K’’).
-
Figure 6—source data 1
Data points for Figure 6I and L.
- https://cdn.elifesciences.org/articles/84095/elife-84095-fig6-data1-v1.xlsx
Figure 6—figure supplement 1
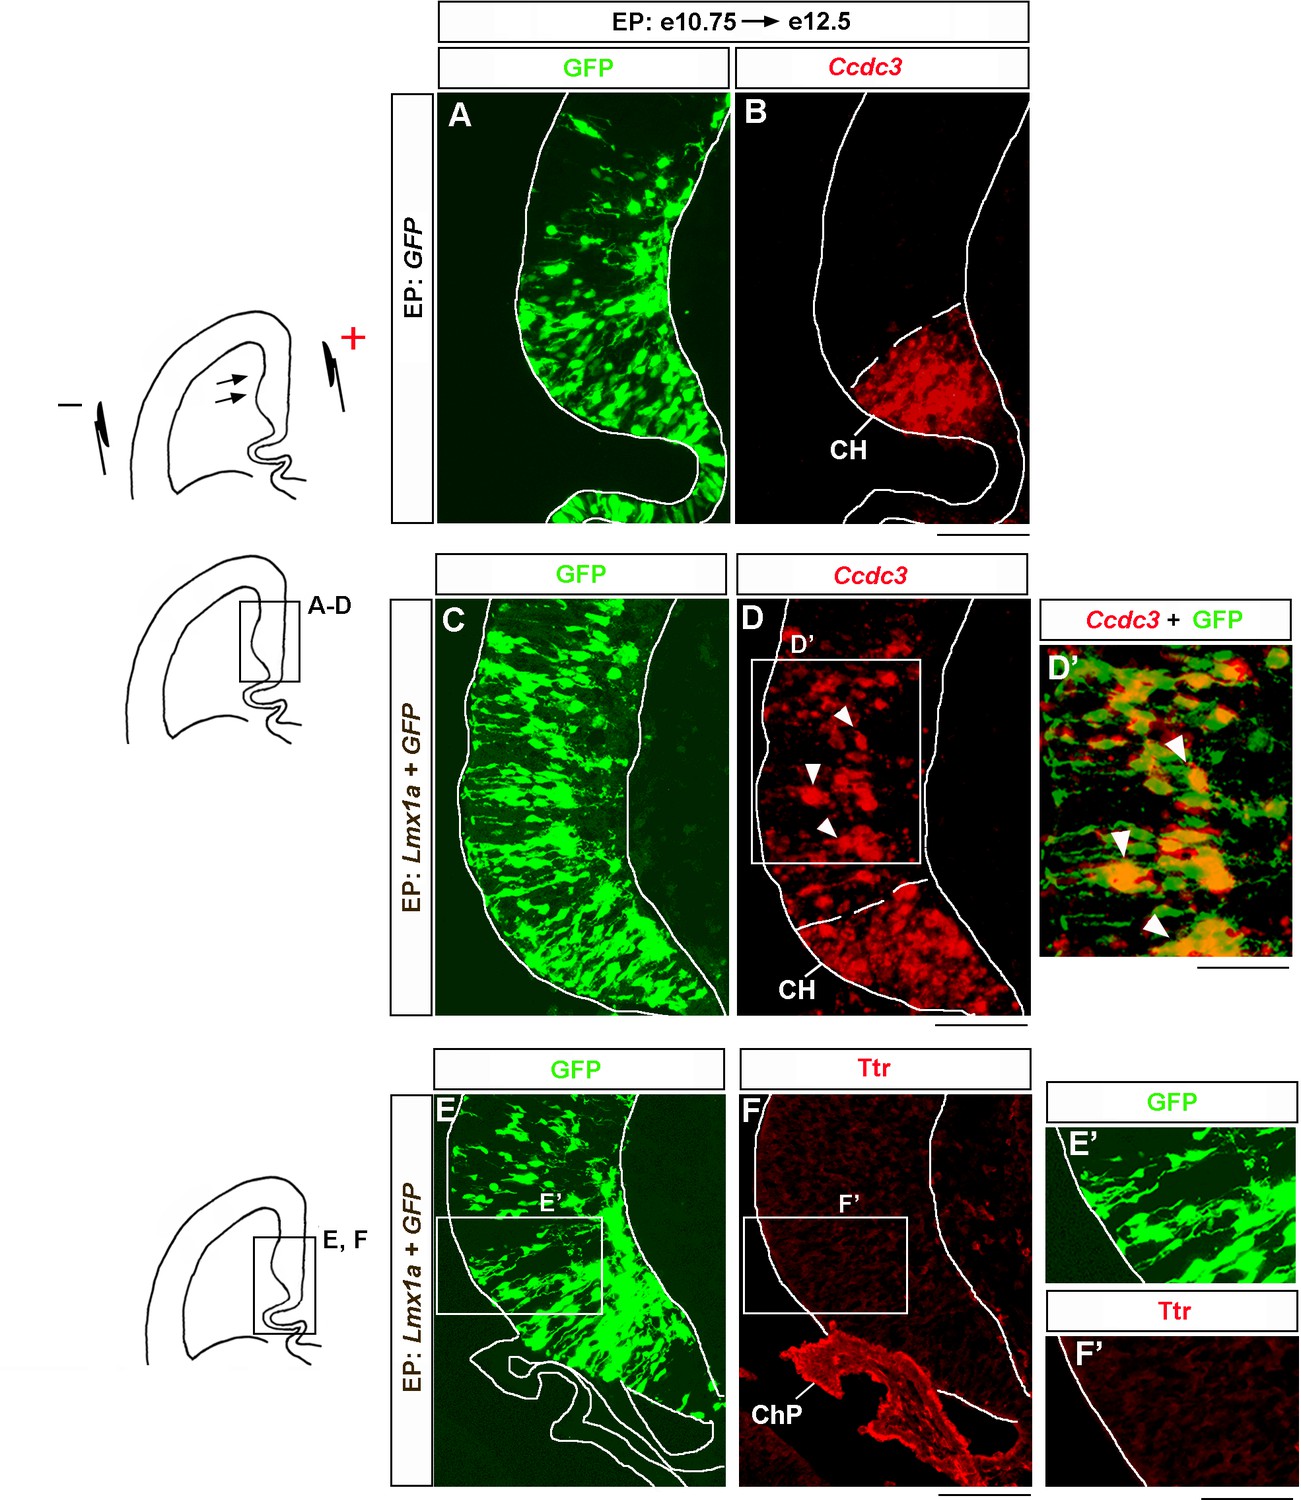
Lmx1a overexpression induces cortical hem (CH) marker Ccdc3 but not choroid plexus marker Ttr.
Wild-type embryos were in utero electroporated (EP) into the medial telencephalon (by placing electrodes as shown in the top diagram) at e10.75 and analyzed at e12.5. Negatively charged DNA moves toward the positive electrode (arrows) entering the medial telencephalon. Sections were imaged for GFP and then stained by in situ hybridization with a Ccdc3 probe (A–D) or immunostained with antibodies specific for Ttr and co-imaged for GFP and Ttr (E–F). (A–D’) In contrast to control (GFP-electroporated) embryos, in which Ccdc3 expression was limited to the CH (A, B), in Lmx1a-electroporated embryos, ectopic Ccdc3 expression was detected in the hippocampal field (arrowheads), clearly beyond the CH (C, D). An overlap between GFP fluorescence and Ccdc3 in situ hybridization signal (D’, arrowheads) suggests cell-autonomous induction of Ccdc3 by Lmx1a. (E–F’) Lmx1a electroporation does not induce a choroid plexus marker Ttr in the medial telencephalic neuroepithelium. ChP, choroid plexus. Scale bars: 100 μm (A–D, E, F); 60 μm (D’, E’, F’).
Figure 6—figure supplement 2
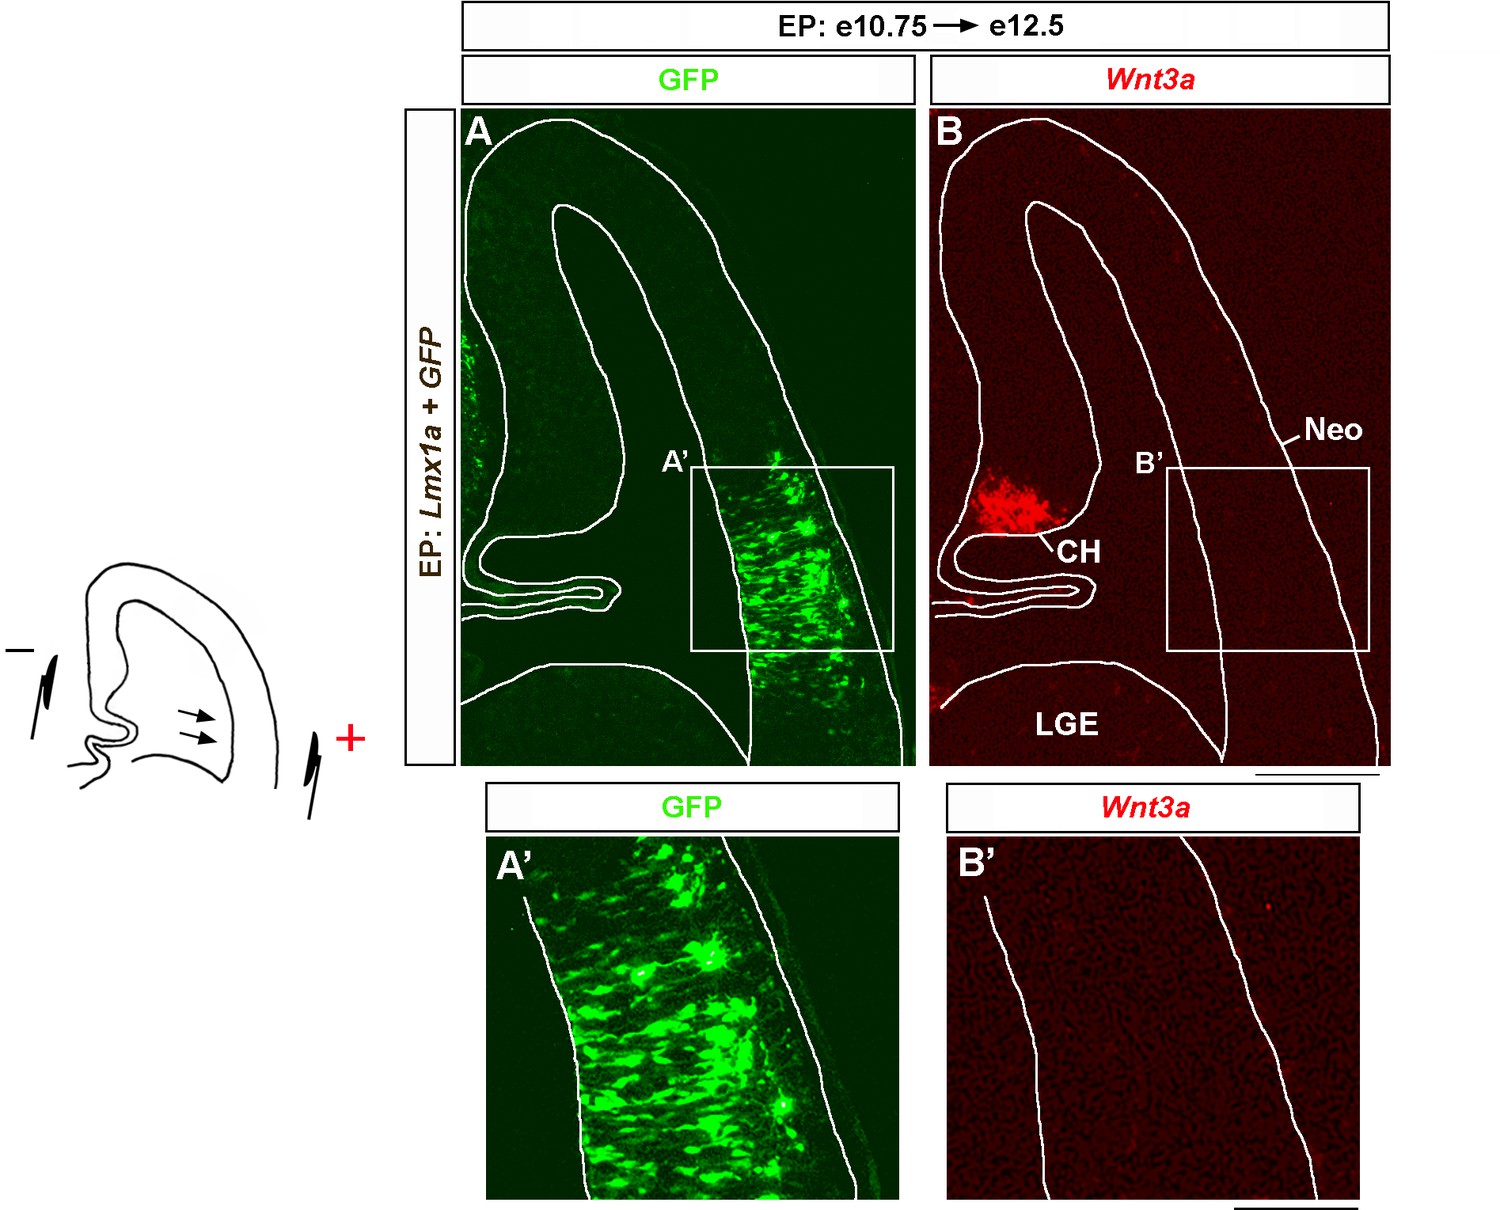
Lmx1a overexpression does not induce Wnt3a in lateral cortex.
Wild-type embryos were in utero electroporated (EP) into lateral telencephalon (by placing electrodes as shown in the diagram) at e10.75 and analyzed at e12.5. Negatively charged DNA moves toward the positive electrode (arrows), entering the lateral telencephalon. Sections were imaged for GFP and then stained by in situ hybridization with a Wnt3a probe (A, B). (A–B’) Lmx1a electroporation does not induce Wnt3a in the lateral cortex. Neo, neocortex; LGE, lateral ganglionic eminence. Scale bars: 100 μm (A, B); 100 μm (A’, B’).
Figure 7

Lmx1a-dependent developmental processes and downstream mediators of Lmx1a activity in the cortical hem (CH).
Lmx1a promotes expression (solid arrow) of secreted Wnt3a, which non-autonomously (dashed arrow) regulates the development of the hippocampal dentate gyrus (DG) (proliferation in the dentate neuroepithelium [DNe], the transhilar scaffold, and the number and input resistance of DG neurons). Lmx1a represses the expression of the cortical selector gene Lhx2 (solid bar), segregating the CH from the adjacent hippocampal field. Lmx1a positively regulates the expression of a wide range of CH markers. It also promotes the exit of CH progenitors from the cell cycle and their differentiation into Cajal–Retzius (CR) cells by activating the expression of Cdkn1a, and positively regulates expression of Tbr2 to promote migration of CR cells, which are necessary for the hippocampal fissure (HF) and transhilar scaffold formation.
Tables
Table 1
Sequences of primer used in qRT-PCR.
| Primers | Reference |
|---|---|
| Slc17a8 F: ggtgtggggaccctctctgg Slc17a8 R: cccagaagcgaagaccccgt | This study |
| Ccdc3 F: tatgccaaggtgctggcgct Ccdc3 R: taaggttgagccgggagccg | This study |
| Adamts1 F: ctggcacctccggtggctta Adamts1 R: gtccccatggtccccagctt | This study |
| Tbr2 F: ctacgggccatacgccggaa Tbr2 R: gtagtgggcggtggggttga | This study |
| Cux2 F: ccctgaggaagacccctcgg Cux2 R: ccttggcccatcaggaccca | This study |
| Cdkn1a F: ggtcccgtggacagtgagca Cdkn1a R: gggacccagggctcaggtag | This study |
| Wnt3a F: ctcctctcggatacctcttagtg Wnt3a R: gcatgatctccacgtagttcctg | Watanabe et al., 2016 |
| Gapdh F: cgacttcaacagcaactcccactcttcc Gapdh R: tgggtggtccagggtttcttactcctt | Liu et al., 2009 |
Additional files
Download links
A two-part list of links to download the article, or parts of the article, in various formats.
Downloads (link to download the article as PDF)
Open citations (links to open the citations from this article in various online reference manager services)
Cite this article (links to download the citations from this article in formats compatible with various reference manager tools)
Lmx1a is a master regulator of the cortical hem
eLife 12:e84095.
https://doi.org/10.7554/eLife.84095


