Growth cone advance requires EB1 as revealed by genomic replacement with a light-sensitive variant
- Department of Cell and Tissue Biology, University of California, San Francisco, United States
- Department of Cell Biology, Erasmus MC, Netherlands
Figures
Figure 1 with 5 supplements
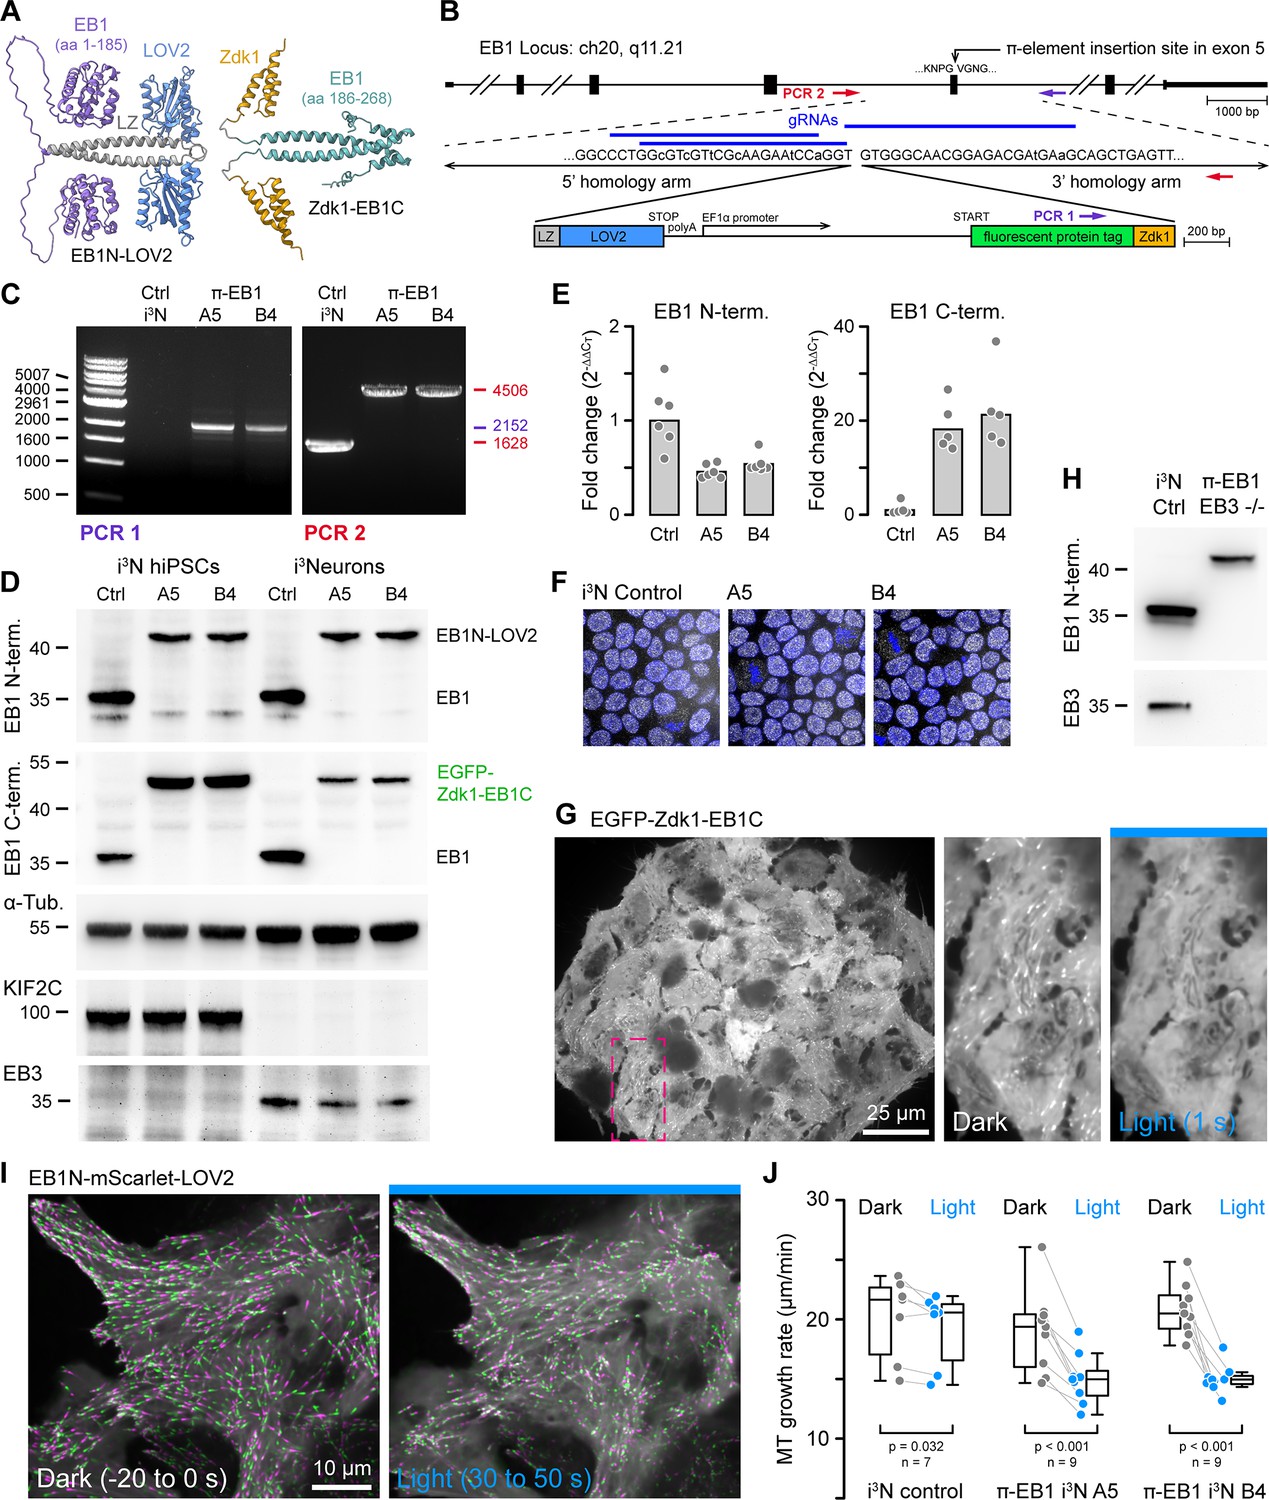
One-step genome editing to replace EB1 with a photo-sensitive variant.
(A) AlphaFold2 model of the π-EB1 tetramer (Mirdita et al., 2022). Note that AlphaFold2 does not correctly predict relative domain positions and did not capture the LOV2/Zdk1 interaction correctly although a structure of the LOV2/Zdk1 dimer has previously been determined (Wang et al., 2016). (B) Overview of the one-step CRISPR/Cas9-mediated insertion of a π-element construct containing the photosensitive LOV2/Zdk1 module, a fluorescent protein marker, and an internal EF1α promoter. Arrows indicate the location of PCR primers. Lowercase letters indicate mutations introduced to make the homology-directed repair (HDR) template resistant to Cas9 cleavage. (C) Genomic PCR to validate π-element integration into the endogenous EB1 locus with primers as indicated in (B). The two clones shown are homozygous as there is no short product in PCR2, which corresponds to the non-edited EB1 locus. (D) Immunoblots with antibodies as indicated of control and π-EB1 i3N clones before and after 2 days of neuron differentiation showed replacement of EB1 by the photosensitive π-EB1 variant and expected +TIP expression level changes associated with neuron differentiation. (E) RT-qPCR analysis of the expression levels of the π-element N- and C-terminal halves relative to EB1 expression in wild-type (Ctrl) i3N hiPSCs. Shown are the mean and data points from individual qPCR reactions. (F) Comparison of nuclear Oct4 staining (white) as a pluripotency marker in control and π-EB1 i3N hiPSC colonies. Nuclei are identified with DAPI (blue). (G) Image of a π-EB1 i3N hiPSCs colony with magnified images on the right showing dissociation of EGFP-Zdk1-EB1C from growing MT ends in blue light. (H) Immunoblot of control and π-EB1 and EB3-/- i3Neurons showing expression of π-EB1 and deletion of both EB1 and EB3. (I) π-EB1 i3N hiPSCs transiently expressing a mScarlet-tagged EB1N MT-binding domain before and during blue light exposure. Maximum intensity projections in alternating green and magenta over 20 s at 3 s intervals illustrate attenuation of MT growth during blue light exposure. (J) Quantification of the median MT growth rate per cell before and during blue light exposure in control and π-EB1 i3N hiPSCs. Gray lines connect data points from the same cell. Statistical analysis by paired t-test for each i3N hiPSC line.
-
Figure 1—source data 1
Original DNA gel and immunoblot images.
- https://cdn.elifesciences.org/articles/84143/elife-84143-fig1-data1-v2.zip
Figure 1—figure supplement 1
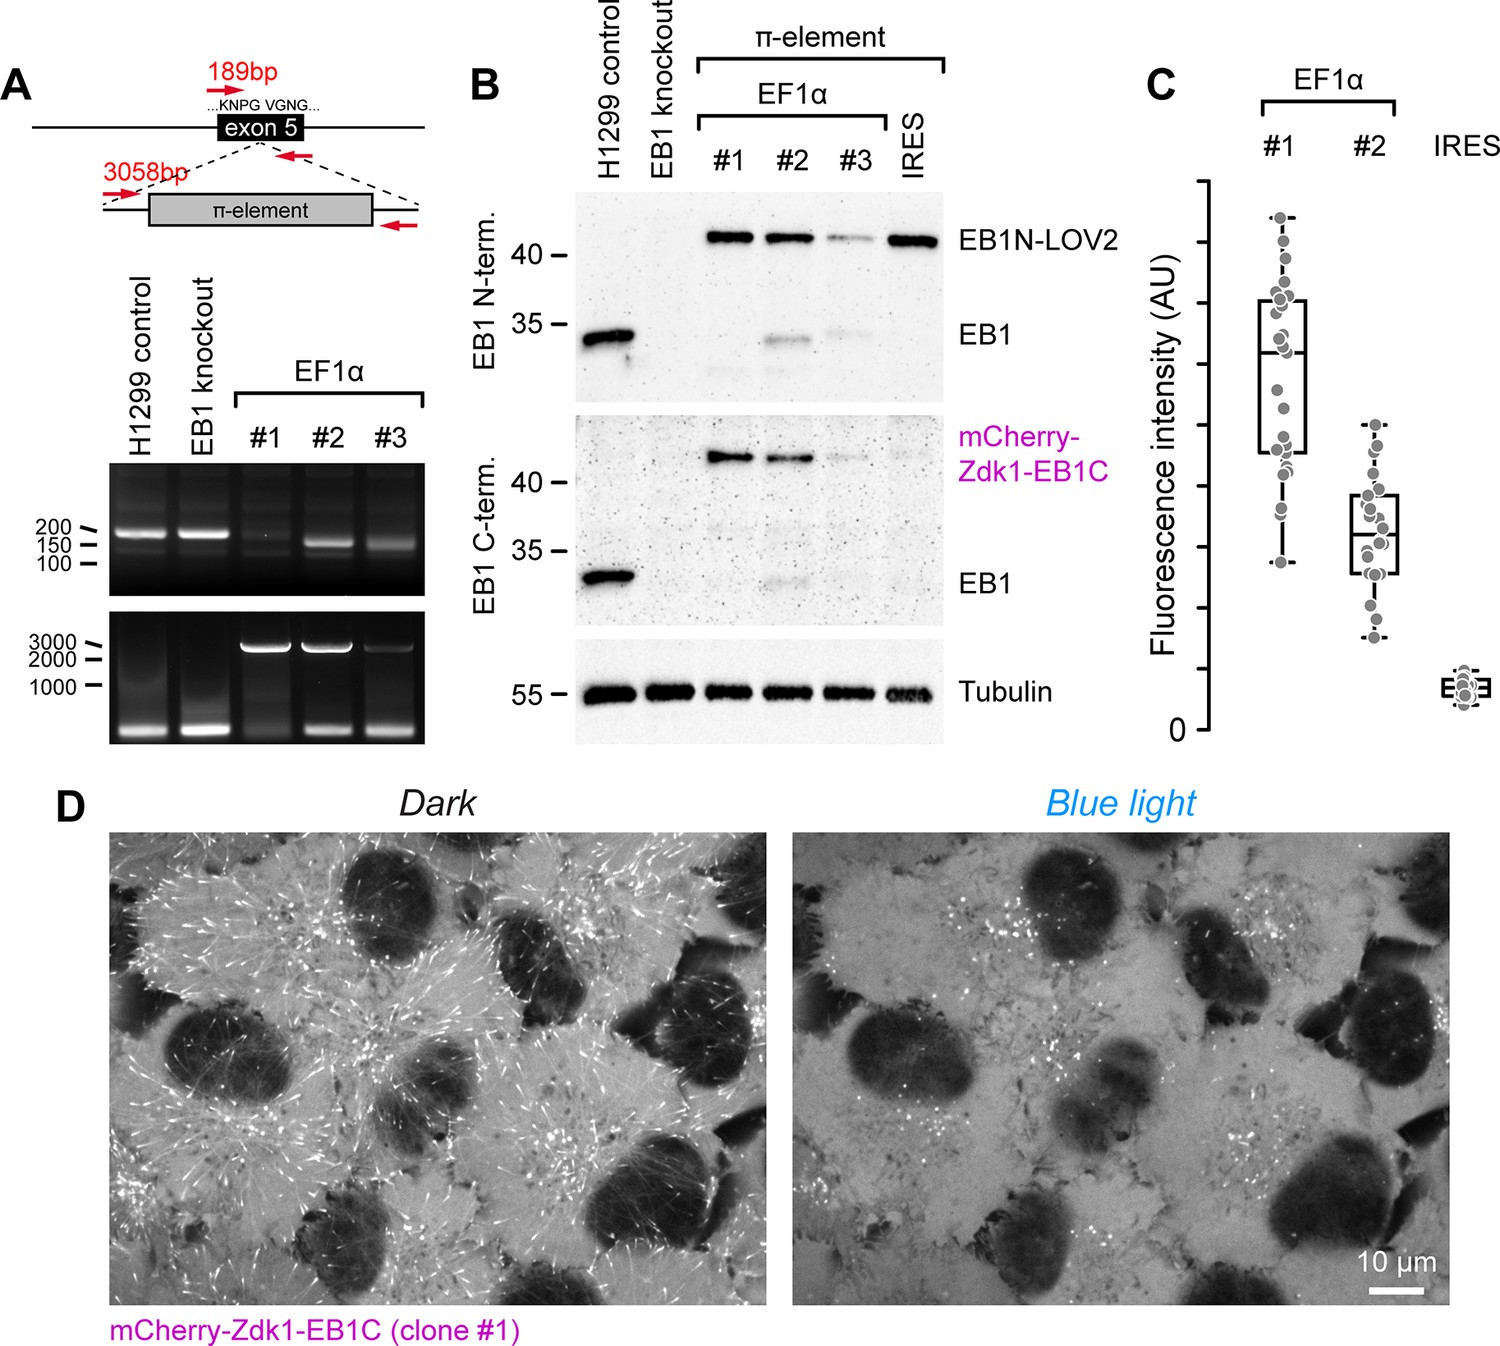
Evaluation of π-element insertion and design in H1299 lung cancer cells.
(A) Genomic PCR showing π-element insertion in H1299 clones indicates that only clone #1 is edited correctly with only the large PCR fragment that spans the inserted π-element in exon 5 of the MAPRE1/EB1 gene. (B) Immunoblot analysis of EB1 expression in cells with different π-element designs. As indicated in (A), EF1α clone #1 represents a homozygous insertion in which expression levels of both π-EB1 parts are similar to the amount of EB1 in control cells. Note that the IRES π-element (EMCV-IRES with A7 bifurcation loop) has nearly no expression of the C-terminal π-EB1 half, while expression of the N-terminal half is comparable to EF1α clone #1. This is consistent with previous reports showing that IRES-dependent expression of the second gene is often much lower than cap-dependent first gene expression but might be improved with different IRES variants (Bochkov and Palmenberg, 2006). (C) Fluorescence intensity of mCherry-Zdk1-EB1C in the indicated clones. Compared to clone #1, the mCherry-Zdk1-EB1C expression in heterozygous clone #2 is approximately half, and there is a very low expression in cells with the IRES π-element. Each data point represents the mean fluorescence intensity of one cell. (D) Images of EF1α clone #1 showing homogeneous expression and dissociation of mCherry-Zdk1-EB1C from growing MT ends during blue light exposure.
-
Figure 1—figure supplement 1—source data 1
Original DNA gel and immunoblot images.
- https://cdn.elifesciences.org/articles/84143/elife-84143-fig1-figsupp1-data1-v2.zip
Figure 1—figure supplement 2
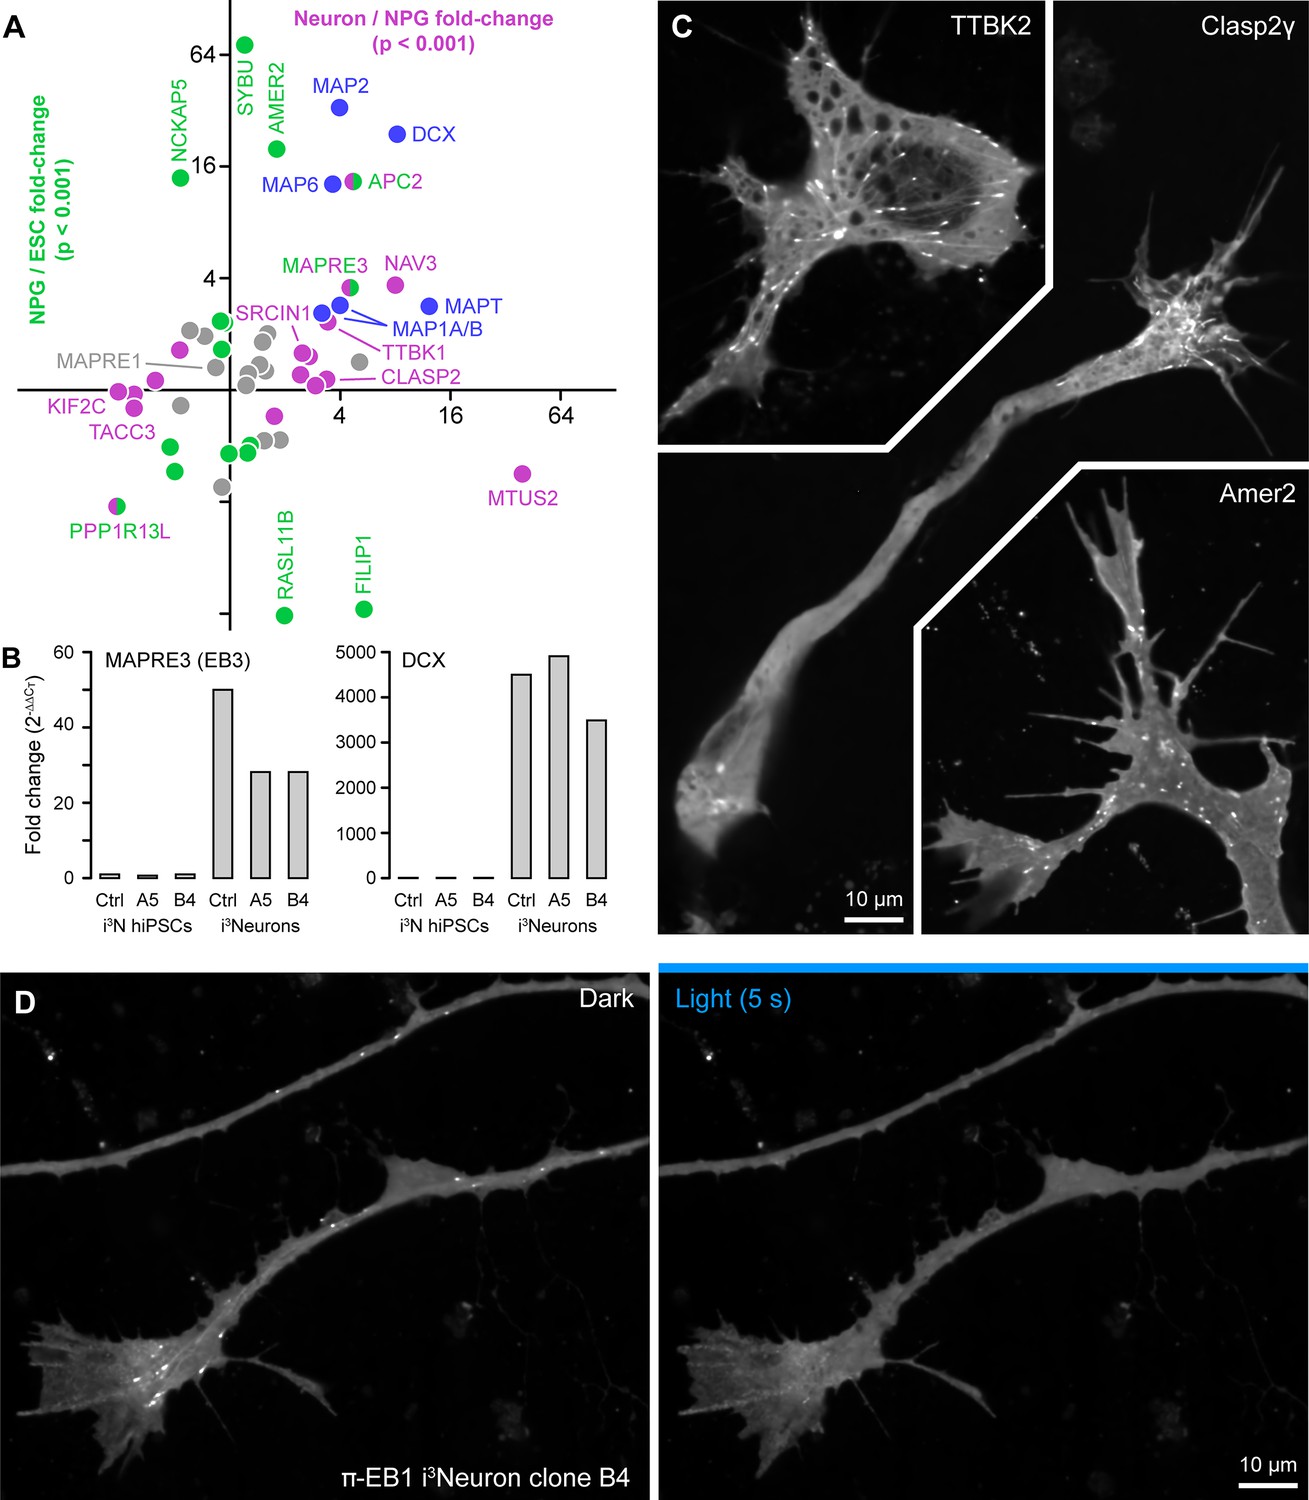
Gene expression changes associated with neuron differentiation.
(A) Changes of microtubule-associated protein (MAP) and +TIP translation during human neuron differentiation based on a published ribosome profiling data set (Blair et al., 2017). The vertical axis indicates changes between embryonic stem cells (ESCs) and neuron progenitor cells (NPGs) and the horizontal axis changes between NPGs and neurons. Changes in colored symbols were statistically significant to a p<0.001. Selected proteins are labeled. (B) RT-qPCR analysis of EB3 and DCX expression in control and π-EB1 i3N lines illustrating robust upregulation of both proteins during Ngn2-induced neuronal differentiation. (C) Examples of growing MT plus end localization of transiently transfected EGFP-tagged +TIPs in i3Neurons in early stages of differentiation. Note that Clasp2γ preferentially binds growth cone MTs likely due to a GSK3β kinase activity gradient (Kumar et al., 2009). Amer2 also displays prominent membrane localization. (D) π-EB1 i3Neuron neurite and growth cone showing dissociation of the EGFP tagged π-EB1 C-terminal half during blue light exposure.
Figure 1—figure supplement 3
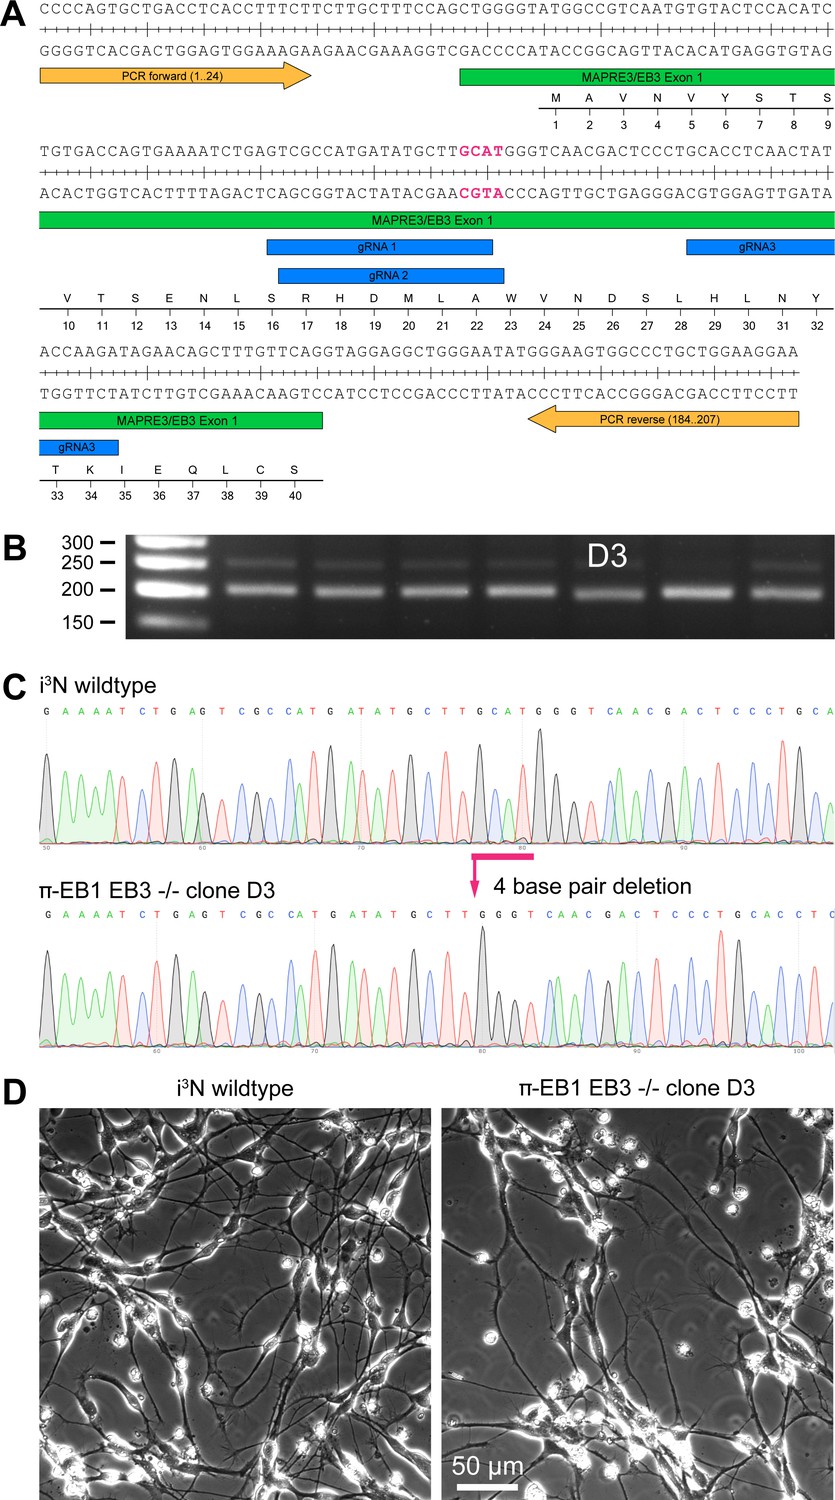
Validation of EB3 knockout in π-EB1 i3N cells.
(A) MAPRE3/EB3 knockout strategy by CRISPR/Cas9 genome editing. (B) Genomic PCR across MAPRE3/EB3 exon 1 with the primers indicated in (A) showing a small downshift in the clone labeled D3. (C) Sequencing of the genomic PCR products from EB3 wild-type cells and the knockout clone indicates a four base pair deletion, also highlighted in red in (A) that introduces a frameshift and stop codon in exon 1. (D) Images of wildtype and π-EB1 EB3-/- i3Neurons showing normal differentiation 2 days after plating on laminin-coated dishes.
-
Figure 1—figure supplement 3—source data 1
Original DNA gel images.
- https://cdn.elifesciences.org/articles/84143/elife-84143-fig1-figsupp3-data1-v2.zip
Figure 1—video 1
Time-lapse of genome-edited π-EB1 i3N hiPSCs transiently expressing EB1N-mScarlet-LOV2 to visualize microtubule (MT) growth dynamics before and during blue light exposure.
Related to Figure 1I.
Figure 1—video 2
Long-term phase contrast time-lapse of π-EB1 EB3-/- i3Neurons in the absence of blue light exposure showing normal neurite and growth cone dynamics.
The cells are growing on a grid of laminin paths. Elapsed time is shown in hours:minutes:seconds.
Figure 2 with 2 supplements
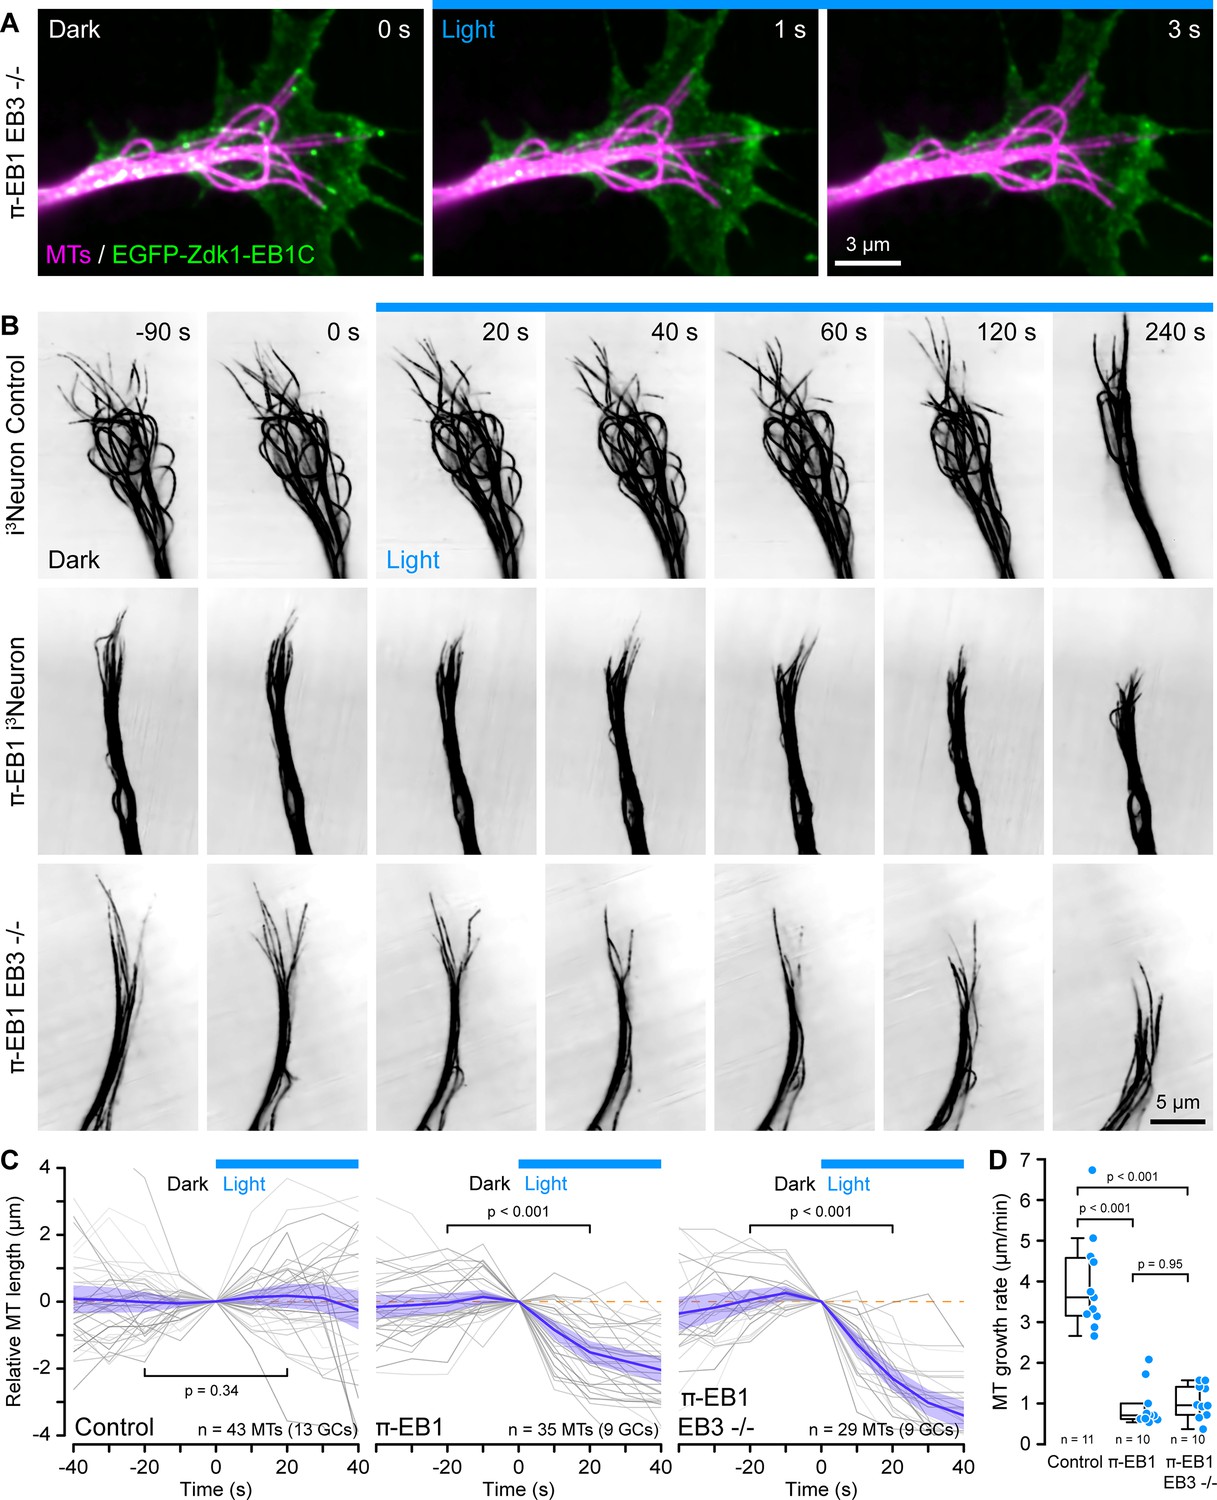
π-EB1 photoinactivation destabilizes MTs in i3Neuron growth cones.
(A) Growth cone of a π-EB1 EB3-/- i3Neuron in which MTs were labeled with the far-red cabazitaxel derivative 4–610 CP-CTX. EGFP-Zdk1-EB1C dissociates from growing MT ends within seconds of blue light exposure. (B) MTs labeled with SPY555-tubulin in growth cones of i3Neurons with the π-EB1 genotype indicated on the left. Note that microtubules (MTs) continue to dynamically extend into the growth cone periphery in control i3Neurons but frequently depolymerize upon blue light exposure in both π-EB1 and π-EB1 EB3-/- i3Neuron growth cones. Images are shown in inverted contrast for better visibility. (C) Quantification of the length change of 3–4 MTs per growth cone of MT ends that were clearly visible before and during blue light exposure. Gray lines are individual MTs. Blue line is the average of all MTs and the shaded area indicates the 95% confidence interval. The orange dashed line indicates no change. Statistical analysis by paired t-test at 20 s before and during blue light exposure. (D) Quantification of the growth cone MT growth rate after 60 s of blue light exposure by tracking SPY555-tubulin-labeled MT ends. Data points represent the average of >100 frame-to-frame growth rate measurements from multiple MTs per growth cone. Statistical analysis by ANOVA and Tukey-Kramer HSD. To better show individual growth cone MTs, the gamma of the tubulin channels was adjusted non-linearly.
Figure 2—video 1
Time-lapse of EGFP-tagged π-EB1 C-terminal half in π-EB1 EB3-/- i3Neurons demonstrating repeatability of π-EB1 photodissociation in differentiating neurons.
3 s photoinactivation sequences are interspersed by 5 min dark recovery periods. Elapsed time is shown in minutes:seconds. Related to Figure 2A.
Figure 2—video 2
Time-lapse of MT dynamics in SPY555-tubulin labeled control and π-EB1 EB3-/- i3Neuron growth cones before and during blue light exposure.
Related to Figure 2B.
Figure 3 with 1 supplement
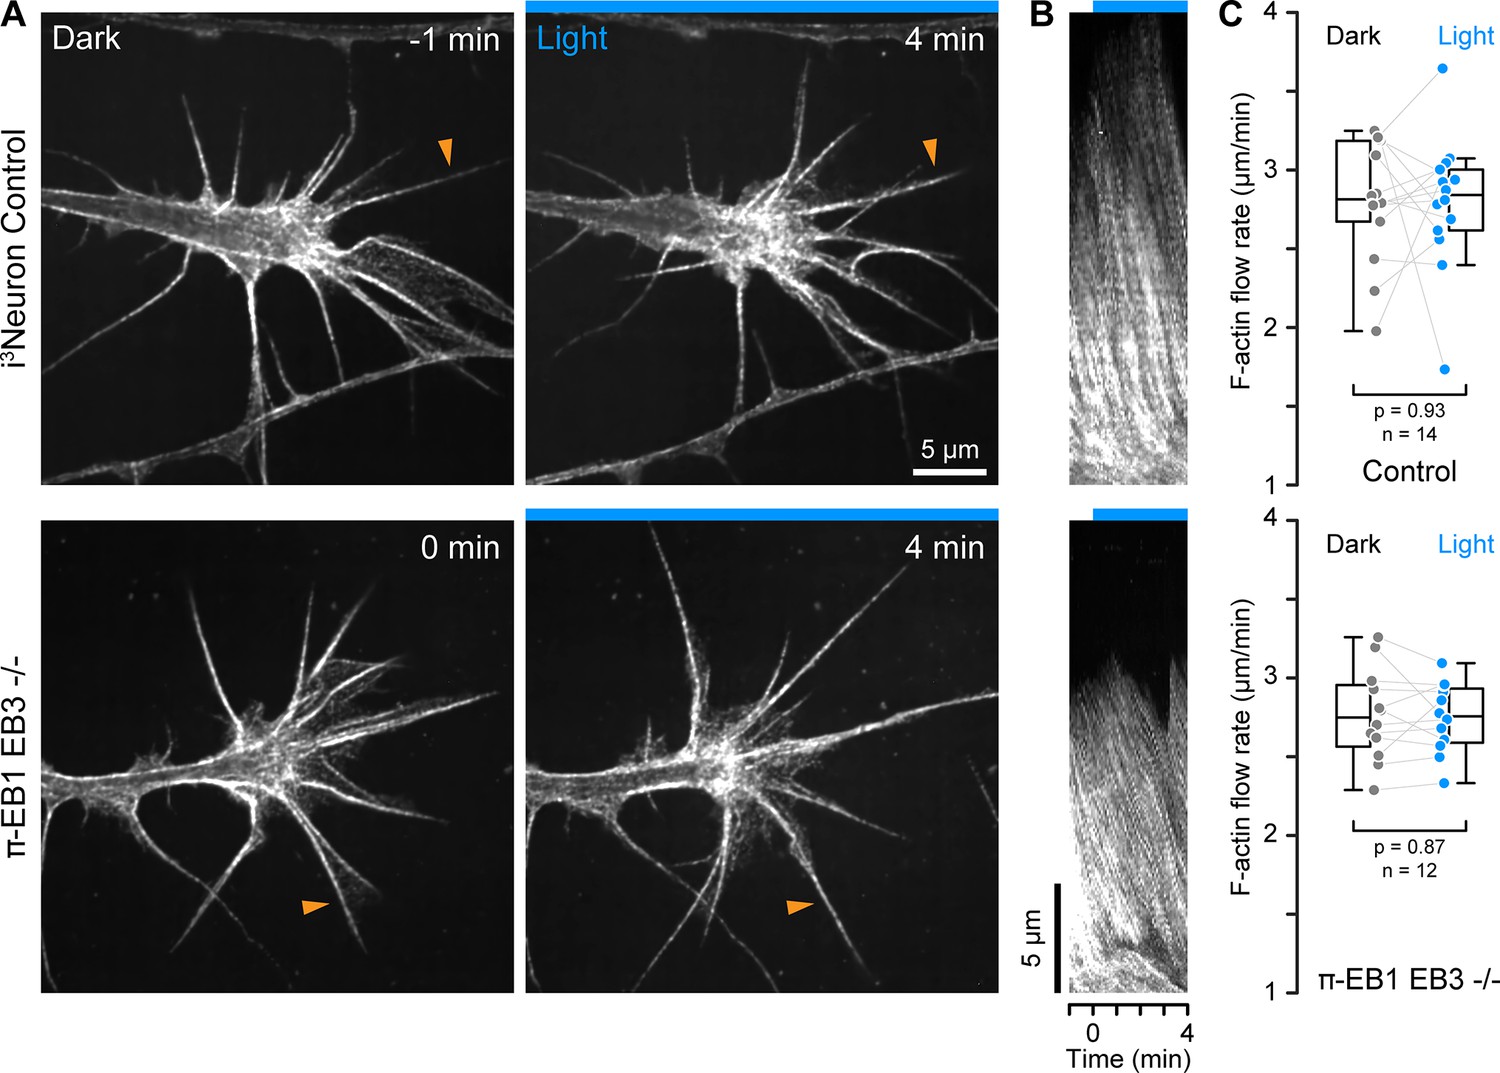
F-actin dynamics in π-EB1 neuron growth cones.
(A) Growth cones of control and π-EB1 EB3-/- i3Neurons labeled with SPY650-FastAct before and during blue light exposure. Apparent relocalization of F-actin to the middle of the growth cone is observed in both conditions and is likely related to the photobleaching of the probe. (B) Kymographs along the filopodia indicated by orange arrowheads in A illustrating F-actin retrograde flow. (C) Quantification of the F-actin retrograde flow rate before and during blue light exposure. Each data point represents the average of at least three flow measurements per growth cone. Gray lines connect data points from the same growth cone. Statistical analysis by paired t-test. In addition, ANOVA of all four groups showed no significant difference between control and π-EB1 EB3-/- i3Neurons (p>0.97 for all pairwise comparisons with Tukey-Kramer HSD).
Figure 3—video 1
Time-lapse of a growth cone of a π-EB1 EB3-/- i3Neuron labeled with SPY650-FastAct before and during blue light exposure indicating that F-actin retrograde flow is insensitive to π-EB1 photodissociation at this time scale.
Related to Figure 3.
Figure 4 with 2 supplements

π-EB1 photoinactivation blocks growth cone advance.
(A) Control and π-EB1 EB3-/- i3Neuron neurites in which MTs were labeled with 4–610 CP-CTX before and during blue light exposure illustrating the retraction of the π-EB1 neurite in blue light while the control neurite continues to advance. In this experiment, the entire growth cone and adjacent neurite were exposed to blue light. (B) Quantification of the neurite length change before and during blue light exposure. Gray lines indicate individual neurites. Blue line is the average of all neurites, and the shaded area indicates the 95% confidence interval. The orange dashed line indicates no change. Statistical analysis by ANOVA and Tukey-Kramer HSD at 15 min of blue light exposure. (C) Quantification of the retraction response of control and π-EB1 EB3-/- i3Neuron growth cones that encounter a blue light barrier. Statistical analysis by Fisher’s exact test. (D) Long-term phase contrast time-lapse sequence of a π-EB1 neurite advancing upward on a 10 µm wide stripe of laminin illustrating growth cone retraction every time the growth cone attempts to cross the virtual blue light barrier. Elapsed time is indicated in hours:minutes.
Figure 4—video 1
Time-lapse of neurite dynamics in control and π-EB1 EB3-/- i3Neurons in which MTs were labeled with 4–610 CP-CTX before and during blue light exposure.
Related to Figure 4A.
Figure 4—video 2
Long-term phase contrast time-lapse of a π-EB1 neurite advancing along laminin path toward a blue light exposed region.
The growth cone fails to cross the blue light barrier multiple times. Related to Figure 4D. Elapsed time is shown in hours:minutes:seconds.
Figure 5 with 1 supplement
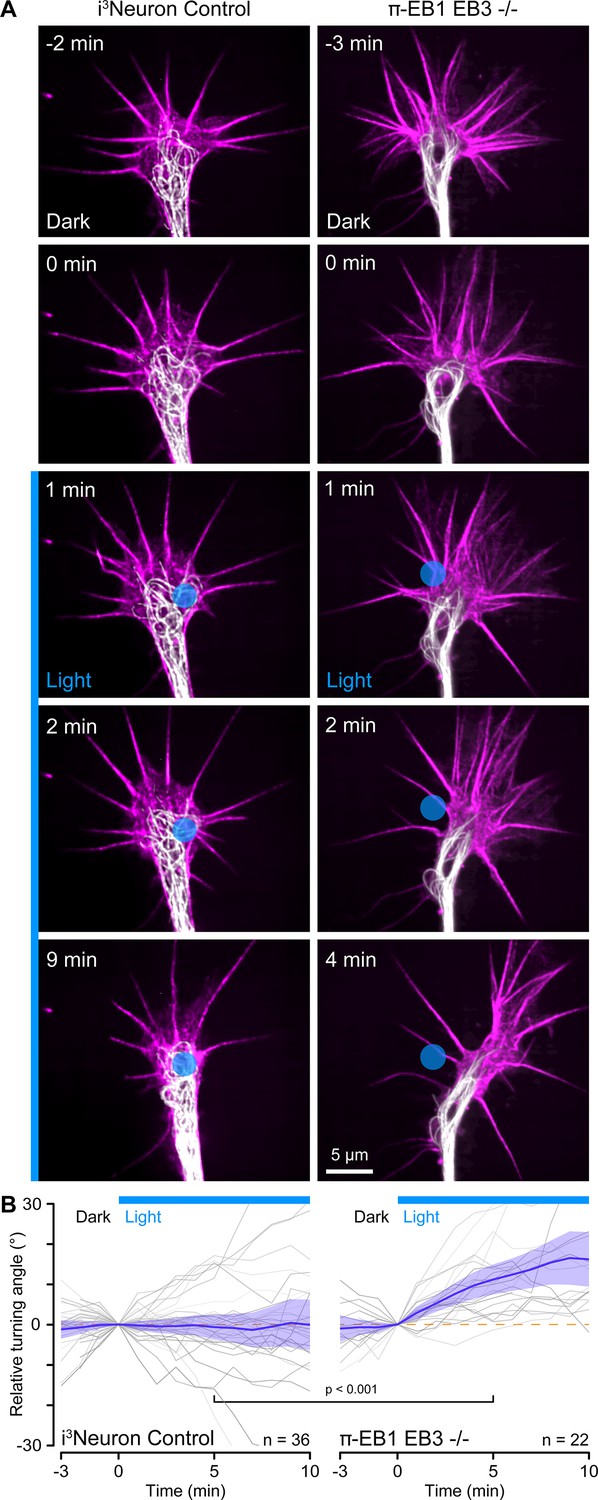
Growth cone turning in response to local π-EB1 photoinactivation.
(A) Time-lapse of control and π-EB1 EB3-/- i3Neuron growth cones labeled with SPY555-tubulin (white) and SPY650-FastAct (magenta). The gamma of the tubulin channel was adjusted to 0.6 to better visualize growth cone microtubules (MTs). The blue circle indicates the light-exposed area. (B) Quantification of the relative turning angle in response to local blue light exposure. Gray lines are individual growth cones. Blue line is the average of all growth cones measurements, and the shaded area indicates the 95% confidence interval. The orange dashed line indicates the 0° angle. Statistical analysis by unpaired t-test at 5 min of local blue light exposure.
Figure 5—figure supplement 1
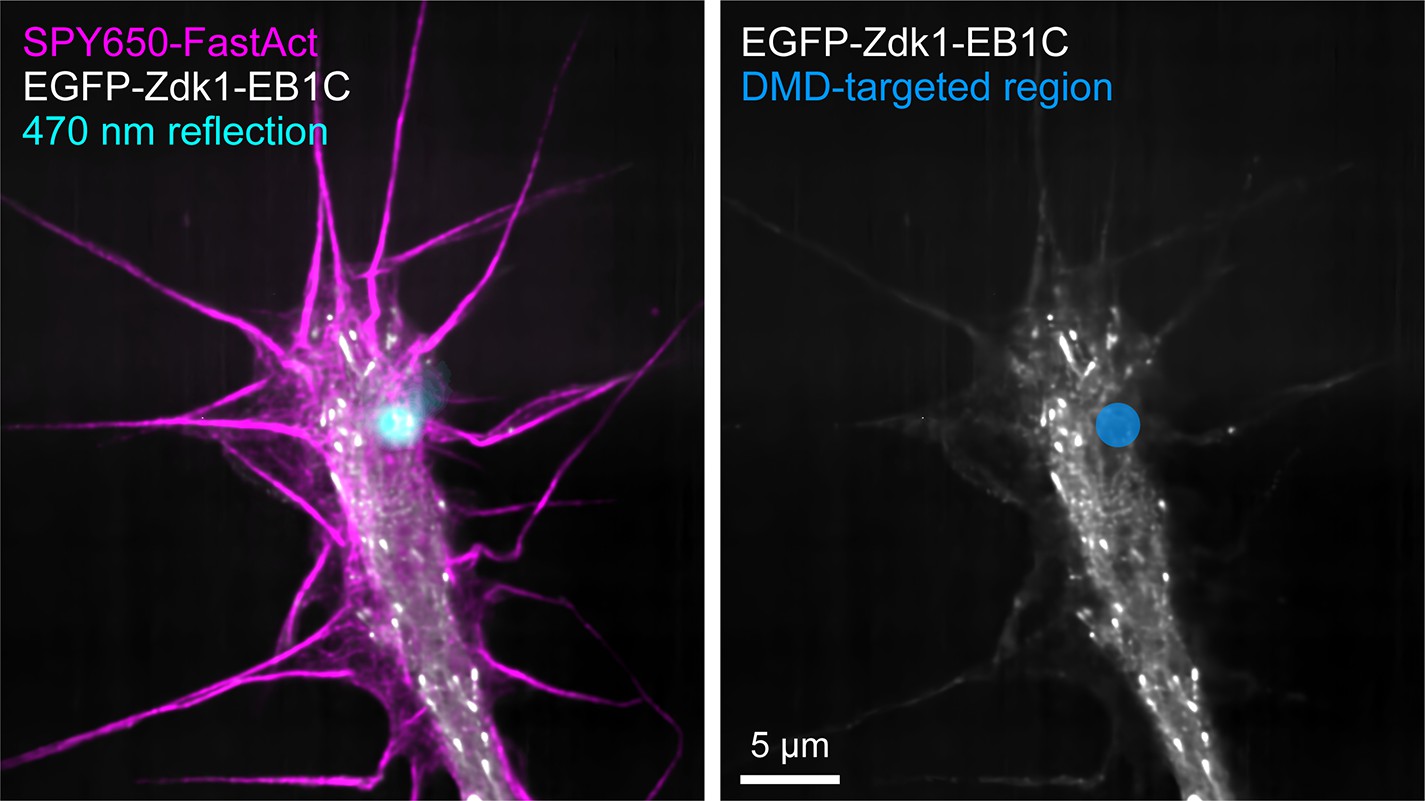
Accuracy of local π-EB1 photodissociation.
The left panel shows the reflection of the 470 nm blue light stimulation pattern overlaid on the image of a π-EB1 EB3-/- i3Neuron growth cone. The right panel shows the blue light-stimulated region as targeted in the software. The EGFP-Zdk1-EB1C image is taken after several seconds of 10 ms stimulation pulses at 2 Hz (the same as in the growth cone turning experiment) in the indicated region showing that π-EB1 photodissociation remains tightly localized to the blue light exposed area.
Tables
Key resources table
| Reagent type (species) or resource | Designation | Source or reference | Identifiers | Additional information |
|---|---|---|---|---|
| Cell line (Homo sapiens) | i3N induced pluripotent stem cells | Wang et al., 2017 | Doxycycline-induced differentiation into cortical i3Neurons | |
| Cell line (Homo sapiens) | NCI-H1299 | ATCC | CRL-5803 | |
| Antibody | anti-EB1 (N-terminal epitope, mouse monoclonal) | Thermo Fisher Scientific | Cat# 41–2100, RRID:AB_2533500 | 1:1000 (WB) |
| Antibody | anti-EB1 (C-terminal epitope, mouse monoclonal) | BD Biosciences | Cat# 610534, RRID:AB_397891 | 1:1000 (WB) |
| Antibody | anti-EB3 (rat monoclonal) | Absea | Cat# KT36 | 1:1000 (WB) |
| Antibody | anti-KIF2C (mouse monoclonal) | Santa Cruz Biotechnology | Cat# sc-81305, RRID:AB_2132051 | 1:1000 (WB) |
| Antibody | anti-Oct-3/4 (mouse monoclonal) | Santa Cruz Biotechnology | Cat# sc-5279, RRID:AB_628051 | 1:500 (IF) |
| Recombinant DNA reagent | EB1N-LZ-LOV2 (plasmid) | van Haren et al., 2018 | Addgene plasmid 107614 | |
| Recombinant DNA reagent | MSCV-PIG | Scott Lowe, unpublished | Addgene plasmid 18751 | IRES plasmid |
| Recombinant DNA reagent | pmCherry-Zdk1-EB1C | van Haren et al., 2018 | Addgene plasmid 107695 | |
| Recombinant DNA reagent | pSpCas9(BB)–2A-GFP | Ran et al., 2013 | Addgene plasmid 48138 | Cas9 plasmid |
| Sequence-based reagent | EB1 Exon 1–2 | Integrated DNA Technologies | RT-qPCR primers, Hs.PT.58.1854993 | |
| Sequence-based reagent | EB1 Exon 6–7 | Integrated DNA Technologies | RT-qPCR primers, Hs.PT.58.24290642 | |
| Sequence-based reagent | EB3 | Integrated DNA Technologies | RT-qPCR primers, Hs.PT.58.20604386 | |
| Sequence-based reagent | DCX | Integrated DNA Technologies | RT-qPCR primers, Hs.PT.58.118505 | |
| Chemical compound, drug | SPY555-tubulin | Spyrochrome / Cytoskeleton Inc. | CY-SC203 | 1:2000 |
| Chemical compound, drug | SPY650-FastAct | Spyrochrome / Cytoskeleton Inc. | CY-SC505 | 1:3000 |
| Chemical compound, drug | 4–610 CP-CTX | Bucevičius et al., 2020 | 5 nM |
Additional files
-
Supplementary file 1
Excel spreadsheet detailing all primer and guide RNA sequences used for cloning, CRISPR/Cas9 genome editing, and genomic PCR.
- https://cdn.elifesciences.org/articles/84143/elife-84143-supp1-v2.xlsx
-
MDAR checklist
- https://cdn.elifesciences.org/articles/84143/elife-84143-mdarchecklist1-v2.docx
Download links
A two-part list of links to download the article, or parts of the article, in various formats.
Downloads (link to download the article as PDF)
Open citations (links to open the citations from this article in various online reference manager services)
Cite this article (links to download the citations from this article in formats compatible with various reference manager tools)
Growth cone advance requires EB1 as revealed by genomic replacement with a light-sensitive variant
eLife 12:e84143.
https://doi.org/10.7554/eLife.84143


