Rapid geographical source attribution of Salmonella enterica serovar Enteritidis genomes using hierarchical machine learning
- Bristol Veterinary School, University of Bristol, United Kingdom
- Milner Centre for Evolution, Life Sciences Department, University of Bath, United Kingdom
- Genomic Laboratory Hub (GLH), Addenbrooke’s Hospital, Cambridge University Hospitals NHS Foundation Trust, United Kingdom
- Gastrointestinal Reference Services, UK Health Security Agency, United Kingdom
- Institute for Risk Assessment Sciences, Utrecht University, Netherlands
Figures
Figure 1 with 1 supplement
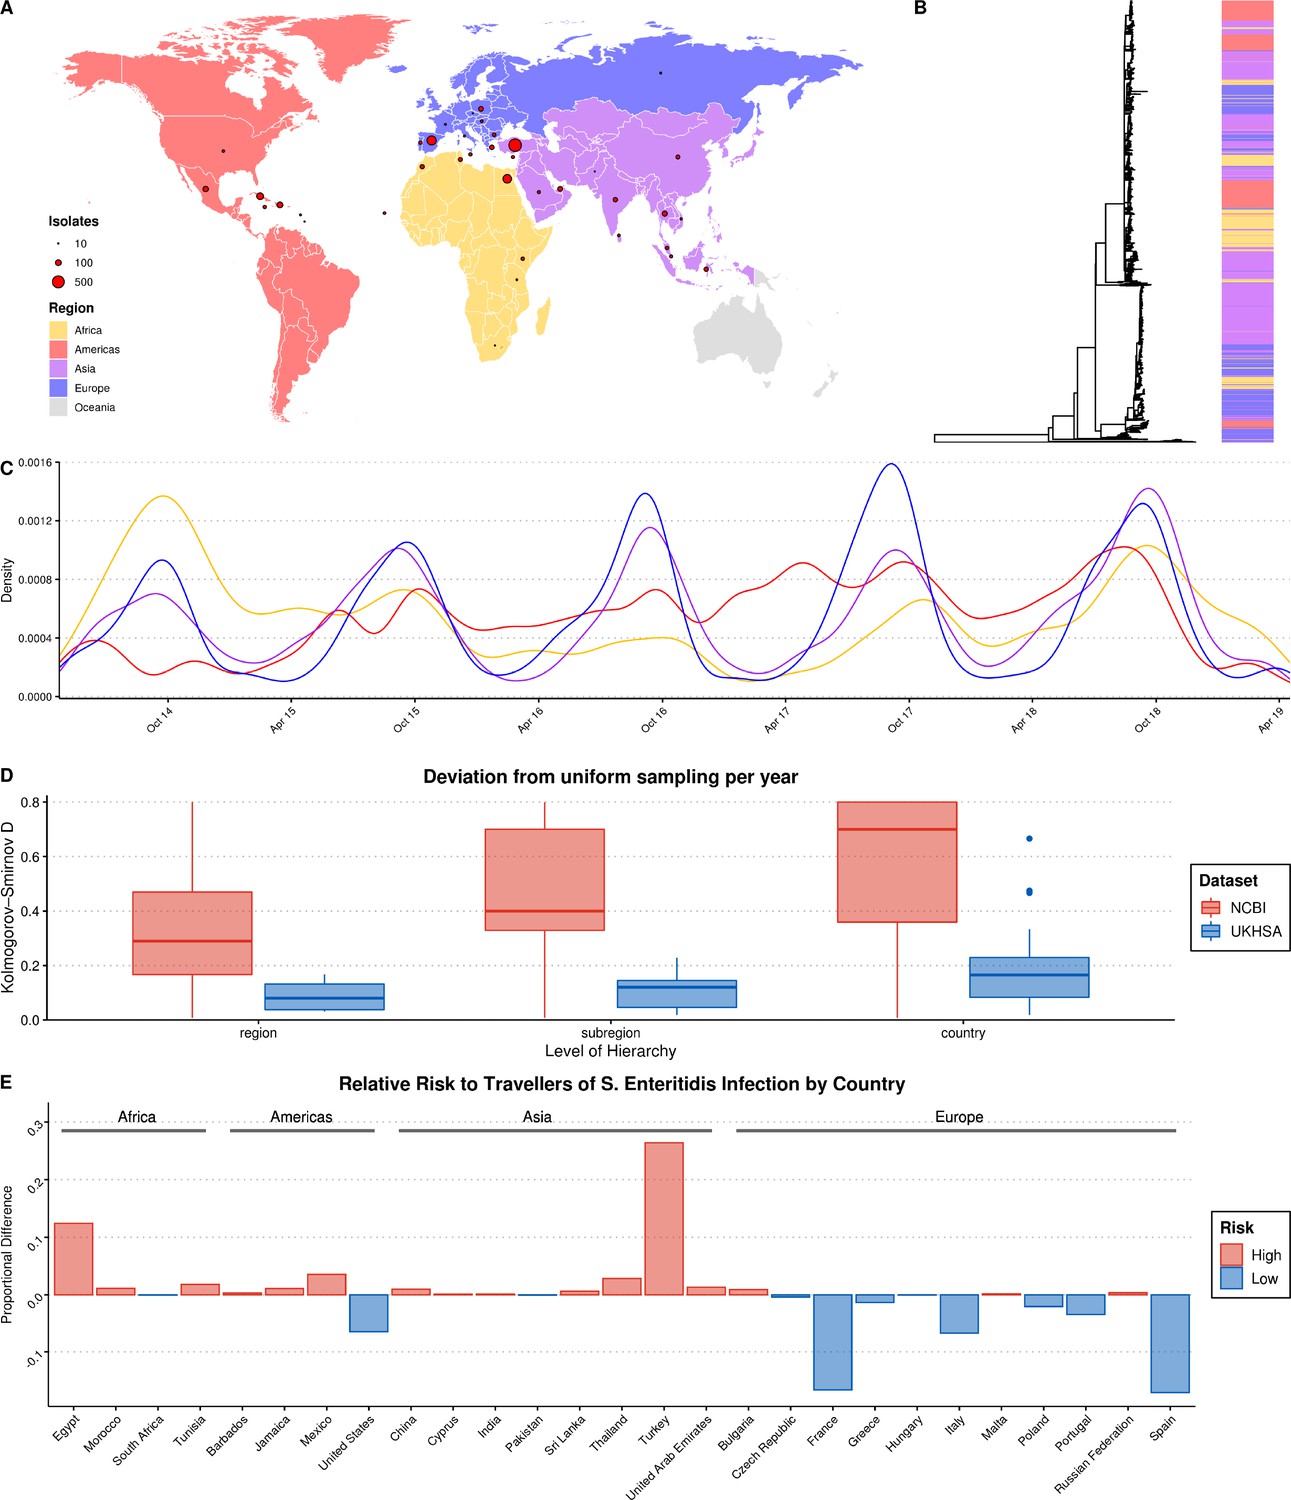
Summary of S. Enteritidis isolates collected by the UKHSA from UK clinical patients who recently reported foreign travel between 2014–2019.
(A) Geographical distribution of 2,313 S. Enteritidis isolates by reported foreign travel. Variably sized points represent the number of samples per country. The map is colored by region (Africa: yellow, Americas: red, Asia: purple, Europe: blue). (B) Maximum likelihood phylogenetic tree of 2,313 S. Enteritidis isolates with bar colored by region of origin. (C) Kernel density plot indicating sampling density per region through time. No correction was made for the seasonal variation observed in international travel. (D) Comparison of the consistency of the sampling effort of the UKHSA to all publicly available S. Enteritidis isolates on NCBI for the same period. Isolates were resampled to control for variable sample number per year and compared to a uniform distribution using the Kolmogorov-Smirnov D statistic (NCBI = red, UKHSA = blue). Higher values indicate greater deviation from a uniform distribution. (E) Relative risk per country of acquiring S. Enteritidis infection when traveling. A risk score was generated by dividing the proportion of UKHSA clinical isolates per country by the proportion of all UK travelers traveling to that country as recorded by the Office of National Statistics (ONS). Only countries present in both datasets were used to calculate proportions.
Figure 1—figure supplement 1
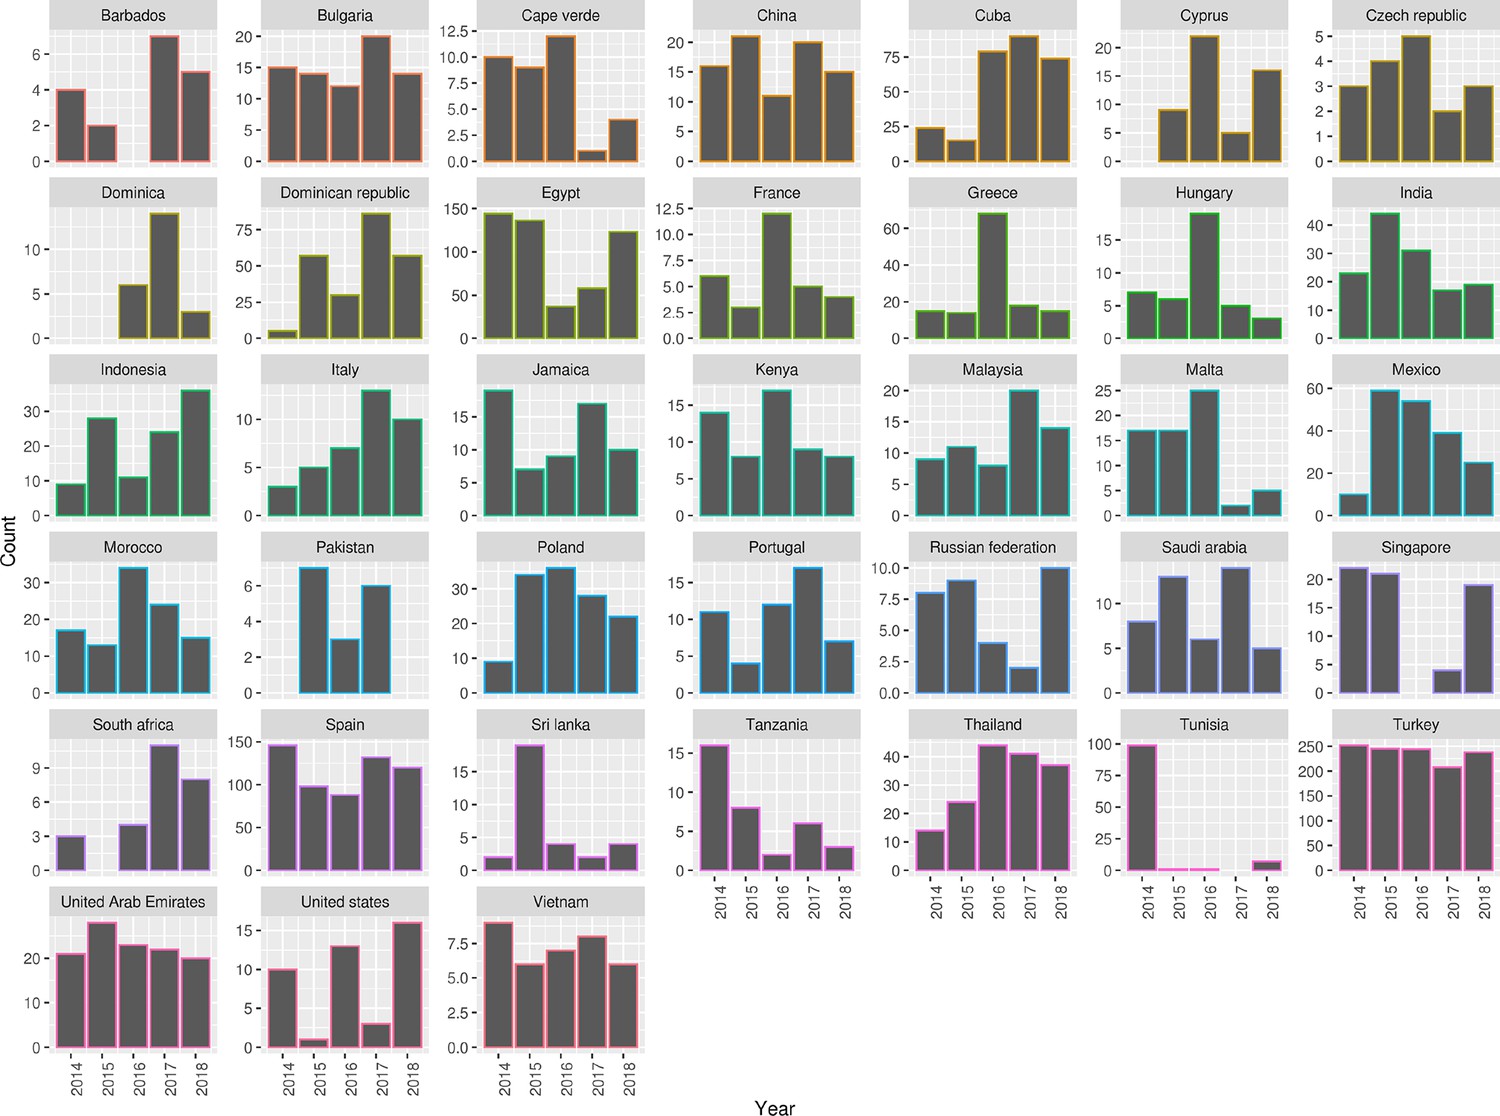
Summary of 2,313 S. Enteritidis isolates collected by the UKHSA from UK clinical patients during 2014-2019 who recently reported foreign travel to 38 individual country classes. Each panel contains a bar chart of isolate counts per year per country class.
Figure 2
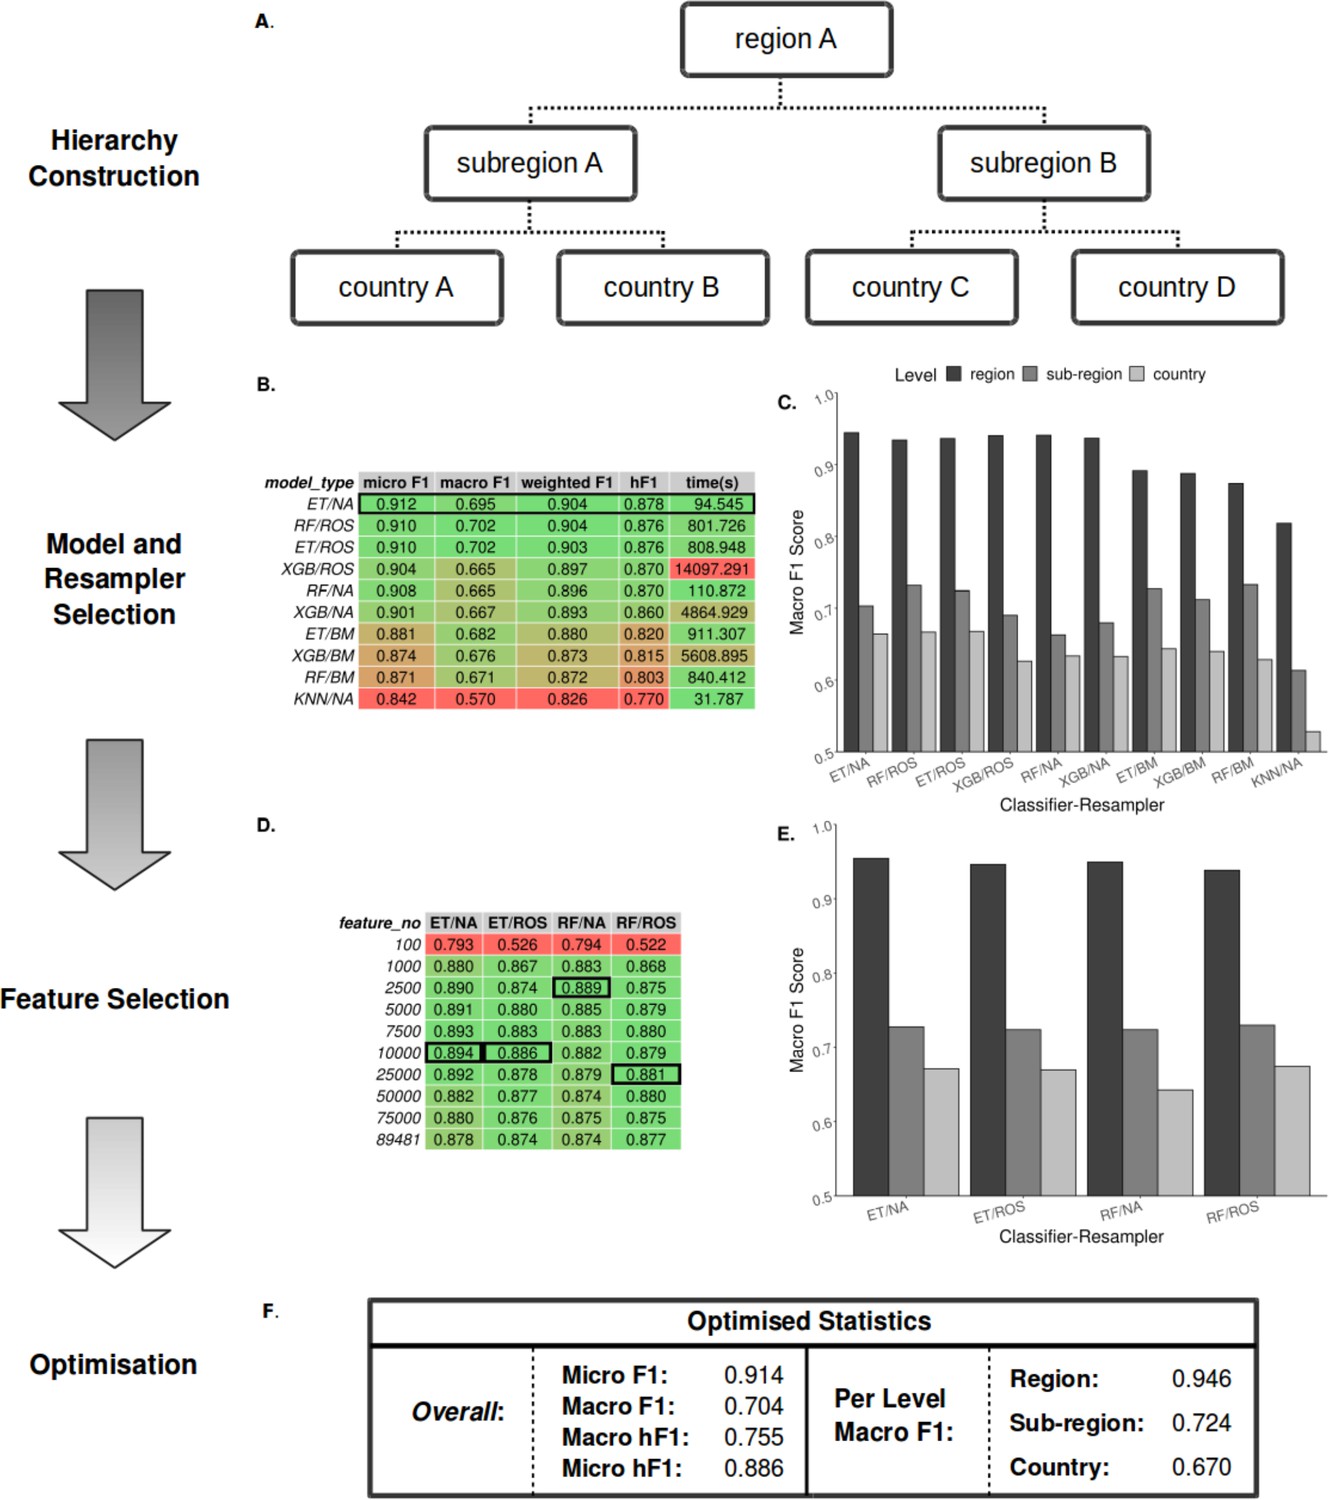
Summary statistics showing model and resampling scheme selection, feature selection, and optimization of the S. Enteritidis hML source attribution model.
(A) Example schematic of a geographical hierarchy based upon the UN M49 Standard for regional codes. (B) Table of summary statistics for the ten top-performing co-optimized model and resampling methods from a cohort of 36 combinations, sorted by hF1 (high-low). Training time is reported in the final column in seconds. A black box indicates the top four models used for feature selection. (C) Grouped bar chart comparing macro F1 per hierarchical level for the ten top-performing model/resampled combinations. (D) Table of summary statistics for random forest feature selection applied to the four top-performing co-optimized model and resampling methods. Black boxes indicate the optimal number of features per combination. (E) Grouped bar chart comparing macro F1 per hierarchical level for the four top-performing co-optimied model and resampling methods after feature selection optimization. (F) Summary statistics for the final optimized Random Forest - Random Oversampler model (25,000 features selected). ML Model abbreviations: Random Forest (RF), XGBoost (XGB), Extra Trees (ET), K-Nearest Neighbours (KNN). Resampler abbreviations: No Resampling (NA), Random Undersampler (RUS), Random Oversampler (ROS), Balancing Mean (BM), Hierarchical Mean (HM).
Figure 3 with 3 supplements
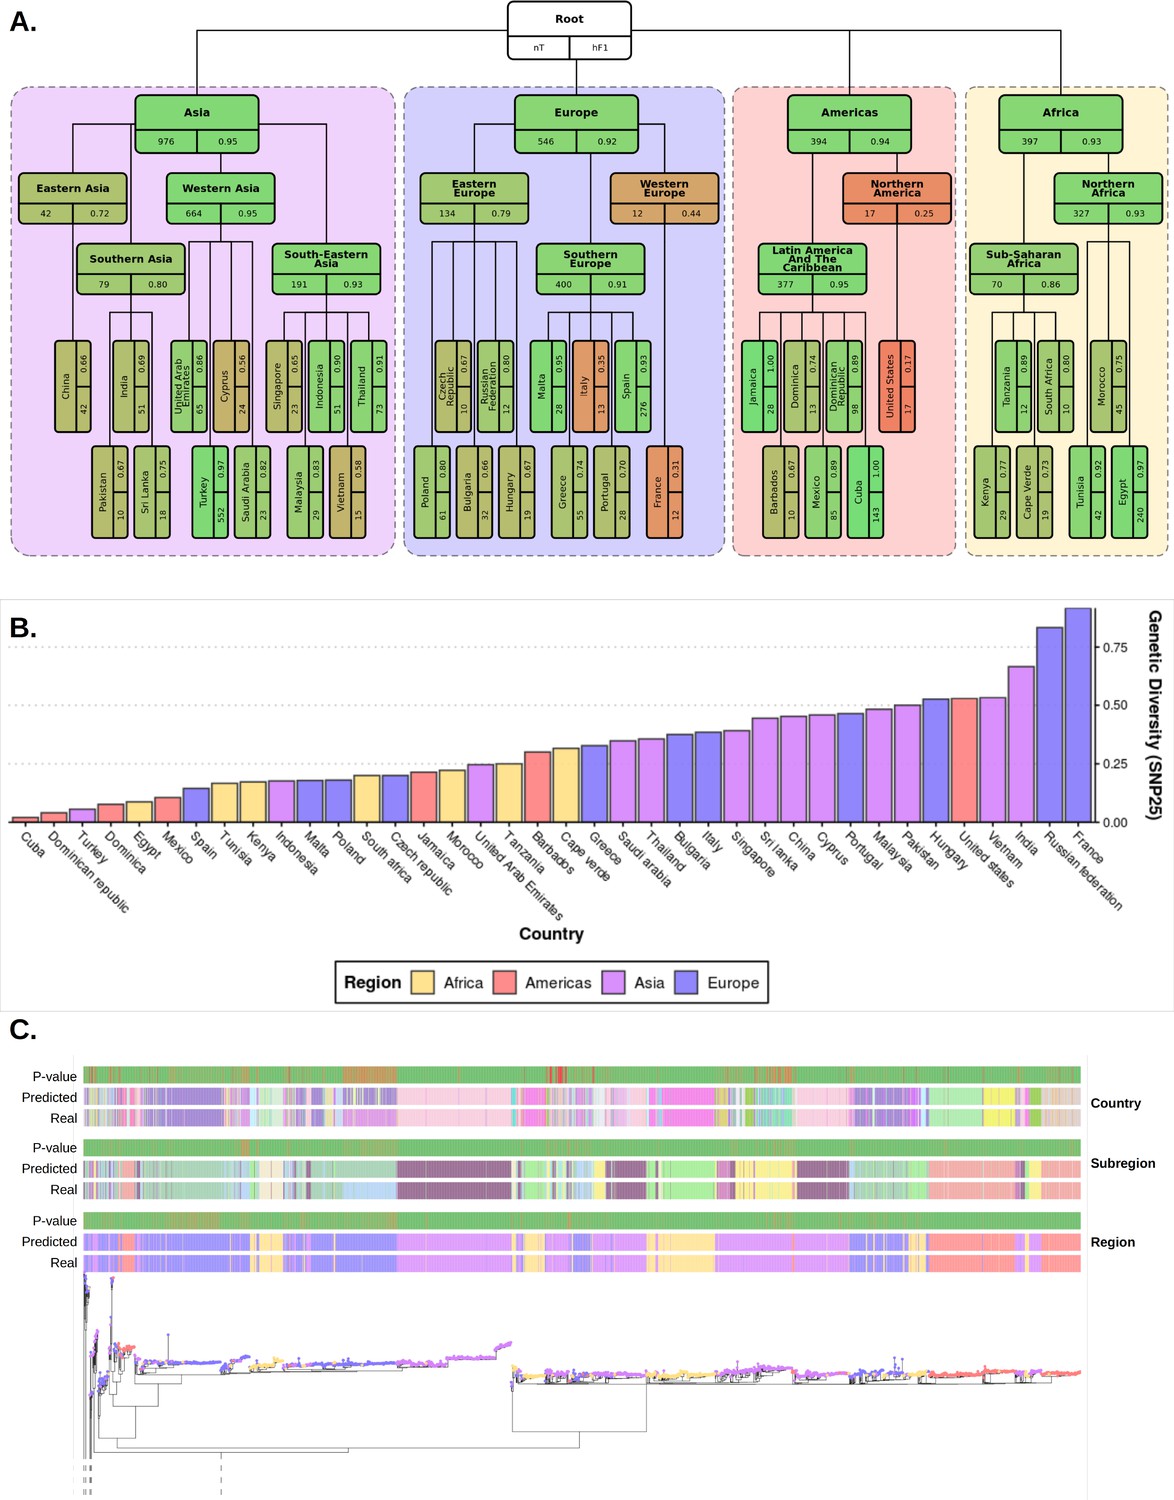
Plots summarizing results from hierarchical machine learning (hML) model applied to the S. Enteritidis test dataset and a measurement of the genetic diversity of S. Enteritidis sample collection per country.
(A) Diagrammatic representation of classification metrics of the hML classifier applied to the test dataset. Links between classes/nodes in the hierarchy are indicated by connecting lines. Boxes represent individual classes in the Machine learning (ML) model and are colored by their hierarchical F1 (hF1) scores. The top panel of each class box displays the class label, the bottom left panel indicates the total number of samples for that class before the train/test split (75%/25%) and the bottom right panel shows the class hF1 score calculated from the test dataset. Classes within individual ‘regions’ (continents) were contained in a colored background panel. (B) Bar plot of genomic diversity per country. Genomic diversity was estimated as the number of 25 single nucleotide polymorphism (SNP) single linkage clusters divided by the total number of samples per class. Panels (A) and bars (B) were colored according to region (Africa: yellow, Americas: red, Asia: purple, Europe: blue). (C) Maximum-likelihood phylogenetic tree of the UKHSA S. Enteritidis isolates from the training and test datasets. The real label and predicted label (each assigned a unique color) of each isolate alongside the p-value generated by the model is shown for each hierarchical class level - region, subregion and country. Colored tree tips represent the region class of each isolate. An interactive version of the tree and associated metadata are available in Microreact.
Figure 3—figure supplement 1
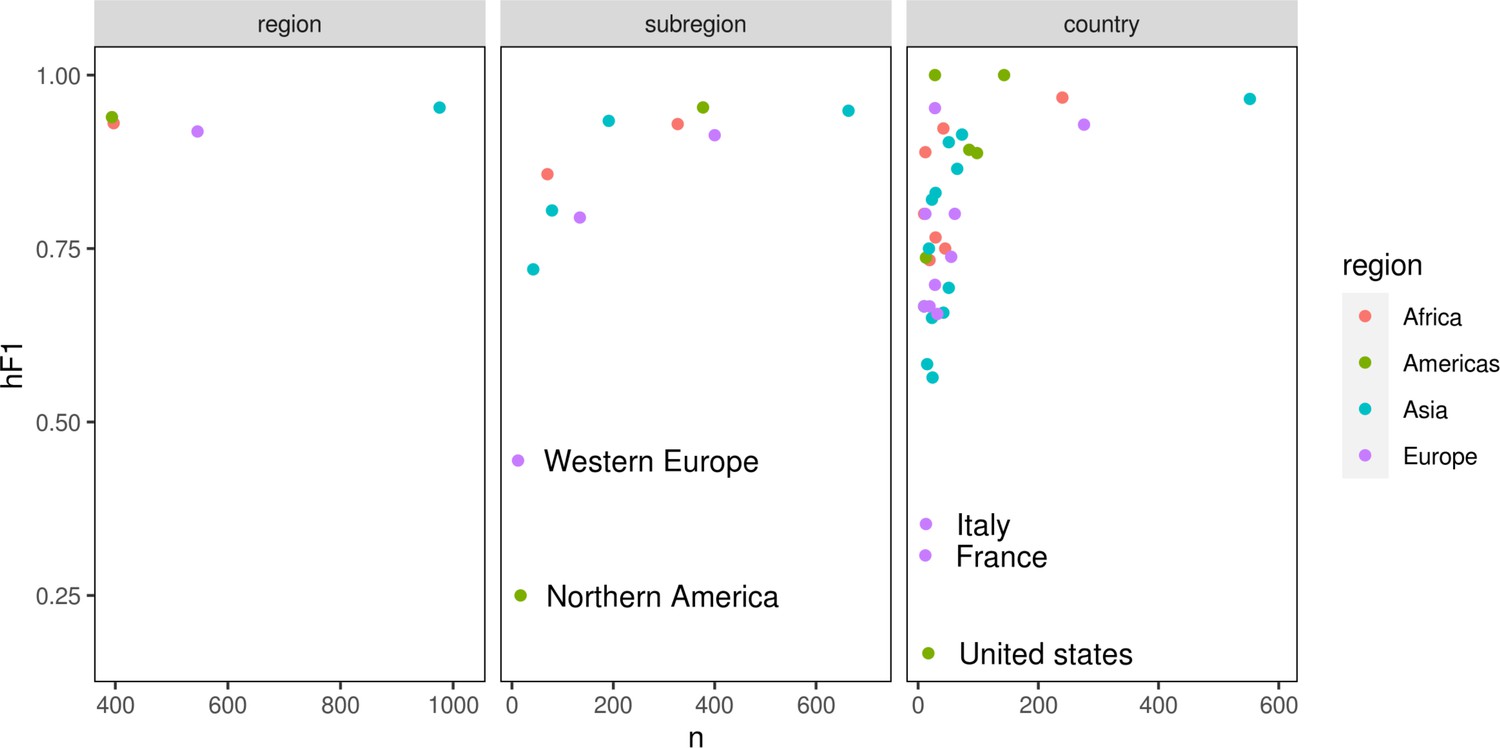
Scatter plots summarizing the number of samples (x-axis) vs hF1 score (y-axis) generated by the optimized hierarchical machine learning (hML) model.
The three hierarchical levels (country/subregion/region) are represented by a separate plot panel. Each point is the hF1 score per class at that hierarchical level.
Figure 3—figure supplement 2
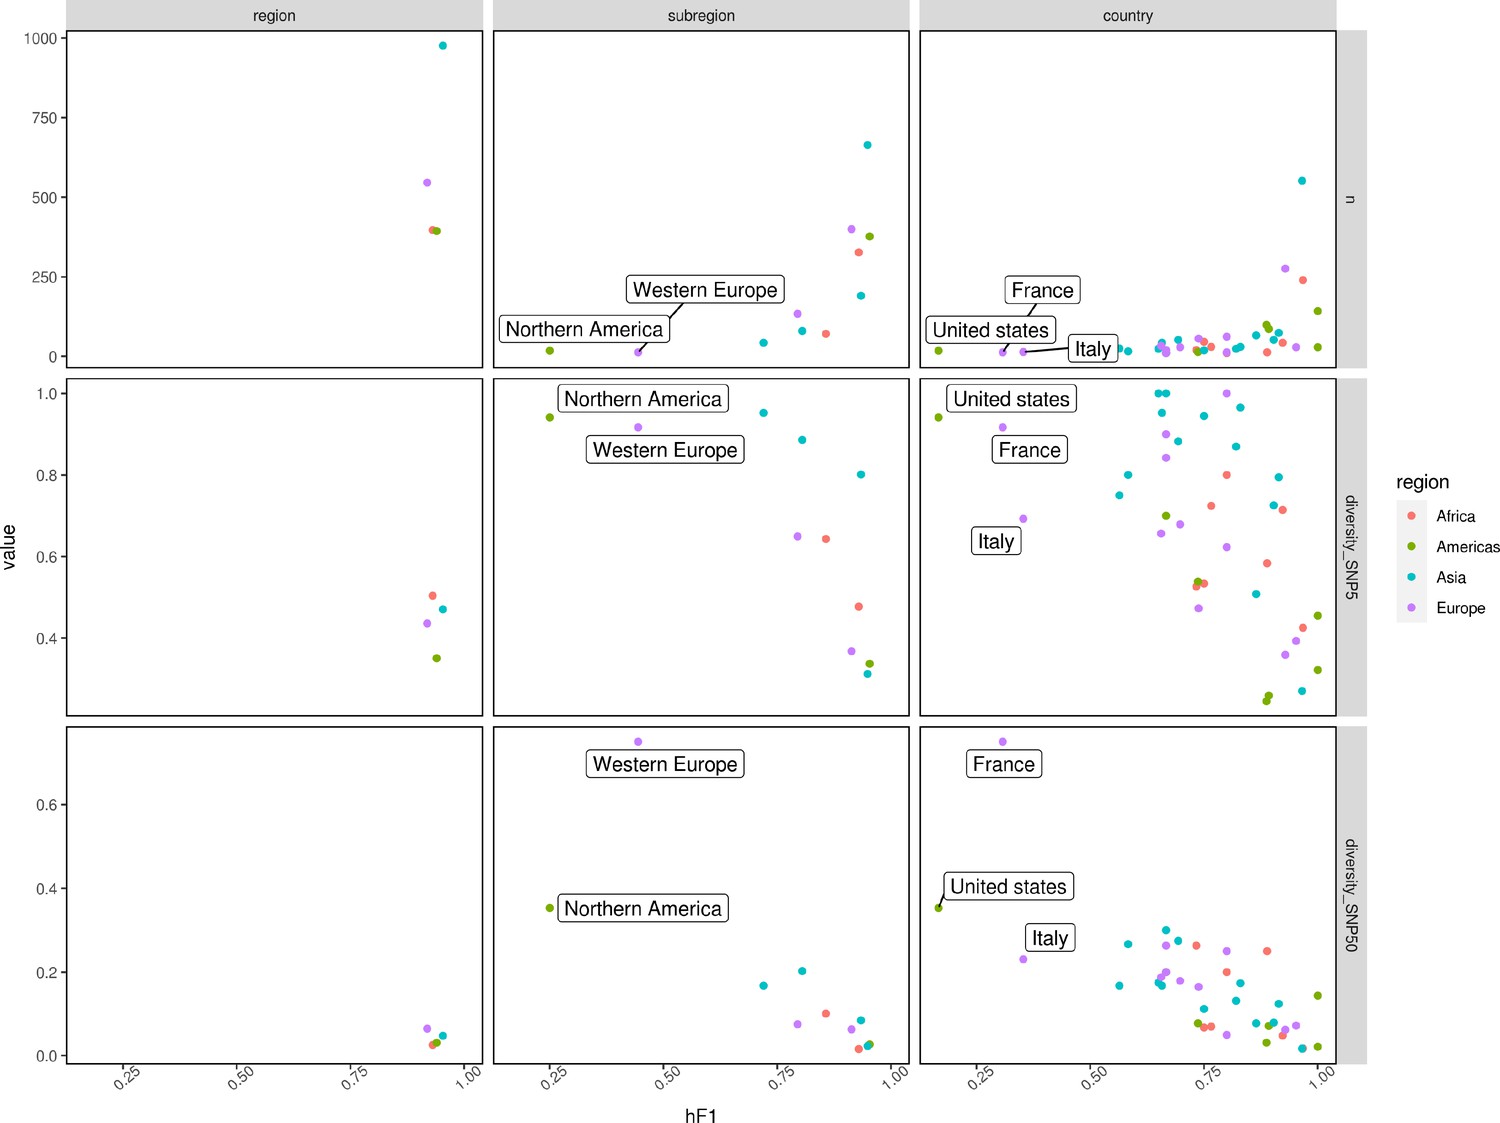
Scatter plots summarizing hF1 score (x-axis) vs. the number of samples/genomic diversity at SNP5/genomic diversity at SNP50 (y-axis – top/middle/bottom).
Genomic diversity was calculated by dividing the number of single linkage clusters at SNP5/SNP50 (single nucleotide polymorphism (SNP) Address) by the total number of samples per class. Points were colored according to the region (Africa: red, Americas: green, Asia: blue, Europe: purple).
Figure 3—figure supplement 3
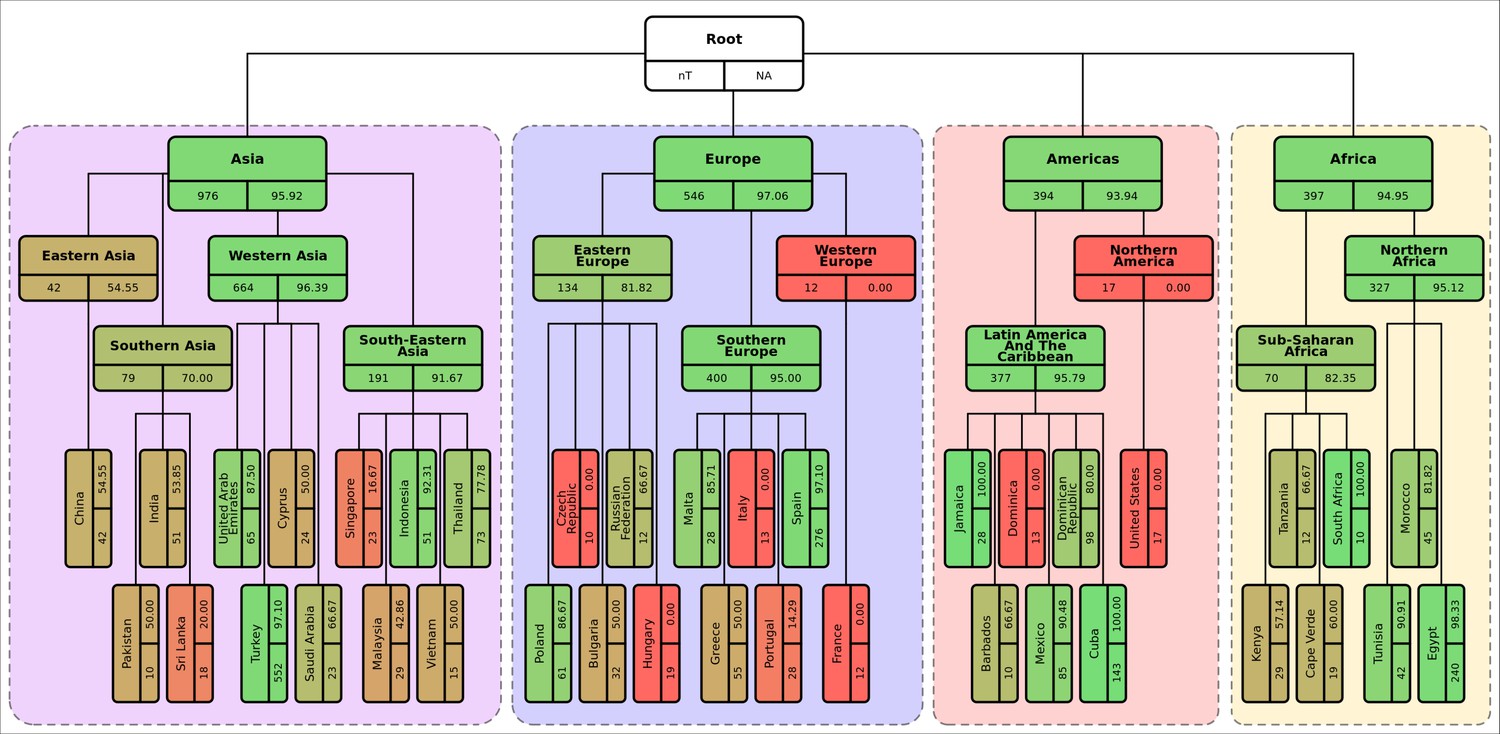
Diagrammatic representation of classification metrics of the hierarchical machine learning (hML) classifier applied to the S. Enteritidis test dataset showing % isolates correctly assigned per class.
Links between classes/nodes in the hierarchy are indicated by connecting lines. Boxes represent individual classes in the hML model and are colored by the % of isolates for that class that were correctly assigned to that class. The top panel of each class box displays the class label, the bottom left panel indicates the total number of samples for that class before the train/test split (75%/25%) and the bottom right panel shows the class % correctly assigned as calculated from the test dataset. Classes within individual ‘regions’ (continents) were contained in a colored background panel.
Figure 4
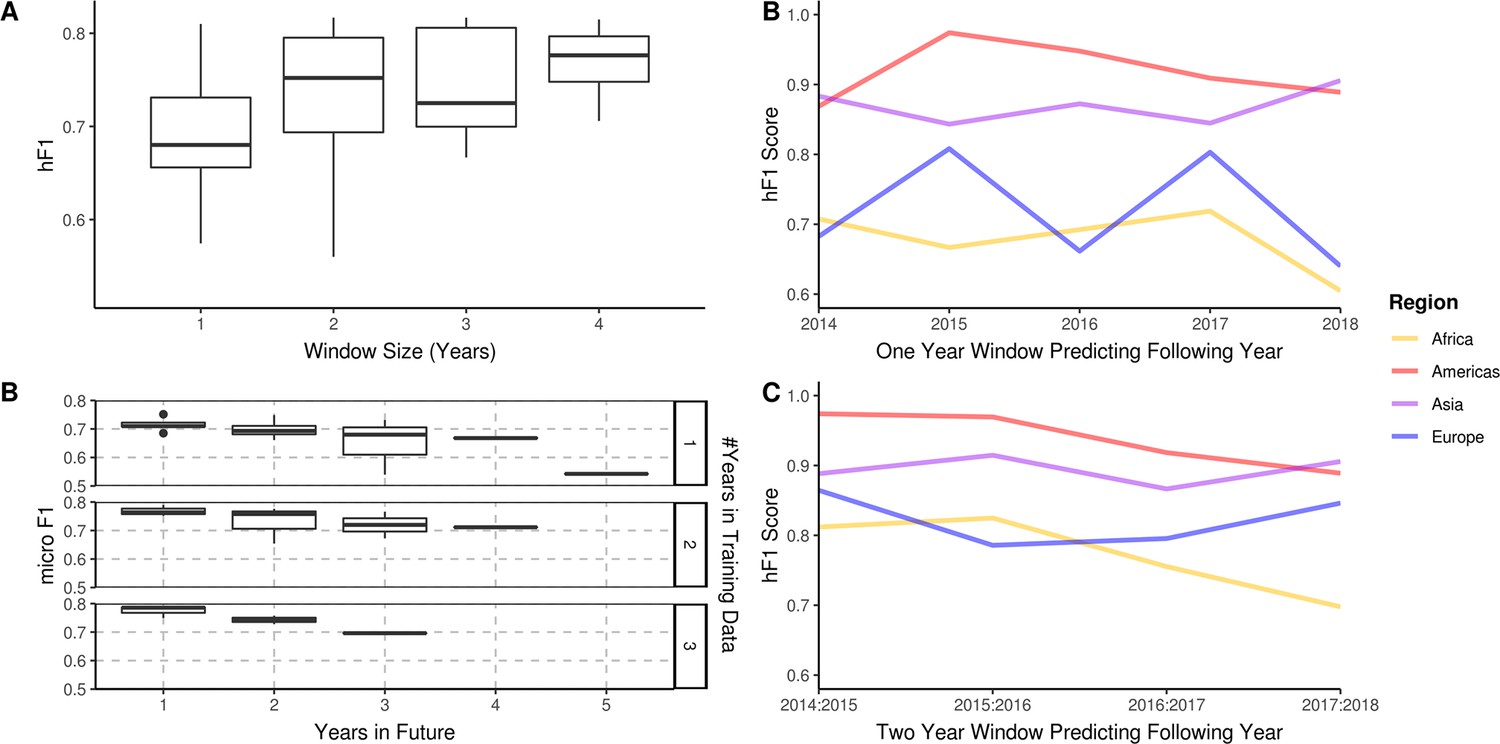
A longitudinal analysis of the predictive performance of hierarchical machine learning (hML) models on 2,313 S. Enteritidis samples.
(A) The hF1 scores of hML Random Forest (RF) models trained on a subset of samples from a 1–4 year moving window predicting the following year. (B) The micro F1 scores of hML RF models trained on a subset of samples from a 1–3 year moving window predicting 1–5 years into the future. (C) Regional hF1 scores of hML RF models trained on one-year sampling windows predicting the following year. (D) Regional hF1 scores of hierarchical models trained on two-year sample windows predicting the following year.
Figure 5 with 1 supplement
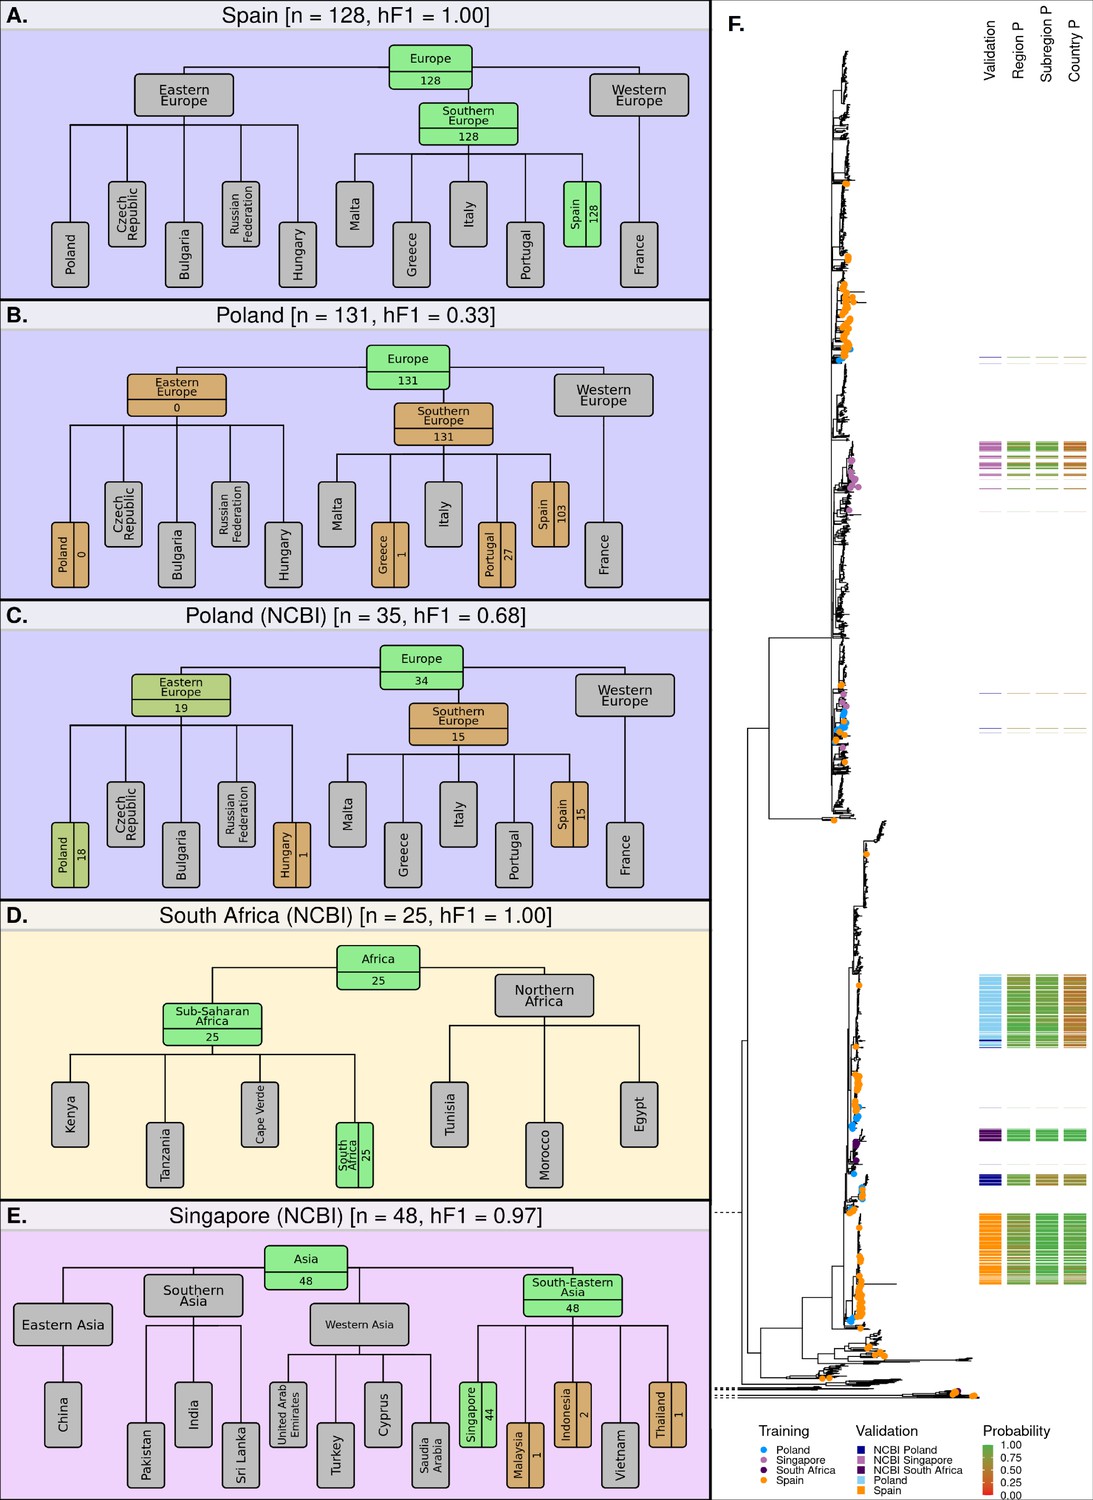
Classification summaries of the optimised hML model applied to five additional independent validation collections of S. Enteritidis genomes.
(A) 128 samples from an international outbreak that originated in Spain in 2015 (Inns et al., 2017). (B) 131 samples from a large-scale international outbreak that originated from Polish eggs between 2015–2018 (Pijnacker et al., 2019). (C) 35 samples from Poland were uploaded to the NCBI database between 2014–2019. (D) 25 samples from South Africa were uploaded to the NCBI database between 2014–2019 (Smith et al., 2020). (E) 48 samples from Singapore were uploaded to the NCBI database between 2014–2019 (Octavia et al., 2018). The number of samples assigned per class is indicated for classes relevant to the query dataset. Class boxes are colored by the proportion of correctly/incorrectly classified samples (correct: green, incorrect: red). (F) Maximum-likelihood phylogenetic tree of S. Enteritidis isolates from the training, test, and validation datasets. Validation dataset isolates are displayed as a colored bar alongside the p-value of the model predictions for associated region, subregion, and country class. Colored tree tips represent the training isolates from the four countries tested across the validation datasets.
Figure 5—figure supplement 1
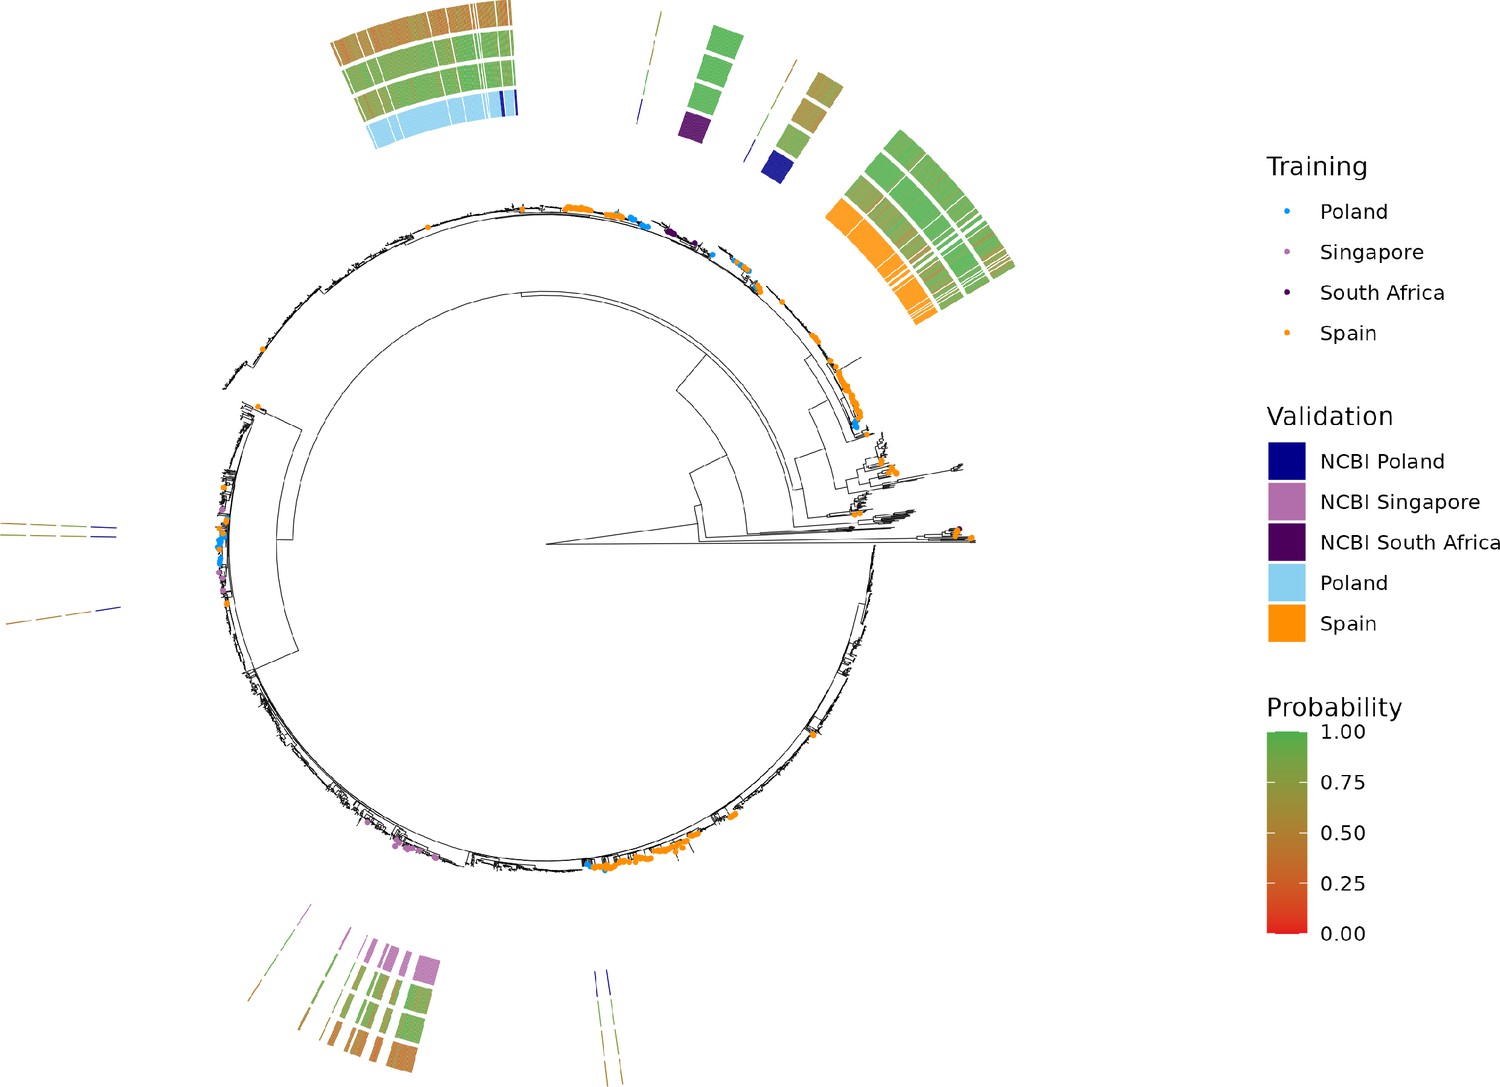
Maximum-likelihood phylogenetic tree of S. Enteritidis isolates from the training, test, and validation datasets.
Validation dataset isolates are displayed as a colored bar alongside the p-value of the model predictions for the associated region, subregion, and country class. Colored tree tips represent the training isolates from the four countries tested across the validation datasets. Supplementary file 1A. Summary statistics for a ‘flat’ Random Forest multi-class classifier. The classier was trained and tested using a 75–25% split using the same random seed as was used for the hierarchical machine learning (hML) classifier. The dataset was randomly oversampled to address the class imbalance. Country classes from the hML model were used as labels (i.e. region/subregion were excluded).
Additional files
-
Supplementary file 1
Supplementary Tables.
(A) Summary of S. Enteritidis isolates collected by the UKHSA from UK clinical patients who recently reported foreign travel to 38 individual country classes. Each panel contains a bar chart of isolate counts per year per country class. (B) Summary of the all-vs-all comparison of classifier vs resampler models used to identify the most suitable combinations for feature selection and additional optimization. The implemented resampling schemes included downsampling (smallest class), upsampling (largest class), resampling to the mean count of all classes, and hierarchically aware implementation for the previously described samplers. Hierarchically aware resampling was developed using in-house scripts to iteratively apply a resampler to each of the lowest levels of the hierarchy (country) before passing the resampled data to higher levels in the hierarchy for further resampling. Abbreviations; RF: Random Forest, KNN: K Nearest Neighbour, SVM: Support Vector Machine, GNB: Gaussian Naïve Bayes, and XGB: Xtreme Gradient Boosting. (C) The 2313 Salmonella Enteritidis sample collection was used for training and testing of the hML classifier presented in the main manuscript. All samples were collected by the UKHSA as a part of their genomic surveillance initiative. Recently recorded travel was collected as a part of the UKHSA’s ‘enhanced surveillance’ program. The columns include: SRA accession code, receipt date of isolate, SNP Address, reported country of travel, subregion, and region that the country lies within based on the UN M49 Standard for regional codes. (D) Validation dataset genomic collection and associated metadata.
- https://cdn.elifesciences.org/articles/84167/elife-84167-supp1-v2.xlsx
-
MDAR checklist
- https://cdn.elifesciences.org/articles/84167/elife-84167-mdarchecklist1-v2.pdf
Download links
A two-part list of links to download the article, or parts of the article, in various formats.
Downloads (link to download the article as PDF)
Open citations (links to open the citations from this article in various online reference manager services)
Cite this article (links to download the citations from this article in formats compatible with various reference manager tools)
Rapid geographical source attribution of Salmonella enterica serovar Enteritidis genomes using hierarchical machine learning
eLife 12:e84167.
https://doi.org/10.7554/eLife.84167


