Mechanotransduction events at the physiological site of touch detection
- Department of Cellular and Molecular Physiology, Yale University School of Medicine, United States
- Department of Neuroscience, Yale University School of Medicine, United States
- Program in Cellular Neuroscience, Neurodegeneration and Repair, Yale University School of Medicine, United States
- Kavli Institute for Neuroscience, Yale University School of Medicine, United States
Figures
Figure 1
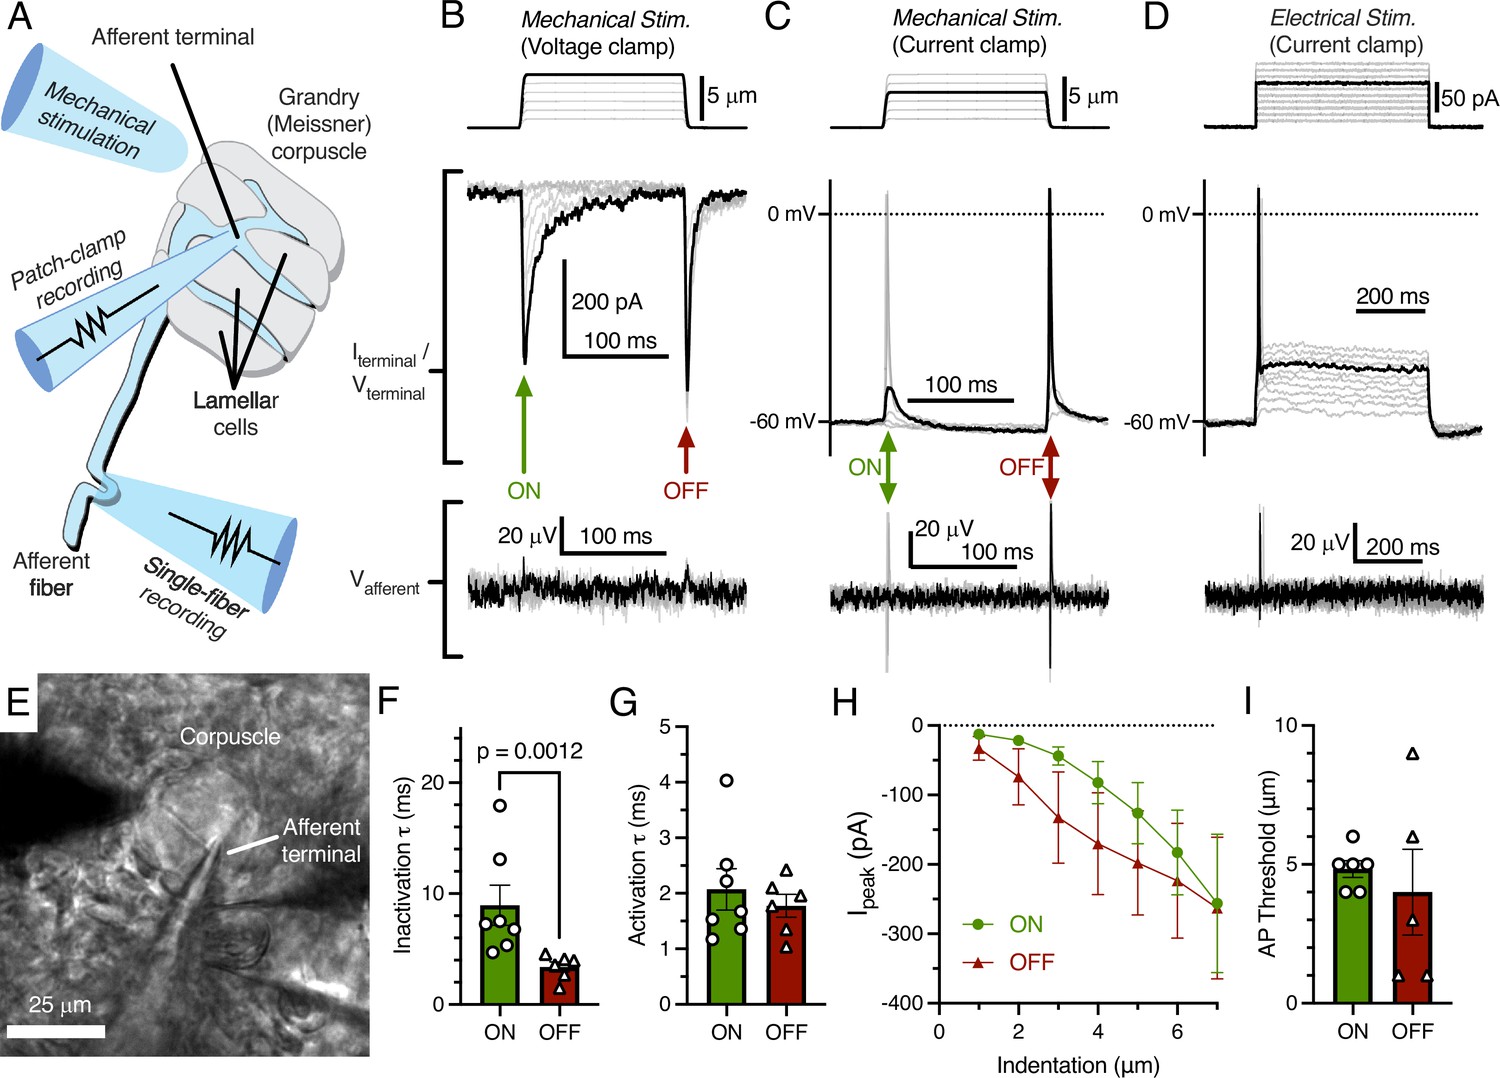
Mechanotransduction in the afferent terminal of the Grandry (Meissner) corpuscle.
(A) Illustrated representation of the experimental setup. (B) The mechanical step stimulus applied with a glass probe (top), representative mechanically activated (MA) current responses in the terminal while voltage-clamped at –60 mV (middle), and simultaneous extracellular voltage signal from the connected afferent (bottom). (C) The mechanical stimulus (top), voltage responses and action potentials (APs) in the terminal in current-clamp (middle), and APs measured further along the afferent (bottom). (D) The current injection stimulus (top), voltage responses and action potentials in the terminal in current-clamp (middle), and APs measured in the afferent (bottom). (E) Example bright-field image of the experimental setup. (F) Quantification of the kinetics of MA current inactivation, (G) activation, (H) peak MA current-indentation relationship (n=7/6 afferent terminals for onset [ON]/offset [OFF], respectively), and (I) AP threshold measured in the dynamic ON phase of the stimulus and the dynamic OFF phase of the stimulus. Only the difference in inactivation τ between the ON and OFF phase was statistically significant (p<0.05). Statistics: Mann-Whitney U test (F, G, and I) or two-way ANOVA (H). Symbols indicate data from individual cells. Data in F–I were obtained from at least three independent skin preparations and shown as mean ± SEM.
-
Figure 1—source data 1
Original data for Figure 1F–I.
- https://cdn.elifesciences.org/articles/84179/elife-84179-fig1-data1-v2.xlsx
Figure 2
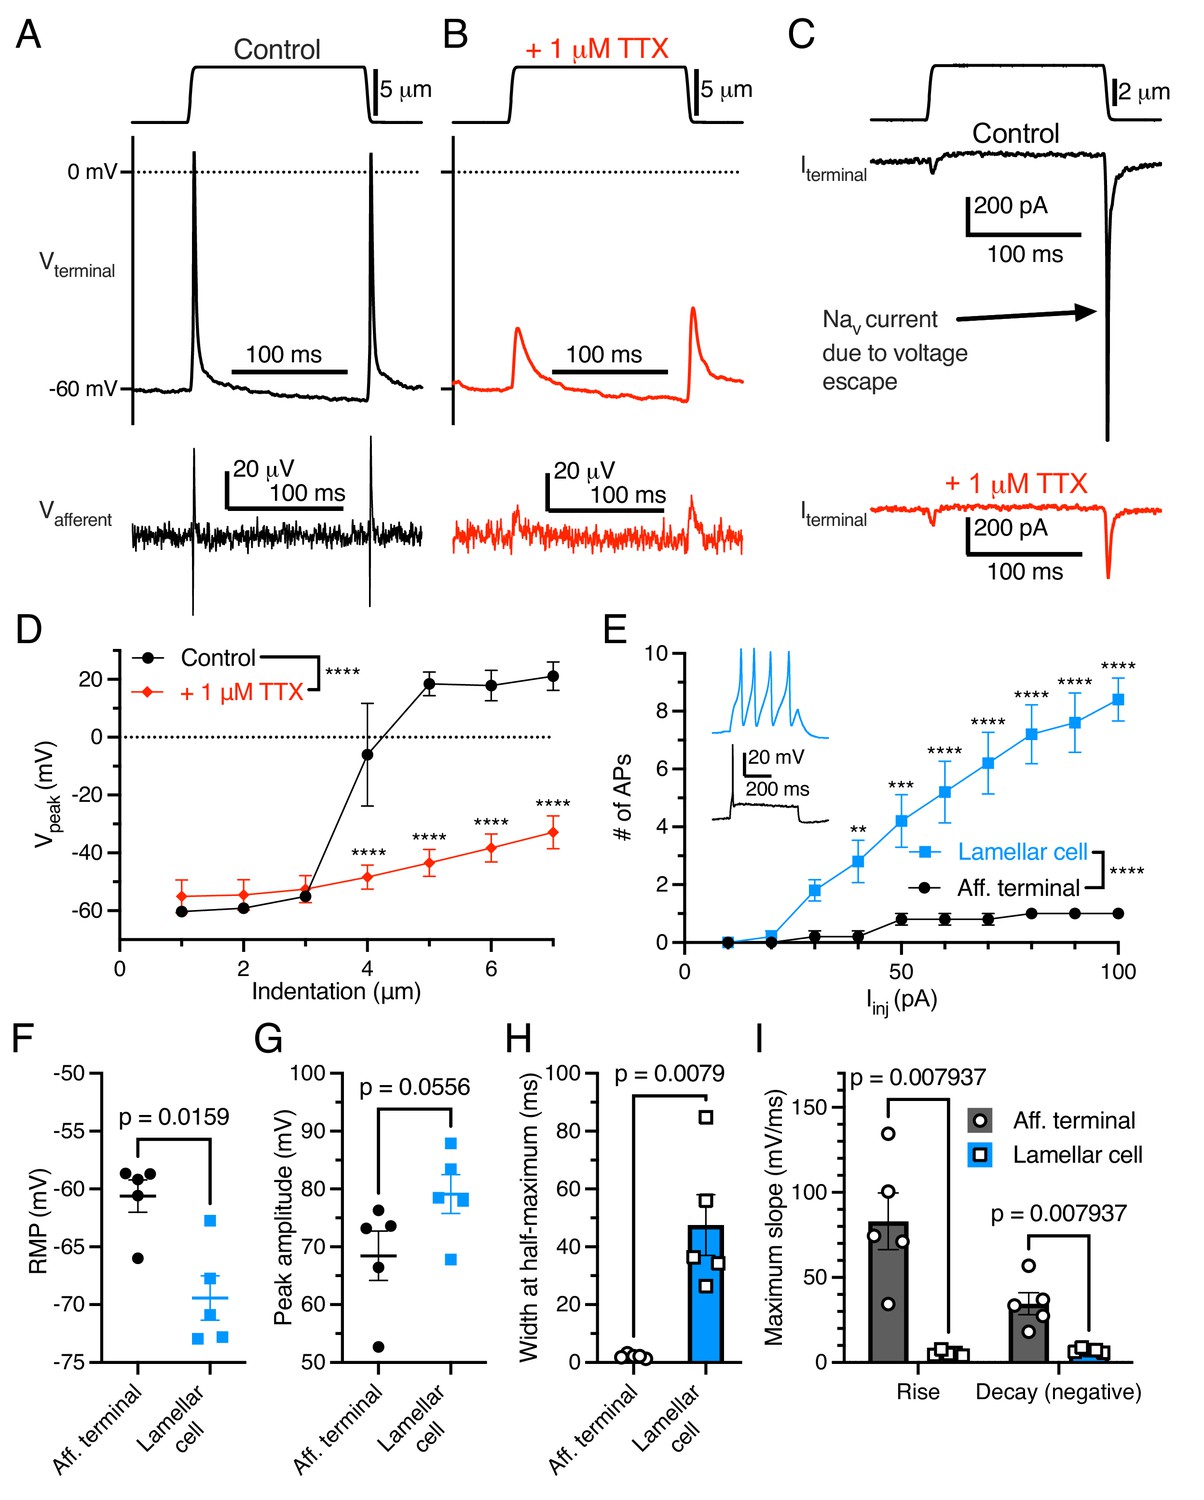
Electrogenic events in mechanoreceptor terminal and lamellar cells are carried out by different mechanisms.
(A) A suprathreshold mechanical stimulus (top), action potentials (APs) in the terminal (middle), and propagated APs from the connected afferent (bottom). (B) A suprathreshold mechanical stimulus applied in 1 μM tetrodotoxin (TTX; top), AP-absent voltage responses in the terminal in current-clamp (middle), and extracellular receptor potentials in the afferent (bottom). (C) A suprathreshold mechanical stimulus (top), current responses in the terminal while voltage-clamped at –60 mV without 1 μM TTX (middle), and with 1 μM TTX (bottom). (D) Voltage-indentation relationship in the absence or presence of 1 μM TTX (n=5 for each group). (E) The number of APs from increasing current injections in lamellar cells and afferent terminals (n=5 for each group). Inset shows exemplar action potentials from a lamellar cell (blue) and afferent (black). (F) Resting membrane potential (RMP), (G) peak AP amplitude, (H) AP width at the half-maximum, and (I) the maximum slope of the AP rise or decay in the afferent terminal versus lamellar cells of the corpuscle. The AP-current injection relationship, RMP, width at half-maximum, max rise slope, and max decay slope were significantly different between the afferent terminal and lamellar cells (p<0.05). Statistics: Mann-Whitney U test (F–I) or two-way ANOVA with Holm-Sidak post-hoc test (D and E). **p=0.0084, ***p=0.0004, ****p<0.0001. Symbols indicate data from individual cells. Data in D–I were obtained from at least three independent skin preparations and shown as mean ± SEM.
-
Figure 2—source data 1
Original data for Figure 2D–I.
- https://cdn.elifesciences.org/articles/84179/elife-84179-fig2-data1-v2.xlsx
Tables
Key resources table
| Reagent type (species) or resource | Designation | Source or reference | Identifiers | Additional information |
|---|---|---|---|---|
| Biological sample | Duck bill skin (Anas platyrhynchos domesticus) | Metzer Farms | Embryonic day E25-E27, Sex undetermined | |
| Software and algorithm | pClamp 10 | Molecular Devices | RRID: SCR_011323 | |
| Software and algorithm | GraphPad Prism 9.4.1 | GraphPad Software, LLC | RRID: SCR_002798 |
Additional files
Download links
A two-part list of links to download the article, or parts of the article, in various formats.
Downloads (link to download the article as PDF)
Open citations (links to open the citations from this article in various online reference manager services)
Cite this article (links to download the citations from this article in formats compatible with various reference manager tools)
Mechanotransduction events at the physiological site of touch detection
eLife 12:e84179.
https://doi.org/10.7554/eLife.84179


